


Effect of Hypotension and Dobutamine on Gastrointestinal Microcirculations of Healthy, Anesthetized Horses
 ,
,
Abstract
:Simple Summary
Abstract
1. Introduction
2. Materials and Methods
2.1. Animals, Anesthesia and Monitoring
2.2. Dark Field Microscopy Image Acquisition
2.3. Measurement of Microvascular Perfusion Indices
2.4. Data Analysis
3. Results
4. Discussion
5. Conclusions
Author Contributions
Funding
Institutional Review Board Statement
Informed Consent Statement
Data Availability Statement
Conflicts of Interest
References
- Bottoms, G.D.; Fessler, J.F.; Roesel, O.F.; Moore, A.B.; Frauenfelder, H.C. Endotoxin-induced hemodynamic changes in ponies: Effects of flunixin meglumine. Am. J. Vet. Res. 1981, 42, 1514–1518. [Google Scholar]
- Burrows, E.G. Hemodynamic alterations in the anesthetized pony produced by slow intravenous administration of Escherichia coli endotoxin. Am. J. Vet. Res. 1970, 31, 1975–1982. [Google Scholar] [PubMed]
- Steffey, E.P.; Howland, D. Cardiovascular effects of halothane in the horse. Am. J. Vet. Res. 1978, 39, 611–615. [Google Scholar] [PubMed]
- Mitchell, K.; Schoster, A. Chapter 1: Shock: Pathophysiology, Diagnosis, Treatment, Physiologic Response to Trauma. In Equine Surgery, 5th ed.; Auer, J., Stick, J., Eds.; Saunders: St. Louis, MO, USA, 2019; pp. 1–14. [Google Scholar]
- Muir, W.W.; Wade, A.; Grospitch, B. Automatic noninvasive sphygmomanometry in horses. J. Am. Vet. Med. Assoc. 1983, 11, 1230–1233. [Google Scholar]
- Hallowell, G.D.; Lethbridge, K.; Croxford, A. Assessment and reliability of measuring microvascular perfusion in normal adult conscious horses. J. Vet. Intern. Med. 2013, 27, 648–649. [Google Scholar]
- Hurcombe, S.D.; Welch, B.R.; Williams, J.M.; Cooper, E.S.; Russell, D.; Mudge, M.C. Dark-field microscopy in the assessment of large colon microperfusion and mucosal injury in naturally occurring surgical disease of the equine large colon. Equine Vet. J. 2014, 46, 674–680. [Google Scholar] [CrossRef]
- Peruski, A.M.; Cooper, E.S. Assessment of microcirculatory changes by use of sidestream dark field microscopy during hemorrhagic shock in dogs. Am. J. Vet. Res. 2011, 72, 438–445. [Google Scholar] [CrossRef]
- Silverstein, D.C.; Pruett-Saratan, I.I.A.; Drobatz, K.J. Measurements of microvascular perfusion in healthy anesthetized dogs using orthogonal polarization spectral imaging. J. Vet. Emerg. Crit. Care 2009, 19, 579–587. [Google Scholar] [CrossRef] [PubMed]
- Saltzman, D.J.; Menger, M.D.; Messmer, K.; Rose, R.; Kheirabadi, B.S.; Klemcke, H.G.; Cabrales, P.; Meng, F.; Acharya, S.A.; Golub, A.S.; et al. Systemic and subcutaneous microvascular Po2 dissociation during 4-h hemorrhagic shock in conscious hamsters. Am. J. Physiol. Circ. Physiol. 1996, 270, 827–836. [Google Scholar] [CrossRef]
- Boerma, E.C.; Kuiper, M.A.; Kingma, W.P.; Egbers, P.H.; Gerritsen, R.T.; Ince, C. Disparity between skin perfusion and sublingual microcirculatory alterations in severe sepsis and septic shock: A prospective observational study. Intensiv. Care Med. 2008, 34, 1294–1298. [Google Scholar] [CrossRef]
- Boerma, E.C.; van der Voort, P.H.J.; Spronk, P.E.; Ince, C. Relationship between sublingual and intestinal microcirculatory perfusion in patients with abdominal sepsis. Crit. Care Med. 2007, 35, 1055–1060. [Google Scholar] [CrossRef] [PubMed]
- Goodnight, M.E.; Cooper, E.S.; Butler, A.L. Assessment of microcirculatory perfusion in healthy anesthetized cats undergoing ovariohysterectomy using sidestream dark field microscopy. J. Vet. Emerg. Crit. Care 2015, 25, 349–357. [Google Scholar] [CrossRef] [PubMed]
- Petersen, S.M.; Greisen, G.; Hyttel-Sorensen, S.; Hahn, G.H. Sidestream dark field images of the microcirculation: Intra-observer reliability and correlation between two semi-quantitative methods for determining flow. BMC Med. Imaging 2014, 14, 14. [Google Scholar] [CrossRef]
- Kieffer, P.J.; Williams, J.M.; Shepard, M.K.; Giguère, S.; Epstein, K.L. Comparison of the oral and rectal mucosal and colonic serosal microcirculations of healthy, anesthetized horses. Can. J. Vet. Res. 2018, 82, 55–59. [Google Scholar] [PubMed]
- Mama, K.R. Chapter 22: Complications of Inhalation Anesthesia and Their Management. In Equine Surgery, 5th ed.; Auer, J., Stick, J., Eds.; Saunders: St. Louis, MO, USA, 2019; pp. 340–345. [Google Scholar]
- McConachie, E.; Barton, M.; Rapoport, G.; Giguère, S. Doppler and Volumetric Echocardiographic Methods for Cardiac Output Measurement in Standing Adult Horses. J. Vet. Intern. Med. 2013, 27, 324–330. [Google Scholar] [CrossRef] [PubMed]
- Linton, R.A.; Young, L.E.; Marlin, D.J.; Blissitt, K.J.; Brearley, J.C.; Jonas, M.M.; O’Brien, T.K.; Linton, N.W.; Band, D.M.; Hollingworth, C.; et al. Cardiac output measured by lithium dilution, thermodilution, and transesophageal Doppler echocardiography in anesthetized horses. Am. J. Vet. Res. 2000, 61, 731–737. [Google Scholar] [CrossRef] [PubMed]
- De Backer, D.; Hollenberg, S.; Boerma, C.; Goedhart, P.; Büchele, G.; Ospina-Tascon, G.; Dobbe, I.; Ince, C. How to evaluate the microcirculation: Report of a round table conference. Crit. Care 2007, 11, R101. [Google Scholar] [CrossRef]
- Bland, J.M.; Altman, D.G. Statistics notes: Calculating correlation coefficients with repeated observations: Part 1--correlation within subjects. BMJ 1995, 310, 446. [Google Scholar] [CrossRef]
- Steffey, E.P. Chapter 15: Inhalation Anesthetics and Gases. In Equine Anesthesia: Monitoring and Emergency Therapy, 2nd ed.; Muir, W.W., Hubbell, J.A.E., Eds.; Saunders: St. Louis, MO, USA, 2019; pp. 288–314. [Google Scholar]
- Dancker, C.; Hopster, K.; Rohn, K.; Kästner, S.B. Effects of dobutamine, dopamine, phenylephrine and noradrenaline on systemic haemodynamics and intestinal perfusion in isoflurane anaesthetized horses. Equine Vet. J. 2018, 50, 104–110. [Google Scholar] [CrossRef]
- Yamashita, K.; Tsubakishita, S.; Futaoka, S.; Ueda, I.; Hamaguchi, H.; Seno, T.; Muir, W.W. Cardiovascular effects of medetomidine, detomidine and xylazine in horses. J. Vet. Med. Sci. 2000, 62, 1025–1032. [Google Scholar] [CrossRef]
- Wagner, A.E.; Muir, W.W.; Hinchcliff, K.W. Cardiovascular effects of xylazine and detomidine in horses. Am. J. Vet. Res. 1991, 52, 651–657. [Google Scholar] [CrossRef]
- Grosenbaugh, D.A.; Muir, W.W. Cardiorespiratory effects of sevoflurane, isoflurane, and halothane anesthesia in horses. Am. J. Vet. Res. 1998, 59, 101–106. [Google Scholar] [CrossRef]
- Sakr, Y.; Dubois, M.-J.; De Backer, D.; Creteur, J.; Vincent, J.-L. Persistent microcirculatory alterations are associated with organ failure and death in patients with septic shock. Crit. Care Med. 2004, 32, 1825–1831. [Google Scholar] [CrossRef] [PubMed]
- De Backer, D.; Creteur, J.; Preiser, J.-C.; Dubois, M.-J.; Vincent, J.-L. Microvascular Blood Flow Is Altered in Patients with Sepsis. Am. J. Respir. Crit. Care Med. 2002, 166, 98–104. [Google Scholar] [CrossRef] [PubMed]
- Jhanji, S.; Lee, C.; Watson, D.; Hinds, C.; Pearse, R.M. Microvascular flow and tissue oxygenation after major abdominal surgery: Association with post-operative complications. Intensiv. Care Med. 2009, 35, 671–677. [Google Scholar] [CrossRef] [PubMed]
- Ruiz, C.; Hernandez, G.; Godoy, C.; Downey, P.; Andresen, M.; Bruhn, A. Sublingual microcirculatory changes during high volume hemofiltration in hyperdynamic septic shock patients. Crit. Care 2010, 14, R170. [Google Scholar] [CrossRef]
- Boswell, S.A.; Scalea, T.M. Sublingual capnometry: An alternative to gastric tonometry for the management of shock resuscitation. AACN Clin. Issues 2003, 14, 176–184. [Google Scholar] [CrossRef]
- Olofsson, P.H.; Berg, S.; Ahn, H.C.; Brudin, L.H.; Vikström, T.; Johansson, K.J.M. Gastrointestinal microcirculation and cardiopulmonary function during experimentally increased intra-abdominal pressure. Crit. Care Med. 2009, 37, 230–239. [Google Scholar] [CrossRef]


| Normotension | Hypotension | Dobutamine | |
|---|---|---|---|
| Oral Mucosa | |||
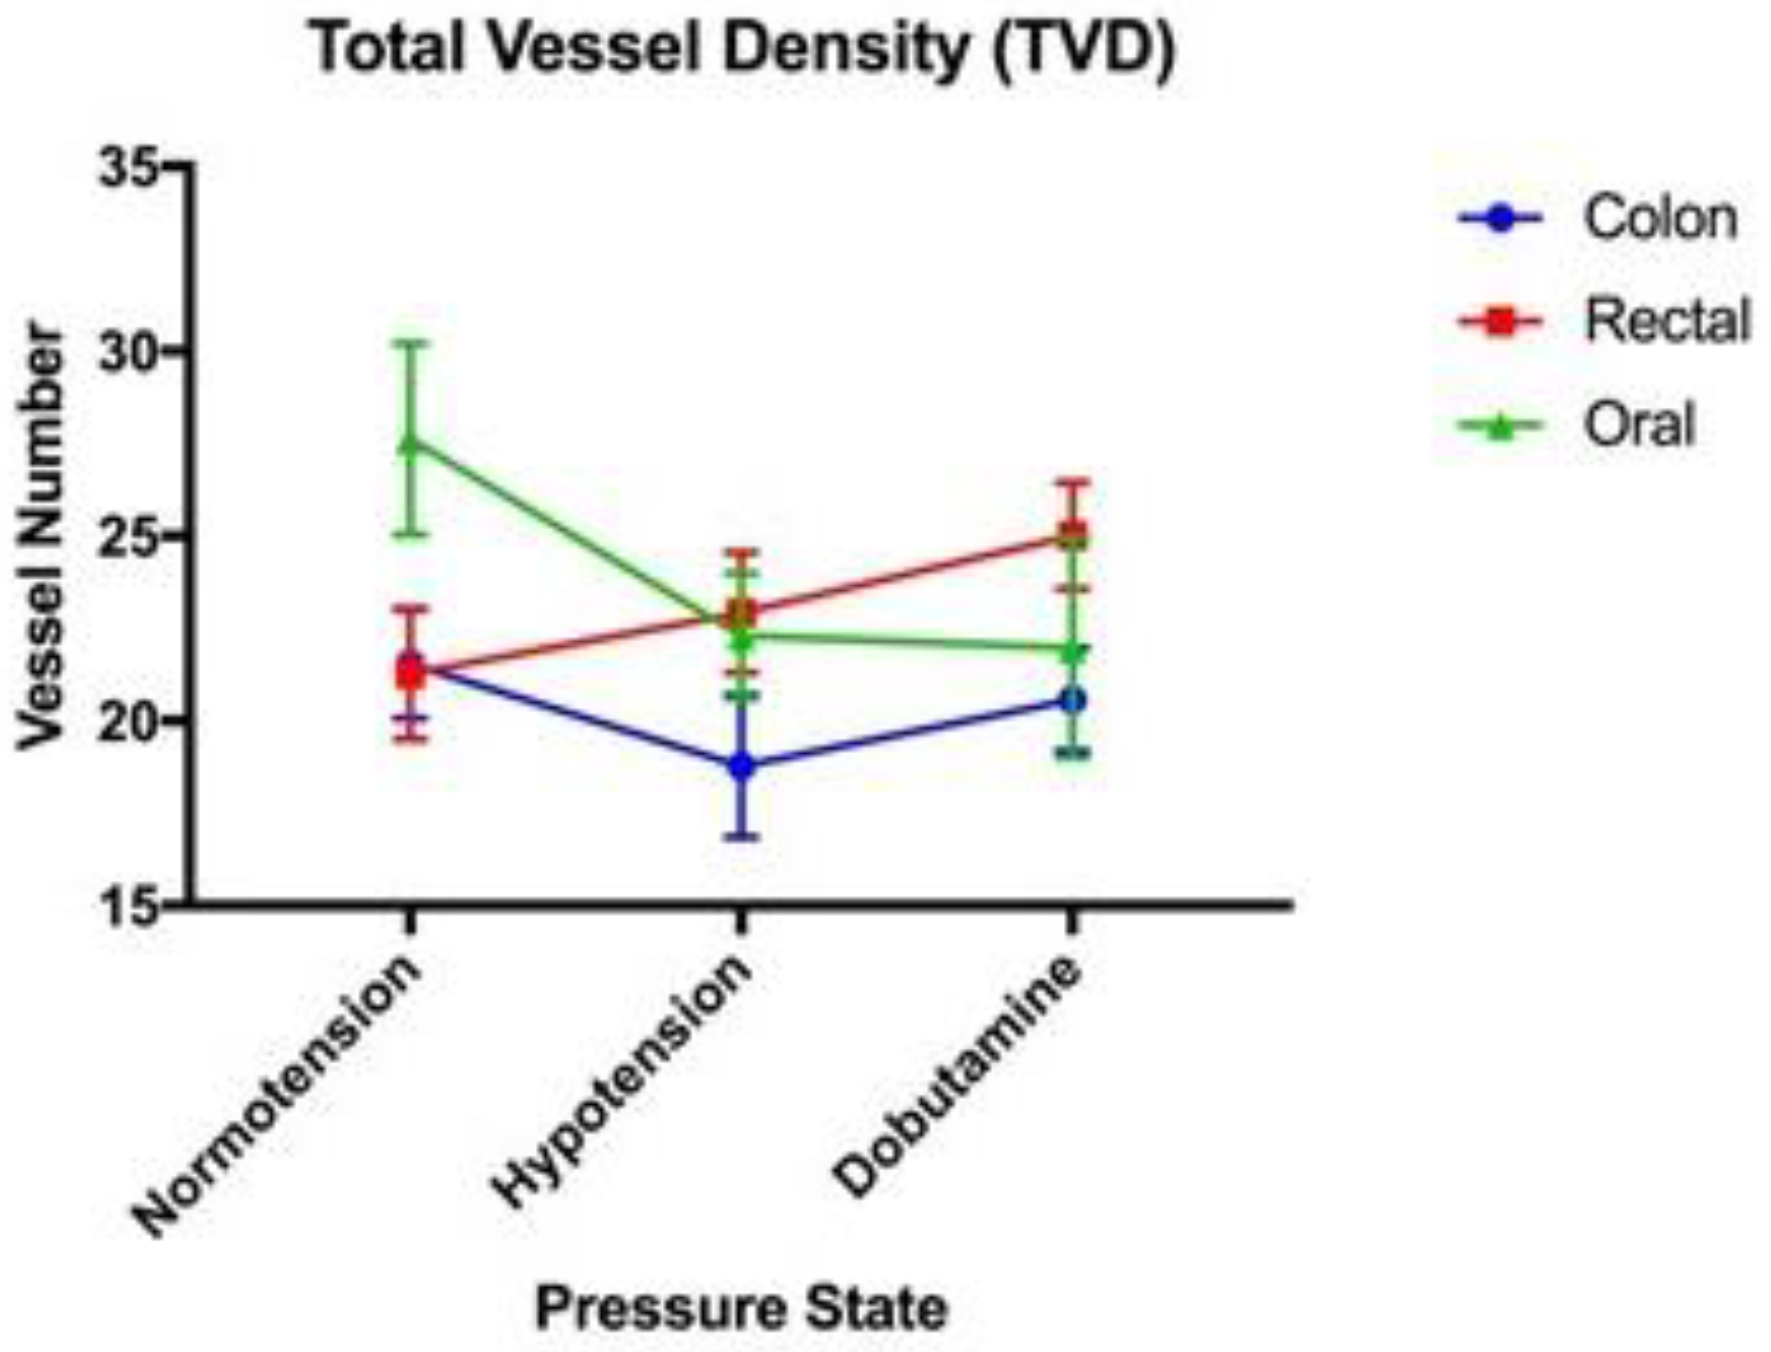
| TVD (mm/mm2) | 27.63 (+/−2.59) | 22.30 (+/−1.70) | 21.99 (+/−2.98) |
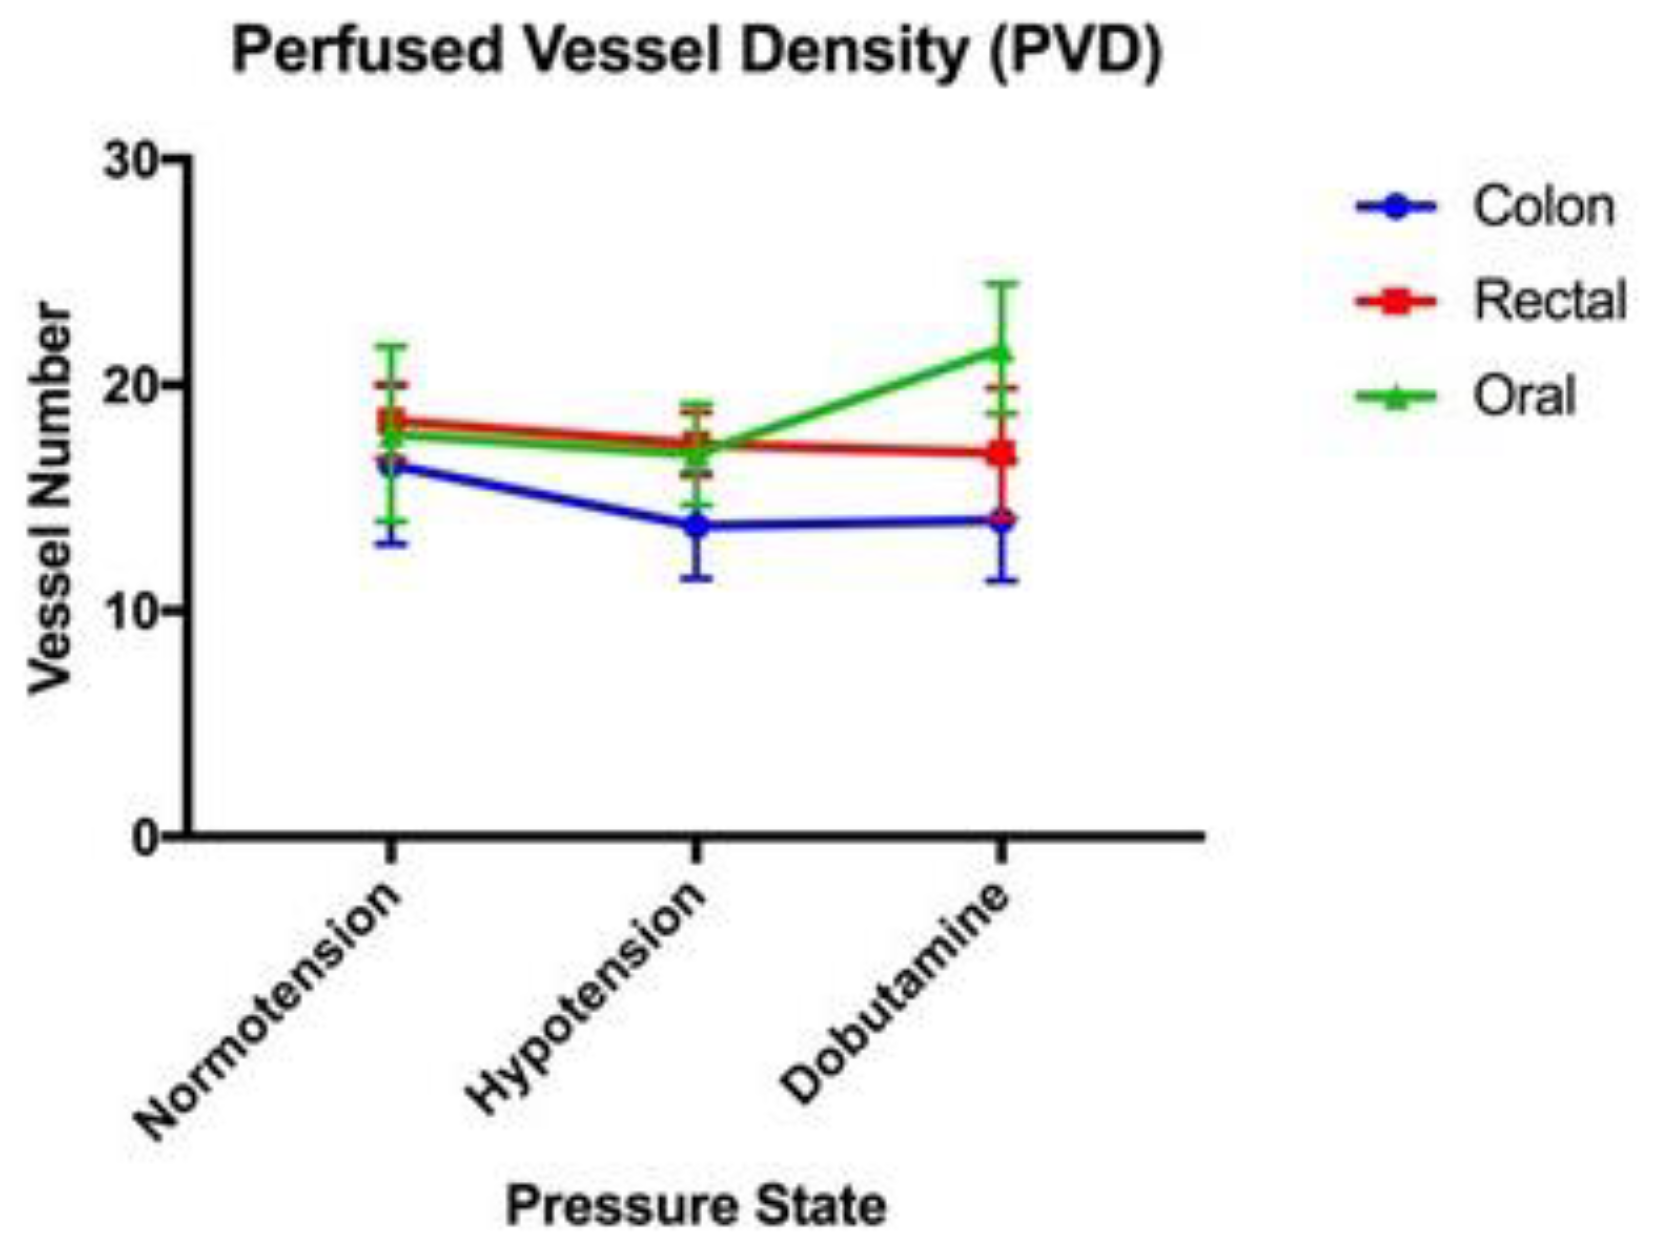
| PVD (mm/mm2) | 17.84 (+/−3.88) | 16.93 (+/−2.24) | 21.61 (+/−2.87) |
| PPV (%) | 68.38 (+/−13.10) | 74.70 (+/−6.95) | 98.52 (+/−0.97) |
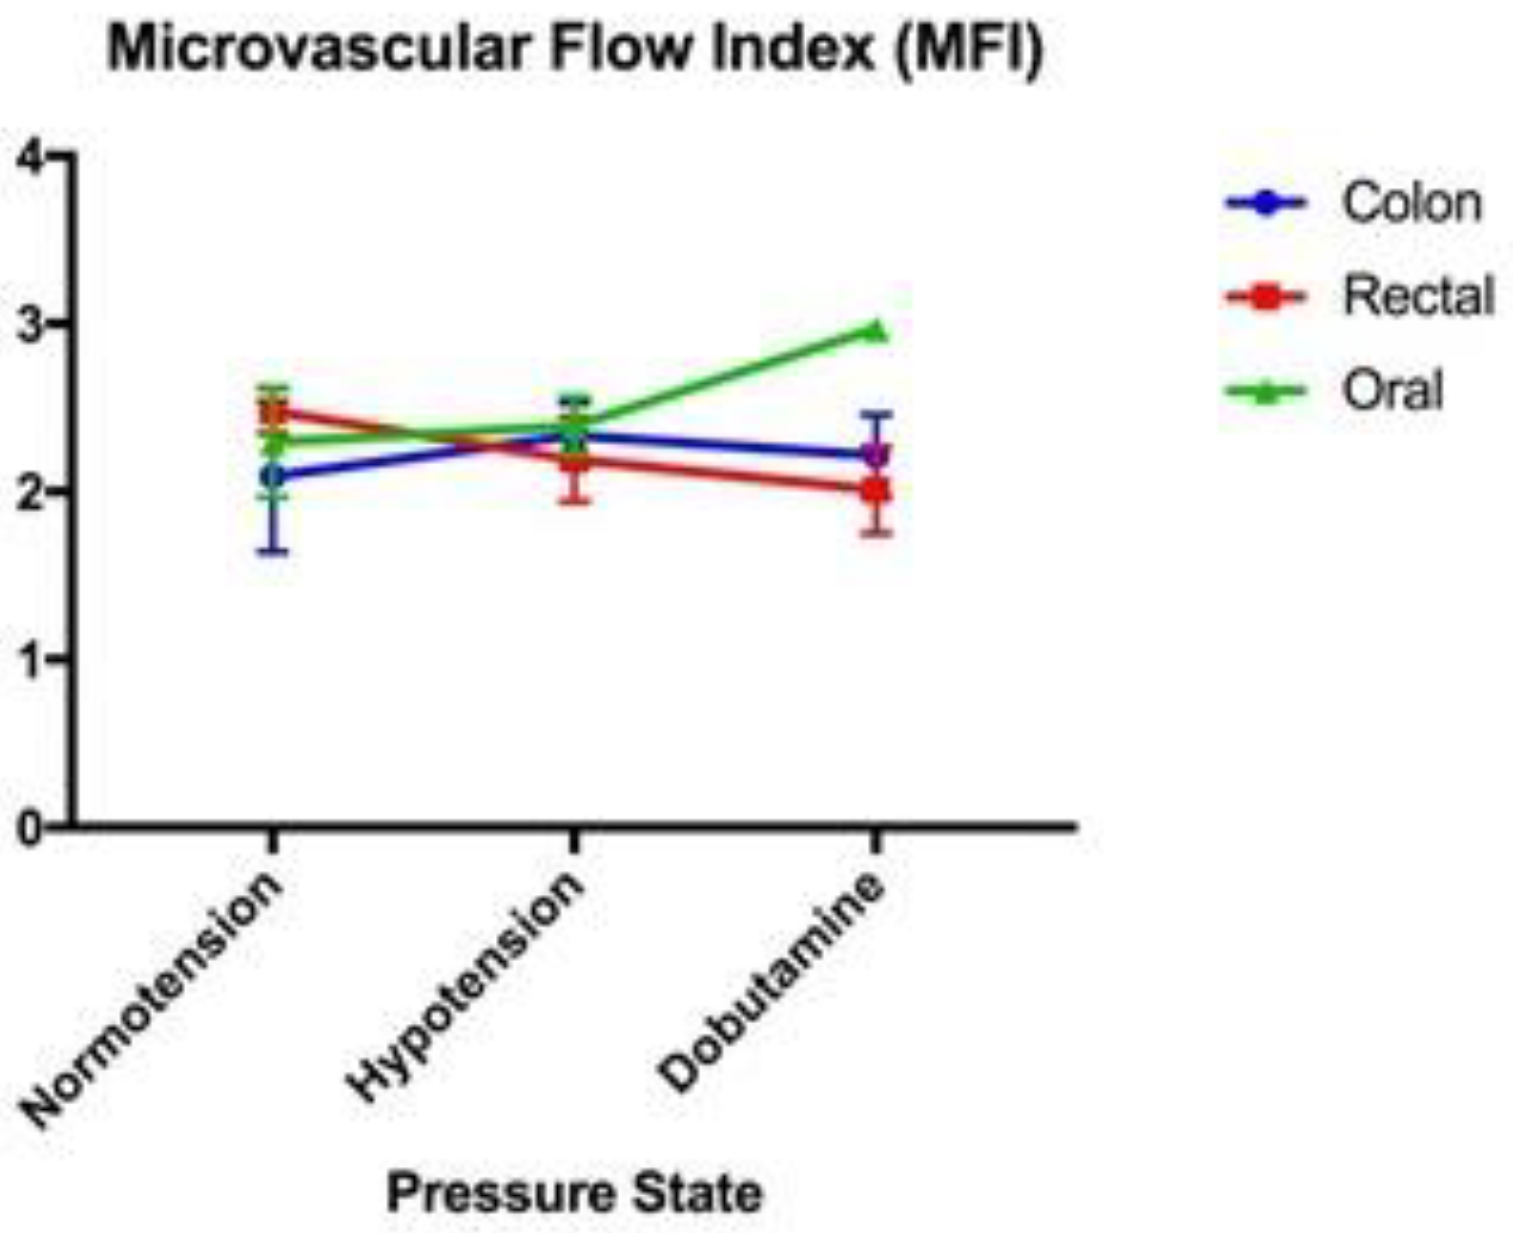
| MFI (units) | 2.30 (+/−0.33) | 2.39 (+/−0.17) | 2.97 (+/−0.07) |
| Colon Serosa | |||
| TVD (mm/mm2) | 21.55 (+/−1.48) | 18.79 (+/−1.93) | 20.58 (+/−1.39) |
| PVD (mm/mm2) | 16.47 (+/−3.50) | 13.76 (+/−2.32) | 14.00 (+/−2.67) |
| PPV (%) | 79.03 (+/−15.98) | 74.27 (+/−9.92) | 67.00 (+/−9.96) |
| MFI (units) | 2.09 (+/−0.45) | 2.33 (+/−0.19) | 2.21 (+/−0.25) |
| Rectal Mucosa | |||
| TVD (mm/mm2) | 21.28 (+/−1.78) | 22.94 (+/−1.63) | 25.02 (+/−1.45) |
| PVD (mm/mm2) | 18.42 (+/−1.65) | 17.38 (+/−1.40) | 17.00 (+/−2.88) |
| PPV (%) | 84.80 (+/−5.73) | 76.64 (+/−7.21) | 69.17 (+/−11.97) |
| MFI (units) | 2.48 (+/−0.13) | 2.19 (+/−0.25) | 2.01 (+/−0.26) |
| Comparison | Correlation Coefficient | p Value |
|---|---|---|
| Colon TVD vs. Oral TVD | 0.177 | 0.223 |
| Colon PVD vs. Oral PVD | 0.209 | 0.150 |
| Colon PPV vs. Oral PPV | −0.438 | 0.473 |
| Colon MFI vs. Oral MFI | −0.251 | 0.082 |
| Colon TVD vs. Rectal TVD | 0.114 | 0.436 |
| Colon PVD vs. Rectal PVD | 0.131 | 0.370 |
| Colon PPV vs. Rectal PPV | 0.007 | 0.961 |
| Colon MFI vs. Rectal MFI | −0.179 | 0.220 |
| Colon TVD vs. MAP | 0.361 | 0.225 |
| Colon PVD vs. MAP | −0.090 | 0.770 |
| Colon PPV vs. MAP | −0.133 | 0.666 |
| Colon MFI vs. MAP | −0.222 | 0.404 |
| Colon TVD vs. CI | 0.002 | 0.884 |
| Colon PVD vs. CI | 0.407 | 0.019 |
| Colon PPV vs. CI | 0.195 | 0.131 |
| Colon MFI vs. CI | 0.013 | 0.712 |
| Oral TVD vs. MAP | 0.033 | 0.553 |
| Oral PVD vs. MAP | 0.077 | 0.358 |
| Oral PPV vs. MAP | 0.053 | 0.449 |
| Oral MFI vs. MAP | 0.069 | 0.386 |
| Oral TVD vs. CI | 0.503 | 0.007 |
| Oral PVD vs. CI | 0.067 | 0.393 |
| Oral PPV vs. CI | 0.248 | 0.083 |
| Oral MFI vs. CI | 0.197 | 0.129 |
| Rectal TVD vs. MAP | 0.004 | 0.839 |
| Colon PVD vs. MAP | 0.036 | 0.535 |
| Rectal PPV vs. MAP | −0.005 | 0.814 |
| Rectal MFI vs. MAP | 0.003 | 0.866 |
| Rectal TVD vs. CI | −0.016 | 0.68 |
| Rectal PVD vs. CI | −0.001 | 0.938 |
| Rectal PPV vs. CI | 0.000 | 0.948 |
| Rectal MFI vs. CI | 0.013 | 0.71 |
Disclaimer/Publisher’s Note: The statements, opinions and data contained in all publications are solely those of the individual author(s) and contributor(s) and not of MDPI and/or the editor(s). MDPI and/or the editor(s) disclaim responsibility for any injury to people or property resulting from any ideas, methods, instructions or products referred to in the content. |
© 2024 by the authors. Licensee MDPI, Basel, Switzerland. This article is an open access article distributed under the terms and conditions of the Creative Commons Attribution (CC BY) license (https://creativecommons.org/licenses/by/4.0/).
Share and Cite
Kieffer, P.J.; Williams, J.M.; Shepard, M.K.; Giguère, S.; Epstein, K.L. Effect of Hypotension and Dobutamine on Gastrointestinal Microcirculations of Healthy, Anesthetized Horses. Vet. Sci. 2024, 11, 95. https://doi.org/10.3390/vetsci11020095
Kieffer PJ, Williams JM, Shepard MK, Giguère S, Epstein KL. Effect of Hypotension and Dobutamine on Gastrointestinal Microcirculations of Healthy, Anesthetized Horses. Veterinary Sciences. 2024; 11(2):95. https://doi.org/10.3390/vetsci11020095
Chicago/Turabian StyleKieffer, Philip J., Jarred M. Williams, Molly K. Shepard, Steeve Giguère, and Kira L. Epstein. 2024. "Effect of Hypotension and Dobutamine on Gastrointestinal Microcirculations of Healthy, Anesthetized Horses" Veterinary Sciences 11, no. 2: 95. https://doi.org/10.3390/vetsci11020095