GeMSyD: Generic Framework for Synthetic Data Generation


Computer Science Department, Technical University of Cluj Napoca, 400114 Cluj-Napoca, Romania
*
Author to whom correspondence should be addressed.
Data 2024, 9(1), 14; https://doi.org/10.3390/data9010014
Submission received: 30 November 2023
/
Revised: 1 January 2024
/
Accepted: 9 January 2024
/
Published: 11 January 2024
Abstract
:In the era of data-driven technologies, the need for diverse and high-quality datasets for training and testing machine learning models has become increasingly critical. In this article, we present a versatile methodology, the Generic Methodology for Constructing Synthetic Data Generation (GeMSyD), which addresses the challenge of synthetic data creation in the context of smart devices. GeMSyD provides a framework that enables the generation of synthetic datasets, aligning them closely with real-world data. To demonstrate the utility of GeMSyD, we instantiate the methodology by constructing a synthetic data generation framework tailored to the domain of event-based data modeling, specifically focusing on user interactions with smart devices. Our framework leverages GeMSyD to create synthetic datasets that faithfully emulate the dynamics of human–device interactions, including the temporal dependencies. Furthermore, we showcase how the synthetic data generated using our framework can serve as a valuable resource for machine learning practitioners. By employing these synthetic datasets, we perform a series of experiments to evaluate the performance of a neural-network-based prediction model in the domain of smart device interaction. Our results underscore the potential of synthetic data in facilitating model development and benchmarking.
1. Introduction
Recent years are considered to be one of the periods of the greatest growth of technology. This expansion of technology, together with the invention of smart devices, has resulted in a constantly growing trend of creation and consumption of data. The reduced costs of data storage are also a powerful enabler towards the storing, processing, and extracting of relevant knowledge from data.
Smart devices are equipped with sensors that measure different characteristics of both the appliance and the surroundings where the appliance is deployed. Events generated from the interaction of the user with the appliance are also captured and recorded. Most of the time, these measurements are transmitted via the Internet in data lakes owned by the smart appliance producers. These data lakes contain large amounts of such measurements and events.
In this context, a research goal of processing this type of data and extracting useful information from it has been defined in both the academic and industrial worlds. The knowledge inference process entails many other pragmatic sub-tasks, such as predictive maintenance and fault detection [1,2], and the identification of usage patterns and user profiling [3,4]. The inference of usage patterns, together with user profiling, represent powerful methods of implementing data-driven decision-making. In a data-driven decision approach, facts and statistics are used to guide the direction of future strategies, which brings benefits such as product innovation, customer retention, and informed decisions.
Nowadays, home appliances are also smart devices that produce data. The abundance of data originating from these appliances underscores the crucial need for sophisticated software tools. Developing models and learning techniques capable of extracting pertinent information from these data becomes imperative, emphasizing the invaluable utility of such software. However, research and experiments on such data can be restricted by the confidentiality of the data. Data generated by smart appliances is owned and stored by the appliance producers and accessing this data can be hard (even if the purpose is research-oriented). Confidentiality contracts and restrictions are imposed by data owners in such cases, which can take a long time to obtain. Regulations about data transfer and GDPR compliance also contribute to the restricted access of researchers to such types of data.
Having a mechanism for generating synthetic data that has the same characteristics as those of real-world data represents an enabler for research in the domain. Synthetic data can be generated with the same complexities as real-world data without exposing sensitive information and without compromising the proprietary information of the data owner or appliance user.
The availability of synthetic data also encourages the rapid development of proof-of-concept learning models and is a good mechanism for benchmarking different learning approaches (many competitions have synthetic data as benchmarking mechanisms). In this way, the information extraction systems can be developed and tested prior to obtaining the real-world data, which, most of the time, is in the form of Big Data and comes with its own complexities.
The problem of data access is seen in many fields. In [5], it is shown how the lack of data can lead to delays and cancellations of research projects in the context of using artificial intelligence in drug development, an important topic in the healthcare system.
A framework for generating synthetic data needs to be flexible in what concerns the volume of data that can be generated. The framework should be capable of producing large volumes of data for cases when the focus of the research is tackling the complexity of the data, reflecting the volume. On the other hand, the same framework should be capable of generating small snapshots of data for cases when the focus is on building processing prototypes. In this setup, stages such as preprocessing the real-world data can be postponed until it is proven with a prototype that a certain strategy might work. Skipping the preprocessing step is a huge win because real-world data can come with numerous complexities that need to be tackled. For example in [6], we propose preprocessing strategies for real-world data obtained from home appliances, and it is shown how complex this step can be, including reconstructing the running cycles, structuring the data, and syntactic cleaning.
Another important aspect of synthetic data is its availability. Making the generating system or the synthetic data public is a step forward in the direction of offering the same opportunities for the researchers. In a context where data is expensive, researchers and institutions with limited funds can be at a disadvantage. Even if the primary goal of using synthetic data is to avoid the accidental disclosure of information, this secondary aspect represents an important benefit.
This work represents a pioneering contribution to the research domain of synthetic data generation, introducing a general methodology for the creation of synthetic data. We not only offer a versatile framework but also alleviate the burden on users by providing a readily deployable solution, obviating the need for them to redo the process. Furthermore, this framework is open-source, fostering collaboration and adaptation to specific research needs. In addition to the methodology itself, we also present a tangible demonstration of its practical utility. Specifically, we showcase an exemplary application of synthetic data in a deep-learning-based forecasting task. This example serves as a testament to the real-world effectiveness and relevance of the methodology, providing a valuable benchmark for its potential adoption in various research contexts. As a summary of the contributions, we define three primary objectives that govern the focus of this paper:
- Introduction of a general methodology for the creation of synthetic data—GeMSyD
- Instantion of GeMSy—generating synthetic data in the context of user interaction with smart devices
- Showcasing of the research tasks applied on the generated data
The rest of the paper is organized as follows: First, we give an overview of the existing research in the domain. Section 3 addresses the first main objective, where we define GemSyD. In Section 4, we present the instantiation of GemSyD by constructing a framework for generating event-based synthetic data. We tackle the last objective in Section 5, where an application scenario with the sythetic data generated as a result of the second objective is utilized in a usage forecasting scenario. The last section is reserved for the conclusions and discussion of future research directions.
2. Literature Review
In this section, we provide details of a literature review to produce a comprehensive overview of the existing research in the field. Topics such as the general characteristics of synthetic data, the domains where it is used, and the existing methodologies are reviewed.
2.1. Unraveling the Concept of Synthetic Data
In [7], a definition of synthetic data is given, that is, data that is not real, but has the same statistical properties as the real-world data. The authors claim that analysis results on real-world data and on synthetic data should give the same results. The process of generating synthetic data is referred to by the authors as synthesis. The authors identify multiple synthesis models:
- synthesis from real-world data
- synthesis without real-world data: using the analysis background knowledge or existing models
The authors of the study claim that generating synthetic data from real non-public datasets can have high utility. This utility is formally described by measuring the extent to which a synthetic dataset accurately represents the real-world data. A common benchmark base for development models, an efficient way of accessing the data, and a means of enabling better data analytics are some of the advantages of having a mechanism for obtaining synthetic data, as identified by the authors of [7]. Another reason for using synthetic data is the fact that the development phase does not need to concentrate any efforts on making the data non-personal if the results of the studies are made public. Real-world data can contain personal information and publishing such data can only be carried out with a pre-phase of de-identification.
Synthetic data have found application in diverse fields of research, demonstrating their versatility and value in generating insights and solutions across a wide spectrum of disciplines.
2.2. Multidisciplinary Research Based on Synthetic Data
In [8], a complex review of the domains where synthetic data is used for accelerating the development of learning models is provided. The authors identify a broad list of scientific fields where simulated data is used, including the economy, house occupancy in the context of urban planning, transportation, fraud detection systems, network traffic, and natural behaviors, such as weather, precipitation, and wind. The authors also identify, in the field of data mining, some use-cases of synthetic data, including text-mining, feature selection, and performance testing. The importance of the availability of synthetic data in competitions and workshops where the data is used for benchmarking is also highlighted. We identified research based on synthetic data in various other fields, such as healthcare [9], fingerprint-based localization [10], and weather classification [11].
In [12], the authors investigated the effect of multiple data generation systems with a focus on the quality of the generated data. The authors analyzed several popular and well-known synthetic data generators, such as Synthetic Data Vault [13] and Data Synthesizer [14].
The computer science field is the greatest consumer of synthetic data, as claimed by the authors of [15]. This explains the usage of multiple generative models, such as generative adversarial networks (GANs) [16], for modeling synthetic data generation frameworks. Although GANs have proven very effective, they can be extremely difficult to train, a drawback highlighted in [15]. The authors also emphasized the necessity of employing specialized architectures for simulating tabular data. Studies have also considered other standard algorithms for generating synthetic data, such as different variations of the SMOTE [17] algorithm or ADASYN [18]. These are data augmenting algorithms, which means that a base of data needs to exist and the methods are constructed on top of this existing base of data. Other methods identified in the literature for generating data include model-based methods, such as the varying index coefficient autoregression (VICAR) method used by the authors of [19] for representing non-stationary baseline vibrations from a planetary gearbox.
2.3. Generating Synthetic Data: Methodological Approaches
In [15], the authors identify the lack of high-quality data and the need for privacy as the major reasons for investing efforts in the development of reliable synthetic data generation models. The authors stress the fact that a good synthetic dataset mimics the underlying data distribution of real data. There are multiple domains where data accessibility is hard to obtain and where generating synthetic data can help researchers to construct learning models, which can then be applied in real-world data setups. One such domain is IoT. In [20], the authors define a framework for generating synthetic data that follows the same characteristics as the real-world data in the context of a hierarchical structure using XML. The framework consists of extracting structure and value from the real-world data followed by synthetic data generation using the extracted properties. For real-world data characterization, multiple steps are cascaded to extract the data patterns from complex XML documents. These steps represent the structure and value extractors. The structure extractors explore the real-world dataset in order to establish the distribution of the XML tags. The value extractor is focused on the computation of statistical distributions of the different values of the measurements. After aggregating the values of the data from the hierarchical structure, fitting methods are used in order to decide what distribution function models the values of a sensor measurement. Multiple distributions are considered, including beta, Cauchy, chi-squared, exponential, F, gamma, geometric, log-normal, negative binomial, normal, Poisson, t, and Weibull.
2.4. Synthetic Data in Household Data Processing
In this section, we explore the state of the art in the consideration of processing household data and unlocking hidden insights from it. In recent times, the analysis of household data has gained immense popularity, offering a wealth of possibilities in fields such as smart homes, energy conservation, and lifestyle enhancement. We will showcase diverse examples of household data processing and illustrate how synthetic data, in particular, is shaping the landscape by enabling the development of highly efficient learning models.
The need for software solutions for insightful analysis is recognized in [21] where the authors tackle the topic of Big Data generated by the deployment of smart devices. The authors claim that such data is an important source of exploration, being a popular research topic both in academia and industry, for specific tasks such as load forecasting, demand response, and load disaggregation (an important application of smart grids involving the identification of what appliances are used in a home and their individual power consumption by considering as input only the aggregated power consumption of the entire smart home). The work focus is the use of smart meters for electricity consumption. The authors propose a method for detecting and estimating individual home appliance loads from aggregated power signals collected by smart meters. The usage of aggregated data is considered to be close to reality because, in many realistic situations, the measurement of power consumption for a home is obtained only in aggregate. The efficiency of the proposed methods is demonstrated with experiments on synthetic and real generated data using a hidden Markov model to model the electricity consumption. The authors place this study in a practical and usable context by giving an example of the practical usage of the results. The users of such an analysis tool can be notified by the analysis system to replace their refrigerator with a newer version which would be capable of using the energy more smartly, in order to save money. While we recognize the contribution of this work to the scientific community, we believe that serious improvements can be achieved by also using data from individual appliances in combination with the electricity consumption aggregate data. Having synthetic data in this case would be an enabler for comparing different models and obtaining quick feedback.
In [22,23], the authors tackle the topic of usage inference from event-based data, such as data produced by a smart refrigerator (the considered events are generated by the interaction of the user with the smart device, closing and opening the door being an example of interaction events). The authors use various machine learning techniques, such as unsupervised clustering (DBScan [24]), fast Fourier transform [25], and wavelets for feature extraction from time series. All these methods are used in combination with synthetic data. This offers the benefit of programmatically labeling the data for evaluation purposes. However, the methodology for data generation is only briefly described and the data are not publicly accessible. As a consequence, other studies need to repeat the data generation process in order to provide a comparison of results. Such a methodology would also be inaccurate, as the results would be reported on different datasets. Having a framework for generating such data would greatly benefit this kind of research setup.
2.5. Conceptual Foundations Explored in the Literature
In this section, we explore the foundational theoretical concepts that emerged from our literature review, providing the reader with a foundation for understanding the theoretical issues considered in the remainder of this work.
2.5.1. Finding the Probability Distribution for a Signal
The problem of finding the probability distribution for a signal has been tackled thoroughly in the literature [26,27]. Being a topic of interest, multiple frameworks have been developed to handle this problem. Some of the most popular include the fitter [28] and Scipy fitter [29] approaches.
These frameworks consider multiple probability distribution functions and the distribution that fits the best (the parameters are varied) is chosen. In order to optimize the results, the user needs to know what the available PDFs (probability density functions) are. The most popular probability distribution density functions identified in the literature include the normal distribution (identified in the rest of this document as norm), the exponential distribution (identified in the rest of this document as expon), the exponentiated Weibull distribution (identified in the rest of this document as exponweib), and the gamma distribution (identified in the rest of this document as gamma).
2.5.2. Evaluating Time-Series Forecasting
In a forecasting problem, the ultimate goal is to make accurate predictions of future events based on historical data. In the context of forecasting on time series data, R-squared (R) can be used as a measure of the accuracy of the model’s predictions. The R value is a statistical measure that indicates the proportion of the variance in the dependent variable that can be explained by the independent variable(s). If the dependent variable is considered the variable that the forecasting model is trying to predict and the independent variable is the ground truth signal, this measure offers an overview of how correlated the two signals are.
Equations (1) and (2) show how R is computed. In Equation (2), the mean value is represented which is used in Equation (1) for computing the total sum of squares (proportional to the variance of the data). In Equation (1), represents the forecasted value.
The root mean square deviation, also known as the root mean square error (RMSE), is also a popular and widely used evaluation metric in the context of forecasting time series [34,35,36]. The popularity of RMSE is based on the fact that it is easy to understand. It is computed by taking the square root of the average of the squared differences between the predicted and the actual values, as shown in Equation (3).
3. GeMSyD: Generic Methodology for Constructing a Synthetic Data Generation Framework
This section is focused on describing the methodology for constructing a synthetic data generation framework. Its applicability is general and it can be applied to various needs. In the literature, we identified two main directions for obtaining synthetic data: leveraging existing real-world data or generating data based on a formal description or a mathematical model. In this work we explore the first approach, starting from existing real-world data.
The framework consists of several layers of processing. A high-level visual grouping of these steps and their dependencies is presented in Figure 1. The methodology consists of different processing steps (represented with yellow in the schema) applied on inputs such as the real-world data, the results of other processing steps, or user configurations. The green-colored schema boxes represent the results of a processing step defined by the methodology and the blue-colored boxes represent the input for the overall methodology.
The first processing layer is represented by the extraction of real-world data characteristics. As a result, a set of real-world data descriptors is obtained. This processing step contains a combination of different methods for constructing a model of the real-world data from which the synthetic data can be obtained. The use of statistical methods such as the probability distribution represent a valid mechanism for obtaining a real-world data descriptor. Data distribution analysis, volume analysis, type of noise identification, and syntactical analysis of real-world data are other methods of obtaining real-world data descriptors. Choosing the methods for generating the descriptors is directly linked with the nature of the data and the characteristics of the data that are important to be considered.
The real-world data descriptors, together with the user configuration, represent the input for the data generation layer. The user configuration consists of options such as how the data is stored (the system can generate a file, push data into the cloud, or store data in a local database), the period of time for which the data is generated, and the configured level of noise.
The remainder of this section details the methods and mechanisms for obtaining the real-world data descriptors.
3.1. Syntactical Form Descriptor: Establishing a Syntactical Representation of the Data
Deciding the syntactical form of the data generated is an important step because it impacts the usability of the data—the generated data should be in a format easy to process and it should convey existing syntactical standards. This can be obtained by applying queries to the real-world data and applying different visualization techniques (visualization type is dependent on the current research context) on the real-world data.
3.2. PDF Real-World Data Descriptor: Fitting a Signal to a Probability Density Function
The primary goal of generating synthetic data is to create data that closely resemble real-world data. If the distribution of synthetic data does not match the distribution of real-world data, the synthetic data may not accurately represent the underlying patterns, characteristics, and behaviors of the real-world system or dataset. This can lead to misleading results and conclusions when using synthetic data for analysis, modeling, or testing. More than that, many machine learning and statistical models assume that the data is drawn from a specific distribution (e.g., a Gaussian distribution). If the synthetic data do not follow the same distribution as the real-world data, it may lead to poor model performance and incorrect parameter estimates.
In Figure 2, we present the processing steps for extracting this important real-world data descriptor. The processing pipeline includes, as a first step, the identification of the signal of interest from the entire real-world dataset. Depending on the nature of the real-world data, some processing steps might be required to be applied on the signal of interest before applying the algorithm for fitting the signal to a probability distribution.
The real-world data descriptor consists of fitting the signal of interest from the real-world data to one of the available PDFs. This real-world data descriptor should be generated for all the signals that will compose the synthetic data. The real-world data descriptor will be used in the data generation processing phase from the synthetic data generation process presented in Figure 1 when generating the values for that signal of the synthetic data.
It is important to address the fact that the real-world signal might not follow any of the available PDFs known by the PDF discovery framework that is chosen for the PDF search step. In this case, depending on the implementation of the PDF discovery framework, the construction of the PDF real-world data descriptor can fail, or a PDF that most resembles the signal can be selected.
3.3. High-Level Patterns Descriptor: Extracting Relevant Patterns
Real-world data often contain complex patterns, relationships, and structures that are challenging to replicate accurately without understanding them. By analyzing the real-world data, these intricacies can be captured and synthetic data can be created that closely resemble real-world scenarios, making the analysis more realistic. Real-world data patterns help in creating synthetic data that generalize well to different situations. When patterns from real-world data are accurately captured, synthetic data can simulate various scenarios and unforeseen variations, improving the robustness of the models and systems trained on it.
In Figure 3, we present the high-level processing steps for extracting the patterns available in real-world data. The steps are generic to accommodate different characteristics of the data.
Patterns extracted from the real-world data can be generated by one signal or by the composition of multiple signals. The first step in the proposed pipeline for extracting patterns is the identification of these signals. Depending on the nature of the signal, preprocessing steps might be required. On the processed signals, a feature extraction step is applied. Feature extraction is a topic intensively studied in the literature and multiple solutions are available, mapped to the characteristics of the real-world data. After applying different machine learning techniques, such as clustering and XAI (explainable AI), the patterns are extracted. Clustering is employed in pattern identification by grouping similar data points together, revealing inherent structures and facilitating the recognition of patterns within datasets [22]. XAI enhances pattern recognition by providing interpretable insights into the decision-making process of machine learning models, enabling a clearer understanding of how patterns are identified and aiding in model transparency [23].
One or more relevant patterns can be extracted, consisting of a set of real-world data descriptors. Together with the patterns, the characteristics of the patterns are also extracted in order to offer to the user of the synthetic data generation framework a mechanism for configuring the patterns in the data. This is used for planting different behaviors in the data.
3.4. Noise Descriptors
Real-world data often contain inherent variability and errors, which are crucial to capture in the synthetic data to ensure that they accurately reflect the complexity of the real-world data. In Figure 4 the processing steps are presented for obtaining different real-world data descriptors that characterize the data from the noise perspective.
If the synthetic dataset is generated from raw and unprocessed data, the missing values and the proportion of missing values should also be included in the synthetic data. The importance of this aspect is emphasized in [12,13]. In [14], a missing rate is calculated for each simulated attribute and the information is included in the synthetic data generation. The missing rate is computed as the number of entries that do not have a value for a certain attribute divided by the size of the entire analyzed dataset. The periodicity of the data transmission model can also be used for detecting missing values, as shown in [37]. Outlier identification is also an intensively studied topic in the literature [38,39,40,41].
All of the above real-world data descriptors, together with other descriptors that might be needed (depending on the nature of the data that are being simulated), should be embedded in the last processing phase of the synthetic data generation—the data generator.
4. Instantion of GeMSyD—Event-Based Synthetic Data Generation Framework
This section is focused on exemplifying how the defined general methodology can be applied in a specific use case: the generation of synthetic household data produced by the interaction of the user with smart devices. We analyzed real-world data from smart devices deployed all over the world in real setups and which are used by consumers, and we used the GeMSyD to produce synthetic data with similar characteristics. The framework is focused on emulating the interaction of the user with a smart device. This interaction is emulated by following a category of events existing in the dataset: an event marking the start of the user–device interaction and an event marking the end of this interaction.
4.1. Algorithms for Generating Real-World Data Descriptors
Several strategies for analyzing the data are used in order to obtain efficient real-world data descriptors. Given the nature of the simulated data, only the events related to the user interaction are used.
We applied the methodological approach proposed by GeMSyD for extracting the real-world data descriptors. Details on how we implemented each processing phase are given in the following section.
4.1.1. Obtaining the Syntactic Descriptor
Inspection of the real-world data is performed by formalizing a syntactical representation of the data which is close to the real-world data representation. We formalize the syntactical form of the data as events of type user–device interaction START and user–device interaction END, accompanied by the timestamp.
We encode the event of initiating the interaction with 1 and the event of ending the interaction of the user with the smart appliance with 0.
We define the first real-world data descriptor—a syntactical form of the generated data. This real-world data descriptor is presented in Table 1.
In Table 2, a series of events that follow the defined real-world data descriptor is presented. These events do not represent a snapshot of the real-world data (confidentiality agreements would be broken). They represent a potential scenario of a succession of events and are presented to offer a clear overview of the data to the reader and to provide a base for further explanation of the next processing phases applied to the data.
4.1.2. PDF Descriptor of the Signal Modeling the User–Device Interaction Duration
One of the features that characterizes the type of data that we want to generate is the duration of the interaction between the user and the smart device. An analysis of the real-world dataset is performed in order to extract the real-world data description corresponding to this dimension of the data. To perform this analysis, the relevant signal needs to be constructed from the raw data.
Extracting the Signal Modeling the Duration of the User Interaction
The first step of this processing phase is the dropping of the duplicates. Two entries are considered to be duplicates if they have the same values for the timestamp. If two entries have the same value for the timestamp and different values for the user–device interaction state, this means that the interaction took less than one second, which is the current granularity. These types of interactions are analyzed separately from this analysis because the timestamp is used as an index for the data, so having equal values is an impediment in using this strategy.
The next step is to find the next event and to record its timestamp. This will construct data that syntactically look like in Table 3.
In the current analysis, we are only interested in analyzing the duration of one interaction of the user with the device. The interaction is delimited by the two events already presented: the event marking the start of the interaction and the event marking the end of the interaction. In this context, from the data described in Table 3, we only need to select the sequences of events going to state 0 from state 1. Once these transitions are selected, we compute in the column Time in [s] between events the duration of the user–device interaction. This subset of data is emphasized with the color blue in Table 4.
Because we are applying this analysis to real-world data, some outliers might occur. Outliers represent anomalous observations from the data and, in this case, they can be generated from the missing signals for ending the user–device interaction, resulting in very large values for the duration of the interaction. An analysis of the potential outliers was performed using the boxplot method [42]. The results showed that some outliers existed in the data. In Figure 5, we can see the result of applying boxplotting on the signal modeling the user interaction duration for one of the analyzed appliances.
We detect the outliers and the algorithm of mapping the probability distribution excluding the outliers from analysis for better results. It is important to mention that, in this case, the outliers negatively influence the efficiency of finding a PDF as close as possible to reality. The outliers and the other categories of noise represent a valid descriptor for the real data and they are included as separate descriptors.
To remove the outliers, several alternatives are described in the literature, including clustering [39,40], use of the interquartile range, [41] or more advanced methods, like t-SNE ensemble clustering [38]. For this analysis, an approach similar to the interquartile range is used with the modification that only the upper bound of the value ranges is eliminated. All records outside of the 0.99 quantile [43] are removed from this analysis. It is important to mention that outlier removal is performed at this step in order to obtain the relevant information for the current descriptor. Analysis of the outliers and inclusion of this information in the synthetic data with the goal of making the data similar to the real-world data is performed at the noise descriptor level.
Computing the PDF
As emphasized in previous sections, for obtaining synthetic data that are close to reality, the signals should be generated by following a probability distribution present in the real-world data. For this analysis, the fitter [28] method is used because of its usability and the variety of distributions that can be considered.
In Figure 7, we can observe the summary provided by the fitter package that was used in order to find the distribution probability that best fits the interaction duration signal for one of the appliances considered for this analysis.
After applying this processing step to multiple appliances, the PDF with the largest number of occurrences is selected as the final PDF.
4.1.3. PDF Descriptor of the Signal Modeling the Duration between Consecutive Interactions
For this specific issue, a pertinent data attribute is the frequency of the user interactions with the device and the duration between consecutive interactions. This can be obtained by computing the next interaction based on the events of the type start/end of the user–device interaction. The intermediary structure defined in Table 3 is used. The next opening is represented by rows that have a transition from 0 (representing the end of one interaction) to 1 (representing a new interaction). The selected subset of data is emphasized in Table 5 by the color blue.
The analysis in this case is split in two directions. One is focused on modeling the probability distribution of the signal representing the duration between consecutive interactions during an active usage period (AUP). An AUP is defined as a period in which the user frequently uses the appliance. The other dimension analyzed is the signal modeling the duration between consecutive openings that are outside an AUP. The threshold for the duration that splits two consecutive openings in an AUP, or outside one, is empirically established to be 30 min for the analyzed types of devices. In Figure 8, a visual representation of consecutive openings is given in both the cases inside and outside an AUP.
As a result of this step, two real-world data descriptors are generated, corresponding to the signal that models the duration between consecutive interactions inside an AUP and the signal representing the duration between consecutive openings outside an AUP.
4.1.4. Usage Patterns Descriptor: Extracting Patterns of Usage
In the current context, relevant patterns present in the data are represented by patterns of usage of the smart device. Examples of such patterns include users having active periods during the morning, users having N active periods during a day, and users having no AUP during the weekend. To extract such behaviors from the data, an entire study is required. For the data generation, we applied the methodology we proposed in [22]. For each studied appliance, we performed the following steps:
We extract the patterns of usage from the real-world data and we embed this information in the synthetic data generation process.
4.1.5. Noise Descriptors
For an event that is periodically transmitted, the missing values are easy to compute, as shown in [37], where the transmission patterns are studied. In the case of a signal that has no periodicity, but is event-based (the events generated as a result of user interaction), the missing values are quite hard to quantify. The user might not use the appliance for a long period of time or the transmission system might be broken and no events are transmitted to the storage systems. Both of these situations have the same effects—no events are registered for that appliance in the given time frame. As a consequence, a descriptor modeling this aspect of the data can not be generated for this type of data.
Duplicate entries represent a valid noise descriptor. This is obtained by querying the real-world dataset and obtaining the percentage of duplicate events. Two events are considered duplicates if they share the exact same timestamp and the same value for the interaction state.
The outlier percentage is also a valid noise descriptor and is applied for the following signal modeling the duration of the user interaction.
4.2. Generated Descriptors: Results and Discussion
The dataset on which the simulated data is based consists of a collection of more than 12,000 appliances. The raw data are unstructured—all the events generated by the interaction with the user and all the recordings of the sensor deployed on the appliances generate new entries in the same storage structure. The appliances recorded user activity for a period that varied from one day to more than four years. In our analysis, we eliminated the appliances that had a recording period of less than one month.
From this dataset, we utilized 51 appliances for extracting the real data descriptors regarding the PDFs. The selection of a limited number of appliances on which to apply the algorithms for extracting the real-data descriptors is necessary due to limited access to the real-world data and the fact that extracting the real-data descriptors is time-consuming.
Table 6 contains a summary of the appliance characteristics that are relevant to the methods and algorithms defined above for extracting the real-world descriptors for generating the framework capable of producing user–device interaction synthetic data. Each appliance has an identifier defined in the first column of the table. The second column shows the total number of days for which the appliance has recordings (the start of the recording is the deployment of the appliance in the user house). The number of interaction events for each appliance is shown in the third column to prove the validity of the appliance (the appliance is in use and relevant data can be extracted by applying statistical analysis).
The percentage of outliers found for the signal modeling the duration of the interaction is shown in the Outliers % column and the PDF found for each appliance for the signal modeling the period of user–device interaction is shown in the last column. The distribution of the values of this last column is visually presented in Figure 9.
The result of extracting the duplicates component of the noise descriptor is presented in Table 7. The table contains only the appliances for which we identified duplicate events. For the appliances missing from the table, we identified no duplicate events.
For extracting the usage patterns, we use a forward-filling method to transform the event-based data into time series, followed by an aggregation operation, aggregating the data hourly. We split the data into time-boxed units of data representing the usage of the device in one day. We apply a fast Fourier transform and we use the first ten coefficients of the Fourier transform (each coefficient is represented by two parts, the real component and the imaginary component). This summarizes the daily usage of the device in terms of 20 numbers. For clustering, we use DBScan, configured with the Euclidian distance and an auto algorithm.
With this setup, we deploy the usage mining script in the above-described data lake. Similar behaviors of using the smart device mainly in two periods of the day (2-AUP) are found for 37.5% of the devices. Patterns of using the appliance in mainly three periods of the day (3-AUP) are found for 18.75%. Using the device in four time intervals (4-AUP) is found in 12.5% of the analyzed devices. No behavioral pattern could be extracted from 31.25% of the devices. A visual representation of these results is shown in Figure 10.
The presented results of applying the algorithms for the real-data descriptors extraction are all integrated into the data generation step of the synthetic data generation framework.
4.3. Framework Implementation
All the real-world data descriptors detailed in the above section are obtained by using tools, such as SQL queries on a data lake (available storage for the real-world data), combined with Python notebooks implemented in DataBricks [45].
For the data generation software, a Java-based tool was developed. The real-world data descriptors are embedded into the Java code. For the user configuration, a properties file is read by the framework.
As a result, a file saved into the local device on which the software is running is generated. For ease of future processing, the output file has a CSV extension.
The entire framework is open source and open for improvements and extension. The code for the software generating the event-oriented data is accessible at: https://github.com/tolasramona/fridge-door-event-generation (accessed on 30 November 2023).
5. Application Scenario: Synthetic Data for Forecasting the Usage
The data generated with our synthetic data generator, empowered by the GeMSyD methodology, open up a world of possibilities for practical applications in the realm of smart device usage forecasting. In this section, we illustrate the steps involved in building a processing pipeline to forecast the usage patterns of a smart device using the synthetic data we have created. This example serves as a compelling showcase of the potential applications of synthetic data in real-world scenarios. The section is intended to provide a hands-on guide to the utilization of the created synthetic data, using a more tutorial format.
Using the developed open-source framework, we generated synthetic data for three devices. We used the behavioral patterns in the interaction of the user with the device. The usage period, the pattern, and the frequency of the interaction are varied. The behavior associated with each device and the configured noise level are presented below, where an identifier is given for each dataset (corresponding to a device) that will be used to reference the dataset in the rest of the section.
- DS1: This appliance has data recorded from 2021-02-25 until 2023-02-15. The probability of missing an active period in this case is set to 0.1. This dataset containing the recording of user interaction for two years contains two equally active periods of two hours during one day.
- DS2: This appliance has data recorded from 2022-03-02 until 2023-02-25. The first active period has a duration of one hour and the last active period from the day has a duration of two hours. The probability of missing an active period in this case is set to 0.1.
- DS3: This appliance has data recorded from 2022-03-02 until 2023-02-25. The first active period has a duration of one hour and the last active period has a duration of 30 min. The probability of missing an active period in this case is set to 0.1.
In Figure 11, a snapshot of four days from the generated synthetic data is given. The snapshot contains the events of the user interaction (consisting of events of type start/end of the interaction with the smart device) recorded for four days.
The synthetic data are put through a series of transformations in order to prepare them for a prediction algorithm. These preprocessing operations are:
- Dropping duplicate events
- Transformation from events to time series
- Normalization
- Applying the sliding window (with 24 h the size of the window) for creating the input (current window) and the output (next value) for the forecasting process
After this preprocessing phase, the data are split into train and test datasets. We select the last two days of the functioning period as the test data and we use the rest of the history of usage as the train data. With this approach, we learn from the history of usage and we predict the next two days. A model-fitting phase is then applied to the data. For this phase, LSTM [46] deep neural networks are used. The architecture used for the experiments performed in this section is described by the code block detailed below:
def create_LSTM_model_1(data_shape):
Model = Sequential()
Model.add(LSTM(units = 60,
return_sequences = True,
input_shape = (shape, 1)))
Model.add(Dropout(0.2))
Model.add(LSTM(units = 60,
return_sequences = True))
Model.add(Dropout(0.2))
Model.add(LSTM(units = 60,
return_sequences = True))
Model.add(Dropout(0.2))
Model.add(LSTM(units = 60))
Model.add(Dropout(0.2))
Model.add(Dense(units = 1))
return Model
The two evaluation metrics described in the Conceptual Foundations Explored in the Literature section are used to evaluate the results of applying the defined deep learning architecture to the synthetic data, R and RMSE. The results are presented in Table 8 and a graphical representation of forecasting using the LSTM architecture is presented in Figure 12.
The entire code of visualizing the data, creating the learning model, and evaluating the results is available in Appendix A. This section serves as an invitation to the research community to further explore and advance the field by developing models and conducting benchmark studies using our synthetic data. Cross-validation and variations in the train and test percentages are candidates for improving the overall results.
6. Conclusions
In this article, we have introduced a groundbreaking approach to synthetic data generation through the development of a generic methodology—GeMSyD (Generic Methodology for Synthetic Data Generation). We showcased the versatility and applicability of this methodology by constructing a practical framework specifically tailored for generating synthetic data that accurately emulates the event-based data modeling of user interactions with smart devices.
Our study began with the realization that the need for high-quality synthetic data is more crucial than ever, particularly in the ever-evolving field of smart devices and user interaction research. While the importance of real-world data cannot be overstated, the challenges of access, privacy, and scalability have driven us to explore the potential of synthetic data. GeMSyD was born from this exploration, offering a robust and adaptable solution that can be extended to a wide array of domains and research areas. GeMSyD is the realization of our first proposed objective for this study.
Our second objective was successfully achieved by the instantiation of the GeMSyD methodology into a framework dedicated to smart device user interaction data generation. The obtained synthetic data are a testament to the GeMSyD efficacy. By embracing statistical analysis and machine learning techniques, our framework not only replicates the complexity of real-world interactions but also provides an invaluable resource for researchers and developers looking to explore the possibilities of synthetic data.
One of the pivotal contributions we make in this article is our commitment to open-source principles. We have made the entire framework accessible to the public, allowing for widespread adoption and collaborative development. This decision aligns with our vision of democratizing synthetic data generation and fostering an ecosystem where innovation thrives. We also offer a snapshot of the data generated with our framework, available to researchers free of charge. This dataset serves as a foundational resource for the development, testing, and benchmarking of machine learning models within the domain of smart devices and user interaction. With a common base for benchmarking, we believe that we can accelerate progress in this field and foster the development of more effective and robust models. We understand that having data is one thing, but being able to work with it effectively is equally important. Thus, we provide the source code for data visualization and processing, ensuring that researchers can harness the full potential of the data and tailor it to their specific research needs, achieving our final objective.
GeMSyD is not a static framework; it is a living methodology that is ready for further exploration and application. In our vision for future work, we plan to extend the GeMSyD methodology to various other domains and research areas. We aim to extract additional generic real-world data descriptors that can be utilized to construct synthetic datasets that mirror the intricacies of different domains, allowing for experimentation, testing, and research on a broader scale. By applying GeMSyD to diverse fields, we hope to establish a rich repository of synthetic data that can be shared and collaboratively developed to advance research across multiple domains. This expansion is not limited to generating synthetic data; it also encompasses refining and enhancing the GeMSyD methodology to ensure its adaptability and effectiveness in various contexts.
In closing, GeMSyD represents a pivotal step forward in the field of synthetic data generation. It offers a powerful, adaptable, and open-source methodology that can empower researchers, developers, and data scientists to explore new frontiers in their respective fields. The framework for generating synthetic data in the smart device and user interaction domain, along with the shared dataset and code, forms the foundation for a brighter future of collaborative research.
Author Contributions
Conceptualization, R.T.; data curation, R.T. and R.P. (Raluca Portase); formal analysis, R.T. and R.P. (Raluca Portase); investigation, R.T.; methodology, R.T.; project administration, R.T., R.P. (Raluca Portase) and R.P. (Rodica Potolea); resources, R.T.; software, R.T.; supervision, R.P. (Rodica Potolea); validation, R.T., R.P. (Raluca Portase) and R.P. (Rodica Potolea); visualization, R.T.; writing—original draft, R.T.; writing—review and editing, R.T. and R.P. (Raluca Portase). All authors have read and agreed to the published version of the manuscript.
Funding
This research received no external funding.
Institutional Review Board Statement
Not applicable.
Informed Consent Statement
Not applicable.
Data Availability Statement
The synthetic data generation framework is open-source and available at: https://github.com/tolasramona/fridge-door-event-generation (accessed on 30 November 2023). A dataset already generated using this synthetic data generation framework is available at: Kaggle Dataset (accessed on 30 November 2023).
Conflicts of Interest
The authors declare no conflicts of interest.
Abbreviations
The following abbreviations are used in this manuscript:
| GeMSyD | Generic Methodology for Constructing a Synthetic Data Generation Framework |
| RNN | Recurrent Neural Networks |
| LSTM | Long Short-Term Memory |
| Probability Distribution Function | |
| FFT | Fast Fourier Transform |
| DBSCAN | Density-based Spatial Clustering |
Appendix A
The following Databricks notebook is used for implementing the application scenario of usage forecasting based on the synthetic data obtained with the instantiation of GeMSyD and is available at Kaggle Dataset (accessed on 30 November 2023).
![Data 09 00014 i001]()
![Data 09 00014 i002]()
![Data 09 00014 i003]()
![Data 09 00014 i004]()
![Data 09 00014 i005]()


References
- Chen, Y.; Rao, M.; Feng, K.; Zuo, M.J. Physics-Informed LSTM hyperparameters selection for gearbox fault detection. Mech. Syst. Signal Process. 2022, 171, 108907. [Google Scholar] [CrossRef]
- Han, T.; Xie, W.; Pei, Z. Semi-supervised adversarial discriminative learning approach for intelligent fault diagnosis of wind turbine. Inf. Sci. 2023, 648, 119496. [Google Scholar] [CrossRef]
- Rahim, M.S.; Nguyen, K.A.; Stewart, R.A.; Giurco, D.; Blumenstein, M. Advanced household profiling using digital water meters. J. Environ. Manag. 2021, 288, 112377. [Google Scholar] [CrossRef] [PubMed]
- McKenna, S.; Fusco, F.; Eck, B. Water Demand Pattern Classification from Smart Meter Data. Procedia Eng. 2014, 70, 1121–1130. [Google Scholar] [CrossRef]
- Artificial Intelligence in Health Care: Benefits and Challenges of Machine Learning in Drug Development; (STAA)-Policy Briefs & Reports-EPTA; U.S. Government Accountability Office: Washington, DC, USA, 2020.
- Olariu, E.M.; Tolas, R.; Portase, R.; Dinsoreanu, M.; Potolea, R. Modern approaches to preprocessing industrial data. In Proceedings of the 2020 IEEE 16th International Conference on Intelligent Computer Communication and Processing (ICCP), Cluj-Napoca, Romania, 3–5 September 2020; pp. 221–226. [Google Scholar] [CrossRef]
- El Emam, K.; Mosquera, L.; Hoptroff, R. Practical Synthetic Data Generation: Balancing Privacy and the Broad Availability of Data; O’Reilly Media: Newton, MA, USA, 2020. [Google Scholar]
- Berg, A.M.; Mol, S.T.; Kismihók, G.; Sclater, N. The Role of a Reference Synthetic Data Generator within the Field of Learning Analytics. J. Learn. Anal. 2016, 3, 107–128. [Google Scholar] [CrossRef]
- Dahmen, J.; Cook, D. SynSys: A synthetic data generation system for healthcare applications. Sensors 2019, 19, 1181. [Google Scholar] [CrossRef]
- Nabati, M.; Navidan, H.; Shahbazian, R.; Ghorashi, S.A.; Windridge, D. Using synthetic data to enhance the accuracy of fingerprint-based localization: A deep learning approach. IEEE Sens. Lett. 2020, 4, 1–4. [Google Scholar] [CrossRef]
- Minhas, S.; Khanam, Z.; Ehsan, S.; McDonald-Maier, K.; Hernández-Sabaté, A. Weather classification by utilizing synthetic data. Sensors 2022, 22, 3193. [Google Scholar] [CrossRef]
- Dankar, F.K.; Ibrahim, M. Fake It Till You Make It: Guidelines for Effective Synthetic Data Generation. Appl. Sci. 2021, 11, 2158. [Google Scholar] [CrossRef]
- Patki, N.; Wedge, R.; Veeramachaneni, K. The Synthetic Data Vault. In Proceedings of the 2016 IEEE International Conference on Data Science and Advanced Analytics (DSAA), Montreal, QC, Canada, 17–19 October 2016; pp. 399–410. [Google Scholar] [CrossRef]
- Ping, H.; Stoyanovich, J.; Howe, B. DataSynthesizer: Privacy-Preserving Synthetic Datasets. In Proceedings of the 29th International Conference on Scientific and Statistical Database Management, New York, NY, USA, 27–29 June 2017. SSDBM ’17. [Google Scholar] [CrossRef]
- Figueira, A.; Vaz, B. Survey on synthetic data generation, evaluation methods and GANs. Mathematics 2022, 10, 2733. [Google Scholar] [CrossRef]
- Goodfellow, I.; Pouget-Abadie, J.; Mirza, M.; Xu, B.; Warde-Farley, D.; Ozair, S.; Courville, A.; Bengio, Y. Generative adversarial nets. In Proceedings of the NIPS’14: 27th International Conference on Neural Information Processing Systems, Montreal, QC, Canada, 8–13 December 2014; Volume 27. [Google Scholar]
- Chawla, N.V.; Bowyer, K.W.; Hall, L.O.; Kegelmeyer, W.P. SMOTE: Synthetic minority over-sampling technique. J. Artif. Intell. Res. 2002, 16, 321–357. [Google Scholar] [CrossRef]
- He, H.; Bai, Y.; Garcia, E.A.; Li, S. ADASYN: Adaptive synthetic sampling approach for imbalanced learning. In Proceedings of the 2008 IEEE International Joint Conference on Neural Networks (IEEE World Congress on Computational Intelligence), Hong Kong, China, 1–6 June 2008; pp. 1322–1328. [Google Scholar]
- Chen, Y.; Rao, M.; Feng, K.; Niu, G. Modified Varying Index Coefficient Autoregression Model for Representation of the Nonstationary Vibration From a Planetary Gearbox. IEEE Trans. Instrum. Meas. 2023, 72, 1–12. [Google Scholar] [CrossRef]
- Anderson, J.; Kennedy, K.; Ngo, L.; Luckow, A.; Apon, A. Synthetic data generation for the internet of things. In Proceedings of the 2014 IEEE International Conference on Big Data, IEEE Big Data 2014, Washington, DC, USA, 27–30 October 2015; pp. 171–176. [Google Scholar] [CrossRef]
- Guo, Z.; Wang, Z.J.; Kashani, A. Home appliance load modeling from aggregated smart meter data. IEEE Trans. Power Syst. 2014, 30, 254–262. [Google Scholar] [CrossRef]
- Tolas, R.; Portase, R.; Dinsoreanu, M.; Potolea, R. Mining User Behavior: Inference of Time-boxed Usage Patterns from Household Generated Data. In Proceedings of the eKNOW 2023, The Fifteenth International Conference on Information, Process, and Knowledge Management, Venice, Italy, 24–28 April 2023. [Google Scholar]
- Tolas, R.; Portase, R.; Lemnaru, C.; Dinsoreanu, M.; Potolea, R. Unsupervised Clustering and Explainable AI for Unveiling Behavioral Variations Across Time in Home-Appliance Generated Data. In Proceedings of the International Conference on Information Integration and Web Intelligence, Bali, Indonesia, 4–6 December 2023; Springer: Cham, Switzerland, 2023; pp. 147–161. [Google Scholar]
- Scikit-Learn DBSCAN. Available online: https://scikit-learn.org/stable/modules/generated/sklearn.cluster.DBSCAN.html (accessed on 19 July 2022).
- Brigham, E.O.; Morrow, R.E. The fast Fourier transform. IEEE Spectr. 1967, 4, 63–70. [Google Scholar] [CrossRef]
- Ramberg, J.S.; Dudewicz, E.J.; Tadikamalla, P.R.; Mykytka, E.F. A Probability Distribution and its Uses in Fitting Data. Technometrics 1979, 21, 201–214. [Google Scholar] [CrossRef]
- Kuzmin, V.; Zaliskyi, M.; Odarchenko, R.; Polishchuk, O.; Ivanets, O.; Shcherbyna, O. Method of Probability Distribution Fitting for Statistical Data with Small Sample Size. In Proceedings of the 2020 10th International Conference on Advanced Computer Information Technologies (ACIT), Deggendorf, Germany, 16–18 September 2020; pp. 221–224. [Google Scholar] [CrossRef]
- Fitter Python Package Documentation. Available online: https://pypi.org/project/fitter/0.2.0/ (accessed on 19 January 2023).
- Scipy Documentation. Available online: https://scipy.github.io/devdocs/reference/generated/scipy.stats.fit.html (accessed on 19 January 2023).
- Normal Distribution. Available online: https://en.wikipedia.org/wiki/Normal_distribution (accessed on 19 January 2023).
- Exponential Distribution. Available online: https://en.wikipedia.org/wiki/Exponential_distribution (accessed on 19 January 2023).
- Exponentiated Weibull Distribution. Available online: https://en.wikipedia.org/wiki/Exponentiated_Weibull_distribution (accessed on 19 January 2023).
- Gamma Distribution. Available online: https://en.wikipedia.org/wiki/Gamma_distribution (accessed on 19 January 2023).
- Yao, J.; Han, T. Data-driven lithium-ion batteries capacity estimation based on deep transfer learning using partial segment of charging/discharging data. Energy 2023, 271, 127033. [Google Scholar] [CrossRef]
- Gonzalez-Vidal, A.; Jimenez, F.; Gomez-Skarmeta, A.F. A methodology for energy multivariate time series forecasting in smart buildings based on feature selection. Energy Build. 2019, 196, 71–82. [Google Scholar] [CrossRef]
- Kim, S.; Alizamir, M.; Kim, N.W.; Kisi, O. Bayesian model averaging: A unique model enhancing forecasting accuracy for daily streamflow based on different antecedent time series. Sustainability 2020, 12, 9720. [Google Scholar] [CrossRef]
- Tolas, R.; Portase, R.; Iosif, A.; Potolea, R. Periodicity detection algorithm and applications on IoT data. In Proceedings of the 2021 20th International Symposium on Parallel and Distributed Computing (ISPDC), Cluj-Napoca, Romania, 28–30 July 2021; pp. 81–88. [Google Scholar] [CrossRef]
- Raymond, L.; Mehala, B.; Arman, M. Sample Truncation Strategies for Outlier Removal in Geochemical Data: The MCD Robust Distance Approach Versus t-SNE Ensemble Clustering. Math. Geosci. 2021, 53, 105–130. [Google Scholar] [CrossRef]
- Jiang, M.; Tseng, S.; Su, C. Two-phase clustering process for outliers detection. Pattern Recognit. Lett. 2001, 22, 691–700. [Google Scholar] [CrossRef]
- Fawzy, A.; Mokhtar, H.M.; Hegazy, O. Outliers detection and classification in wireless sensor networks. Egypt. Inform. J. 2013, 14, 157–164. [Google Scholar] [CrossRef]
- Vinutha, H.P.; Poornima, B.; Sagar, B.M. Detection of Outliers Using Interquartile Range Technique from Intrusion Dataset. In Proceedings of the Information and Decision Sciences; Satapathy, S.C., Tavares, J.M.R., Bhateja, V., Mohanty, J.R., Eds.; Springer: Singapore, 2018; pp. 511–518. [Google Scholar]
- Plotly. Box Plots in Python. Available online: https://plotly.com/python/box-plots/ (accessed on 19 January 2023).
- Pandas Documentation—Quantile. Available online: https://pandas.pydata.org/docs/reference/api/pandas.DataFrame.quantile.html (accessed on 19 January 2023).
- Ester, M.; Kriegel, H.P.; Sander, J.; Xu, X. A Density-Based Algorithm for Discovering Clusters in Large Spatial Databases with Noise. In Proceedings of the Second International Conference on Knowledge Discovery and Data Mining, Portland, OR, USA, 2–4 August 1996; KDD’96. AAAI Press: Washington, DC, USA, 1996; pp. 226–231. [Google Scholar]
- Spark. DataBricks. 2023. Available online: https://www.databricks.com/ (accessed on 2 December 2023).
- Gers, F.A.; Schmidhuber, J.; Cummins, F. Learning to forget: Continual prediction with LSTM. Neural Comput. 2000, 12, 2451–2471. [Google Scholar] [CrossRef] [PubMed]
Figure 1.
High-level view of synthetic data generation framework layers.
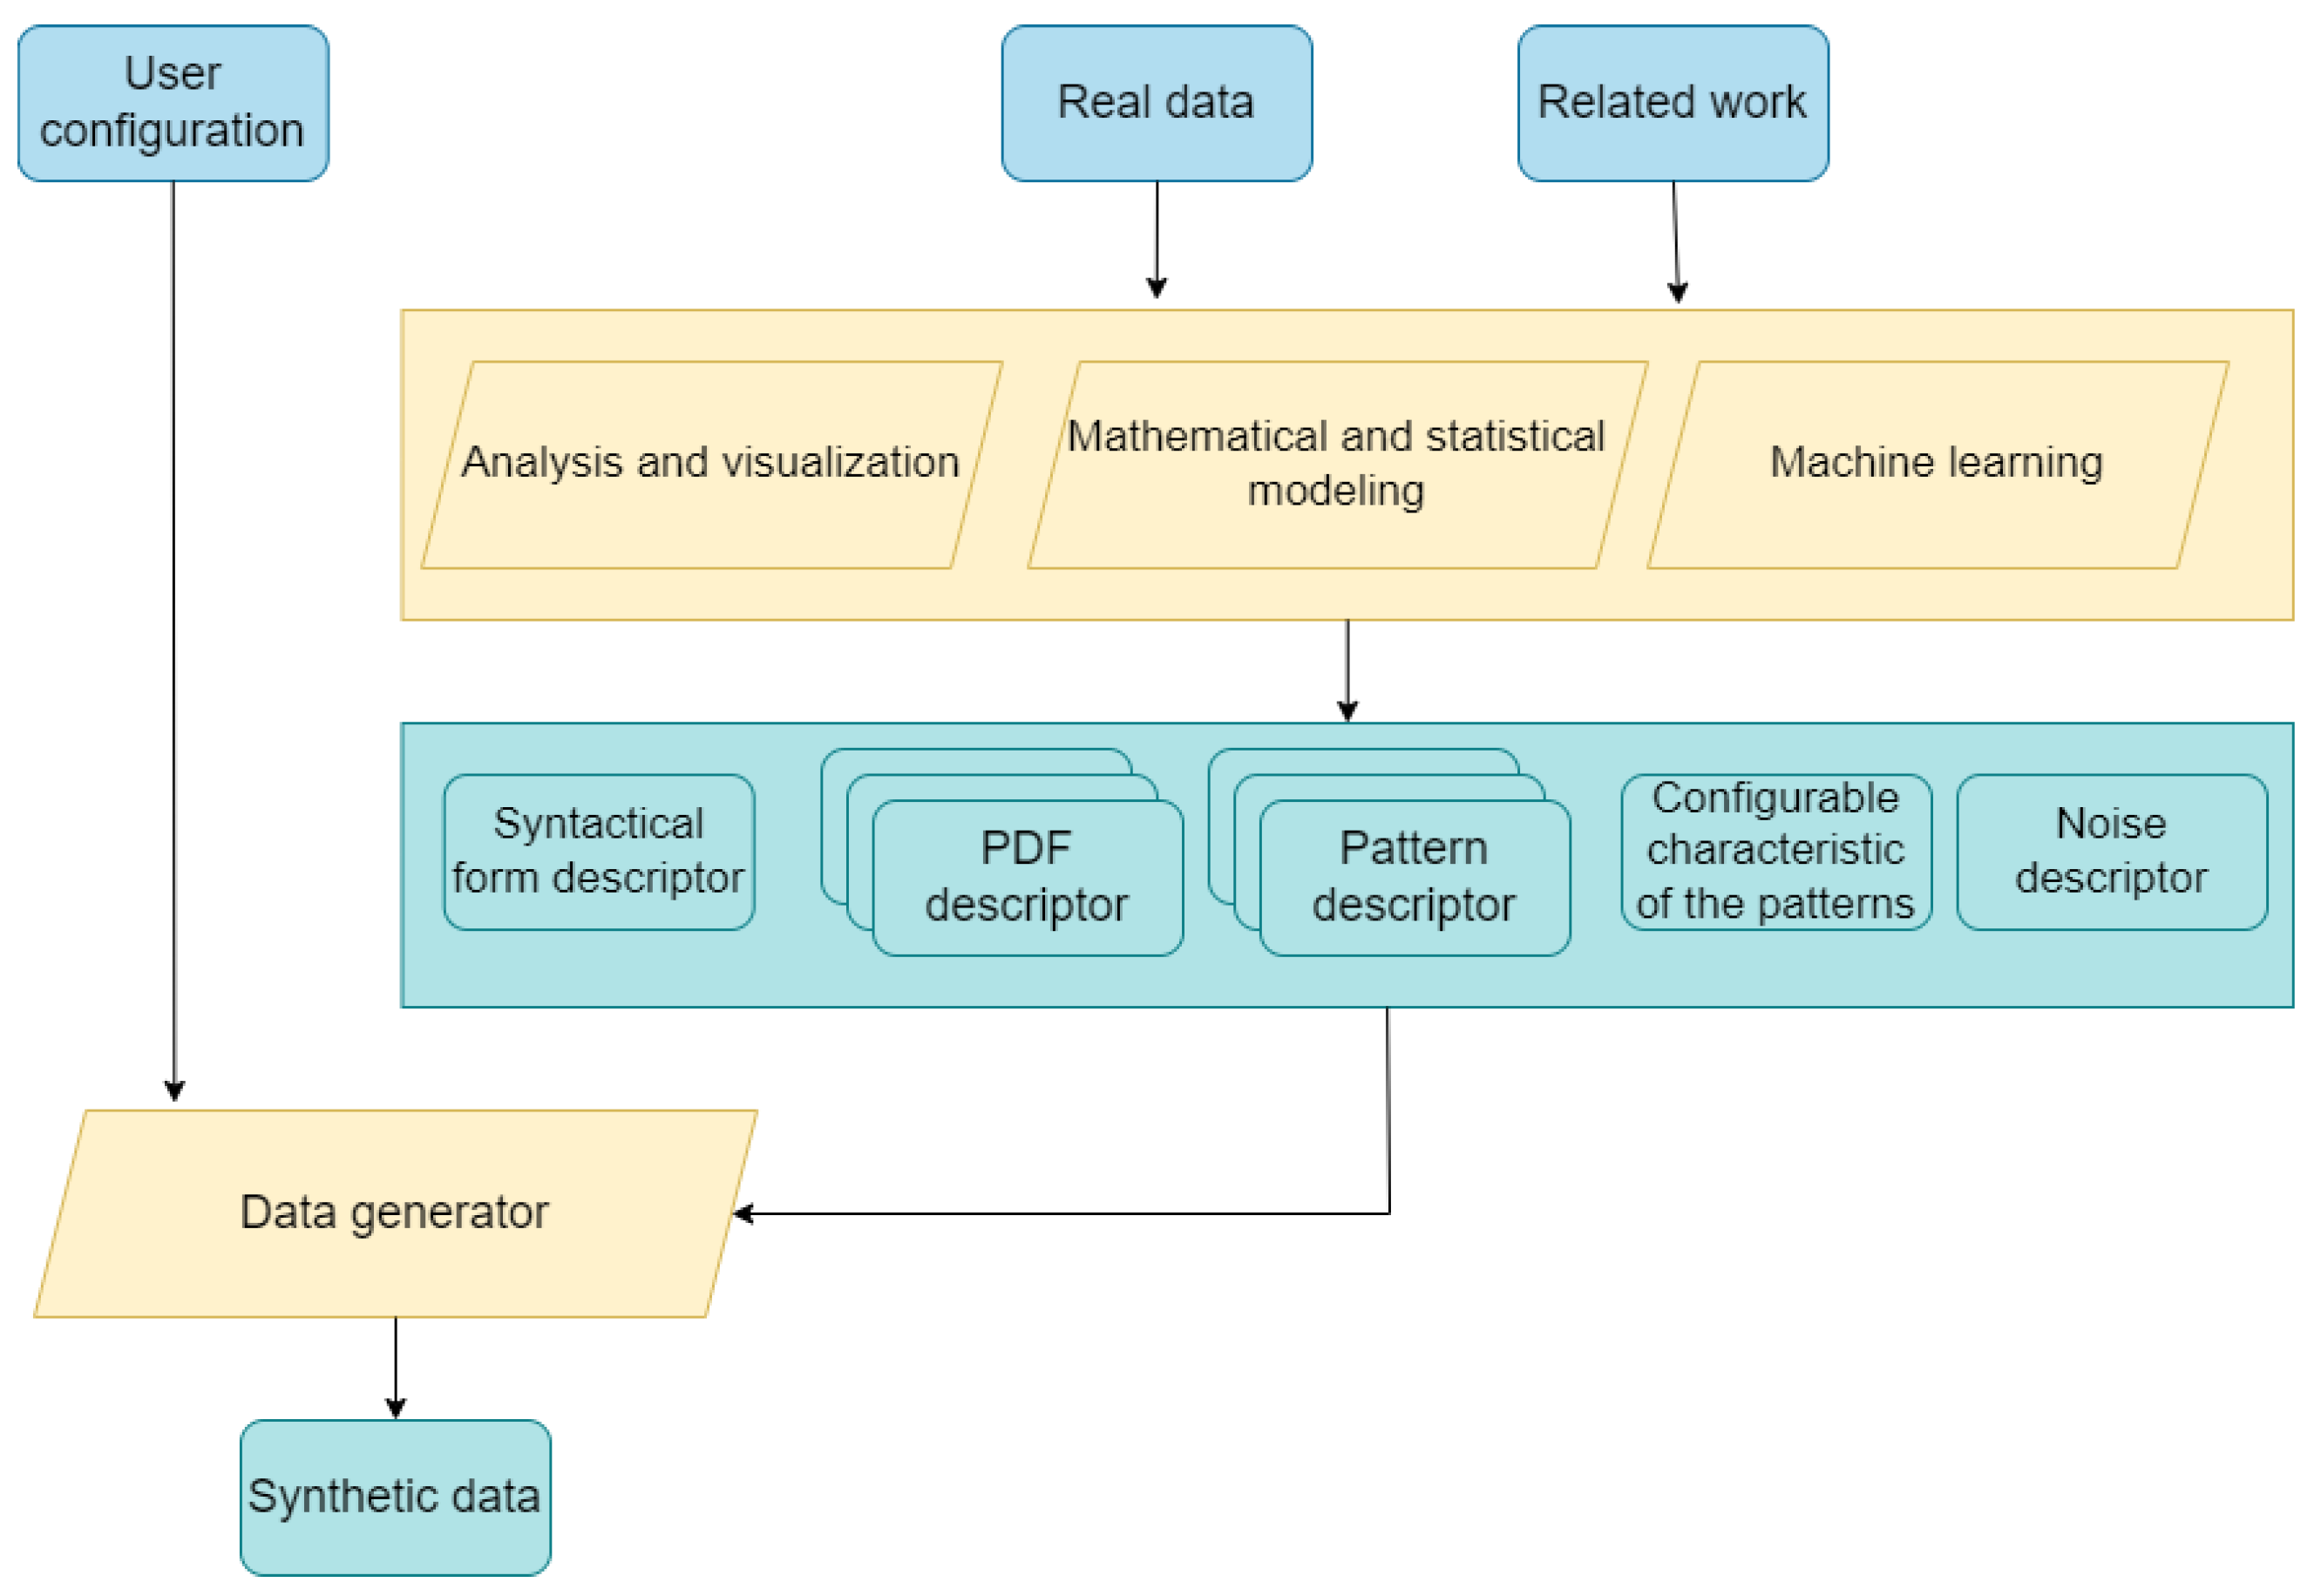
Figure 2.
Processing steps for extracting the PDF real-world data descriptor.

Figure 3.
Processing steps for a real-world data descriptor which characterize the patterns available in the real-world data.
Figure 3.
Processing steps for a real-world data descriptor which characterize the patterns available in the real-world data.

Figure 4.
Processing steps for a real-world data descriptor which characterize the patterns available in the real-world data.
Figure 4.
Processing steps for a real-world data descriptor which characterize the patterns available in the real-world data.

Figure 5.
Boxplot for the interaction duration signal for one of the studied appliances.

Figure 6.
Boxplot for the interaction duration signal for one of the studied appliances after outliers were removed.
Figure 6.
Boxplot for the interaction duration signal for one of the studied appliances after outliers were removed.

Figure 7.
Summary provided by the fitter package for the fitting of the signal modeling the interaction duration to one of the probability distributions.
Figure 7.
Summary provided by the fitter package for the fitting of the signal modeling the interaction duration to one of the probability distributions.

Figure 8.
Visualization of the events representing the interaction of a user with a smart device. The time is represented on the OX axis and the user–device interaction state is represented on the OY axis. Two AUPs are presented.
Figure 8.
Visualization of the events representing the interaction of a user with a smart device. The time is represented on the OX axis and the user–device interaction state is represented on the OY axis. Two AUPs are presented.

Figure 9.
Distribution of the PDFs found in the real dataset for the signal modeling the duration of the user–device interaction.
Figure 9.
Distribution of the PDFs found in the real dataset for the signal modeling the duration of the user–device interaction.

Figure 10.
Distribution of the identified AUP types in the real-world data by applying the algorithm defined in the usage pattern descriptor section. With blue it is represented the 2 AUP type of usage, with orange it is represented the 3 AUP type of usage and with green the 4 AUP type of usage. The red color represents the instances for which we could not identify a usage that maps to the described AUP usage model.

Figure 11.
Visualization of the events modeling the user–device interaction for four consecutive days from the DS1 dataset. On the OX axis is represented the time, and on the OY axis, the user–device interaction state is represented with possible values of 0 and 1.
Figure 11.
Visualization of the events modeling the user–device interaction for four consecutive days from the DS1 dataset. On the OX axis is represented the time, and on the OY axis, the user–device interaction state is represented with possible values of 0 and 1.

Figure 12.
Results obtained by applying the prediction pipeline: two days of user–device interactions are predicted using LSTM. The green color is used to represent the real signal; the yellow color is the predicted signal. On the OX axis is represented the predicted hour (48 values because the predicting period is for two days) and on the OY axis is represented the predicted value expressing the number of seconds during the corresponding hour when the user is interacting with the device.


Table 1.
Table representing the syntactic descriptor as part of instantiating the GenSyD methodology.
Table 1.
Table representing the syntactic descriptor as part of instantiating the GenSyD methodology.
| Feature | Feature Type |
|---|---|
| Timestamp | Data time |
| User–device interaction state | Set of values {0, 1} |
Table 2.
Series of user–device interaction events.
| Timestamp | User–Device Interaction State |
|---|---|
| 2023-01-04 08:04:35 | 1 |
| 2023-01-04 08:05:35 | 0 |
| 2023-01-04 08:15:02 | 1 |
| 2023-01-04 08:15:58 | 0 |
| 2023-01-04 20:11:00 | 1 |
| 2023-01-04 20:11:35 | 0 |
Table 3.
Result of computing the next event and the duration between consecutive events based on the series of user–device interaction events defined in Table 2.
Table 3.
Result of computing the next event and the duration between consecutive events based on the series of user–device interaction events defined in Table 2.
| Timestamp | User–Device Interaction State | Next Event Timestamp | Next Event State | Time in [s] between Events |
|---|---|---|---|---|
| 2023-01-04 08:04:35 | 1 | 2023-01-04 08:05:35 | 0 | 60 |
| 2023-01-04 08:05:35 | 0 | 2023-01-04 08:15:02 | 1 | 567 |
| 2023-01-04 08:15:02 | 1 | 2023-01-04 08:15:58 | 0 | 56 |
| 2023-01-04 08:15:58 | 0 | 2023-01-04 20:11:00 | 1 | 42,902 |
| 2023-01-04 20:11:00 | 1 | 2023-01-04 20:11:35 | 0 | 35 |
| 2023-01-04 20:11:35 | 0 | - | - | - |
Table 4.
Subset of the data presented in Table 3 that is relevant for computing the duration of the user–device interaction signal.
Table 4.
Subset of the data presented in Table 3 that is relevant for computing the duration of the user–device interaction signal.
| Timestamp | User–Device Interaction State | Next Event Timestamp | Next Event State | Time in [s] between Events |
|---|---|---|---|---|
| 2023-01-04 08:04:35 | 1 | 2023-01-04 08:05:35 | 0 | 60 |
| 2023-01-04 08:05:35 | 0 | 2023-01-04 08:15:02 | 1 | 567 |
| 2023-01-04 08:15:02 | 1 | 2023-01-04 08:15:58 | 0 | 56 |
| 2023-01-04 08:15:58 | 0 | 2023-01-04 20:11:00 | 1 | 42,902 |
| 2023-01-04 20:11:00 | 1 | 2023-01-04 20:11:35 | 0 | 35 |
| 2023-01-04 20:11:35 | 0 | - | - | - |
Table 5.
Subset of the data presented in Table 3 that is relevant for computing the duration between consecutive interactions of the user with the smart device.
Table 5.
Subset of the data presented in Table 3 that is relevant for computing the duration between consecutive interactions of the user with the smart device.
| Timestamp | Door State | Next Event Timestamp | Next Event Door State | Time in [s] between Events |
|---|---|---|---|---|
| 2023-01-04 08:04:35 | 1 | 2023-01-04 08:05:35 | 0 | 60 |
| 2023-01-04 08:05:35 | 0 | 2023-01-04 08:15:02 | 1 | 567 |
| 2023-01-04 08:15:02 | 1 | 2023-01-04 08:15:58 | 0 | 56 |
| 2023-01-04 08:15:58 | 0 | 2023-01-04 20:11:00 | 1 | 42,902 |
| 2023-01-04 20:11:00 | 1 | 2023-01-04 20:11:35 | 0 | 35 |
| 2023-01-04 20:11:35 | 0 | - | - | - |
Table 6.
Description of the appliances used in extracting the real-data descriptors for constructing the real-world data descriptors of the generated synthetic data.
Table 6.
Description of the appliances used in extracting the real-data descriptors for constructing the real-world data descriptors of the generated synthetic data.
| Appliance ID | Nb. Recording Days | Nb. Interaction Events | Outliers % | |
|---|---|---|---|---|
| Appliance 1 | 188 | 3797 | 0.010 | exponnorm |
| Appliance 2 | 761 | 22,825 | 0.010 | exponnorm |
| Appliance 3 | 184 | 59 | 0.035 | exponnorm |
| Appliance 4 | 526 | 36,589 | 0.009 | exponnorm |
| Appliance 5 | 404 | 15,586 | 0.010 | exponweib |
| Appliance 6 | 614 | 22,009 | 0.009 | exponweib |
| Appliance 7 | 184 | 14,388 | 0.009 | exponweib |
| Appliance 8 | 289 | 173 | 0.011 | exponnorm |
| Appliance 9 | 117 | 2135 | 0.010 | exponweib |
| Appliance 10 | 164 | 6192 | 0.010 | exponweib |
| Appliance 11 | 175 | 4853 | 0.010 | exponweib |
| Appliance 12 | 1118 | 13,682 | 0.010 | exponweib |
| Appliance 13 | 563 | 17,296 | 0.008 | exponweib |
| Appliance 14 | 1397 | 3466 | 0.010 | exponweib |
| Appliance 15 | 168 | 5883 | 0.010 | exponnorm |
| Appliance 16 | 1397 | 2785 | 0.010 | exponweib |
| Appliance 17 | 234 | 9842 | 0.010 | exponweib |
| Appliance 18 | 1049 | 10,980 | 0.010 | exponweib |
| Appliance 19 | 66 | 3944 | 0.010 | exponweib |
| Appliance 20 | 1396 | 1014 | 0.011 | exponweib |
| Appliance 21 | 482 | 21,986 | 0.010 | exponweib |
| Appliance 22 | 197 | 7881 | 0.009 | exponweib |
| Appliance 23 | 188 | 3797 | 0.010 | exponnorm |
| Appliance 24 | 259 | 9893 | 0.010 | exponweib |
| Appliance 25 | 384 | 3423 | 0.010 | exponweib |
| Appliance 26 | 202 | 107 | 0.019 | exponweib |
| Appliance 27 | 570 | 18,598 | 0.009 | exponweib |
| Appliance 28 | 1134 | 33,063 | 0.009 | exponweib |
| Appliance 29 | 1391 | 13,957 | 0.009 | exponweib |
| Appliance 30 | 396 | 12,915 | 0.010 | exponnorm |
| Appliance 31 | 319 | 20,229 | 0.009 | exponweib |
| Appliance 32 | 560 | 31,695 | 0.009 | exponweib |
| Appliance 33 | 532 | 2403 | 0.010 | exponweib |
| Appliance 34 | 994 | 1050 | 0.011 | exponweib |
| Appliance 35 | 203 | 11,701 | 0.010 | exponweib |
| Appliance 36 | 544 | 16,963 | 0.010 | exponweib |
| Appliance 37 | 226 | 215 | 0.009 | exponweib |
| Appliance 38 | 577 | 22,747 | 0.009 | exponweib |
| Appliance 39 | 274 | 13,368 | 0.009 | exponweib |
| Appliance 40 | 391 | 6128 | 0.010 | exponweib |
| Appliance 41 | 186 | 359 | 0.011 | exponweib |
| Appliance 42 | 394 | 4314 | 0.010 | exponweib |
| Appliance 43 | 639 | 14,047 | 0.010 | exponweib |
| Appliance 44 | 1396 | 9026 | 0.010 | exponweib |
| Appliance 45 | 477 | 15,814 | 0.010 | exponweib |
| Appliance 46 | 81 | 4844 | 0.010 | exponweib |
| Appliance 47 | 81 | 4844 | 0.010 | exponweib |
| Appliance 48 | 81 | 4844 | 0.010 | exponweib |
| Appliance 49 | 536 | 35,800 | 0.009 | exponweib |
| Appliance 50 | 536 | 35,800 | 0.009 | exponweib |
| Appliance 51 | 536 | 35,800 | 0.009 | exponweib |
Table 7.
Noise descriptor: Percentage of duplicate events found in the real data.
| Appliance ID | % Duplicate Events | Appliance ID | % Duplicate Events | Appliance ID | % Duplicate Events |
|---|---|---|---|---|---|
| Appliance 1 | 0.005267 | Appliance 21 | 0.001865 | Appliance 35 | 0.000171 |
| Appliance 4 | 0.002296 | Appliance 22 | 0.010912 | Appliance 38 | 0.000396 |
| Appliance 5 | 0.009881 | Appliance 23 | 0.005267 | Appliance 42 | 0.001854 |
| Appliance 6 | 0.002772 | Appliance 24 | 0.000606 | Appliance 43 | 0.010892 |
| Appliance 10 | 0.000807 | Appliance 27 | 0.001452 | Appliance 44 | 0.000886 |
| Appliance 11 | 0.000206 | Appliance 28 | 0.001875 | Appliance 45 | 0.006387 |
| Appliance 14 | 0.000577 | Appliance 29 | 0.001146 | Appliance 49 | 0.003045 |
| Appliance 16 | 0.002513 | Appliance 30 | 0.000852 | Appliance 50 | 0.003045 |
| Appliance 17 | 0.001626 | Appliance 32 | 0.002051 | Appliance 51 | 0.003045 |
Table 8.
Performance evaluation of the architectures using the RMSE and R-squared evaluation metrics.
Table 8.
Performance evaluation of the architectures using the RMSE and R-squared evaluation metrics.
| Dataset Identifier | RMSE | Rsquare |
|---|---|---|
| DS1 | 27.13 | 0.30 |
| DS2 | 12.09 | 0.10 |
| DS3 | 6.40 | 0.21 |
Disclaimer/Publisher’s Note: The statements, opinions and data contained in all publications are solely those of the individual author(s) and contributor(s) and not of MDPI and/or the editor(s). MDPI and/or the editor(s) disclaim responsibility for any injury to people or property resulting from any ideas, methods, instructions or products referred to in the content. |
© 2024 by the authors. Licensee MDPI, Basel, Switzerland. This article is an open access article distributed under the terms and conditions of the Creative Commons Attribution (CC BY) license (https://creativecommons.org/licenses/by/4.0/).
Share and Cite
MDPI and ACS Style
Tolas, R.; Portase, R.; Potolea, R. GeMSyD: Generic Framework for Synthetic Data Generation. Data 2024, 9, 14. https://doi.org/10.3390/data9010014
AMA Style
Tolas R, Portase R, Potolea R. GeMSyD: Generic Framework for Synthetic Data Generation. Data. 2024; 9(1):14. https://doi.org/10.3390/data9010014
Chicago/Turabian StyleTolas, Ramona, Raluca Portase, and Rodica Potolea. 2024. "GeMSyD: Generic Framework for Synthetic Data Generation" Data 9, no. 1: 14. https://doi.org/10.3390/data9010014