
Dataset for the Heat-Up and Heat Transfer towards Single Particles and Synthetic Particle Clusters from Particle-Resolved CFD Simulations


1
Institute of Chemical, Environmental & Bioscience Engineering, Technische Universität Wien, Getreidemarkt 9/166, 1060 Vienna, Austria
2
Area 4—Simulation and Analyses, K1-MET GmbH, Stahlstraße 14, 4020 Linz, Austria
*
Author to whom correspondence should be addressed.
†
These authors contributed equally to this work.
Data 2022, 7(2), 23; https://doi.org/10.3390/data7020023
Submission received: 11 January 2022
/
Revised: 10 February 2022
/
Accepted: 10 February 2022
/
Published: 14 February 2022
Abstract
:Heat transfer to particles is a key aspect of thermo-chemical conversion of pulverized fuels. These fuels tend to agglomerate in some areas of turbulent flow and to form particle clusters. Heat transfer and drag of such clusters are significantly different from single-particle approximations commonly used in Euler–Lagrange models. This fact prompted a direct numerical investigation of the heat transfer and drag behavior of synthetic particle clusters consisting of 44 spheres of uniform diameter (60 m). Particle-resolved computational fluid dynamic simulations were carried out to investigate the heat fluxes, the forces acting upon the particle cluster, and the heat-up times of particle clusters with multiple void fractions (0.477–0.999) and varying relative velocities (0.5–25 m/s). The integral heat fluxes and exact particle positions for each particle in the cluster, integral heat fluxes, and the total acting force, derived from steady-state simulations, are reported for 85 different cases. The heat-up times of individual particles and the particle clusters are provided for six cases (three cluster void fractions and two relative velocities each). Furthermore, the heat-up times of single particles with different commonly used representative particle diameters are presented. Depending on the case, the particle Reynolds number, the cluster void fraction, the Nusselt number, and the cluster drag coefficient are included in the secondary data.
Data Set:10.17632/97y842jr5m.1.
Data Set License: Creative Commons Attribution 4.0 International (CC BY 4.0).
1. Summary
Virtual prototyping and digital twins of industrial processes for investigation and optimization have become increasingly popular with increasing computational power. Pulverized coal boilers [1,2] and blast furnaces [3,4] show great potential for optimization using computational investigations. In both cases, pulverized fuel particles are injected into the furnace, where the thermo-chemical conversion starts immediately. Even though computational power has increased drastically in recent years, the fully resolved simulation of most industrial-scale processes is still not viable. In order to enable simulations of these processes, assumptions and simplifications need to be made.
For pulverized coal and blast furnaces, a common approach for modeling the pulverized fuel particles is the Eulerian–Lagrange (EL) approach. In EL models, the carrier phase is described as an Eulerian phase, while the fuel particles are tracked as Lagrangian particles. Usually, particles are lumped into parcels to reduce the computational effort. The parcels are assumed to consist of an arbitrary number of particles with a single representative size [5,6]. Heat transfer, mass transfer, and particle drag are calculated based on the representative particle diameter for each parcel, neglecting any agglomeration or grouping effects. It is essential to consider flow shielding, radiation shading, and other inter-particle effects to predict the particle heat up and the thermo-chemical conversion within particle clouds or dense particle jets correctly [7,8,9,10,11,12,13,14].
Lu et al. [15] used two immersed boundary methods to simulate the gas–solid heat transfer of dense particle packing in tubes. They provide plots of the heat transfer coefficients for each of the up-to-570 particles in the packing and for Reynolds numbers of up to 1800. They observed that the heat transfer coefficients of particles located at the fluid entrance section of the packing are higher than those located further downstream.
The particle resolved Viscous Penalty Method (VPM) was used by Chadil et al. [16] to determine the local and global Nusselt numbers of single spheres, a regular face-centered cubic array of spheres, and randomly arranged spheres. A good agreement of the global Nusselt number compared with different established correlations was found for low Reynolds numbers ( = 50 and 100) and void fractions of = 0.4–0.95.
The influence of the Reynolds number and void fraction on the overall convective heat transfer in randomly distributed arrays of spherical and sphero-cylindrical particles was shown by Tavassoli et al. [17] and Tavassoli et al. [18], respectively. For 180, the authors provide plots of the Nusselt numbers for three and six void fractions for spheres and sphero-cylinders, respectively.
All of the mentioned studies show how convective heat transfer is influenced by the relative velocity and the void fraction of clustered particles. Radiative heat transfer is neglected in all of them. None of the mentioned studies provide detailed and comprehensive information about the heat transfer or heat-up times of the individual particles in the arrangement. In most studies, the data are only presented graphically and are thus hard to retrieve and re-use.
Yin [19] shows the importance of particle radiation in pulverized coal-fired utility boilers. They state that an accurate description of the particles’ emissivity and scattering properties influences the temperature and reaction extend of the coal particles, the temperature profiles in the furnace, and thus the entire combustion process. Possible particle clustering effects are not taken into account.
To evaluate the effect of particle clustering on the heat transfer, heat-up, and drag behavior of pulverized fuels in high-temperature environments, clusters with various cluster void fractions were constructed. Using particle-resolved direct numerical simulation synthetic particle clusters with various cluster void fractions at different relative velocities, we derived models that do consider particle clustering effects in EL simulations in the main research paper: Bösenhofer et al. [20]. A detailed description of the data gathered in [20] is presented here.
The data set presented in the current work includes additional information about convective and radiative heat fluxes, averaged particle temperatures, and the particle position of each particle in the cluster. The data presented in this article can help understand the convective and radiative heat transfer, and drag behavior of single particles in a clustered arrangement and particle clusters at void fractions close to packed beds up to single spheres. Heat transfer and drag models can be derived from the data. The influence of flow shading and radiation shielding on the heat transfer and particle heat-up depending on the particle’s position in the cluster can be investigated. Thus, the presented data have the potential to improve the simulation of heat transfer in any turbulent gas–solid flow where clustering effects occur. These phenomena include, among others, pulverized particle combustion, pulverized carbon carrier injection in iron making, or pharmaceutical and chemical processes. Correct heat transfer prediction and the associated improvements of the modeling results provide a huge potential to reduce the overall emission and to improve efficiencies of the target processes. The full dataset is available in Mendeley Data [21].
2. Data Description
The data presented in this work consist of the primary dataset (averaged simulated raw data) and secondary dataset, which is derived from the primary dataset.
2.1. Primary Dataset
The primary dataset represents three different computational fluid dynamics (CFD) simulations:
- Steady-state simulations (ST) of the flow around particle clusters (dataset 1, Table 1);
- Transient simulations (T) of the flow around particle clusters, including particle heat-up (dataset 2);
- Transient simulation of the flow around single spheres, including particle heat up (dataset 3).
As the raw data of a single case are too big to be presented here, the averaged particle temperatures, and integral heat fluxes and forces are provided here.
ad 1
The primary dataset consists of the data presented in Table 1 and the data provided in dataset 1.
Dataset 1 contains the case id, the exact position of particles in the cluster, the integral convective heat flux (in mW), and the integral radiative heat flux (in mW) for each individual particle in the cluster. The case id, relative velocity (in m/s), the distance between particles (in m), the integral convective heat flux , the integral radiative heat flux for the whole particle cluster, and the net force in flow direction F acting upon the particle cluster (in N) are presented in Table 1.
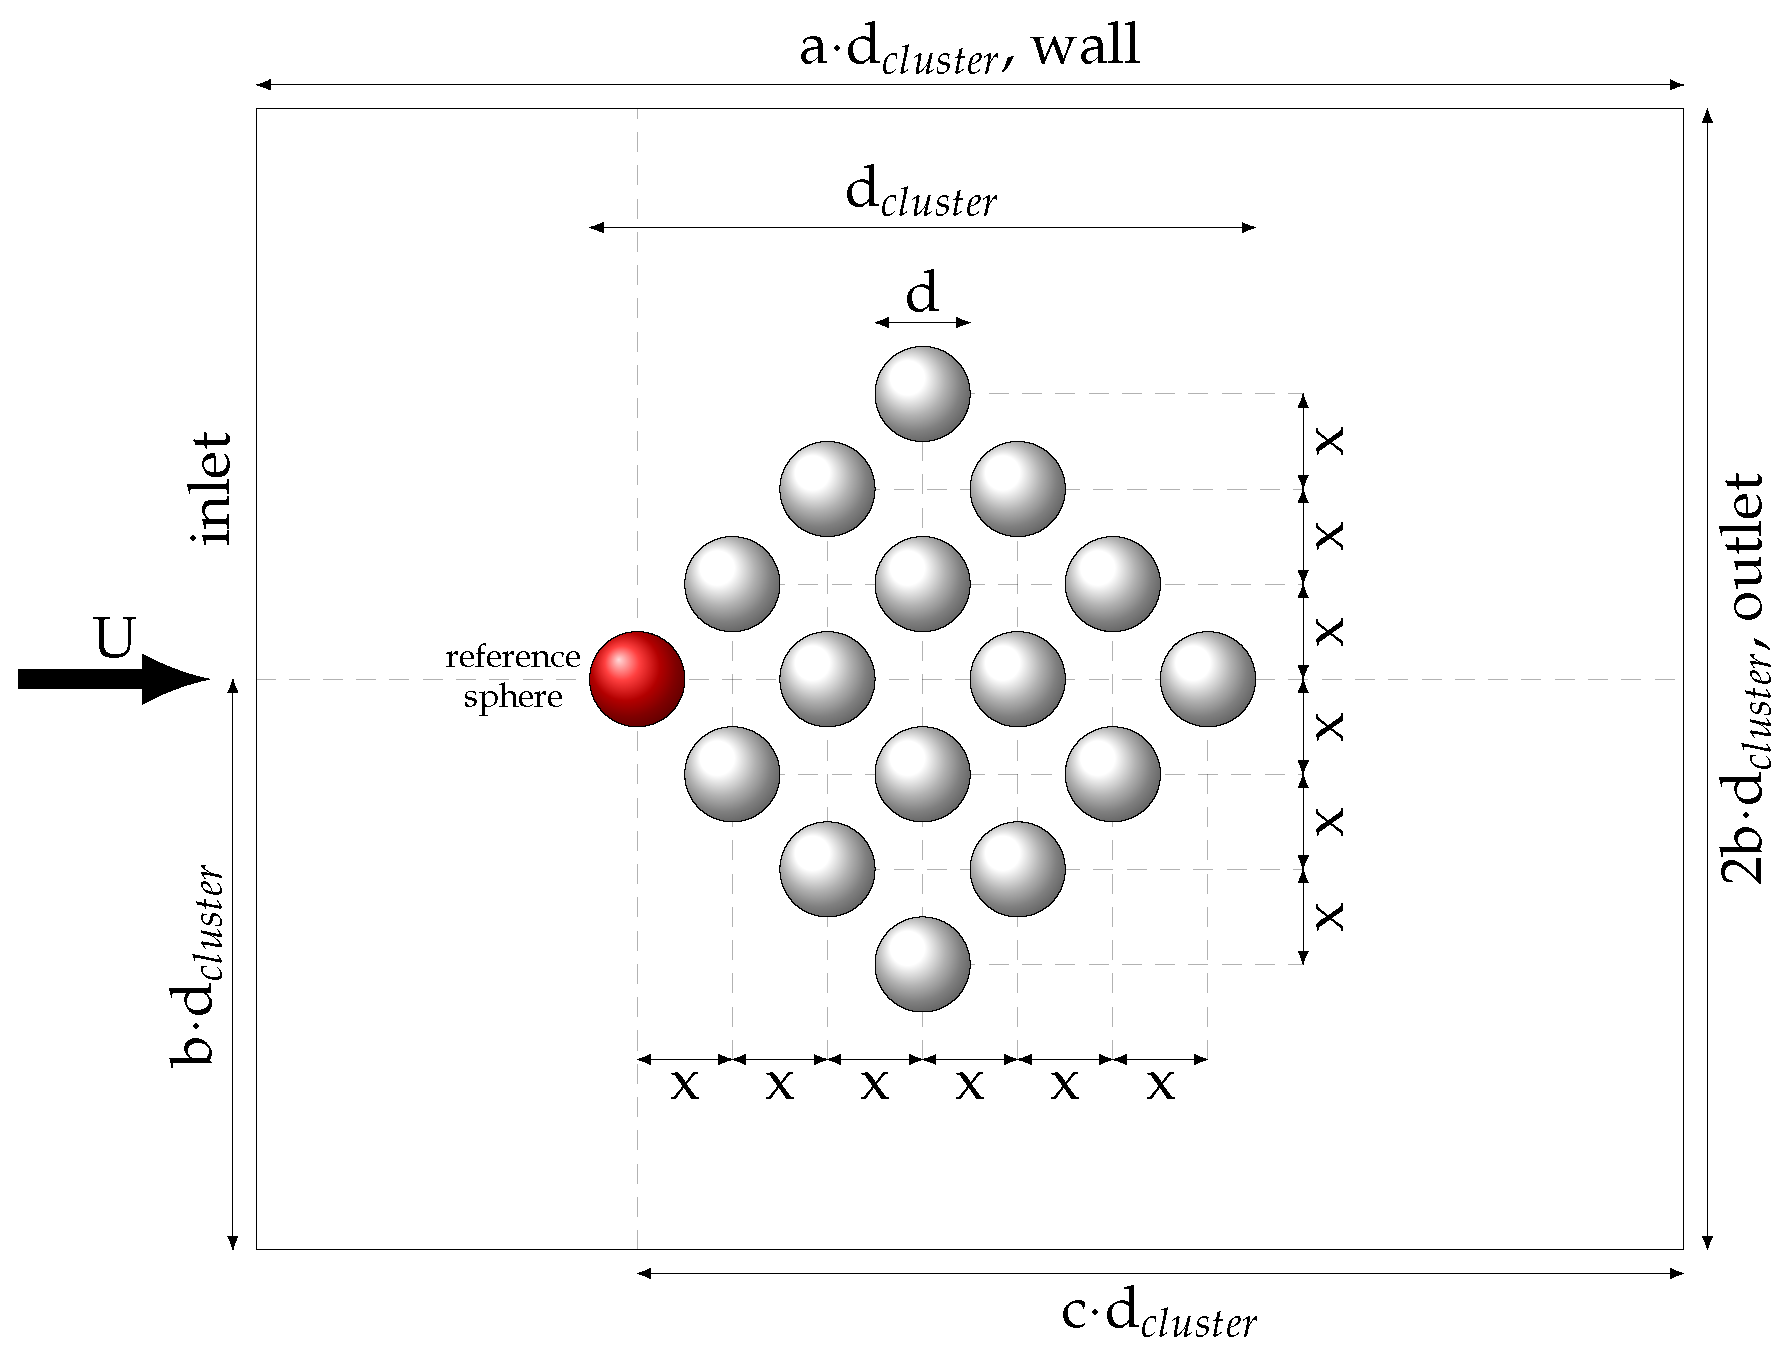
As the velocity of the particle clusters is zero, the relative velocity in Table 1 is the superficial velocity. The distance between particles is defined as the distance between particle centers. The convective and radiative heat fluxes are given as absolute values. Here, as the temperature of particles is lower than the temperature of the surroundings, and are the total heat fluxes from the surroundings to the particles or the cluster. The fluxes and forces presented in Table 1 are the integrated heat fluxes over all particles. The integrated heat fluxes for each individual particle and the exact particle position in the cluster are provided in dataset 1 for all cases ST1–ST85. Particle positions are given relative to the reference sphere marked in Figure 1. Cases ST61–ST65 represent single sphere simulations. Cases ST66–ST85 are simulations of random clusters with a particle size distribution (PSD) according to the Weibull distribution [22].
ad 2
Dataset 2 contains the mass averaged temperature profile (in K) and the exact position of each individual particle in the cluster for conditions given in Table 2. The data are provided for simulation with and without radiation-coupled regions.
ad 3
Dataset 3 contains the mass averaged sphere temperature profile (in K) of size equivalent (SE), mass equivalent (ME), area equivalent (AE), and area and mass equivalent (AME) single-sphere simulations. Simulation conditions are shown in Table 3.
2.2. Secondary Dataset
The secondary dataset contains additional information, derived from the primary dataset. This includes the particle Reynolds number Rep (all cases), the cluster void fraction (cases ST1–ST85 and T1–T6), the Nusselt number Nu, and the cluster drag coefficient (cases ST1–ST85). Secondary data are included in Table 1, Table 2 and Table 3.
3. Methods
3.1. Simulation Setup and Conditions
The synthetic particle clusters were constructed as regular rhomboid-shaped to enable a systematic approach. The distance between particles was varied to evaluate the influence of the cluster void fraction on the drag and heat transfer behavior. Void fractions were chosen to close the gap from loosely packed beds (void fraction = 0.477) to single particles in cross flow ( 1). This range of void fractions represents solid-to-gas mass ratios of 1737 to 1 for = 0.477 to 0.999, respectively. For pulverized fuel particles injected by dense-phase pneumatic conveying, the initial solid-to-gas mass ratio can exceed 100 [23,24,25,26]. It is known that particles tend to cluster randomly in turbulent flows [8,27,28]. To account for this, simulations for four randomly shaped particle clusters with a fixed void fraction consisting of spheres with a particle size distribution according to the Weibull distribution were carried out.
The data were gathered from particle resolved direct numerical simulations using the open-source CFD toolbox OpenFOAM® v7 [29]. The particles were fixed in space to avoid numerical expensive moving and deforming meshes in the simulations and to allow for the investigation of different relative velocities. The numerical meshes consist of a base cell size of 60 m, with significant refinement in the wake of the cluster and towards the particles, resulting in up to 14 million cells. Simulations were carried out using the chtMultiRegionFoam solver, which couples fluid and solid regions explicitly in space and time. Radiation was modeled by the finite volume discrete ordinates model (fvDOM) [30] with 16 discrete rays. Gas phase radiation was modeled by gray mean absorption [31]. The boundary conditions are summarized in Table 4. A uniform fixed value was set for the velocity at the inlet patch, while a zero gradient, no slip and slip boundary condition was set at the outlet, the particles, and the remaining patches, respectively. The pressure was set to a fixed value at the outlet. A zero gradient boundary condition was used for all other patches. The temperature was fixed at the fluid inlet, while a zero gradient condition was imposed at all other patches. The particle surface temperature was set to a uniform fixed value in all steady-state simulations (ST1–ST85). For particle and cluster heat-up simulations (SE, ME, AE, AME single-sphere simulations, and T1–T6), a coupled boundary condition was used. This boundary condition couples the diffusive, convective, and radiative heat fluxes between the solid and fluid regions. All surfaces were treated as gray bodies with an emissivity of = 1. The inlet velocity was varied based on values given in Table 1, Table 2 and Table 3. The temperature of the gas at the inlet was set to 2500 K, and the pressure at the outlet was fixed to 5 bar . In ST1–ST85, the particle temperature was fixed to a value 2450 K. The initial temperature of particles in the transient simulations was set to 400 K.
The thermo-physical properties of the GRI3.0 mechanism [32] were applied for the gas phase species, while particle properties were kept constant (Table 5).
Single-sphere simulations for dataset 3 used the same case setup as the cluster simulations, with the exception of the cluster being replaced by a single sphere with diameter according to Table 3. The different sphere diameters present different commonly used representative particle diameters. Here, the particle clusters were substituted by a single particle with one of the following:
- A size equivalent sphere (SE): The single-sphere diameter is equal to the size of the particles in the cluster (d = 60 m);
- A mass equivalent sphere (ME): The single-sphere mass is equal to the mass of the cluster (d = 211.8 m);
- A surface area equivalent sphere (AE): The single-sphere surface area is equal to the surface area of the cluster (d = 397.8 m);
- A surface and mass equivalent sphere (AME): The single-sphere surface area and mass are equal to the cluster. The sphere diameter is equal to the AE case, but the particle density is reduced to 165.8 kg/m.
A cross section of the cluster’s simulation domain is shown in Figure 1. The size of the simulation domain in the cluster simulation was scaled with the cluster diameter using the constant scaling factors a, b, and c. The inlet velocity and cluster void fraction were varied according to Table 1 and Table 2. A constant particle diameter of 60 m was used in the cluster simulations, except for cases ST66–ST85, where a PSD was used.
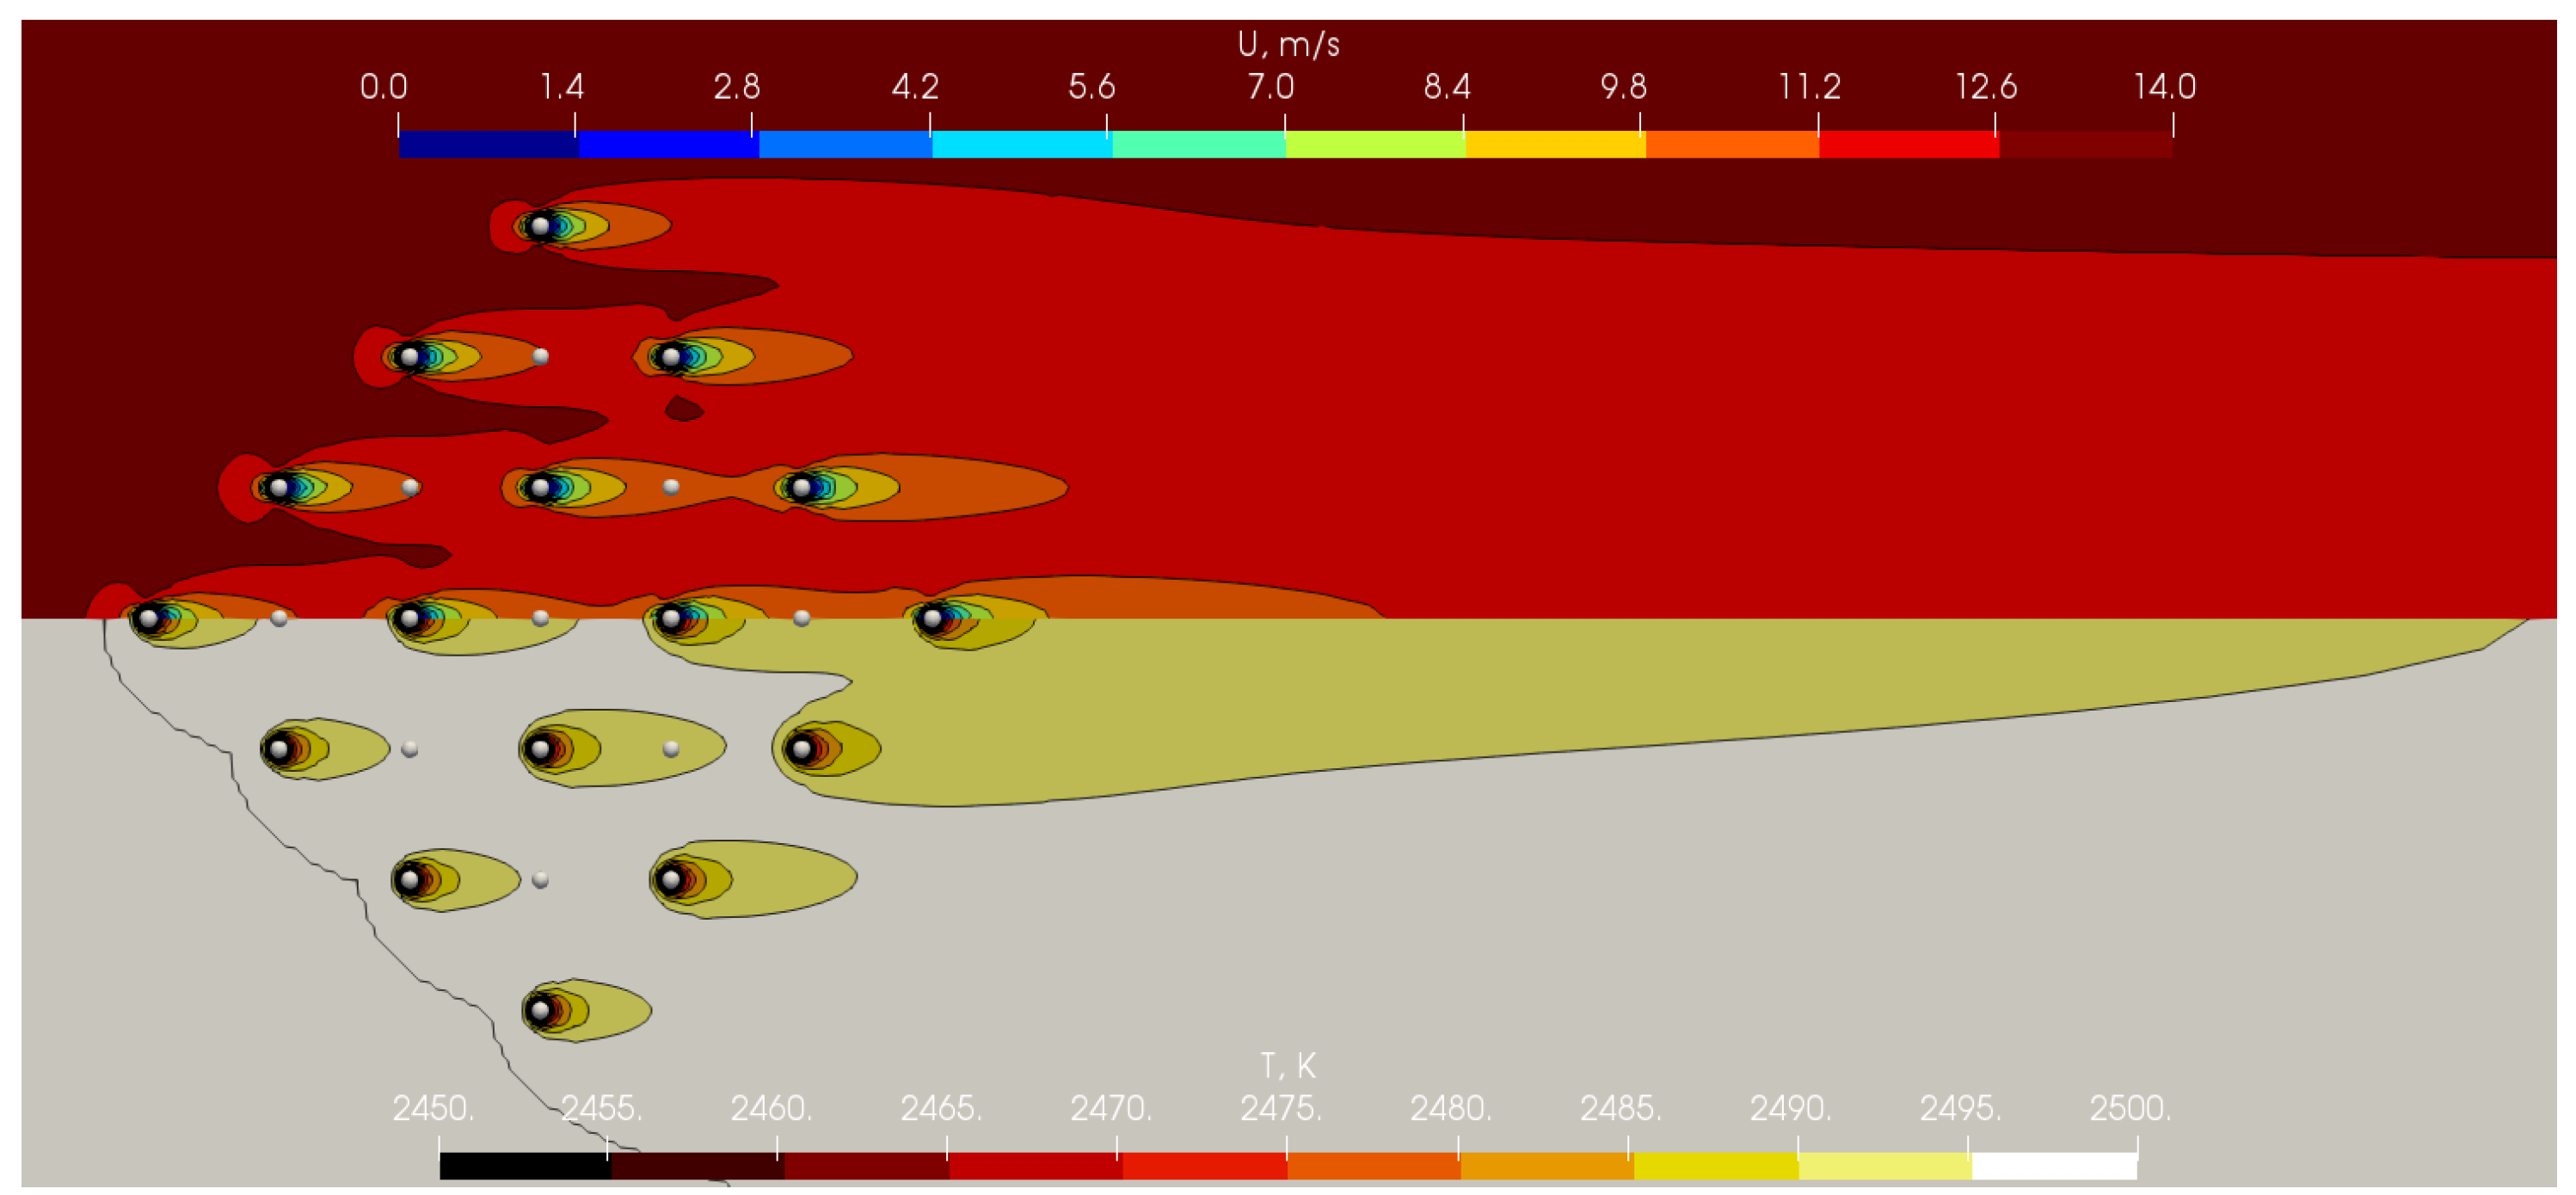
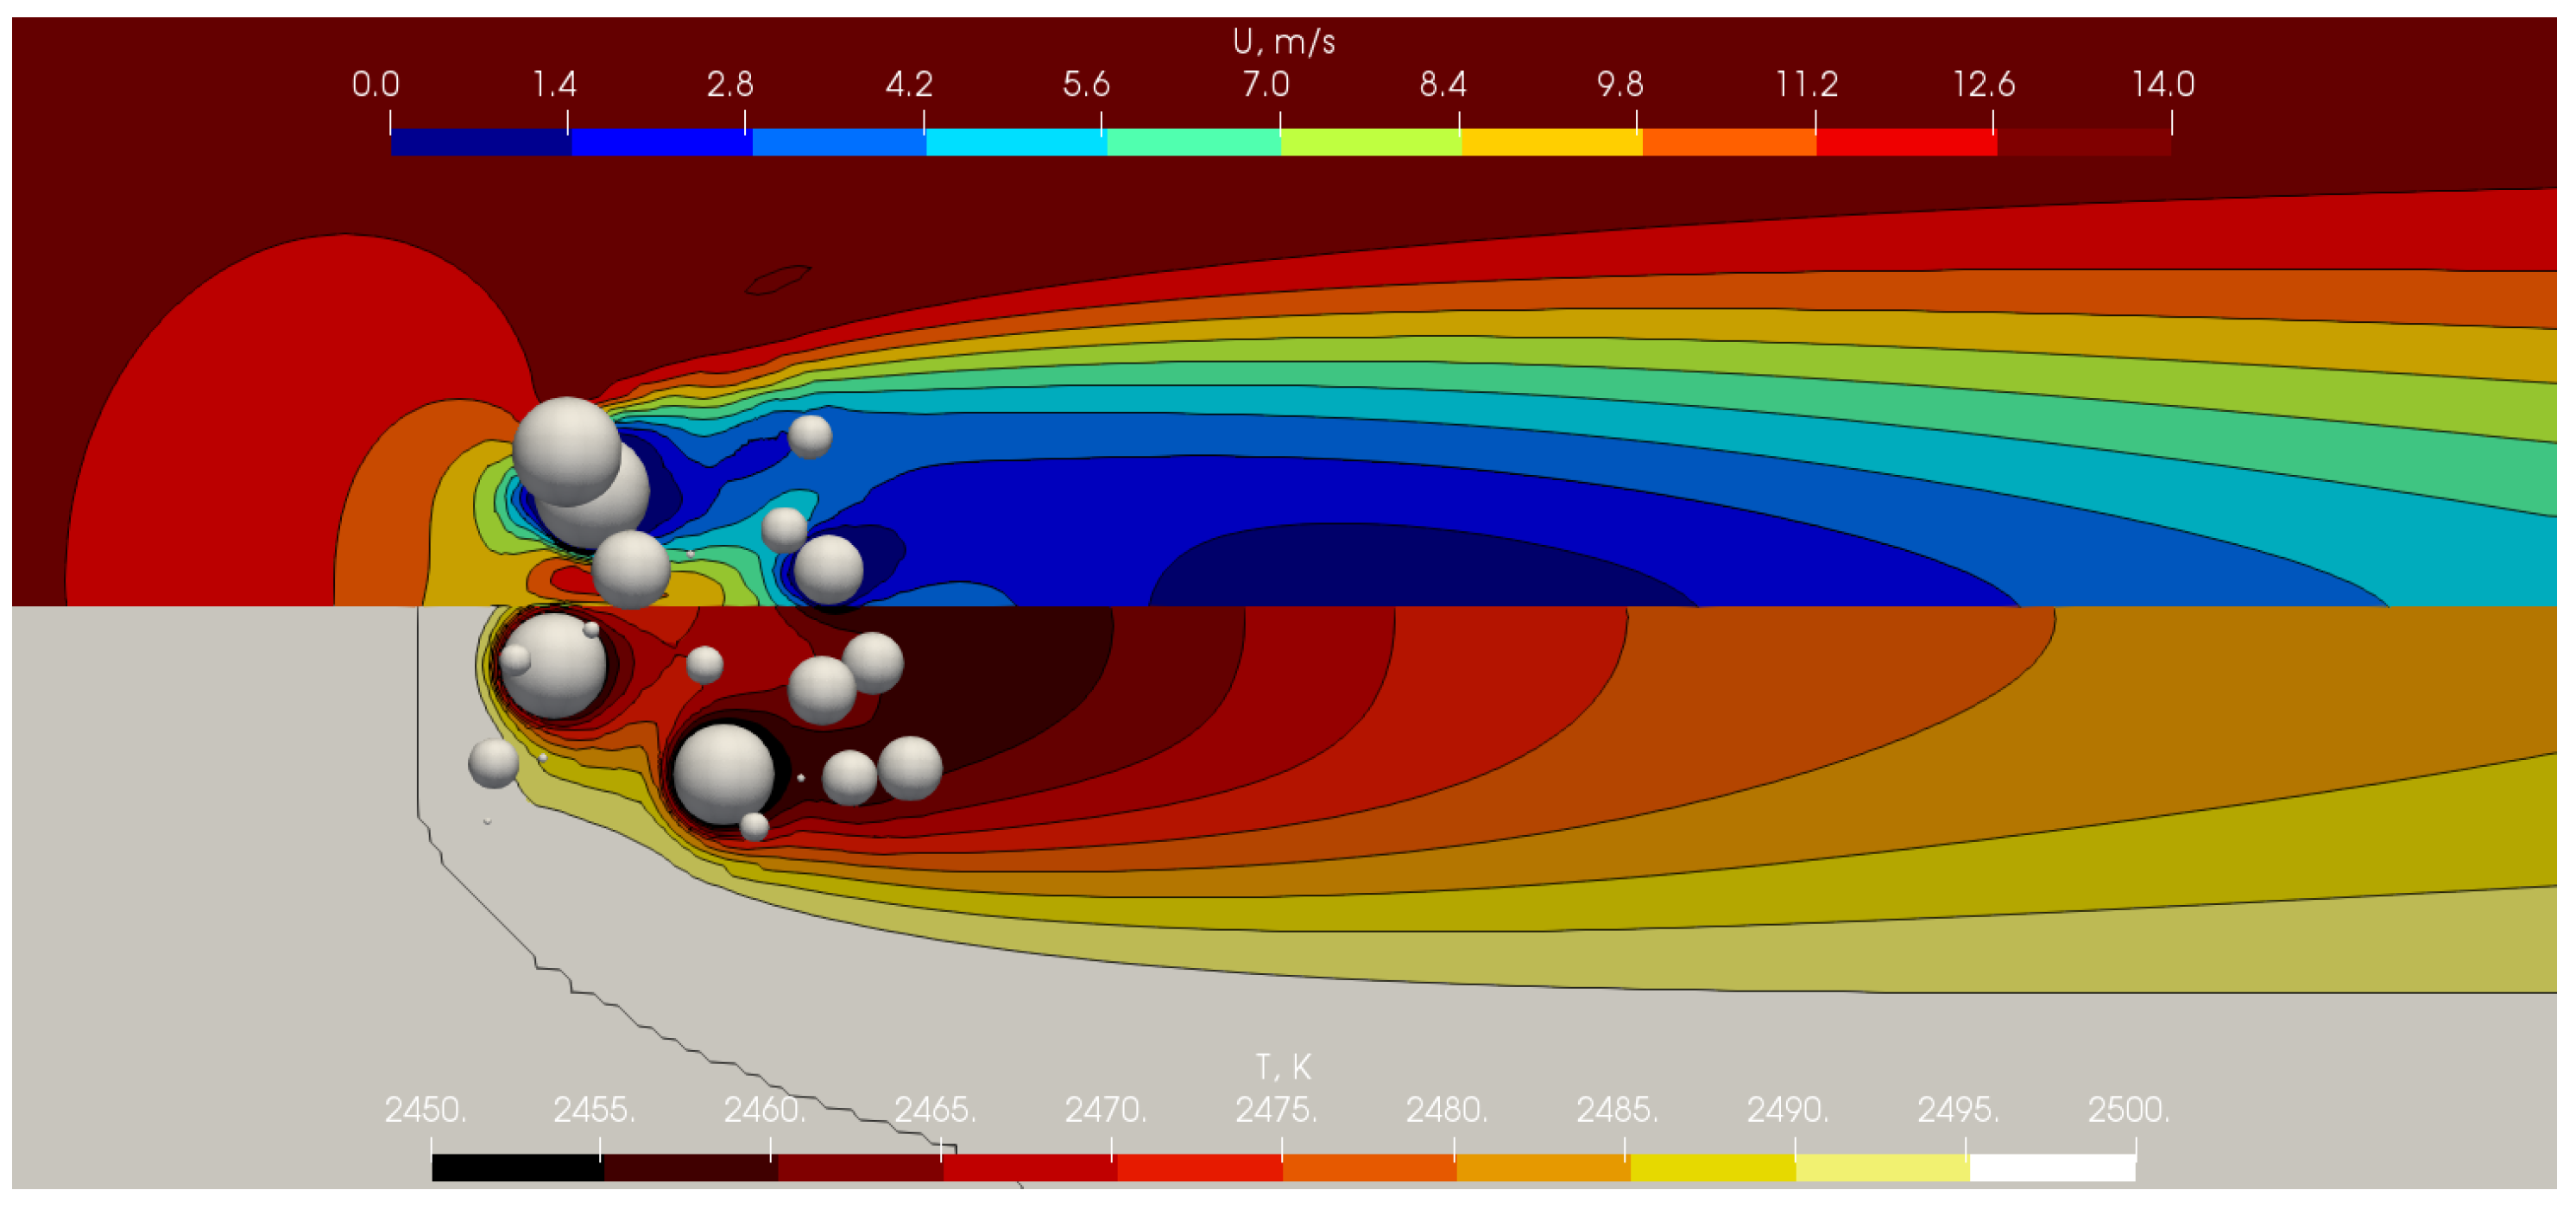
The resulting velocity and temperature field and the velocity and temperature contours in the horizontal cross section for cases ST4, ST29, ST59, and ST69 are shown in Figure 2, Figure 3, Figure 4 and Figure 5. Note that the whole cluster and not only the horizontal cross section is shown. Due to the file size for each case, the computational meshes and the respective fields cannot be provided.
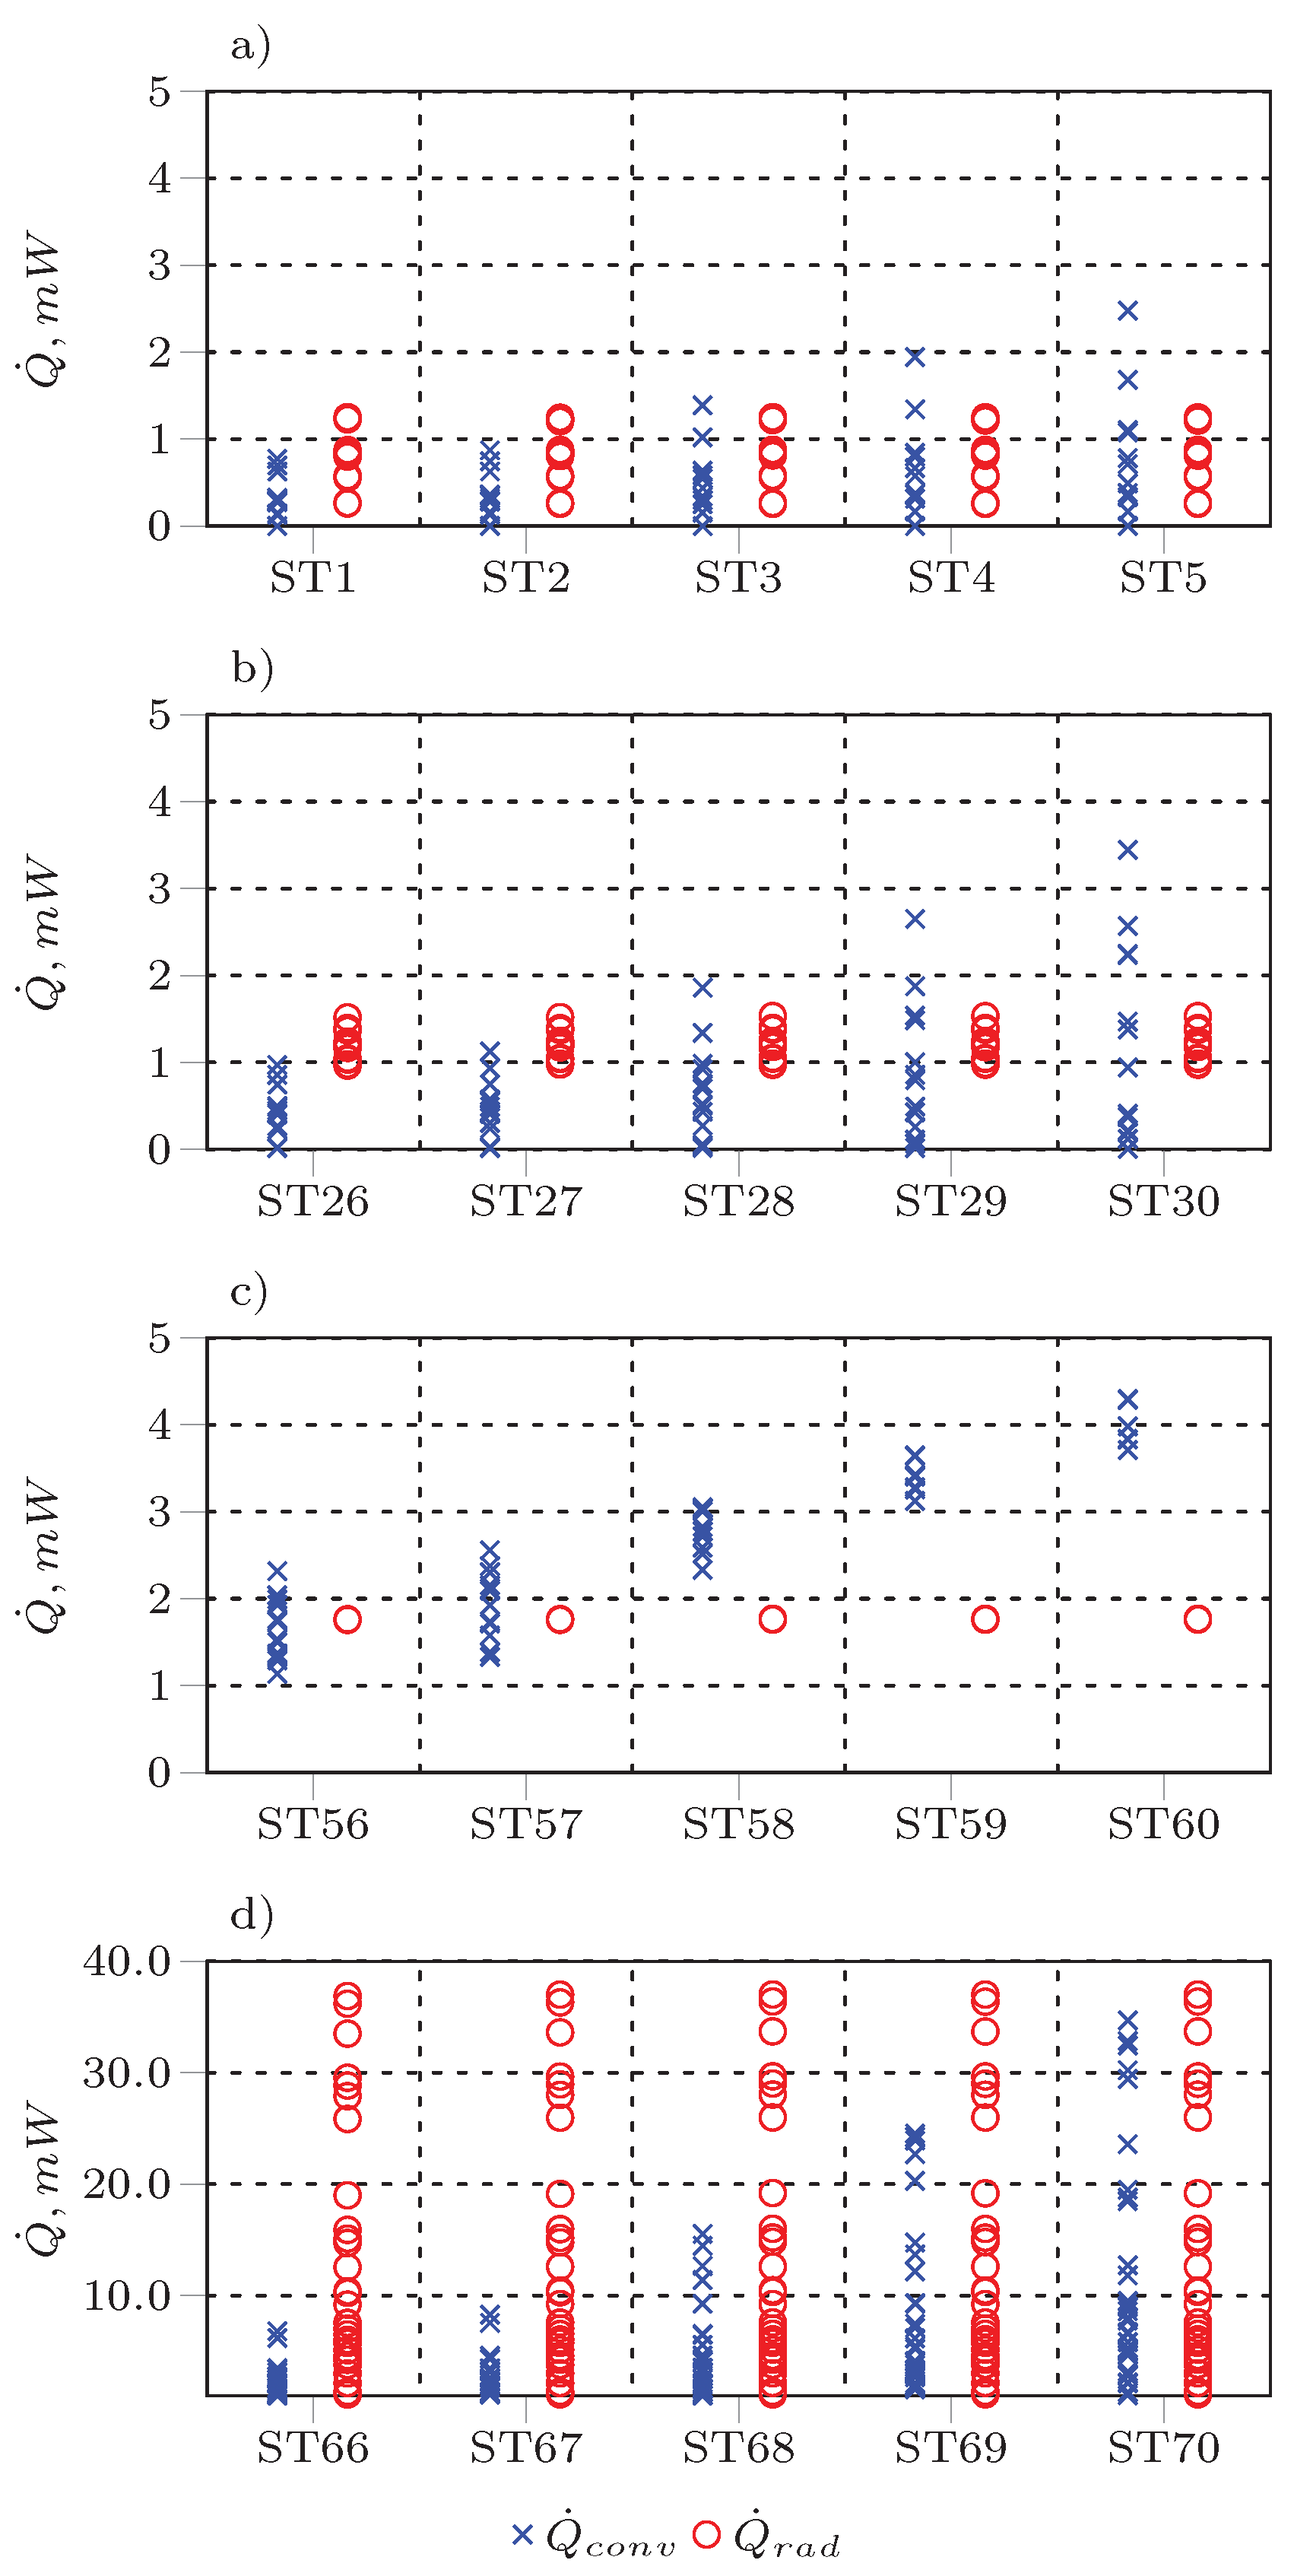
The convective () and radiative () heat fluxes of each sphere in the particle cluster for cases ST1–ST5, ST26–ST30, ST56–ST60, and ST66–ST70 are shown in Figure 6a–d, respectively.
3.2. Data Collection
Simulations ST1–ST85 were evaluated after a steady state was reached (steady value of the drag force and heat transfer rates). Transient simulations were carried out until the mean particle temperatures were close to the gas temperature (2500 K).
The cluster void fraction was calculated from Equation (1), where d is the particle diameter, x is half the distance between sphere centers (Figure 1), and 17.8251 is the graphically determined number of full spheres in the considered volume (the biggest possible rhomboid through the particle centers).
The particle temperature was calculated from the simulated cell values as the mass-weighted average using Equation (2), where is the particle density, V is the cell volume, T is the cell temperature, and N is the number of cells in the particle.
The particle Reynolds number , Nusselt number , and the drag coefficient are calculated from Equations (3)–(5), respectively [33,34]. Here, is the integrated cluster heat flux, T is the gas temperature at the inlet, T is the mass averaged cluster (dataset 1 and dataset 2) or particle (dataset 3) temperature, is the thermal conductivity of the gas, is the cluster (dataset 1 and dataset 2) or particle (dataset 3) surface area, and is the cluster cross-sectional area. All thermo-physical gas properties are calculated at 2500 K and 5 bar. Cases ST61–ST65 are the simulations of a single sphere in cross-flow. Cases ST66–ST85 represent random clusters with a particle size distribution according to the Weibull distribution (Equation (6)) [22] with a shape parameter of k = 1.14 and a scale parameter of = 120 m. The diameter used to calculate in Table 1 is the first moment of the PSD: = 114.5 m.
Author Contributions
Conceptualization, M.B.; methodology, M.B. and M.P.; software, M.B. and M.P.; validation, M.B. and M.P.; formal analysis, M.B.; investigation, M.B. and M.P.; resources, M.B. and M.P.; data curation, M.B. and M.P.; writing—original draft preparation, M.P.; writing—review and editing, M.B., M.P., and M.H.; visualization, M.B. and M.P.; supervision, M.H.; project administration, M.H.; funding acquisition, M.H. All authors have read and agreed to the published version of the manuscript.
Funding
This research was funded by FFG (Austrian Research Promotion Agency), grant numbers 844607 and 86929. The APC was funded by TU Wien Bibliothek. (Open Access Funding by TU Wien).
Institutional Review Board Statement
Not applicable.
Informed Consent Statement
Not applicable.
Data Availability Statement
The data presented in this study are openly available in Mendeley Data (10.17632/97y842jr5m.1, accessed on 10 January 2022) under the CC BY 4.0 licence.
Acknowledgments
The authors gratefully acknowledge the funding support of the K1-MET GmbH, metallurgical competence center. The research program of the competence center K1-MET is supported by COMET (Competence Center for Excellent Technologies), the Austrian program for competence centers. COMET is funded by the Federal Ministry for Transport, Innovation, and Technology; the Federal Ministry for Science, Research, and Economy; the provinces of Upper Austria, Tyrol, and Styria; and the Styrian Business Promotion Agency. The computational results presented have been achieved in part using the Vienna Scientific Cluster (VSC). The authors acknowledge the TU Wien University Library for financial support through its Open Access Funding Programme.
Conflicts of Interest
The authors declare no conflict of interest.
Abbreviations
The following abbreviations are used in this manuscript:
| AE | Surface area equivalent |
| AME | Surface area and mass equivalent |
| CFD | Computational fluid dynamics |
| fvDOM | Finite volume discrete ordinates model |
| ME | Mass equivalent |
| PSD | Particle size distribution |
| SE | Size equivalent |
| ST | Steady-state simulation |
| T | Transient simulation |
References
- Prokhorov, D.A.; Piralishvili, S.A. Numerical simulation of pulverized coal combustion and comparison with in-furnace measurements. AIP Conf. Proc. 2020, 2211, 040008. [Google Scholar] [CrossRef]
- Zheng, J.; Liu, P.; Shen, Z. Simulation of Turbulent Combustion in a Large Pulverized Coal Boiler Based on Turbulent Radiation Interaction and the Modified Soot Model. ACS Omega 2020, 5, 23822–23835. [Google Scholar] [CrossRef] [PubMed]
- Kuang, S.; Li, Z.; Yu, A. Review on Modeling and Simulation of Blast Furnace. Steel Res. Int. 2018, 89, 1700071. [Google Scholar] [CrossRef]
- Abhale, P.B.; Viswanathan, N.N.; Saxén, H. Numerical modelling of blast furnace—Evolution and recent trends. Miner. Process. Extr. Metall. 2020, 129, 166–183. [Google Scholar] [CrossRef]
- Zhong, W.; Yu, A.; Zhou, G.; Xie, J.; Zhang, H. CFD simulation of dense particulate reaction system: Approaches, recent advances and applications. Chem. Eng. Sci. 2016, 140, 16–43. [Google Scholar] [CrossRef]
- Zhou, L. Theory and Modeling of Dispersed Multiphase Turbulent Reacting Flows; Butterworth-Heinemann: Oxford, UK, 2018. [Google Scholar]
- Haugen, N.E.L.; Mitchell, R.E. Modeling radiation in particle clouds: On the importance of inter-particle radiation for pulverized solid fuel combustion. Heat Mass Transf. 2015, 51, 991–999. [Google Scholar] [CrossRef] [Green Version]
- Banko, A.J.; Villafañe, L.; Kim, J.H.; Esmaily, M.; Eaton, J.K. Stochastic modeling of direct radiation transmission in particle-laden turbulent flow. J. Quant. Spectrosc. Radiat. Transf. 2019, 226, 1–18. [Google Scholar] [CrossRef]
- Forgber, T.; Radl, S. A novel approach to calculate radiative thermal exchange in coupled particle simulations. Powder Technol. 2018, 323, 24–44. [Google Scholar] [CrossRef]
- Liberman, M.A.; Kleeorin, N.; Rogachevskii, I.; Haugen, N.E.L. Multipoint radiation induced ignition of dust explosions: Turbulent clustering of particles and increased transparency. Combust. Theory Model. 2018, 22, 1084–1102. [Google Scholar] [CrossRef] [Green Version]
- Bermúdez, A.; Ferrín, J.; Liñán, A.; Saavedra, L. Numerical simulation of group combustion of pulverized coal. Combust. Flame 2011, 158, 1852–1865. [Google Scholar] [CrossRef] [Green Version]
- Haugen, N.E.L.; Krüger, J.; Mitra, D.; Løvås, T. The effect of turbulence on mass transfer rates of small inertial particles with surface reactions. J. Fluid Mech. 2018, 836, 932–951. [Google Scholar] [CrossRef] [Green Version]
- Krüger, J.; Haugen, N.E.L.; Løvås, T. Correlation effects between turbulence and the conversion rate of pulverized char particles. Combust. Flame 2017, 185, 160–172. [Google Scholar] [CrossRef]
- Krüger, J.; Haugen, N.E.; Mitra, D.; Løvås, T. The effect of turbulent clustering on particle reactivity. Proc. Combust. Inst. 2017, 36, 2333–2340. [Google Scholar] [CrossRef] [Green Version]
- Lu, J.; Zhu, X.; Peters, E.; Verzicco, R.; Lohse, D.; Kuipers, J. Moving from momentum transfer to heat transfer—A comparative study of an advanced Graetz-Nusselt problem using immersed boundary methods. Chem. Eng. Sci. 2019, 198, 317–333. [Google Scholar] [CrossRef]
- Chadil, M.A.; Vincent, S.; Estivalèzes, J.L. Gas-Solid Heat Transfer Computation from Particle-Resolved Direct Numerical Simulations. Fluids 2022, 7, 15. [Google Scholar] [CrossRef]
- Tavassoli, H.; Kriebitzsch, S.; van der Hoef, M.; Peters, E.; Kuipers, J. Direct numerical simulation of particulate flow with heat transfer. Int. J. Multiph. Flow 2013, 57, 29–37. [Google Scholar] [CrossRef]
- Tavassoli, H.; Peters, E.; Kuipers, J. Direct numerical simulation of fluid-particle heat transfer in fixed random arrays of non-spherical particles. Chem. Eng. Sci. 2015, 129, 42–48. [Google Scholar] [CrossRef]
- Yin, C. On gas and particle radiation in pulverized fuel combustion furnaces. Appl. Energy 2015, 157, 554–561. [Google Scholar] [CrossRef]
- Bösenhofer, M.; Pichler, M.; Harasek, M. Heat Transfer Models for Dense Pulverized Particle Jets. Processes 2022, 10, 238. [Google Scholar] [CrossRef]
- Pichler, M.; Bösenhofer, M.; Harasek, M. Dataset for the heat-up and heat transfer towards single particles and synthetic particle clusters from particle resolved CFD simulations. Mendeley Data 2022. [Google Scholar] [CrossRef]
- Papoulis, A.; Pillai, S.U. Probability, Random Variables, and Stochastic Processes, 4th ed.; McGraw-Hill Series in Electrical and Computer Engineering; McGraw-Hill: Boston, MA, USA, 2002. [Google Scholar]
- Konrad, K. Dense-phase pneumatic conveying: A review. Powder Technol. 1986, 49, 1–35. [Google Scholar] [CrossRef]
- Cai, L.; Liu, S.; Pan, X.; Guiling, X.; Xiaoping, C.; Changsui, Z. Influence of carbonaceous powders on flow characteristics of dense-phase pneumatic conveying at high pressure. Exp. Therm. Fluid Sci. 2014, 58, 121–130. [Google Scholar] [CrossRef]
- Liang, C.; Xu, P.; Xu, G.; Chen, X.; Zhao, C.; Duan, L. Comparison on Flow Characteristics of Dense-phase Pneumatic Conveying of Biomass Powder and Pulverized coal at High Pressure. Energy Sources Part A Recover. Util. Environ. Eff. 2015, 37, 583–589. [Google Scholar] [CrossRef]
- Jin, Y.; Lu, H.; Guo, X.; Gong, X. Application of CPFD method in the simulation of vertical dense phase pneumatic conveying of pulverized coal. Powder Technol. 2019, 357, 343–351. [Google Scholar] [CrossRef]
- Squires, K.D.; Eaton, J.K. Preferential concentration of particles by turbulence. Phys. Fluids A Fluid Dyn. 1991, 3, 1169–1178. [Google Scholar] [CrossRef]
- Balachandar, S.; Eaton, J.K. Turbulent Dispersed Multiphase Flow. Annu. Rev. Fluid Mech. 2010, 42, 111–133. [Google Scholar] [CrossRef]
- Weller, H.G.; Tabor, G.; Jasak, H.; Fureby, C. A tensorial approach to computational continuum mechanics using object-oriented techniques. Comput. Phys. 1998, 12, 620–631. [Google Scholar] [CrossRef]
- Modest, M.F. Radiative Heat Transfer, 3rd ed.; Academic Press: New York, NY, USA, 2013. [Google Scholar]
- Grosshandler, W.L. RADCAL: A Narrow-Band Model for Radiation—Calculations in a Combustion Environment; Technical Note 1402; National Institute of Standards and Technology (NIST): Gaithersburg, MD, USA, 1993.
- Smith, G.P.; Golden, D.M.; Frenklach, M.; Moriarty, N.W.; Eiteneer, B.; Goldenberg, M.; Bowman, C.T.; Hanson, R.K.; Song, S.; Gardiner, W.C., Jr.; et al. GRI-Mech, Version 3.0; Software for Modelling Natural Gas Combustion; University of California: Berkeley, CA, USA, 2018; Available online: http://combustion.berkeley.edu/gri-mech/version30/text30.html (accessed on 10 January 2022).
- Karwa, R. Heat and Mass Transfer, 2nd ed.; Springer: Singapore, 2020. [Google Scholar] [CrossRef]
- Baehr, H.D.; Stephan, K. Wärme- und Stoffübertragung, 8th ed.; Springer: Berlin/Heidelberg, Germany, 2013. [Google Scholar] [CrossRef]
Figure 1.
Horizontal cross section of the particle cluster: 2·x is the distance between the particle centers, which is varied to obtain clusters with different void fractions. Cuts through all Cartesian axis planes look identical. The scaling factors of the simulation domain are a = 12, b = 3.75, and c = 10. Adapted from [20].

Figure 2.
Graphical representation of the full cluster, velocity field, temperature field, and the respective contours in the horizontal cross section for case ST4.
Figure 2.
Graphical representation of the full cluster, velocity field, temperature field, and the respective contours in the horizontal cross section for case ST4.

Figure 3.
Graphical representation of the full cluster, velocity field, temperature field, and the respective contours in the horizontal cross section for case ST29.
Figure 3.
Graphical representation of the full cluster, velocity field, temperature field, and the respective contours in the horizontal cross section for case ST29.

Figure 4.
Graphical representation of the full cluster, velocity field, temperature field, and the respective contours in the horizontal cross section for case ST59.
Figure 4.
Graphical representation of the full cluster, velocity field, temperature field, and the respective contours in the horizontal cross section for case ST59.

Figure 5.
Graphical representation of the full cluster, velocity field, temperature field, and the respective contours in the horizontal cross section for case ST69.
Figure 5.
Graphical representation of the full cluster, velocity field, temperature field, and the respective contours in the horizontal cross section for case ST69.

Figure 6.
Convective and radiative heat fluxes of each sphere in a cluster for different cases. (a) ST1–ST5, = 0.477, = 0.5–25 m/s; (b) ST26–ST30, = 0.867, = 0.5–25 m/s; (c) ST56–ST60, = 0.999, = 0.5–25 m/s; and (d) ST66–ST70, = 0.935, = 0.5–25 m/s.
Figure 6.
Convective and radiative heat fluxes of each sphere in a cluster for different cases. (a) ST1–ST5, = 0.477, = 0.5–25 m/s; (b) ST26–ST30, = 0.867, = 0.5–25 m/s; (c) ST56–ST60, = 0.999, = 0.5–25 m/s; and (d) ST66–ST70, = 0.935, = 0.5–25 m/s.


Table 1.
Summary particle cluster variations. Cases ST61–ST65 represent single sphere simulations. Cases ST66–ST85 are simulations of random clusters.
Table 1.
Summary particle cluster variations. Cases ST61–ST65 represent single sphere simulations. Cases ST66–ST85 are simulations of random clusters.
| Case | Distance | F | |||||||
|---|---|---|---|---|---|---|---|---|---|
| ID | (m/s) | 2·x () | () | () | () | (-) | (-) | (-) | (-) |
| ST1 | 0.5 | 95 | 12.44 | 33.67 | 0.107 | 0.477 | 0.29 | 0.208 | 9.937 |
| ST2 | 1 | 95 | 13.35 | 33.79 | 0.259 | 0.477 | 0.58 | 0.223 | 6.014 |
| ST3 | 5 | 95 | 18.26 | 33.98 | 1.890 | 0.477 | 2.88 | 0.305 | 1.753 |
| ST4 | 13 | 95 | 24.02 | 33.93 | 7.263 | 0.477 | 7.5 | 0.401 | 0.996 |
| ST5 | 25 | 95 | 29.88 | 33.93 | 19.467 | 0.477 | 14.42 | 0.499 | 0.722 |
| ST6 | 0.5 | 100 | 12.97 | 36.28 | 0.112 | 0.552 | 0.29 | 0.217 | 10.351 |
| ST7 | 1 | 100 | 13.91 | 36.48 | 0.272 | 0.552 | 0.58 | 0.232 | 6.312 |
| ST8 | 5 | 100 | 19.14 | 36.74 | 1.989 | 0.552 | 2.88 | 0.32 | 1.845 |
| ST9 | 13 | 100 | 25.23 | 36.74 | 7.685 | 0.552 | 7.5 | 0.422 | 1.054 |
| ST10 | 25 | 100 | 31.50 | 36.75 | 20.721 | 0.552 | 14.42 | 0.526 | 0.769 |
| ST11 | 0.5 | 110 | 13.91 | 41.07 | 0.120 | 0.663 | 0.29 | 0.232 | 11.104 |
| ST12 | 1 | 110 | 15.04 | 40.81 | 0.295 | 0.663 | 0.58 | 0.251 | 6.832 |
| ST13 | 5 | 110 | 20.88 | 41.04 | 2.186 | 0.663 | 2.88 | 0.349 | 2.027 |
| ST14 | 13 | 110 | 27.71 | 40.99 | 8.558 | 0.663 | 7.5 | 0.463 | 1.174 |
| ST15 | 25 | 110 | 34.95 | 41.00 | 23.360 | 0.663 | 14.42 | 0.584 | 0.867 |
| ST16 | 0.5 | 120 | 15.05 | 44.15 | 0.131 | 0.741 | 0.29 | 0.251 | 12.117 |
| ST17 | 1 | 120 | 16.21 | 44.04 | 0.319 | 0.741 | 0.58 | 0.271 | 7.394 |
| ST18 | 5 | 120 | 22.64 | 44.34 | 2.408 | 0.741 | 2.88 | 0.378 | 2.233 |
| ST19 | 13 | 120 | 30.32 | 44.32 | 9.539 | 0.741 | 7.5 | 0.507 | 1.309 |
| ST20 | 25 | 120 | 38.86 | 44.32 | 26.380 | 0.741 | 14.42 | 0.649 | 0.979 |
| ST21 | 0.5 | 130 | 15.91 | 46.80 | 0.136 | 0.796 | 0.29 | 0.266 | 12.622 |
| ST22 | 1 | 130 | 17.32 | 46.63 | 0.335 | 0.796 | 0.58 | 0.289 | 7.765 |
| ST23 | 5 | 130 | 24.50 | 46.82 | 2.595 | 0.796 | 2.88 | 0.409 | 2.407 |
| ST24 | 13 | 130 | 33.11 | 46.78 | 10.417 | 0.796 | 7.5 | 0.553 | 1.429 |
| ST25 | 25 | 130 | 43.36 | 46.79 | 29.175 | 0.796 | 14.42 | 0.725 | 1.082 |
| ST26 | 0.5 | 150 | 17.98 | 51.60 | 0.152 | 0.867 | 0.29 | 0.3 | 14.11 |
| ST27 | 1 | 150 | 19.68 | 51.87 | 0.371 | 0.867 | 0.58 | 0.329 | 8.599 |
| ST28 | 5 | 150 | 28.30 | 52.00 | 3.018 | 0.867 | 2.88 | 0.473 | 2.799 |
| ST29 | 13 | 150 | 39.53 | 51.96 | 12.437 | 0.867 | 7.5 | 0.661 | 1.706 |
| ST30 | 25 | 150 | 54.44 | 51.97 | 35.616 | 0.867 | 14.42 | 0.91 | 1.321 |
| ST31 | 0.5 | 170 | 20.02 | 56.19 | 0.168 | 0.909 | 0.29 | 0.335 | 15.543 |
| ST32 | 1 | 170 | 22.01 | 56.80 | 0.408 | 0.909 | 0.58 | 0.368 | 9.455 |
| ST33 | 5 | 170 | 32.26 | 56.91 | 3.454 | 0.909 | 2.88 | 0.539 | 3.203 |
| ST34 | 13 | 170 | 46.41 | 56.88 | 14.577 | 0.909 | 7.5 | 0.776 | 2 |
| ST35 | 25 | 170 | 68.67 | 56.89 | 42.449 | 0.909 | 14.42 | 1.147 | 1.575 |
| ST36 | 0.5 | 190 | 22.09 | 60.58 | 0.184 | 0.935 | 0.29 | 0.369 | 17.046 |
| ST37 | 1 | 190 | 24.36 | 61.27 | 0.450 | 0.935 | 0.58 | 0.407 | 10.425 |
| ST38 | 5 | 190 | 36.13 | 61.84 | 3.907 | 0.935 | 2.88 | 0.604 | 3.624 |
| ST39 | 13 | 190 | 54.56 | 61.82 | 16.840 | 0.935 | 7.5 | 0.912 | 2.311 |
| ST40 | 25 | 190 | 85.11 | 61.82 | 49.511 | 0.935 | 14.42 | 1.422 | 1.837 |
| ST41 | 0.5 | 243 | 27.13 | 69.11 | 0.226 | 0.969 | 0.29 | 0.453 | 20.925 |
| ST42 | 1 | 243 | 30.39 | 69.54 | 0.571 | 0.969 | 0.58 | 0.508 | 13.242 |
| ST43 | 5 | 243 | 48.25 | 69.78 | 5.138 | 0.969 | 2.88 | 0.806 | 4.765 |
| ST44 | 13 | 243 | 81.44 | 69.71 | 22.742 | 0.969 | 7.5 | 1.361 | 3.12 |
| ST45 | 25 | 243 | 126.84 | 69.75 | 65.175 | 0.969 | 14.42 | 2.12 | 2.418 |
| ST46 | 0.5 | 415 | 42.53 | 75.34 | 0.381 | 0.994 | 0.29 | 0.711 | 35.376 |
| ST47 | 1 | 415 | 47.25 | 72.91 | 0.924 | 0.994 | 0.58 | 0.817 | 21.421 |
| ST48 | 5 | 415 | 86.07 | 72.90 | 8.582 | 0.994 | 2.88 | 1.51 | 7.96 |
| ST49 | 13 | 415 | 123.93 | 72.98 | 33.143 | 0.994 | 7.5 | 2.269 | 4.547 |
| ST50 | 25 | 415 | 151.88 | 73.02 | 65.175 | 0.994 | 14.42 | 2.852 | 2.999 |
| ST51 | 0.5 | 523 | 50.73 | 76.45 | 0.464 | 0.997 | 0.29 | 0.848 | 43.021 |
| ST52 | 1 | 523 | 59.50 | 76.55 | 1.112 | 0.997 | 0.58 | 0.994 | 25.784 |
| ST53 | 5 | 523 | 107.17 | 76.80 | 9.788 | 0.997 | 2.88 | 1.791 | 9.079 |
| ST54 | 13 | 523 | 146.13 | 76.75 | 34.939 | 0.997 | 7.5 | 2.442 | 4.794 |
| ST55 | 25 | 523 | 176.33 | 76.77 | 82.860 | 0.997 | 14.42 | 2.947 | 3.074 |
| ST56 | 0.5 | 892 | 73.07 | 77.40 | 0.650 | 0.999 | 0.29 | 1.221 | 60.304 |
| ST57 | 1 | 892 | 86.13 | 77.46 | 1.541 | 0.999 | 0.58 | 1.439 | 35.732 |
| ST58 | 5 | 892 | 126.38 | 77.60 | 11.153 | 0.999 | 2.88 | 2.112 | 10.345 |
| ST59 | 13 | 892 | 155.00 | 77.56 | 36.614 | 0.999 | 7.5 | 2.59 | 5.024 |
| ST60 | 25 | 892 | 181.95 | 77.63 | 85.594 | 0.999 | 14.42 | 3.041 | 3.176 |
| ST61 | 0.5 | - | 2.56 | 1.67 | 0.023 | 1.0 | 0.29 | 1.881 | 93.069 |
| ST62 | 1 | - | 2.67 | 1.71 | 0.046 | 1.0 | 0.58 | 1.96 | 46.797 |
| ST63 | 5 | - | 3.11 | 1.77 | 0.272 | 1.0 | 2.88 | 2.289 | 11.107 |
| ST64 | 13 | - | 3.70 | 1.77 | 0.877 | 1.0 | 7.5 | 2.718 | 5.293 |
| ST65 | 25 | - | 4.34 | 1.77 | 2.056 | 1.0 | 14.42 | 3.189 | 3.357 |
| ST66 | 0.5 | random | 69.191 | 424.35 | 0.479 | 0.935 | 0.55 | 0.337 | 6.79 |
| ST67 | 1 | random | 81.276 | 426.044 | 1.533 | 0.935 | 1.1 | 0.396 | 5.432 |
| ST68 | 5 | random | 148.308 | 426.835 | 16.824 | 0.935 | 5.5 | 0.723 | 2.385 |
| ST69 | 13 | random | 272.243 | 426.59 | 79.151 | 0.935 | 14.31 | 1.327 | 1.660 |
| ST70 | 25 | random | 414.315 | 426.671 | 231.505 | 0.935 | 27.51 | 2.020 | 1.313 |
| ST71 | 0.5 | random | 49.13 | 246.538 | 0.342 | 0.935 | 0.55 | 0.419 | 8.508 |
| ST72 | 1 | random | 56.543 | 246.799 | 1.078 | 0.935 | 1.1 | 0.482 | 6.694 |
| ST73 | 5 | random | 97.819 | 248.35 | 10.987 | 0.935 | 5.5 | 0.835 | 2.730 |
| ST74 | 13 | random | 173.922 | 248.247 | 50.813 | 0.935 | 14.31 | 1.484 | 1.868 |
| ST75 | 25 | random | 263.083 | 248.362 | 147.545 | 0.935 | 27.51 | 2.245 | 1.466 |
| ST76 | 0.5 | random | 53.215 | 269.667 | 0.388 | 0.935 | 0.55 | 0423 | 8.981 |
| ST77 | 1 | random | 61.628 | 270.173 | 1.142 | 0.935 | 1.1 | 0.490 | 6.602 |
| ST78 | 5 | random | 112.043 | 271.776 | 12.243 | 0.935 | 5.5 | 0.891 | 2.831 |
| ST79 | 13 | random | 198.243 | 271.734 | 55.261 | 0.935 | 14.31 | 1.576 | 1.890 |
| ST80 | 25 | random | 285.621 | 271.82 | 153.915 | 0.935 | 27.51 | 2.270 | 1.423 |
| ST81 | 0.5 | random | 53.154 | 291.935 | 0.360 | 0.935 | 0.55 | 0.372 | 7.328 |
| ST82 | 1 | random | 61.436 | 292.783 | 1.109 | 0.935 | 1.1 | 0.430 | 5.648 |
| ST83 | 5 | random | 105.758 | 294.213 | 11.465 | 0.935 | 5.5 | 0.741 | 2.336 |
| ST84 | 13 | random | 182.935 | 294.125 | 52.640 | 0.935 | 14.31 | 1.282 | 1.587 |
| ST85 | 25 | random | 283.918 | 294.176 | 154.529 | 0.935 | 27.51 | 1.989 | 1.260 |
Table 2.
Summary of transient cluster heat-up cases (dataset 2). Adapted from [20].
Table 2.
Summary of transient cluster heat-up cases (dataset 2). Adapted from [20].
| Case | Distance | |||
|---|---|---|---|---|
| ID | (m/s) | (-) | (-) | 2·x () |
| T1 | 0.5 | 0.29 | 0.552 | 100 |
| T2 | 13 | 7.50 | 0.552 | 100 |
| T3 | 0.5 | 0.29 | 0.741 | 120 |
| T4 | 13 | 7.50 | 0.741 | 120 |
| T5 | 0.5 | 0.29 | 0.935 | 190 |
| T6 | 13 | 7.50 | 0.935 | 190 |
Table 3.
Summary of transient single sphere heat-up cases (dataset 3). Adapted from [20].
Table 3.
Summary of transient single sphere heat-up cases (dataset 3). Adapted from [20].
| Case | m | |||
|---|---|---|---|---|
| ID | (m/s) | () | (-) | (kg) |
| SE1 | 0.5 | 60 | 0.29 | 1.24 × 10⁻¹⁰ |
| SE2 | 13 | 60 | 7.50 | 1.24 × 10⁻¹⁰ |
| ME1 | 0.5 | 211.8 | 1.02 | 5.47 × 10⁻⁹ |
| ME2 | 13 | 211.8 | 26.46 | 5.47 × 10⁻⁹ |
| AE1 | 0.5 | 397.8 | 1.91 | 3.63 × 10⁻⁸ |
| AE2 | 13 | 397.8 | 49.70 | 3.63 × 10⁻⁸ |
| AME1 | 0.5 | 397.8 | 1.91 | 5.47 × 10⁻⁹ |
| AME2 | 13 | 397.8 | 49.70 | 5.47 × 10⁻⁹ |
Table 4.
Summary boundary conditions. Adapted from [20].
Table 4.
Summary boundary conditions. Adapted from [20].
| Patch | U | p | T | I |
|---|---|---|---|---|
| inlet | fixed value | zero gradient | fixed value | gray body |
| outlet | zero gradient | fixed value | zero gradient | gray body |
| wall | slip | zero gradient | zero gradient | gray body |
| fluid to solid | no slip | zero gradient | coupled | gray body |
Table 5.
Gas phase composition and thermo-physical properties as well as solid thermo-physical properties used in the simulations. Adapted from [20].
Table 5.
Gas phase composition and thermo-physical properties as well as solid thermo-physical properties used in the simulations. Adapted from [20].
| Bulk Gas Phase Thermo-Physical Properties | |
|---|---|
| density () | 0.69 kg/m3 |
| specific heat capacity () | 1300 J/(kg K) |
| thermal conductivity () | 0.133 W/(m K) |
| viscosity () | 7.213·10−5 Pa s |
| Solid Thermo-Physical Properties | |
| density () | 1100 kg/m3 |
| emissivity () | 1 |
| specific heat capacity () | 1660 J/(kg K) |
| thermal conductivity () | 1.241 W/(m K) |
Publisher’s Note: MDPI stays neutral with regard to jurisdictional claims in published maps and institutional affiliations. |
© 2022 by the authors. Licensee MDPI, Basel, Switzerland. This article is an open access article distributed under the terms and conditions of the Creative Commons Attribution (CC BY) license (https://creativecommons.org/licenses/by/4.0/).
Share and Cite
MDPI and ACS Style
Pichler, M.; Bösenhofer, M.; Harasek, M. Dataset for the Heat-Up and Heat Transfer towards Single Particles and Synthetic Particle Clusters from Particle-Resolved CFD Simulations. Data 2022, 7, 23. https://doi.org/10.3390/data7020023
AMA Style
Pichler M, Bösenhofer M, Harasek M. Dataset for the Heat-Up and Heat Transfer towards Single Particles and Synthetic Particle Clusters from Particle-Resolved CFD Simulations. Data. 2022; 7(2):23. https://doi.org/10.3390/data7020023
Chicago/Turabian StylePichler, Mario, Markus Bösenhofer, and Michael Harasek. 2022. "Dataset for the Heat-Up and Heat Transfer towards Single Particles and Synthetic Particle Clusters from Particle-Resolved CFD Simulations" Data 7, no. 2: 23. https://doi.org/10.3390/data7020023