Data Descriptor

Measurement and Numerical Modeling of Cell-Free Protein Synthesis: Combinatorial Block-Variants of the PURE System

1
Sciences Department, Roma Tre University, V.le G. Marconi 446, I-00146 Rome, Italy
2
Chemistry Department, University of Bari “Aldo Moro”, Via Orabona 4, I-70125 Bari, Italy
3
DiSTeBA, University of Salento, Ecotekne, I-73100 Lecce, Italy
*
Author to whom correspondence should be addressed.
Submission received: 30 August 2018 / Revised: 25 September 2018 / Accepted: 11 October 2018 / Published: 14 October 2018

Abstract

:
Protein synthesis is at the core of bottom-up construction of artificial cellular mimics. Intriguingly, several reports have revealed that when a transcription–translation (TX–TL) kit is encapsulated inside lipid vesicles (or water-in-oil droplets), high between-vesicles diversity is observed in terms of protein synthesis rate and yield. Stochastic solute partition can be a major determinant of these observations. In order to verify that the variation of TX–TL components concentration brings about a variation of produced protein rate and yield, here we directly measure the performances of the ‘PURE system’ TX–TL kit variants. We report and share the kinetic traces of the enhanced Green Fluorescent Protein (eGFP) synthesis in bulk aqueous phase, for 27 combinatorial block-variants. The eGFP production is a sensitive function of TX–TL components concentration in the explored concentration range. Providing direct evidence that protein synthesis yield and rate actually mirror the TX–TL composition, this study supports the above-mentioned hypothesis on stochastic solute partition, without excluding, however, the contribution of other factors (e.g., inactivation of components).
Dataset: The full dataset of eGFP synthesis (concentration vs. time profiles for 27 PURE system variants) is published as a supplement to this paper in the journal Data.
Dataset License: CC-BY-NC

Graphical Abstract

1. Summary

The laboratory construction of semi-synthetic minimal cells [1,2,3,4,5,6,7,8] is one of the most well-known bottom-up synthetic biology projects. It was conceived within the context of “chemical autopoiesis” [9,10,11], mainly promoted by Pier Luigi Luisi and collaborators. It consists of the building of cell-like systems of minimal complexity by encapsulation of (bio)chemicals inside lipid vesicles (i.e., liposomes), see Figure 1a. One of the milestones on the roadmap toward the construction of minimal cells is the production of proteins inside liposomes. This is achieved by employing cell-free systems that perform transcription (TX) and translation (TL) reactions based on a given DNA sequence. The TX–TL ‘machinery’ is composed of about 80 macromolecules (RNA polymerase, ribosomes, tRNAs, aminoacyl-tRNA synthetases, etc.) and dozens of small molecules (nucleotides, amino acids, salts, etc.). Liposomes are prepared so that the whole TX–TL machinery is entrapped in their aqueous lumen, in order to produce a desired protein inside (Figure 1b). A protein-synthesizing liposome is therefore a key structure that is necessary for further elaborations and further assembly of more complex cell-like system.
The synthesis of proteins inside liposomes has been reported for the first time in 1999 (synthesis of poly(Phe) [13]) and in 2001 (synthesis of GFP [14]). Since then, dozens of articles have investigated several aspects of this key reaction (reviewed in [15]). One interesting and recurrent observation is that populations of protein-synthesizing vesicles display quite high between-vesicles ‘diversity’ (i.e., variance). We have recently discussed in detail these observations [16], providing an interpretation based on extrinsic stochastic effects (solute partition effects) [17]. These refer to stochastic entrapment, in the status nascendi vesicles, of the TX–TL components due to stochastic fluctuation of solution density, or to solute-membrane interaction, or to additional effects [18]. In particular, we suggest that a major determinant for between-vesicle protein synthesis diversity is the compositional diversity of vesicle content (in terms of TX–TL components).
The Protein synthesis Using Recombinant Elements (PURE) system [19,20] is a TX–TL kit of minimal complexity, whose composition is well known, see Table 1. Many studies aiming at producing proteins inside lipid vesicles have been based on the encapsulation of the PURE system [21,22].
In order to directly verify that changes in the PURE system composition in individual vesicles can justify changes in protein synthesis (in terms of rate and yield), here we report a detailed study of PURE system ‘variants’. In particular, we purposely modify the PURE system composition and measure the concentration-versus-time profiles of the produced protein. As it will be specified below, PURE systems variants actually are ‘block-variants’, meaning that PURE system components have been changed as blocks (and not one by one). Results show that protein production is a sensitive function of TX–TL components concentration in the explored concentration range. Providing direct evidence that protein synthesis yield and rate actually mirror the TX–TL composition, this study supports the above-mentioned hypothesis on stochastic solute partition, without excluding, however, the contribution of other factors (e.g., inactivation of components) [23]. However, whereas inactivation of components can account for the reduction of TX–TL activity, this argument cannot easily explain cases when an enhanced activity is observed.

2. Data Description

The dataset described in this paper refers to the synthesis of enhanced Green Fluorescent Protein (eGFP) by PURE system block-variants. The dataset consists in eGFP concentration versus time curves, available for 27 different PURE system block-variants. The dataset will be described and discussed, including a simple kinetic model, in Section 2.2, Section 2.3, Section 2.4 and Section 2.5.
To give a more specific idea of the experimental results that motivated us to study the variation of protein synthesis with the concentration of TX–TL components, in Section 2.1 we shortly report on the typical protein synthesis pattern measured in microcompartments.

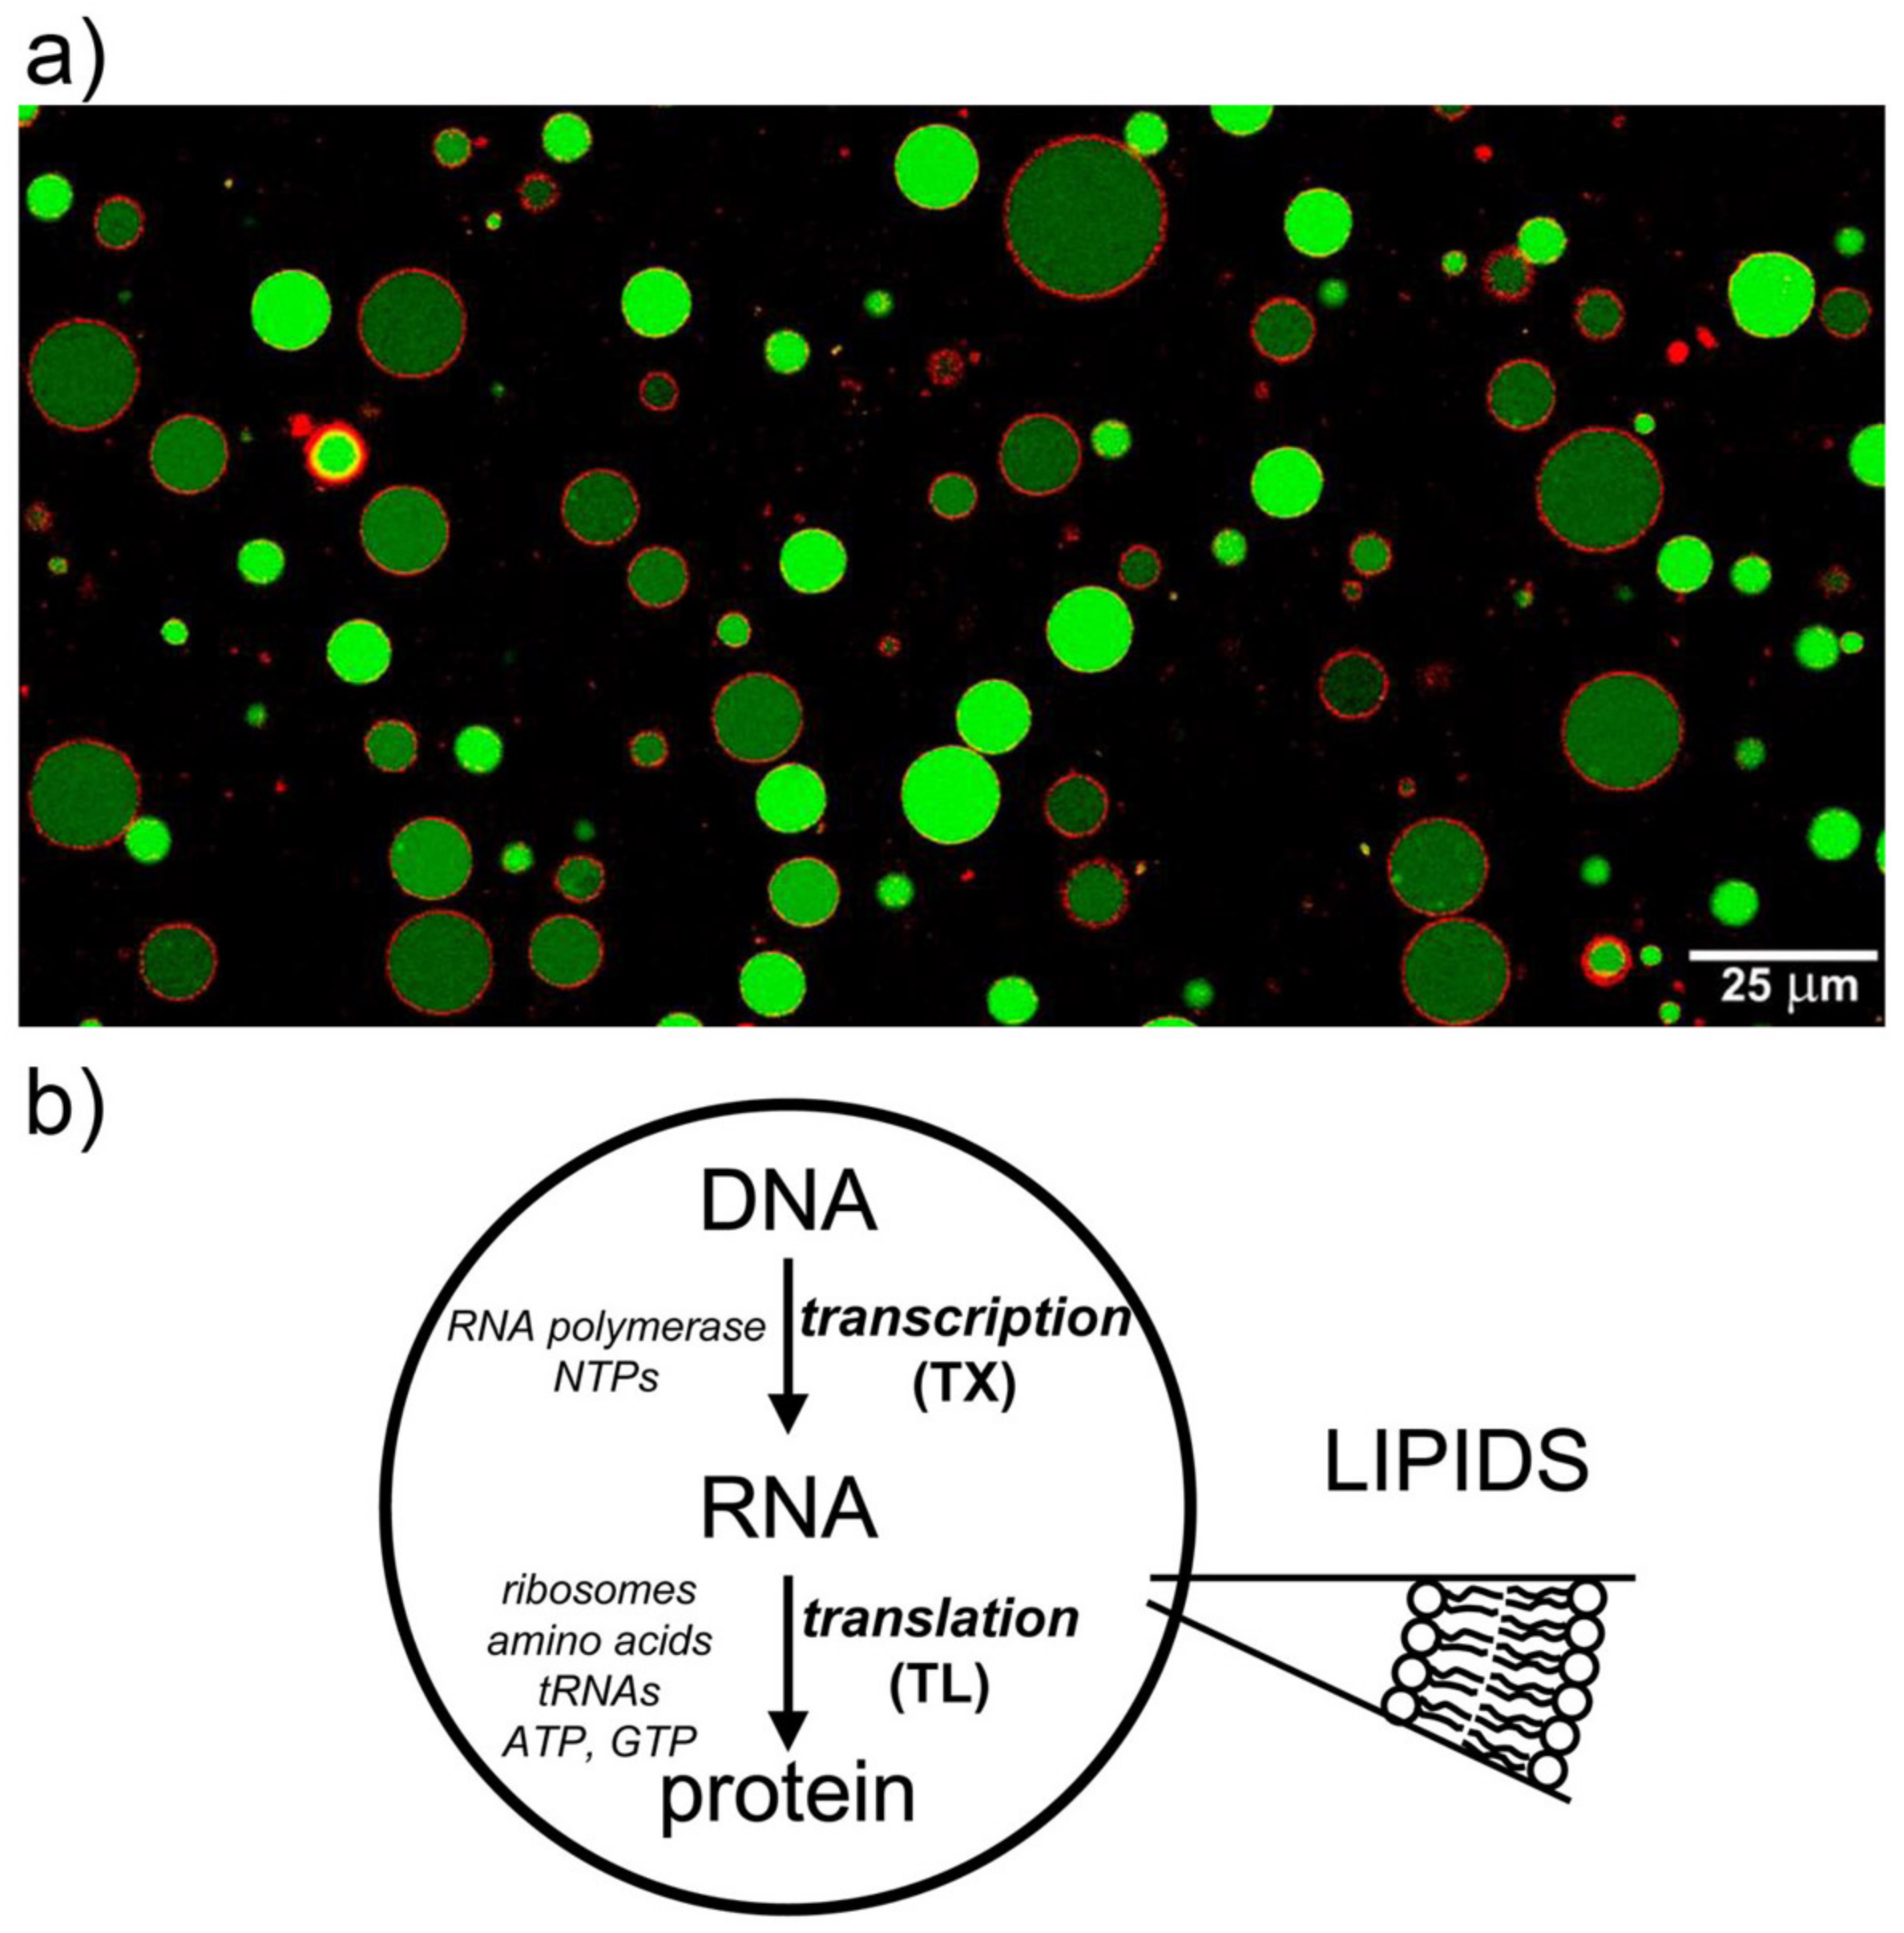
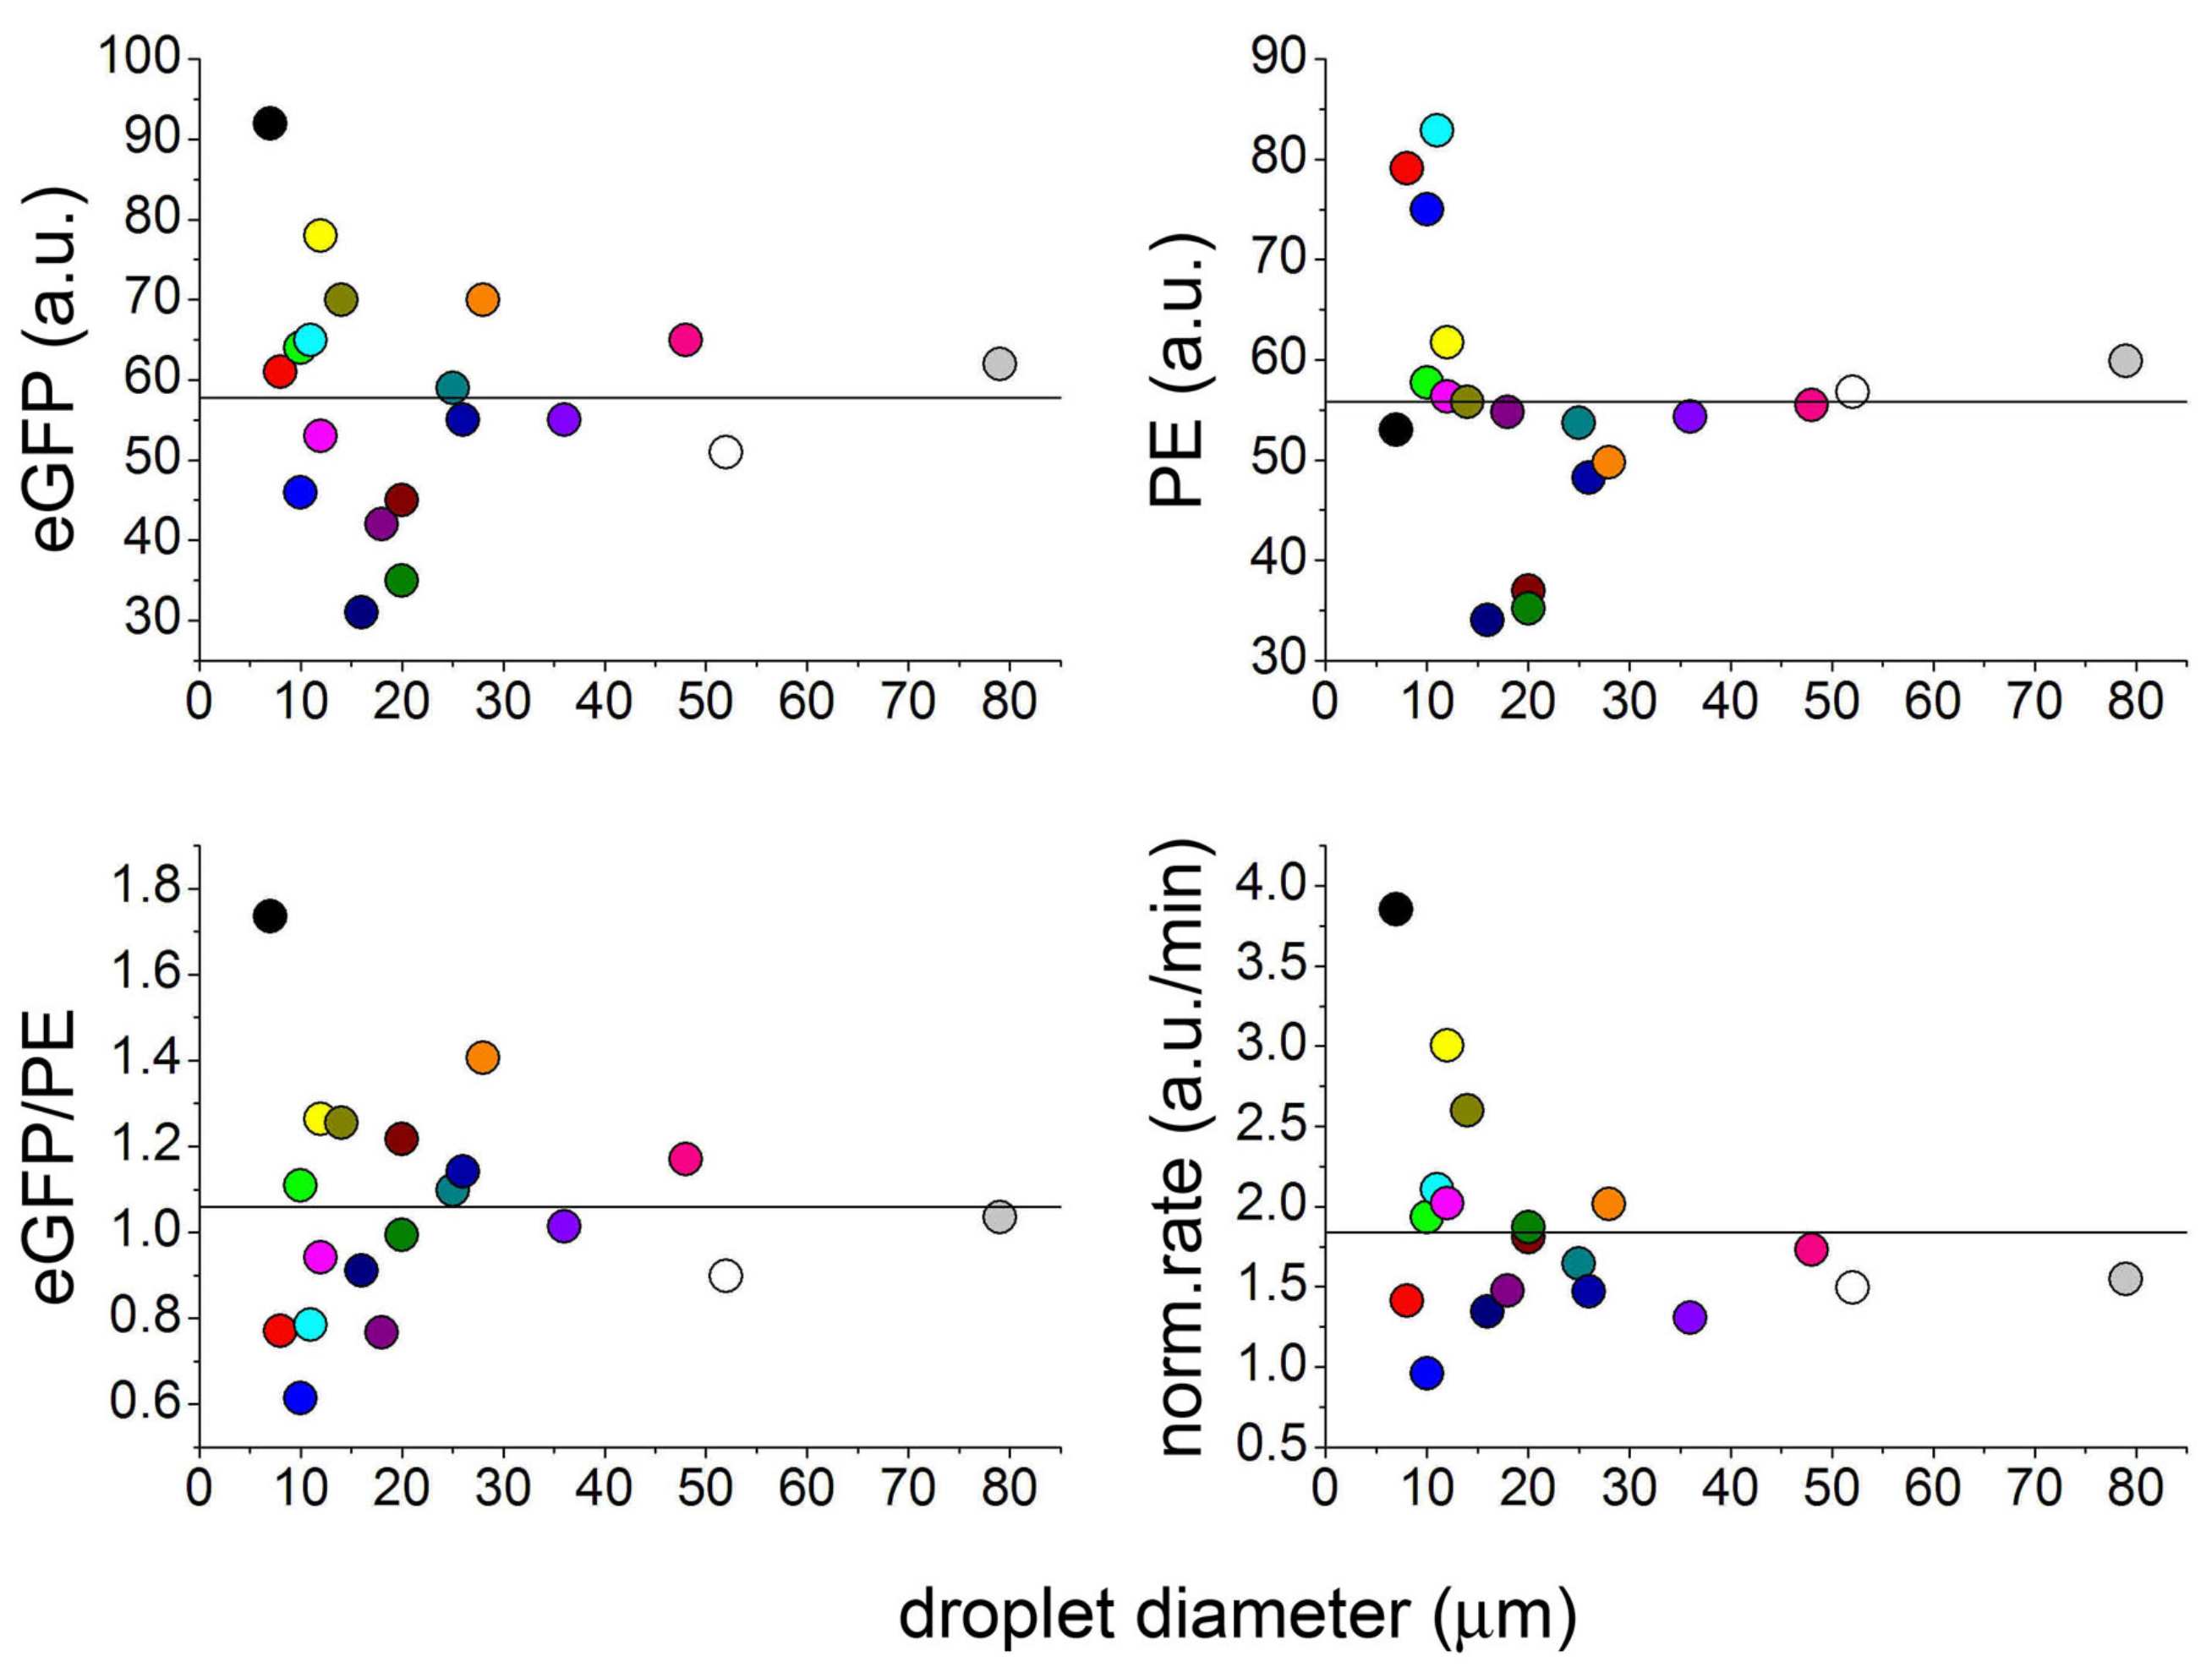
2.1. Protein Synthesis by TX–TL Reactions in Water-in-Oil Droplets Displays High Between-Droplet Diversity

This preliminary section just serves as an illustration of protein synthesis pattern in microcompartments. We will describe the case of water-in-oil (w/o) droplets, but similar observations are also typical of lipid vesicles.
When a TX–TL kit, such as the PURE system (or a cell extract), is emulsified in a lipid-containing apolar solvent, w/o droplets form spontaneously. The droplets are stabilized against coalescence by a lipid monolayer located at the water/oil interface, and their size lies in the 1–100 micrometer range.
Figure 2 shows the case of lecithin-stabilized w/o droplets are prepared by emulsifying an aqueous solution of the TX–TL components and a red fluorescent macromolecule, phycoerithrin (PE, 240 kDa), used as a probe. After four hours incubation at 37 °C the droplets have been analysed by microscopy in order to measure their size, PE and eGFP concentrations [25].
Due to the small number of droplets, data in Figure 2 have just an illustrative scope (no statistical conclusions can be drawn). Qualitatively, the experiment shows high between-droplets variability of both eGFP and PE concentrations. The variability is higher-than-expected because of the very large size of the droplets (stochastic fluctuations would account for ≤2% variability [16]). Expectedly, small droplets (<30 μm) display higher between-droplet variability than larger ones. The eGFP/PE ratio and the PE-normalized rate are indeed very variable too, suggesting that the source of droplet diversity has a more complex nature and depends on uncorrelated stochastic partition of each of the TX–TL components.
These observations elicit several questions. For example, can the typically observed variations of protein production (sometimes, by one order of magnitude [16]) be explained by solute partition? Does the internal composition of each compartment differ significantly from each other, leading to large differences in terms of produced protein? How sensitive is protein production from the concentration of TX–TL components?

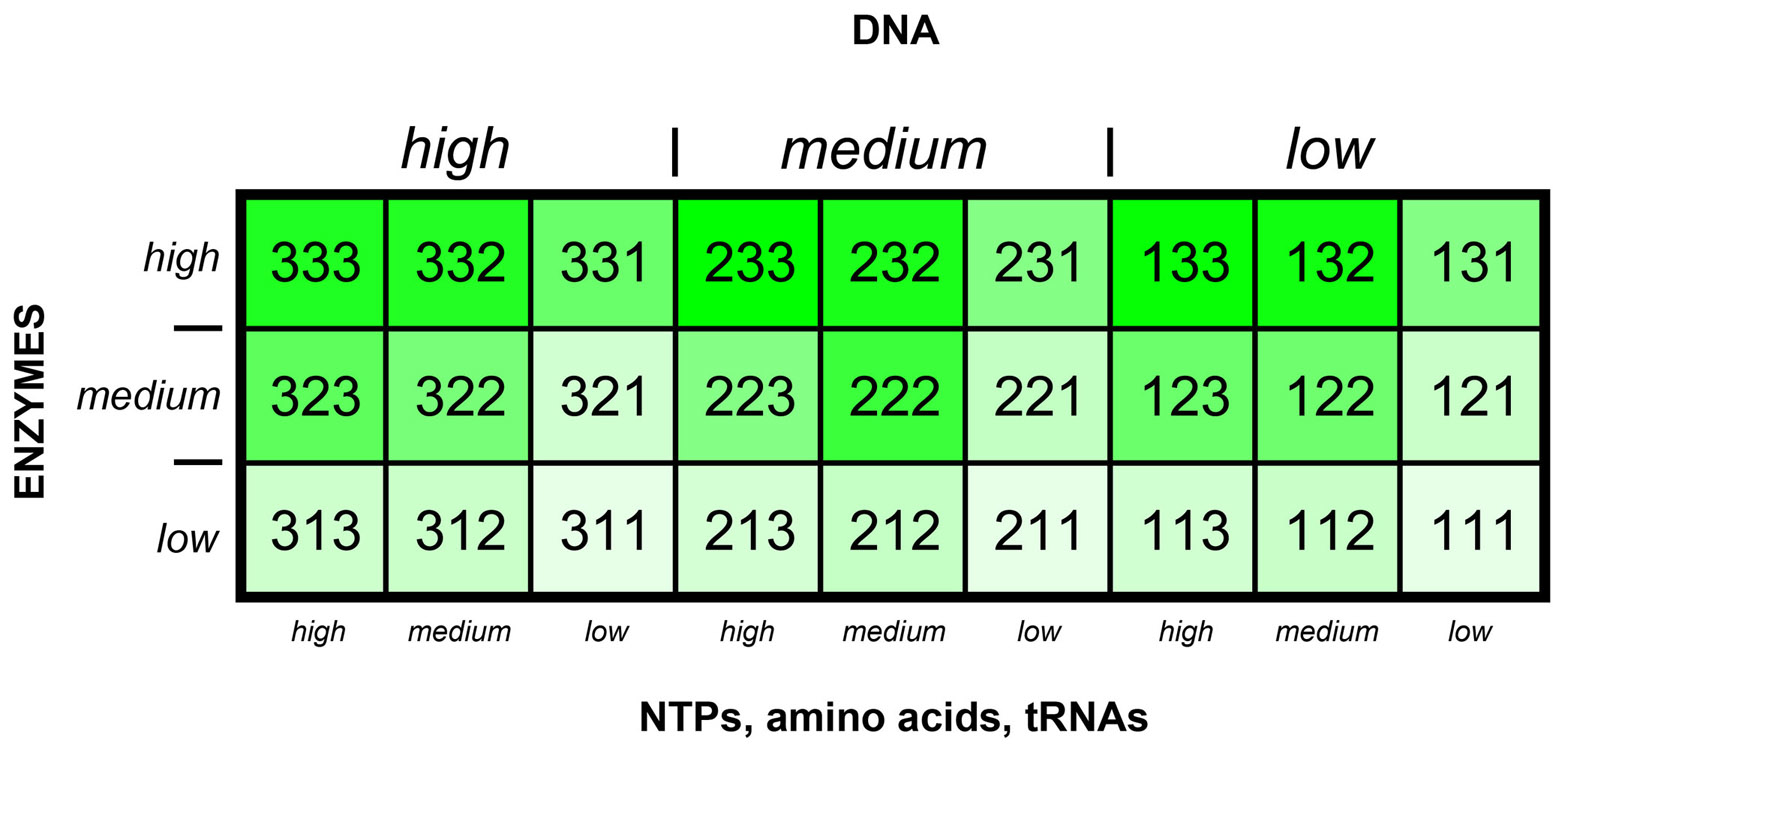
2.2. PURE Systems Block-Variants

For investigating how different TX–TL compositions affect protein synthesis, we performed a combinatorial experiment based on the PURE system. In particular PURE systems, block-variants were assessed for the rate and the amount of eGFP production.
It is known that protein synthesis is strongly dependent from the template DNA concentration (typically used at ca. 1 nM [26,27,28]). Our combinatorial approach, therefore, has explored PURE system compositions where DNA concentration varies, but not in the extremely low range. We explored the 7.3–22.0 nM range, aiming instead at revealing the role of the other TX–TL components.
The PURE system was available to us as two ready-to-use mixtures, here called mix E (ribosomes, enzymes) and mix B (buffer, tRNAs, and low MW compounds such as amino acids, nucleotides, etc.). The two mixtures should be supplemented with DNA (D) in order to function as protein synthesis machinery (Table 1).
We prepared, in combinatorial manner, several PURE system variants that contain different amount of D, E, and B. In particular, for practical reasons we could explore only variants that can be obtained by dilution of the D, E, and B sub-sets. Dilution factors were set to 3/3 (undiluted), 2/3 (diluted), and 1/3 (diluted). We will refer to them with the labels “3”, “2” and “1”, respectively, and in the following order: D, E, B (Table S1). For example, the variant “333” refers to undiluted PURE system and [DNA] = 22 nM; “123” refers to a combination of diluted DNA (to 1/3 of its initial concentration, i.e., 7.3 nM), diluted mix E (to 2/3 of its initial concentration), and undiluted mix B. The resulting 27 (33) PURE system block-variants were allowed to produce eGFP in bulk, the sigmoidal increase of fluorescence was monitored in time, and finally converted to eGFP concentration thanks to a calibration curve (Figure 3). The full numerical dataset of 27 kinetic traces can be found as a supplementary file.

2.3. Commenting the Results

The end-point eGFP concentration, measured after six hours for each of the 27 samples is shown in Figure 4a. Additional plots of experimental data are displayed in Figure 5. Changing DNA concentration in the explored range (7.3, 14.7, 22 nM) does not lead to important protein synthesis variations. This was expected because in this regime TX reaction rate reaches saturation [26,27,28]. The major variations are observed when the concentration of mix E and mix B are modified. The dilution of the PURE system components brings about a strong reduction of protein synthesis, as already noted elsewhere [29].
Our data simulates what happens inside compartments when TX–TL solutes are partitioned stochastically. While it is improbable that the low-MW compounds present in mix B have strong between-compartment concentration variations (due to their relatively high concentration, i.e., in the mM range), the same cannot be assumed for the macromolecular components of mix B (tRNAs) and mix E (ribosomes, translation factors, aminoacyl-tRNA synthetases, energy recycling enzymes), as we have discussed in full detail elsewhere [16]. The concentration of macromolecular compounds in the PURE system lies in the 10 nM–1 μM range, and thus they are subjected to stochastic partition in both directions (more concentrated, or less concentrated than the expected value). Our data allow us to document only the second occurrence (solutes that are less concentrated than expected).
According to the fluctuation theory, the variability of the local concentrations of these solutes is expected to be low. However, experimental results from many reports (similar to the illustrative case in Section 2.1 here) suggest, instead, that it is quite high. Here we have shown that if stochastic solute partition leads to intra-compartment changes of solute concentration in the explored range (up to a dilution factor of 1/3), protein synthesis will be affected accordingly, up to a factor of 1/20 or more (Figure 4a). Clearly this is due to the mechanism of protein synthesis, which is nonlinear.

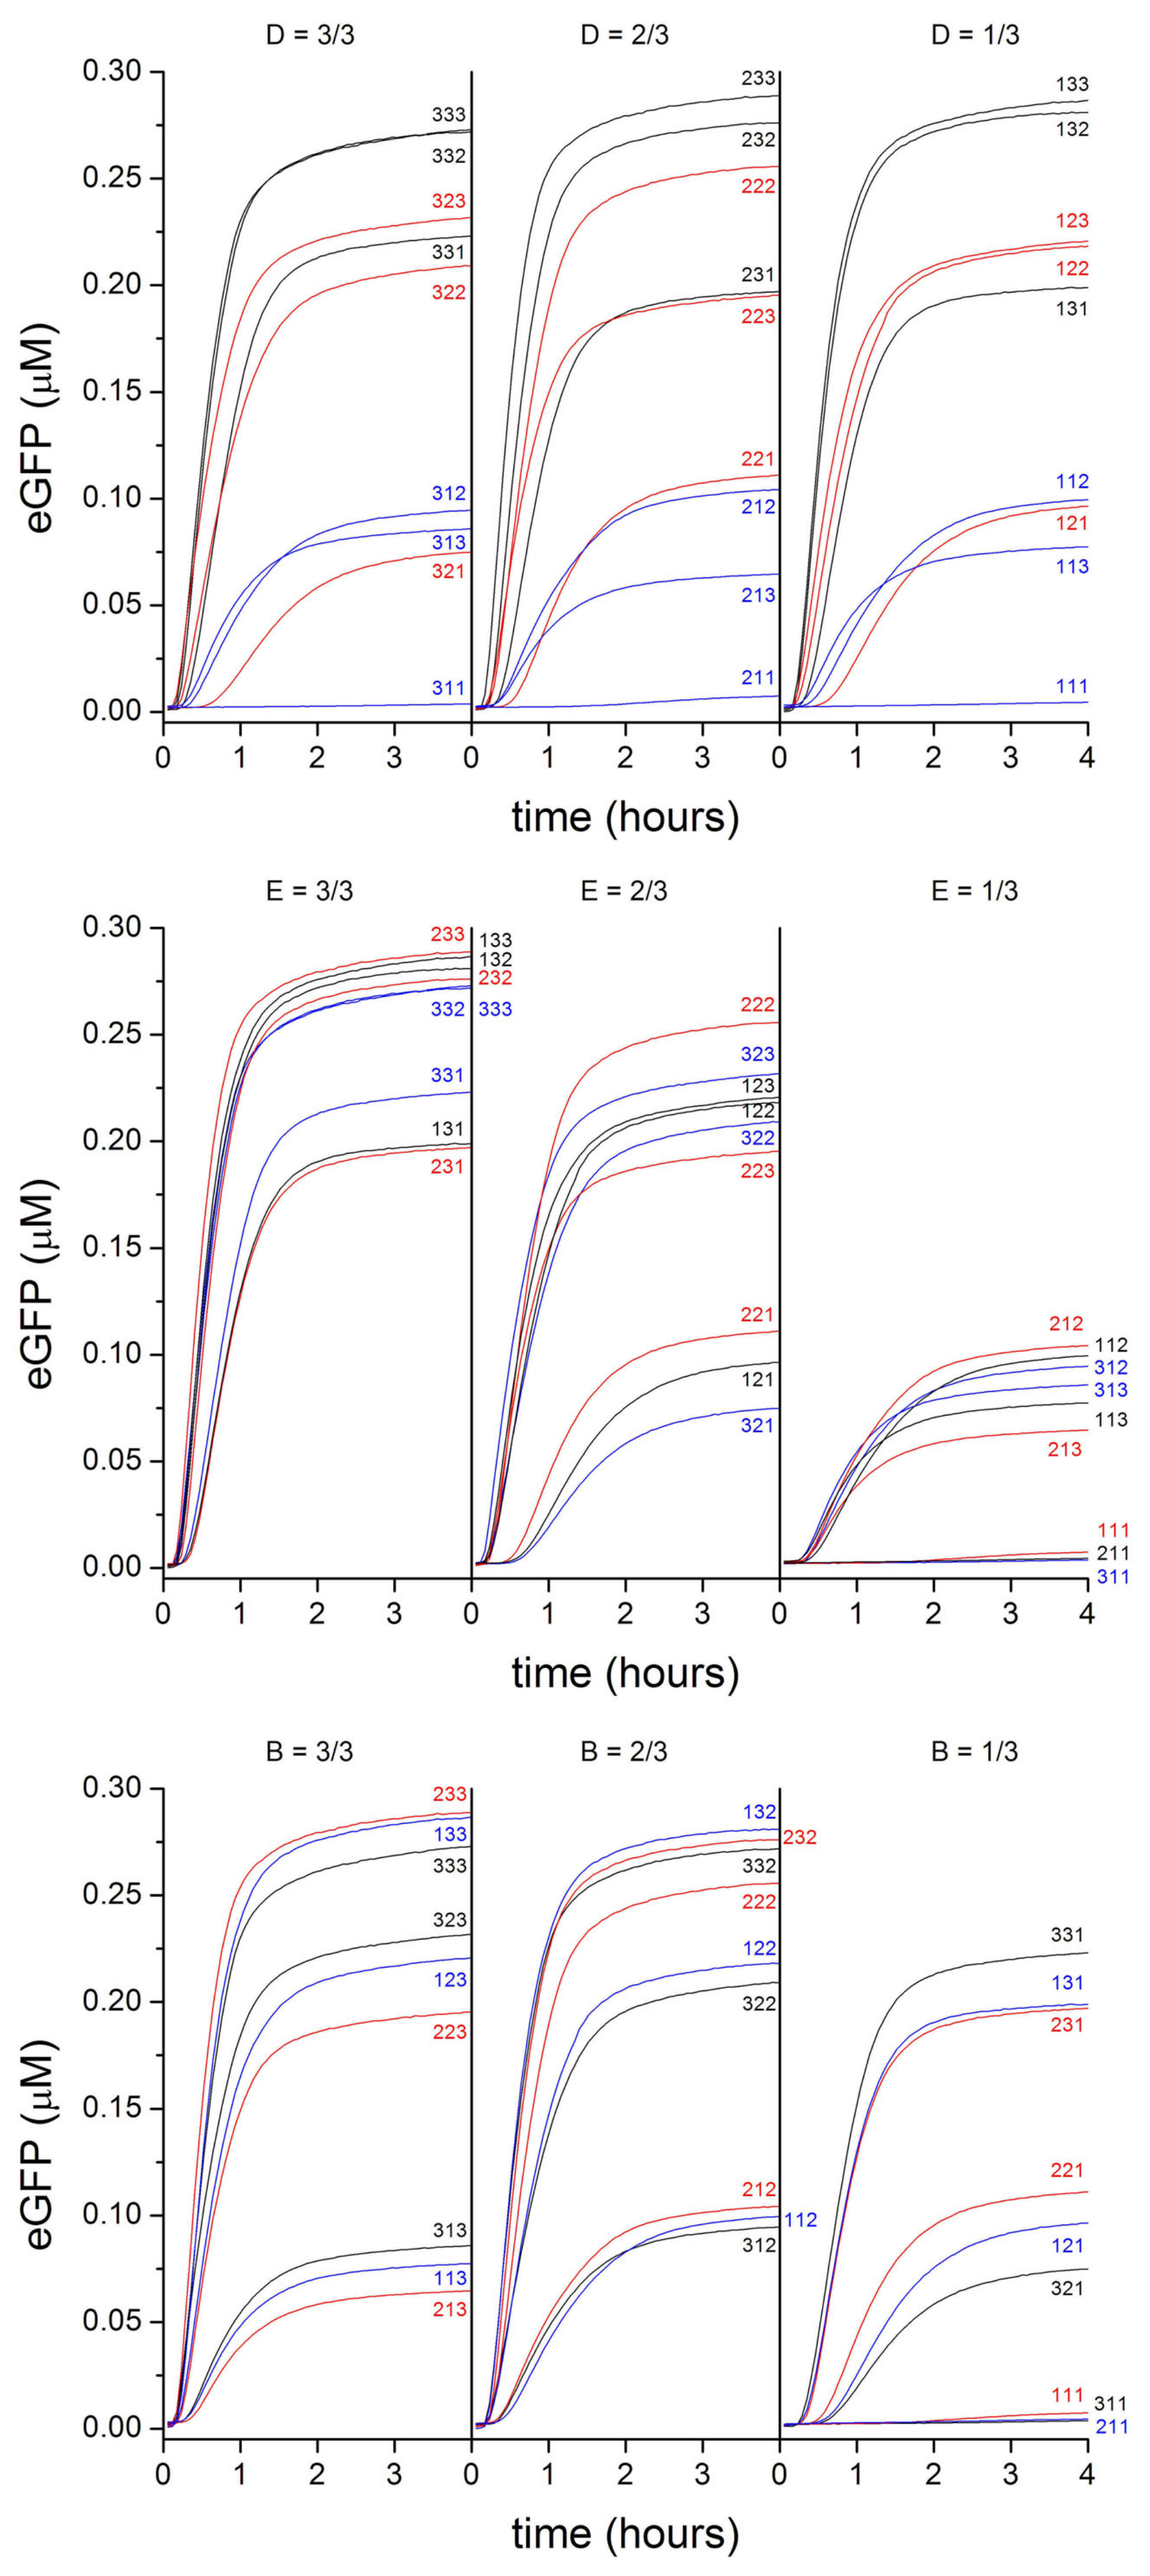
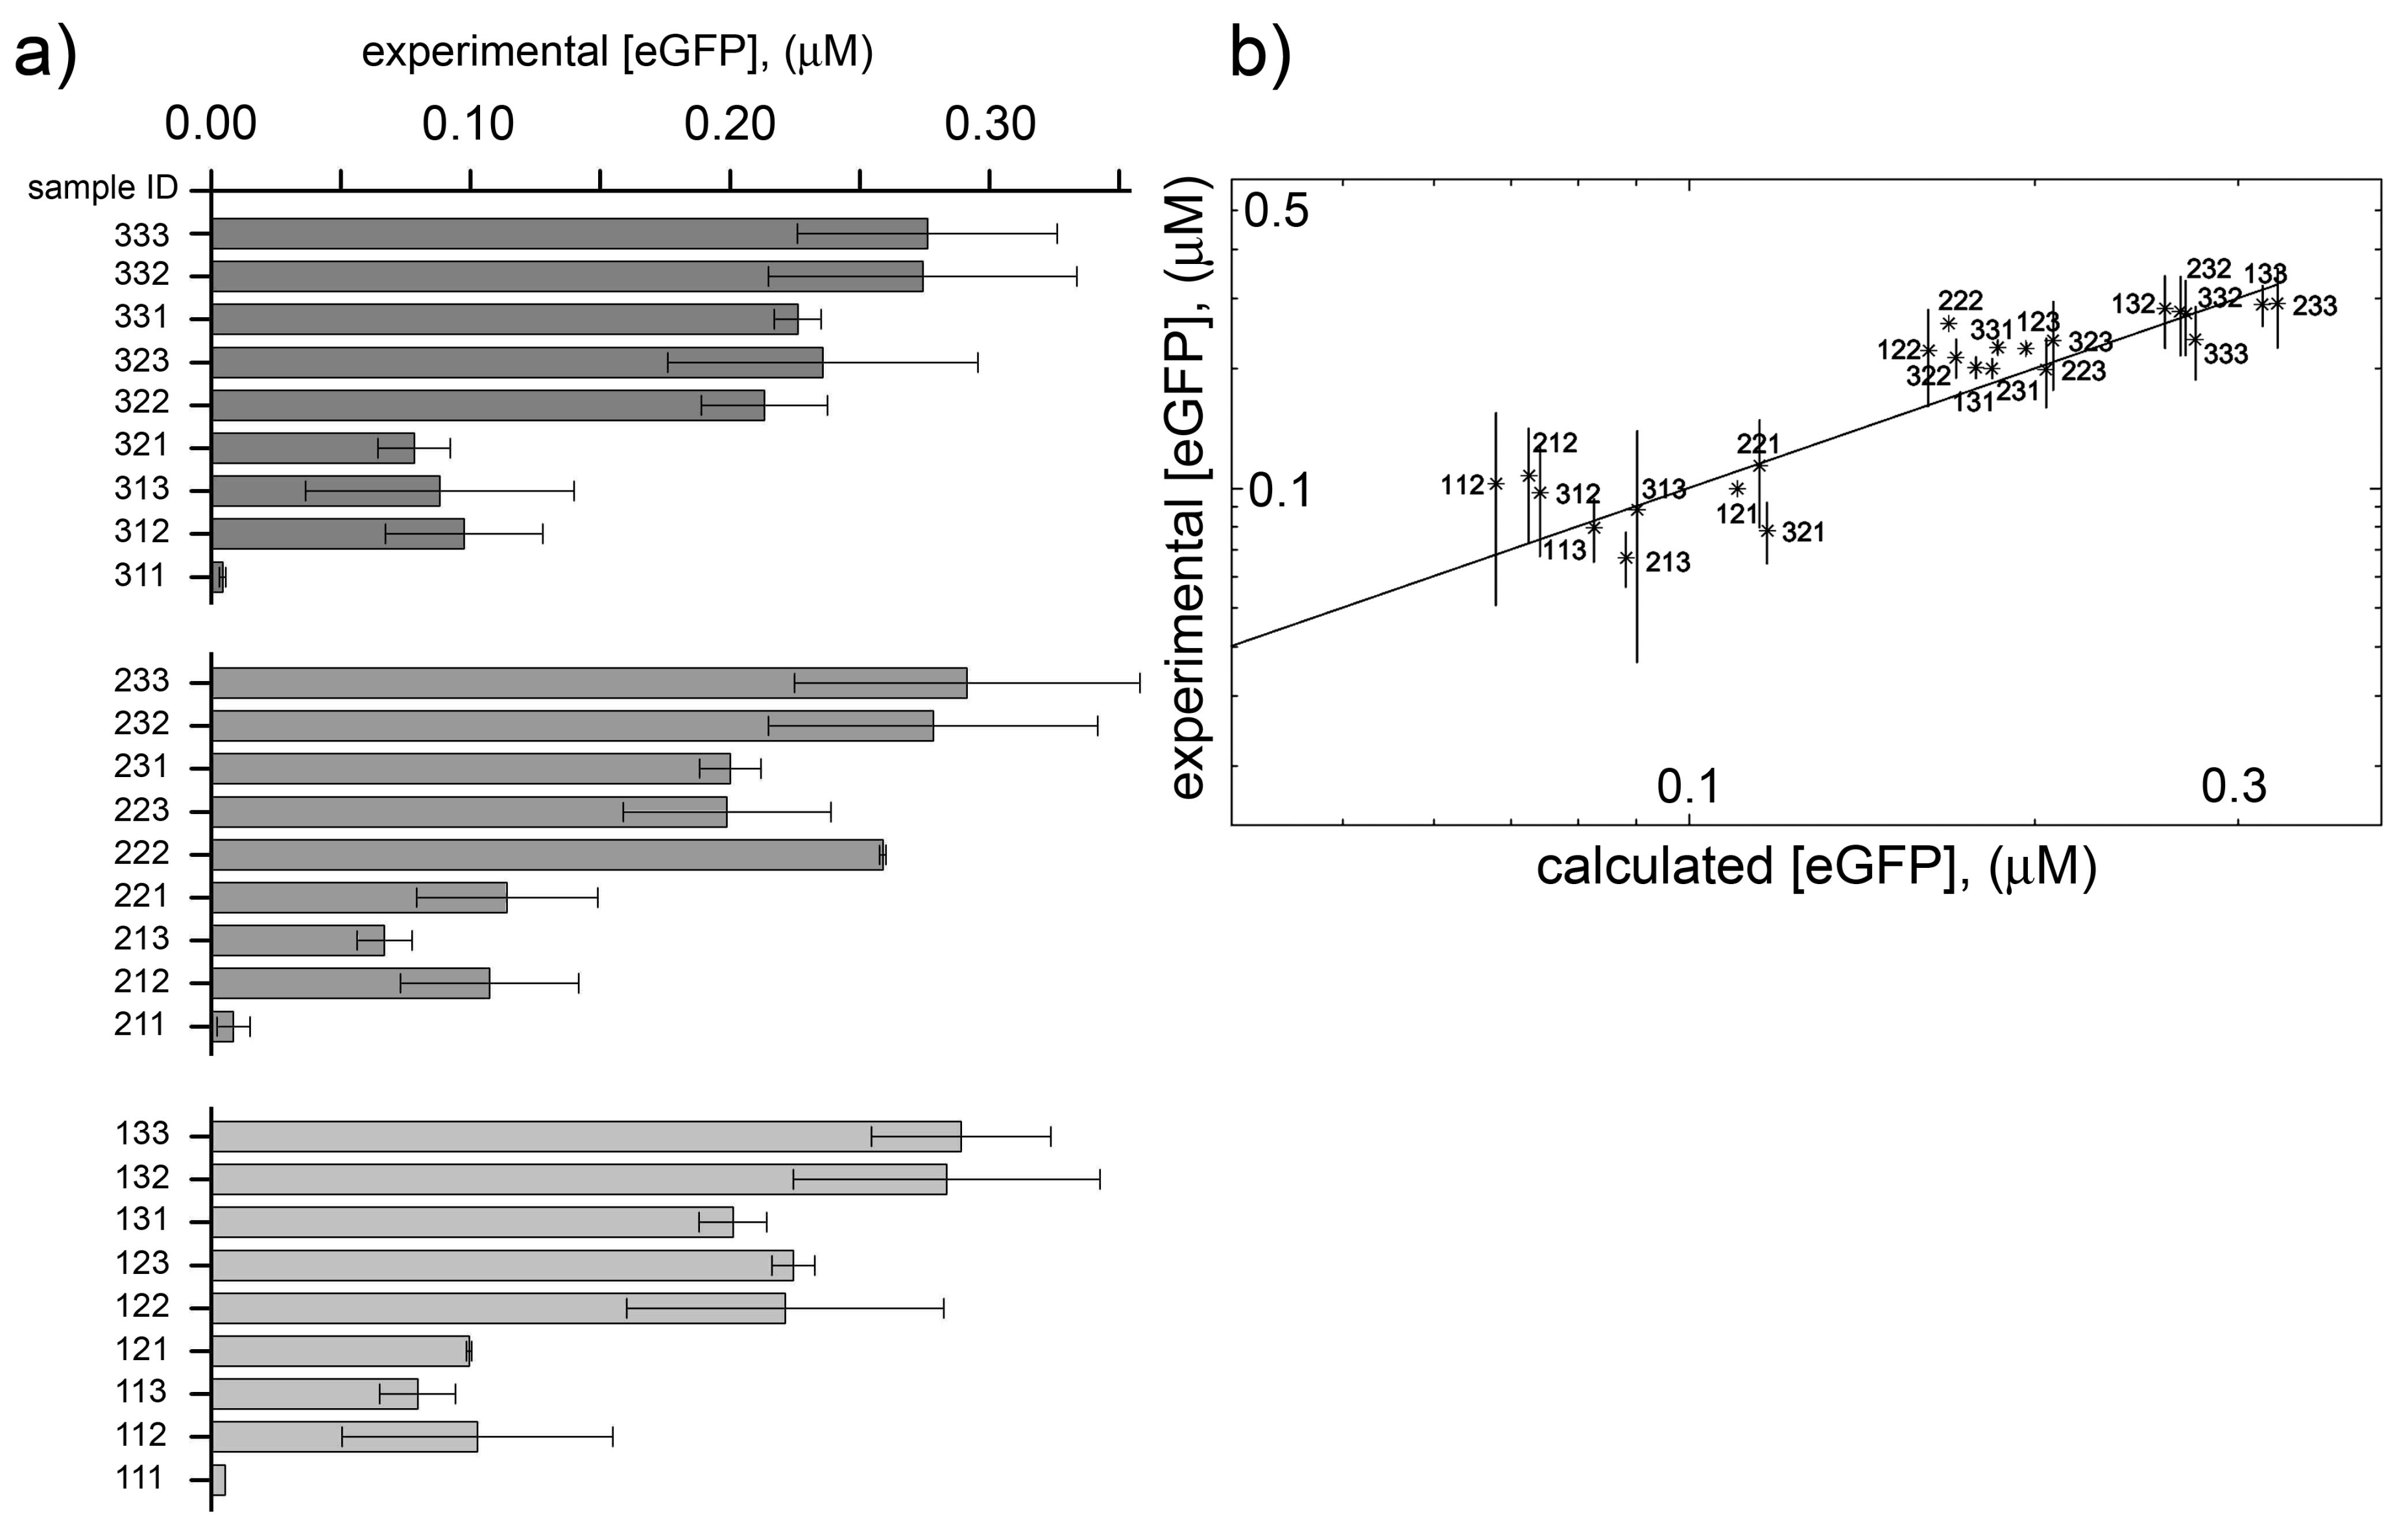
2.4. Analysis and Numerical Modeling

In order to analyze and model the dependence of TX–TL process from the concentration of the PURE system species, we firstly performed a multivariate statistical analysis on the measured parameters of the 27 kinetic curves, namely, (i) the end-point eGFP concentration (μM), (ii) the sigmoidal inflection time (s), and (iii) the maximal protein synthesis rate (μM/s). Linear and linearized multiple regressions have been used, based on Equation 1:
f = β 0 + β D a D + β E a E + β B a B ,
where f is the measured parameter (linear model) or a nonlinear function of it (logarithm or power: linearized models). For example, f can be the end-point eGFP concentration. The β values are the regression coefficients, and aD, aE, and aB represent the concentration (expressed as 3/3, 2/3 or 1/3) of the PURE systems sub-sets D, E and B, respectively. This statistical analysis shows that only βE and βB are statistically significant (p < 0.05), indicating that in the explored concentration range, a change in concentration of the group E and group B chemicals dominates the PURE system response (Table S2). These conclusions hold for the three above-mentioned parameters (i-ii-iii), both in linear and non-linear models, and are confirmed by principal component analysis as well (commented below Table S2).
Synthetic biology approaches heavily rely on numerical simulations, and thus we applied an in silico modelling approach to the dataset composed of 27 curves. At this aim, a kinetic model of TX–TL operation is needed.
We have recently developed a simple predictive model for the PURE system (Figure S1) based on a simplified mechanism [17,30] that fits some available experimental data [30,31]. The model uses six reactions, 19 kinetic constants, and 17 chemical species. Despite its simplicity, the model reproduces the essential kinetic features of TX–TL reactions and is capable of accounting for resource consumption and responsiveness to reactant concentration variations. It employs Michaelis–Menten-like kinetic rates for all steps. In the case of fluorescent protein production, it is possible to expand the model and make it more accurate by adding two additional steps related to protein folding and fluorochrome maturation.
Here we aimed to verify whether, and at what extent, the minimal model simultaneously fits the 27 experimental curves corresponding to different PURE system block-variants. A preliminary test shows that the model fits reasonably well the end-point eGFP concentrations, but the protein production rate was mismatching. A much better fit, even if still not fully adequate, is obtained by introducing Hill coefficient in the TL rate expression, as explained in the Methods section. Figure 4b illustrates the correlation between experimental and calculated end-point [eGFP] based on the improved model. An overall good agreement is achieved. According to our fitting procedure, the translation rate (kTL) and eGFP folding/maturation (kfolding, kmaturation) are, respectively, 72 × 10−3 s−1, 6.7 × 10⁻³ s−1 and 4.7 × 10⁻³ s−1 (folding and maturation appear as rate-limiting). Note that, taken one-by-one, all kinetic curves can be fitted almost perfectly, but the challenge was the global fit. Although these results confirm the robustness of our simple PURE system model, it is evident that it does not fully take into account the cooperativity and the nonlinearity TX–TL complex mechanism, and further refinements are needed. On the other hand, the model—even if it is rather simple—catches the essential features of the TX–TL mechanisms.

2.5. Comparison with Previously Published Dataset

Our investigation has explored only a small portion of the PURE system concentrations space. In particular we could not explored what happens when species are concentrated above their ‘standard’ concentration. Yomo and collaborators reported a similar and more detailed study aiming at discovering epistatic interactions (non-additive effects) among PURE system components [32], but it refers only end-point protein concentrations—not to kinetic traces.
A direct comparison between our dataset and the previous one [32] is not possible, because the compositions and the combination of the block-variants are different. However it is possible to draw the general conclusion that protein yield depends in complex manner from the concentration of individual PURE components, and that—when combined together—minor changes of some PURE components concentration can affect in large manner protein synthesis.
Qualitatively, block-variants that can be grouped on the basis of their protein production (‘high’ versus ‘low’):
  • Block-variants with high production (>67% with respect to the maximal value): in the previous study [32], these are—typically —combination of high concentration of initiaton and elongation TL factors, as well as of ribosomes, generally low concentration of aminoacyl tRNA synthetase, and high concentration of tRNAs and energy recycling enzymes. In this study, the best combinations have medium-high concentration of all macromolecules (enzymes and tRNAs), and buffer/salts.
  • Block-variants with small production (<33% with respect to the maximal value): in the previous study [32], these are—typically—combinations of high concentration of buffer, low concentration of tRNAs, medium concentration of ribosomes, generally low concentration of aminoacyl tRNA synthetase, and high concentration of energy recycling enzymes. In this study, the worst combinations have low concentration of all enzymes (and in minor way, tRNAs, buffer/salts).

3. Methods

3.1. Materials

Soybean lecithin (EPIKURON200) was from Degussa BioActives (Germany); the T7-S30 TX–TL kit (code L1130) was from Promega; the PURE system was a generous gift from Yutetsu Kuruma (Earth-Life Science Institute, Tokyo); the 3026 bp pWM-T7-eGFP plasmid [33,34] was from Biotecton (Switzerland); mineral oil (M5904), phycoerythrin (52412), allophycocyanin (A7472), and dithiothreitol (DTT) were from Sigma-Aldrich; deionized water was produced by a Millipor MilliQ apparatus.

3.2. TX–TL Reaction Inside Soybean Lecithin w/o Droplet

The synthesis of eGFP was carried out inside soybean lecithin w/o droplets, as described in [35]. In particular, the commercial T7-S30 TX–TL kit was mixed with 35 nM pWM-T7-eGFP plasmid and the resulting aqueous phase was emulsified in 0.3 wt% lecithin-containing mineral oil. Phycoerythrin (1 μM) was added as a fluorescent water-soluble marker. The resulting w/o droplets were analyzed, after 4 h incubation at 37 °C), by a confocal microscope (Leica TCS SP5) by applying standard settings and 63× oil-immersion objective. Image analysis was carried out by Image J [36].

3.3. PURE System Block-Variants

PURE system was delivered as two ready-for-use vials, named E (enzymes) and B (buffer and low MW compounds). The TX–TL mixture was prepared by mixing proper volumes of pWM-T7-eGFP plasmid in water, mix E, mix B, DTT (final concentration: 1.7 mM), and allophycocyanin (final concentration 0.1 mg/mL) up to a total volume of 15 μL. Milli Q water was used for the dilution of D, E, and B stock solutions. A total of 27 samples have been generated, named according to the dilution factor of D, E and B solutions (Table S1), and kept in ice. To synthesize eGFP, samples were incubated at 37 °C for 6 h inside PCR-type microvials of a Corbett Rotor-Gene 6000 Real Time-PCR machine (λex 470 nm, λem 510 nm). Raw fluorescence data have been converted to eGFP concentration by means of a calibration curve [37].

3.4. PURE System Numerical Model

Details of the model have been published elsewhere [17,30] and schematically recalled in Figure S1. Two additional steps have been added, namely, protein folding and protein (fluorochrome) maturation. Shortly, the model has been designed on the basis on a previously published work [31] and it includes six reactions and two degradations, namely: (1) transcription, (2) RNA degradation, (3) translation, (4) protein folding, (5) protein (fluorochrome) maturation, (6) degradation of TL catalysts, (7) aminoacyl tRNA charging, and (8) energy regeneration. Protein folding was modelled as a first order reaction. The two degradation processes and fluorochrome maturation have been modelled as pseudo first-order processes. The rate equation of all reactions has the form of a Michaelis–Menten Hill-type equation, i.e., the Equation (2):
r p = k p [ cat p ] q [ S q ] h p q K p q h p q + [ S q ] h p q ,
where rp, kp, catp refer to the rate, rate constant, and macromolecular catalyst of the p-th process (p = TX, TL, RS, EN); Sq is the q-th substrate of the p reaction, and Kpq is its cognate Michaelis–Menten constant. The Hill coefficient hpq is equal or greater than one, depending on the process and on the substrate. For TX, RS, EN processes, all Hill coefficients have been set to 1. For TL process, the three Hill coefficients (hTL,nt, hTL,AT, hTL,NTP) have been obtain via a best fitting procedure. The concentrations and the best-fit parameters of in silico PURE systems are given in Tables S3 and S4. In particular, the initial values of kTL, kfolding and kmaturation were set to 0.085 s−1 [30], 0.015 s−1 and 0.0034 s−1 [31,38,39], and later optimized by the fitting program to final values shown in Table S4.

Supplementary Materials

The following are available online at https://www.mdpi.com/2306-5729/3/4/41/s1, Data file: numerical data of eGFP versus time (27 curves), Table S1: Correspondence between sample ID and composition of PURE system block-variants, Table S2: Results of statistical analyses, Table S3: Concentration of the species in the in silico PURE system model, Table S4: Best fit parameters, Figure S1: In silico PURE system model.

Author Contributions

P.S. conceived and designed the experiments; P.C. performed the experiments; F.D. performed preliminary data analysis; E.A. and F.M. analyzed and fit the data; P.S. wrote the paper; all authors revised the paper.

Acknowledgments

The authors are grateful to Pier Luigi Luisi (ETH Zürich and Roma Tre University) for stimulating discussions, and to Yutetsu Kuruma (Earth-Life Science Institute, Tokyo) for generously providing the PURE system in the context of the HFSP Project RGP0033/2007-C. Collaboration among the authors has been fostered by the European COST Action CM1304 “Emergence and Evolution of Complex Chemical Systems”.

Conflicts of Interest

The authors declare no conflicts of interest.

References

  1. Luisi, P.L. Toward the engineering of minimal living cells. Anat. Rec. 2002, 268, 208–214. [Google Scholar] [CrossRef] [PubMed] [Green Version]
  2. Pohorille, A.; Deamer, D. Artificial cells: Prospects for biotechnology. Trends Biotechnol. 2002, 20, 123–128. [Google Scholar] [CrossRef]
  3. Luisi, P.L.; Ferri, F.; Stano, P. Approaches to semi-synthetic minimal cells: A review. Naturwissenschaften 2006, 93, 1–13. [Google Scholar] [CrossRef] [PubMed]
  4. Mansy, S.S.; Szostak, J.W. Reconstructing the emergence of cellular life through the synthesis of model protocells. Cold Spring Harbor Symp. Quant. Biol. 2009, 74, 47–54. [Google Scholar] [CrossRef] [PubMed]
  5. Ichihashi, N.; Matsuura, T.; Kita, H.; Sunami, T.; Suzuki, H.; Yomo, T. Constructing partial models of cells. Cold Spring Harbor Perspect. Biol. 2010, 2, a004945. [Google Scholar] [CrossRef] [PubMed]
  6. Kurihara, K.; Tamura, M.; Shohda, K.-I.; Toyota, T.; Suzuki, K.; Sugawara, T. Self-reproduction of supramolecular giant vesicles combined with the amplification of encapsulated DNA. Nat. Chem. 2011, 3, 775–781. [Google Scholar] [CrossRef] [PubMed]
  7. Nourian, Z.; Roelofsen, W.; Danelon, C. Triggered gene expression in fed-vesicle microreactors with a multifunctional membrane. Angew. Chem. Int. Ed. 2012, 51, 3114–3118. [Google Scholar] [CrossRef] [PubMed]
  8. Blain, J.C.; Szostak, J.W. Progress Toward Synthetic Cells. Annu. Rev. Biochem. 2014, 83, 615–640. [Google Scholar] [CrossRef] [PubMed]
  9. Luisi, P.L.; Varela, F.J. Self-replicating micelles—A chemical version of a minimal autopoietic system. Origins Life Evol. Biosphere 1989, 19, 633–643. [Google Scholar] [CrossRef]
  10. Bachmann, P.; Luisi, P.; Lang, J. Autocatalytic Self-Replicating Micelles as Models for Prebiotic Structures. Nature 1992, 357, 57–59. [Google Scholar] [CrossRef]
  11. Oberholzer, T.; Wick, R.; Luisi, P.L.; Biebricher, C.K. Enzymatic RNA replication in self-reproducing vesicles: An approach to a minimal cell. Biochem. Biophys. Res. Commun. 1995, 207, 250–257. [Google Scholar] [CrossRef] [PubMed]
  12. Stano, P.; Mavelli, F. Protocells Models in Origin of Life and Synthetic Biology. Life 2015, 5, 1700–1702. [Google Scholar] [CrossRef]
  13. Oberholzer, T.; Nierhaus, K.H.; Luisi, P.L. Protein expression in liposomes. Biochem. Biophys. Res. Commun. 1999, 261, 238–241. [Google Scholar] [CrossRef] [PubMed]
  14. Yu, W.; Sato, K.; Wakabayashi, M.; Nakaishi, T.; Ko-Mitamura, E.P.; Shima, Y.; Urabe, I.; Yomo, T. Synthesis of functional protein in liposome. J. Biosci. Bioeng. 2001, 92, 590–593. [Google Scholar] [CrossRef]
  15. Stano, P.; Carrara, P.; Kuruma, Y.; de Souza, T.P.; Luisi, P.L. Compartmentalized reactions as a case of soft-matter biotechnology: Synthesis of proteins and nucleic acids inside lipid vesicles. J. Mater. Chem. 2011, 21, 18887–18902. [Google Scholar] [CrossRef]
  16. Altamura, E.; Carrara, P.; D’Angelo, F.; Mavelli, F.; Stano, P. Extrinsic stochastic factors (solute partition) in gene expression inside lipid vesicles and lipid-stabilized water-in-oil droplets: A review. Synth. Biol. 2018, 3, ysy011. [Google Scholar] [CrossRef]
  17. Mavelli, F.; Stano, P. Experiments on and Numerical Modeling of the Capture and Concentration of Transcription–translation Machinery inside Vesicles. Artif. Life 2015, 21, 445–463. [Google Scholar] [CrossRef] [PubMed]
  18. Paradisi, P.; Allegrini, P.; Chiarugi, D. A renewal model for the emergence of anomalous solute crowding in liposomes. BMC Syst. Biol. 2015, 9, S7. [Google Scholar] [CrossRef] [PubMed] [Green Version]
  19. Shimizu, Y.; Inoue, A.; Tomari, Y.; Suzuki, T.; Yokogawa, T.; Nishikawa, K.; Ueda, T. Cell-free translation reconstituted with purified components. Nat. Biotechnol. 2001, 19, 751–755. [Google Scholar] [CrossRef] [PubMed]
  20. Shimizu, Y.; Kanamori, T.; Ueda, T. Protein synthesis by pure translation systems. Methods 2005, 36, 299–304. [Google Scholar] [CrossRef] [PubMed]
  21. Sunami, T.; Sato, K.; Matsuura, T.; Tsukada, K.; Urabe, I.; Yomo, T. Femtoliter compartment in liposomes for in vitro selection of proteins. Anal. Biochem. 2006, 357, 128–136. [Google Scholar] [CrossRef] [PubMed]
  22. Murtas, G.; Kuruma, Y.; Bianchini, P.; Diaspro, A.; Luisi, P.L. Protein synthesis in liposomes with a minimal set of enzymes. Biochem. Biophys. Res. Commun. 2007, 363, 12–17. [Google Scholar] [CrossRef] [PubMed]
  23. Weitz, M.; Kim, J.; Kapsner, K.; Winfree, E.; Franco, E.; Simmel, F.C. Diversity in the dynamical behaviour of a compartmentalized programmable biochemical oscillator. Nat. Chem. 2014, 6, 295–302. [Google Scholar] [CrossRef] [PubMed] [Green Version]
  24. Dong, H.; Nilsson, L.; Kurland, C.G. Co-variation of tRNA abundance and codon usage in Escherichia coli at different growth rates. J. Mol. Biol. 1996, 260, 649–663. [Google Scholar] [CrossRef] [PubMed]
  25. Carrara, P.; Stano, P.; Luisi, P.L. Giant Vesicles and w/o Emulsions as Biochemical Reactors. Orig. Life Evol. Biosph. 2008, 39, 179–392. [Google Scholar]
  26. Siegal-Gaskins, D.; Tuza, Z.A.; Kim, J.; Noireaux, V.; Murray, R.M. Gene circuit performance characterization and resource usage in a cell-free “breadboard”. ACS Synth. Biol. 2014, 3, 416–425. [Google Scholar] [CrossRef] [PubMed]
  27. Takahashi, M.K.; Hayes, C.A.; Chappell, J.; Sun, Z.Z.; Murray, R.M.; Noireaux, V.; Lucks, J.B. Characterizing and prototyping genetic networks with cell-free transcription–translation reactions. Methods 2015, 86, 60–72. [Google Scholar] [CrossRef] [PubMed] [Green Version]
  28. Garamella, J.; Marshall, R.; Rustad, M.; Noireaux, V. The All E. coli TX–TL Toolbox 2.0: A Platform for Cell-Free Synthetic Biology. ACS Synth. Biol. 2016, 5, 344–355. [Google Scholar] [CrossRef] [PubMed]
  29. Stano, P.; D’Aguanno, E.; Bolz, J.; Fahr, A.; Luisi, P.L. A remarkable self-organization process as the origin of primitive functional cells. Angew. Chem. Int. Ed. Engl. 2013, 52, 13397–13400. [Google Scholar] [CrossRef] [PubMed]
  30. Mavelli, F.; Marangoni, R.; Stano, P. A Simple Protein Synthesis Model for the PURE System Operation. Bull. Math. Biol. 2015, 77, 1185–1212. [Google Scholar] [CrossRef] [PubMed]
  31. Stögbauer, T.; Windhager, L.; Zimmer, R.; Rädler, J.O. Experiment and mathematical modeling of gene expression dynamics in a cell-free system. Integr. Biol. 2012, 4, 494–501. [Google Scholar] [CrossRef] [PubMed]
  32. Matsuura, T.; Kazuta, Y.; Aita, T.; Adachi, J.; Yomo, T. Quantifying epistatic interactions among the components constituting the protein translation system. Mol. Syst. Biol. 2009, 5, 297. [Google Scholar] [CrossRef] [PubMed]
  33. Fischer, A.; Franco, A.; Oberholzer, T. Giant vesicles as microreactors for enzymatic mRNA synthesis. ChemBioChem 2002, 3, 409–417. [Google Scholar] [CrossRef]
  34. Gallo, V.; Stano, P.; Luisi, P.L. Protein Synthesis in Sub-Micrometer Water-in-Oil Droplets. ChemBioChem 2015, 16, 2073–2079. [Google Scholar] [CrossRef] [PubMed]
  35. Fiordemondo, D.; Stano, P. Lecithin-based water-in-oil compartments as dividing bioreactors. ChemBioChem 2007, 8, 1965–1973. [Google Scholar] [CrossRef] [PubMed]
  36. Schneider, C.A.; Rasband, W.S.; Eliceiri, K.W. NIH Image to ImageJ: 25 years of image analysis. Nat. Methods 2012, 9, 671–675. [Google Scholar] [CrossRef] [PubMed] [Green Version]
  37. Pereira de Souza, T.; Stano, P.; Luisi, P.L. The minimal size of liposome-based model cells brings about a remarkably enhanced entrapment and protein synthesis. ChemBioChem 2009, 10, 1056–1063. [Google Scholar] [CrossRef] [PubMed]
  38. Iizuka, R.; Yamagishi-Shirasaki, M.; Funatsu, T. Kinetic study of de novo chromophore maturation of fluorescent proteins. Anal. Biochem. 2011, 414, 173–178. [Google Scholar] [CrossRef] [PubMed]
  39. Macdonald, P.J.; Chen, Y.; Mueller, J.D. Chromophore maturation and fluorescence fluctuation spectroscopy of fluorescent proteins in a cell-free expression system. Anal. Biochem. 2012, 421, 291–298. [Google Scholar] [CrossRef] [PubMed] [Green Version]
Figure 1. Lipid vesicles are used to build semi-synthetic minimal cells. (a) Giant lipid vesicles filled with calcein, and with Trypan Blue stained membranes. Reproduced from [12] according to the CC-BY license. (b) Protein synthesis inside lipid vesicles consists of two main processes, transcription (TX) and translation (TL). At this aim, RNA polymerase, ribosomes, and all required components for the TX–TL reactions are co-entrapped inside vesicles.
Data 03 00041 g001
Figure 2. Protein synthesis inside soybean lecithin w/o droplets. Confocal fluorescence measurements of intra-droplet eGFP fluorescence, phycoerythrin (PE) fluorescence, eGFP/PE fluorescence ratio, and PE-normalized rate of eGFP production as function of droplet diameter. Note that the spread of all measured values increases as the droplet size decreases.
Data 03 00041 g002
Figure 3. Three different renderings of the eGFP vs time profiles dataset (average of two independent experiments). Sample ID “321” refers to a sample prepared from “D” = 3/3, “E” = 2/3, and “B” = 1/3 of stock concentrations; see Table 1 and Table S1).
Data 03 00041 g003
Figure 4. PURE system ‘variants’. (a) End-point (after six h) eGFP concentration of 27 PURE system samples with different concentrations. Sample ID represents the dilution factors of D, E, and B sub-sets (e.g., sample ID “321” refers to a sample prepared from “D” = 3/3, “E” = 2/3, and “B” = 1/3 of stock concentrations; see Table 1 and Table S1). The error bars indicate the standard deviation of two independent experiments. (b) Comparison between experimental and calculated end-point eGFP concentrations. The calculated values have been obtained by a simultaneous fit of the 27 kinetic traces (Figure 3) using the minimal PURE system in silico model (Figure S1) [17,30]. It was not possible to fit the three low-production variants “311”, “211” and “111”. Best-fit parameters are given in Table S4. The diagonal line represents y = x values.
Data 03 00041 g004
Figure 5. Relation between end-point [eGFP], measured after 6 h and eGFP maximal production rate (at the inflection point of the sigmoidal curve) (top). Relation between the eGFP maximal production rate and the inflection time (bottom).
Data 03 00041 g005
Table 1. PURE system composition grouped in three blocks (group D, group E, group B). For convenience, the in silico species used in the numerical model are also listed in the bottom line. Note that the in silico species perform the function of real chemical species, but according to a simplified kinetic scheme.
Group DGroup EGroup B
1 [19,20]DNATranscription
T7 RNA polymerase

Translation
Ribosomes, MTF,IF1, IF2, IF3, EF-G, EF-Tu, EF-Ts, RF1, RF2, RF3, RRF

tRNA charging
20 aa-tRNA synthetase

Energy recycling
creatine kinase, myokinase, nucleoside-diphosphate kinase, pyrophosphatase
20 amino acids
tRNA mix (46) 2
ATP, GTP, CTP, UTP
creatine phosphate
Hepes–KOH, pH 7.6
potassium glutamate
magnesium acetate
spermidine
DTT
10-formyl-5,6,7,8-tetrahydrofolic acid
Numerical model [Mavelli et al., 2015]DNATxcat
Tlcat
Rscat
ENcat
A
T
NTP
CP
1 The concentration of each of the PURE system components can be found in [19,20]. 2 tRNA mix from E. coli has been considered composed of 46 species [24].

