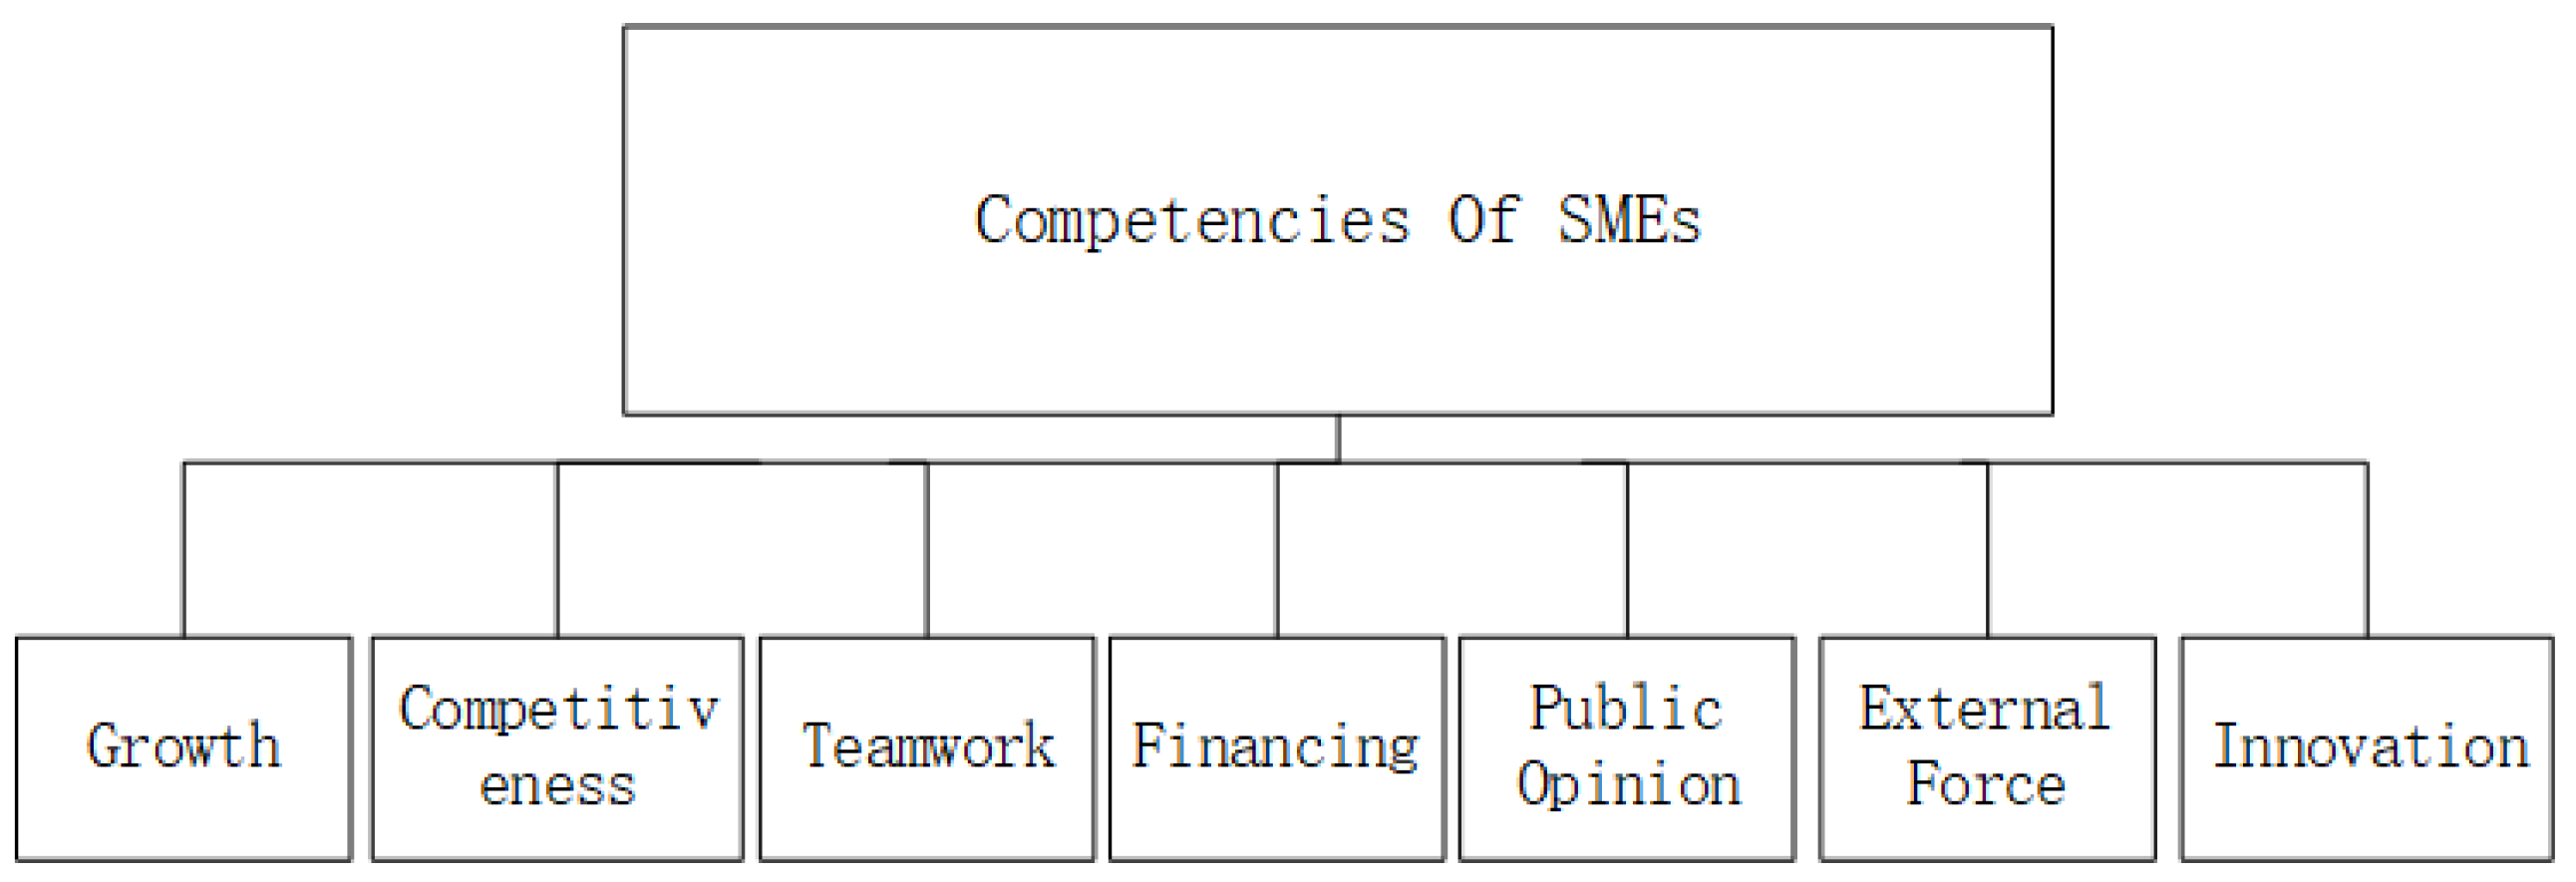
3.1. Construction of Competencies System
Based on Xiaofeng’s quality analysis indicators [
29], we combined financial data and non-financial data to sort the competencies of SMEs in the Chinese market into seven categories: Growth, Competitiveness, Financing, Teamwork, Public Opinion, External Competency and Innovation. As is shown in
Figure 1, there are seven first-level competencies and 45 second-level competencies in the competencies system, including 29 non-financial competencies and 16 financial competencies. The following part will explain these competencies’ indicators one by one.
Among these competencies, the company’s development capacity is measured by a three-year main business compound growth rate, three-year net profit compound growth rate, three-year total assets compound growth rate and three-year capital compound growth rate. Profitability is measured by Main business income, Net profit, OPE, Return on total assets and Return on net assets. Enterprise size is measured by the two indicators of Shared capital and total assets.
Growth. The growth competency reflects the current profitability and potential profitability expectations of certain companies. The growth competency contains 11 indicators. Specific indicators and calculation methods are shown in
Table 1.
Competitiveness. The competitiveness reflects the operational capabilities, market share, and competitiveness of the company’s products. Specific indicators and calculation methods are shown in
Table 2.
Business capability is measured by Account receivable turnover rate and Total asset turnover. Debt paying ability is measured by Current ratio. Market share competency is measured by the remaining second-level competencies.
Teamwork. Teamwork competency reveals the organizational structure of the team and the competency of the core team. There are seven indicators in teamwork competency, indicator description and calculation methods are shown in
Table 3.
Financing. Financing competency reflects the corporate financing capabilities and current valuation, it contains eight sub-competencies, as is shown in
Table 4.
Corporate financing capacity is measured by Number of shareholders, Business valuation, Shareholders’ equity, Market number of businesses and Investor’s number. Business valuation is determined by the rest of second-level competencies.
Public Opinion. Public Opinion reflects the company’s exposure and influence in traditional media, WeChat and Weibo. Public Opinion competencies cover the Media attention index, Weibo attention index and Wechat attention index, as is shown in
Table 5.
External Competency. External Competency includes Popularity of industry and Regional level of the location, which indicates the popularity of the industry the company belongs to and the competitiveness of the located region, as in
Table 6.
Innovation. Innovation competency shows an enterprise’s intangible assets’ transformation ability and development ability, and specifics are shown in
Table 7.
3.2. Data Selection and Data Preprocessing
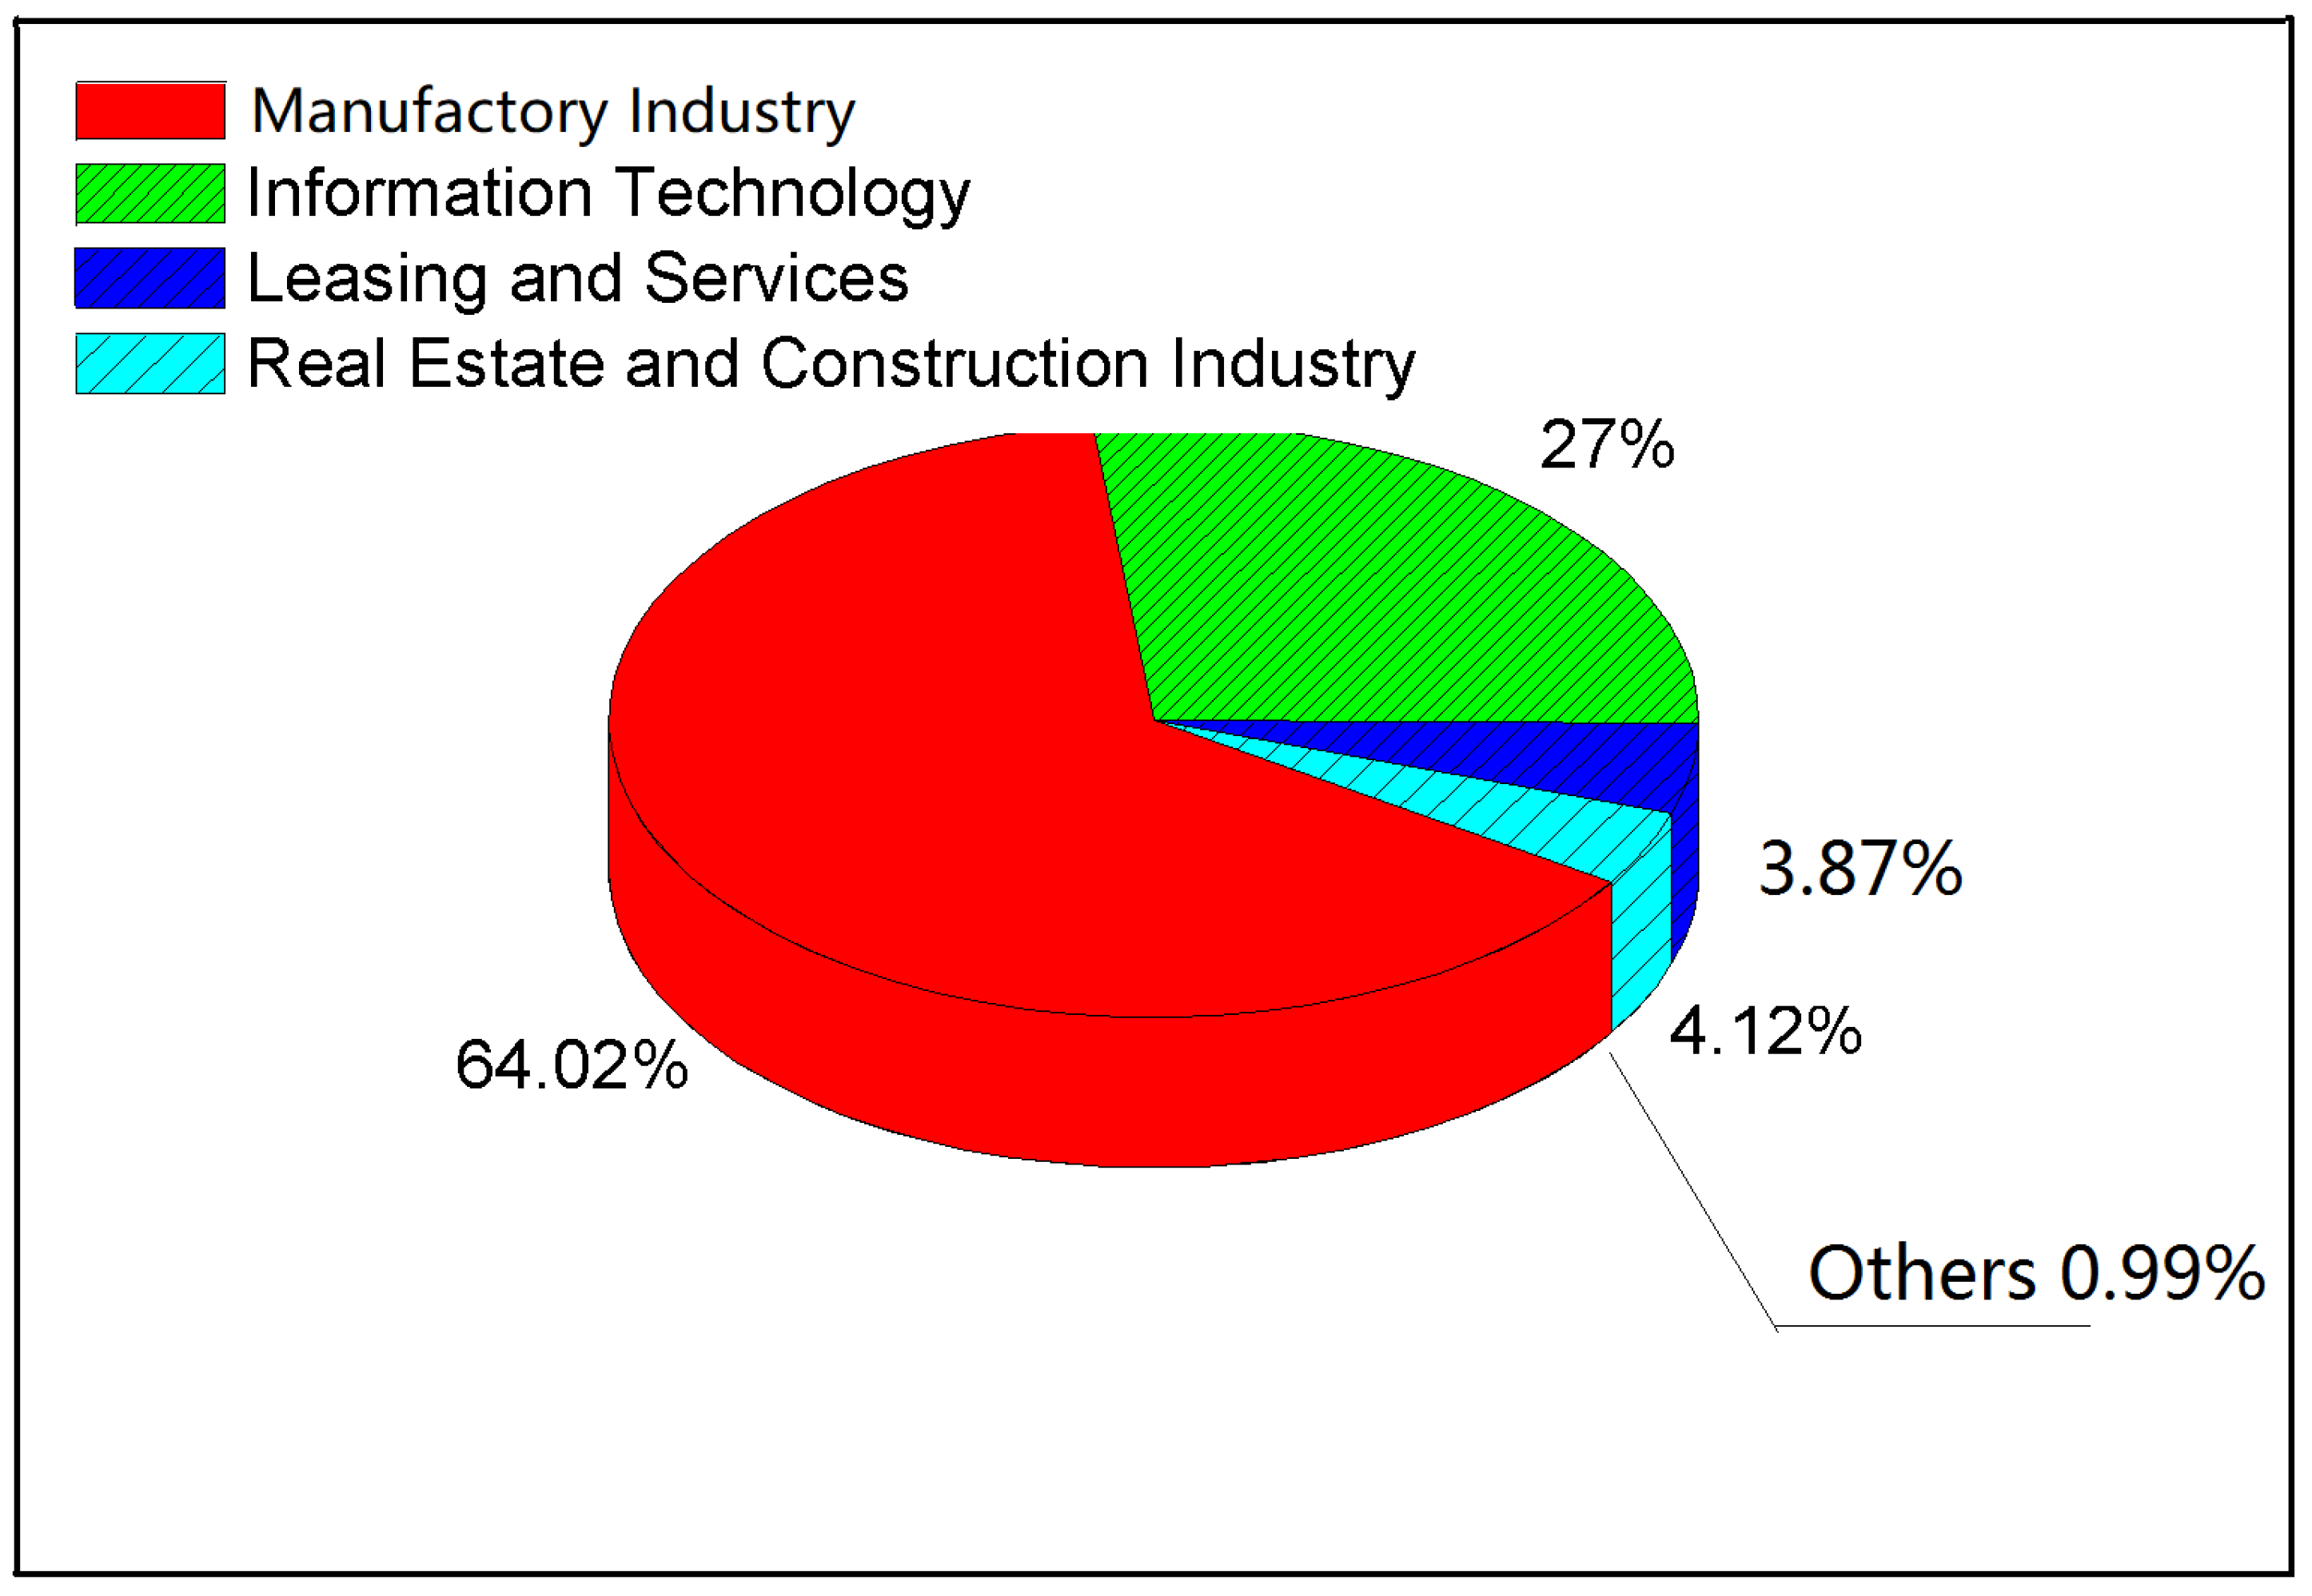
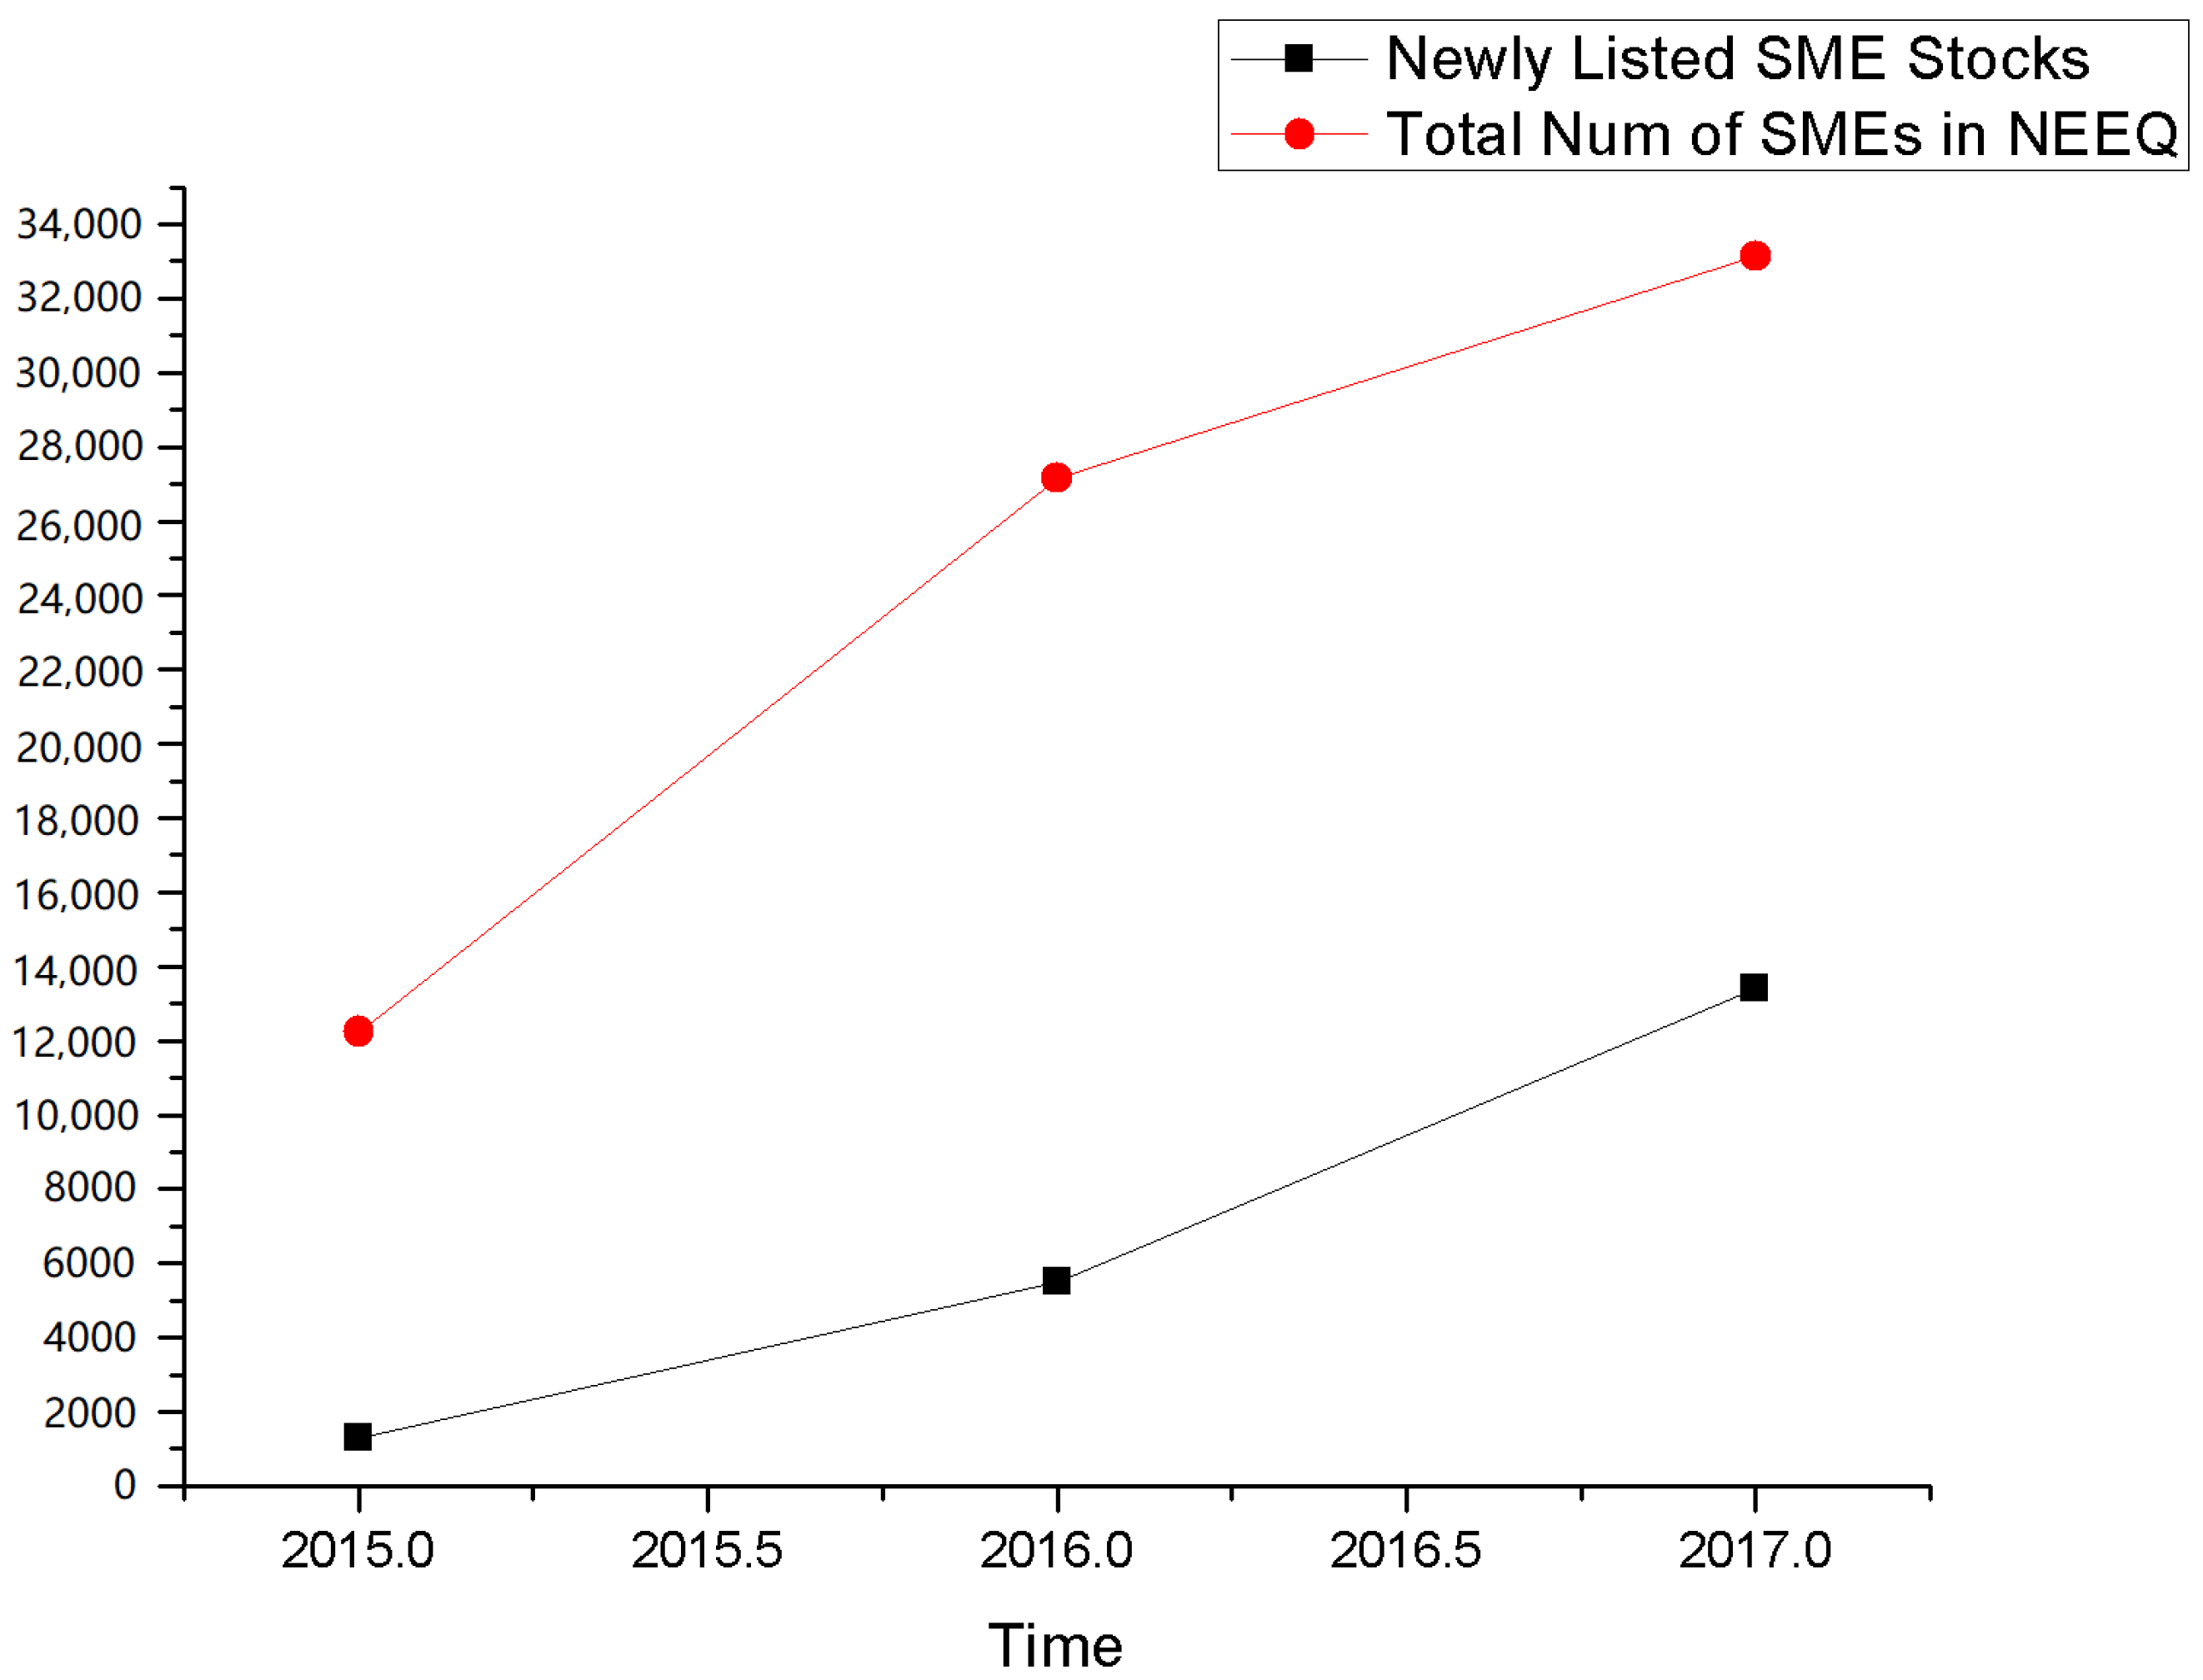
According to the above competencies index system, we have selected the data of 3430 SMEs newly listed in the last three years (2015–2017) from SSE and SZSE. The data acquisition process is shown in the chart below, as in
Figure 2.
Since all SMEs in China must publish complete annual report information in the National Equities Exchange and Quotations (NEEQ) system every year, we used crawlers to obtain annual data of 3430 target SMEs from 2015 to 2017 from NEEQ. The crawler works as shown in
Figure 3.
Since the company’s annual reports published in NEEQ are documents all in PDF versions, which makes it difficult to extract financial and non-financial data. We firstly converted the PDF version annual report to HTML format, and then use regular expressions to extract the target competencies data from the HTML file.
In the end, there are 154,350 records; among them, 3125 records are missing values (2%). After going through the CEMs’ own websites, asking the CEM directly or collecting information from daily news, we fill 2703 missing values with correct values. For the left part of missing values (422, 0.27%), since there is no data loss for two consecutive years, we fill in the corresponding data of the CEM in the previous year or the next year so that there are no missing values for all records.
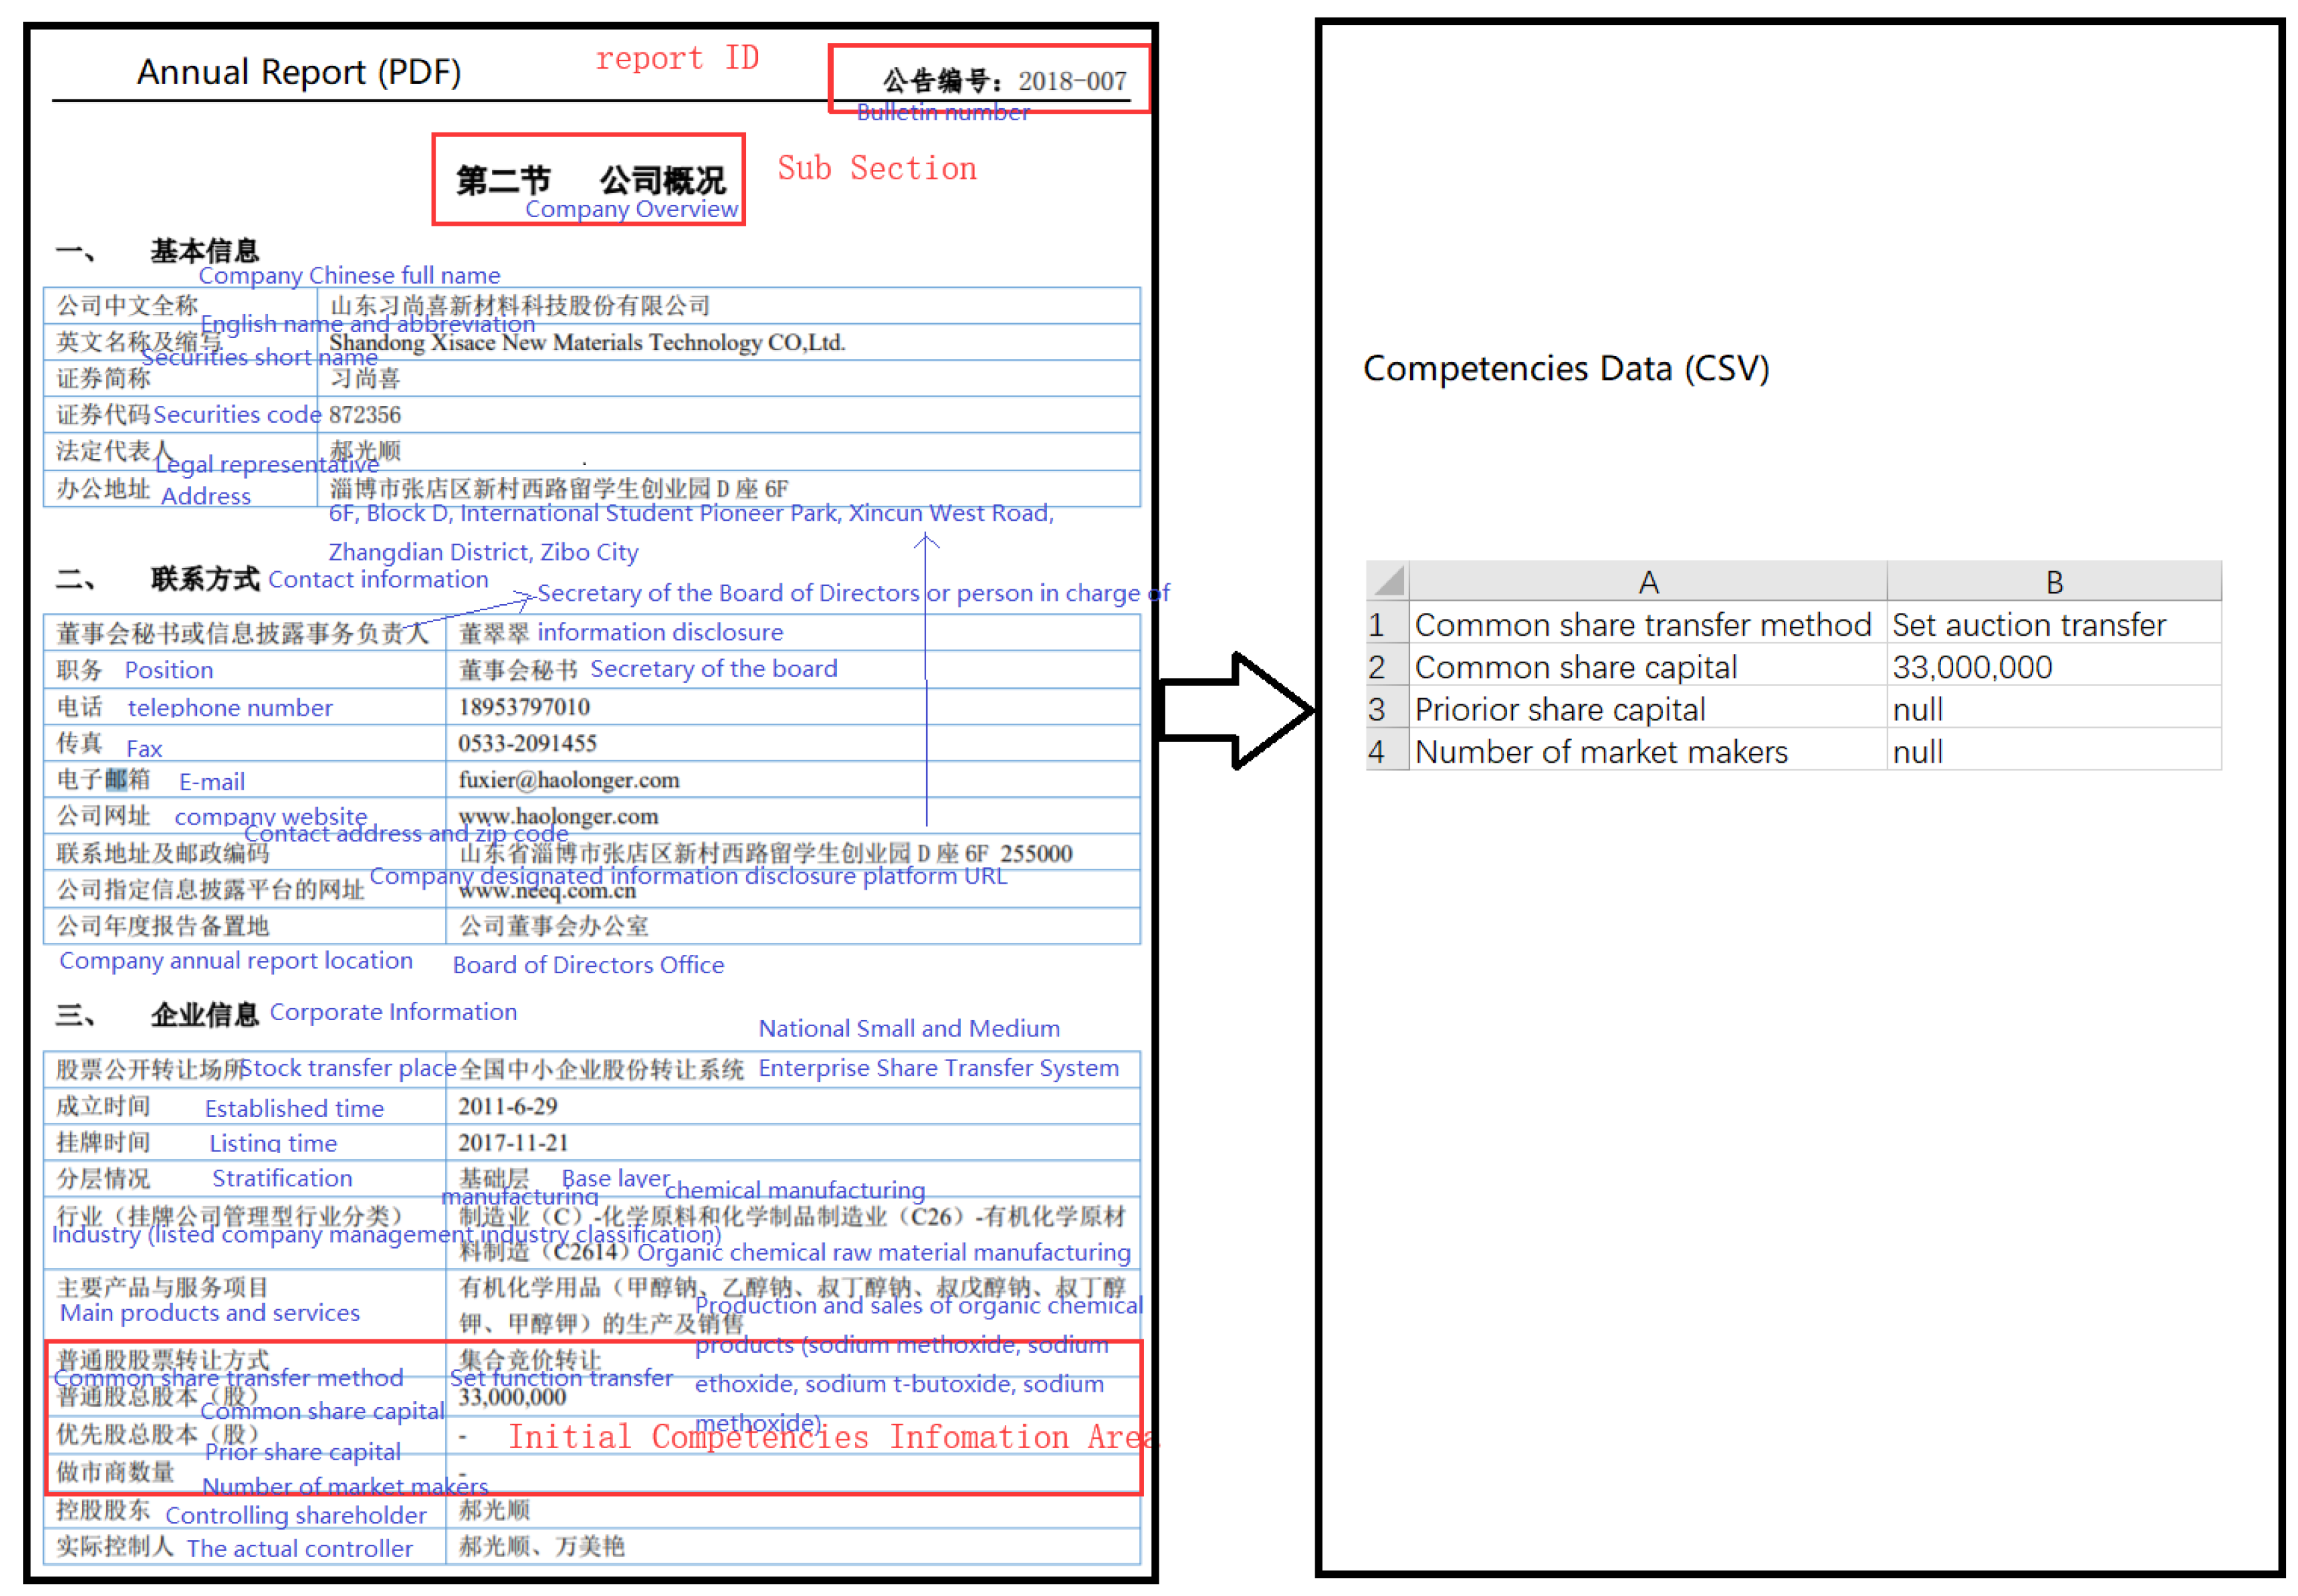
The left part of
Figure 4 shows an example of an annual report in the NEEQ system. All annual reports are divided into chapters, each of which contains our defined competencies indicators. After preprocessing, the unstructured competencies data originally in the PDF annual report will be formatted to the structured CSV data shown in the right part of
Figure 4.
3.3. Comprehensive Evaluation Model
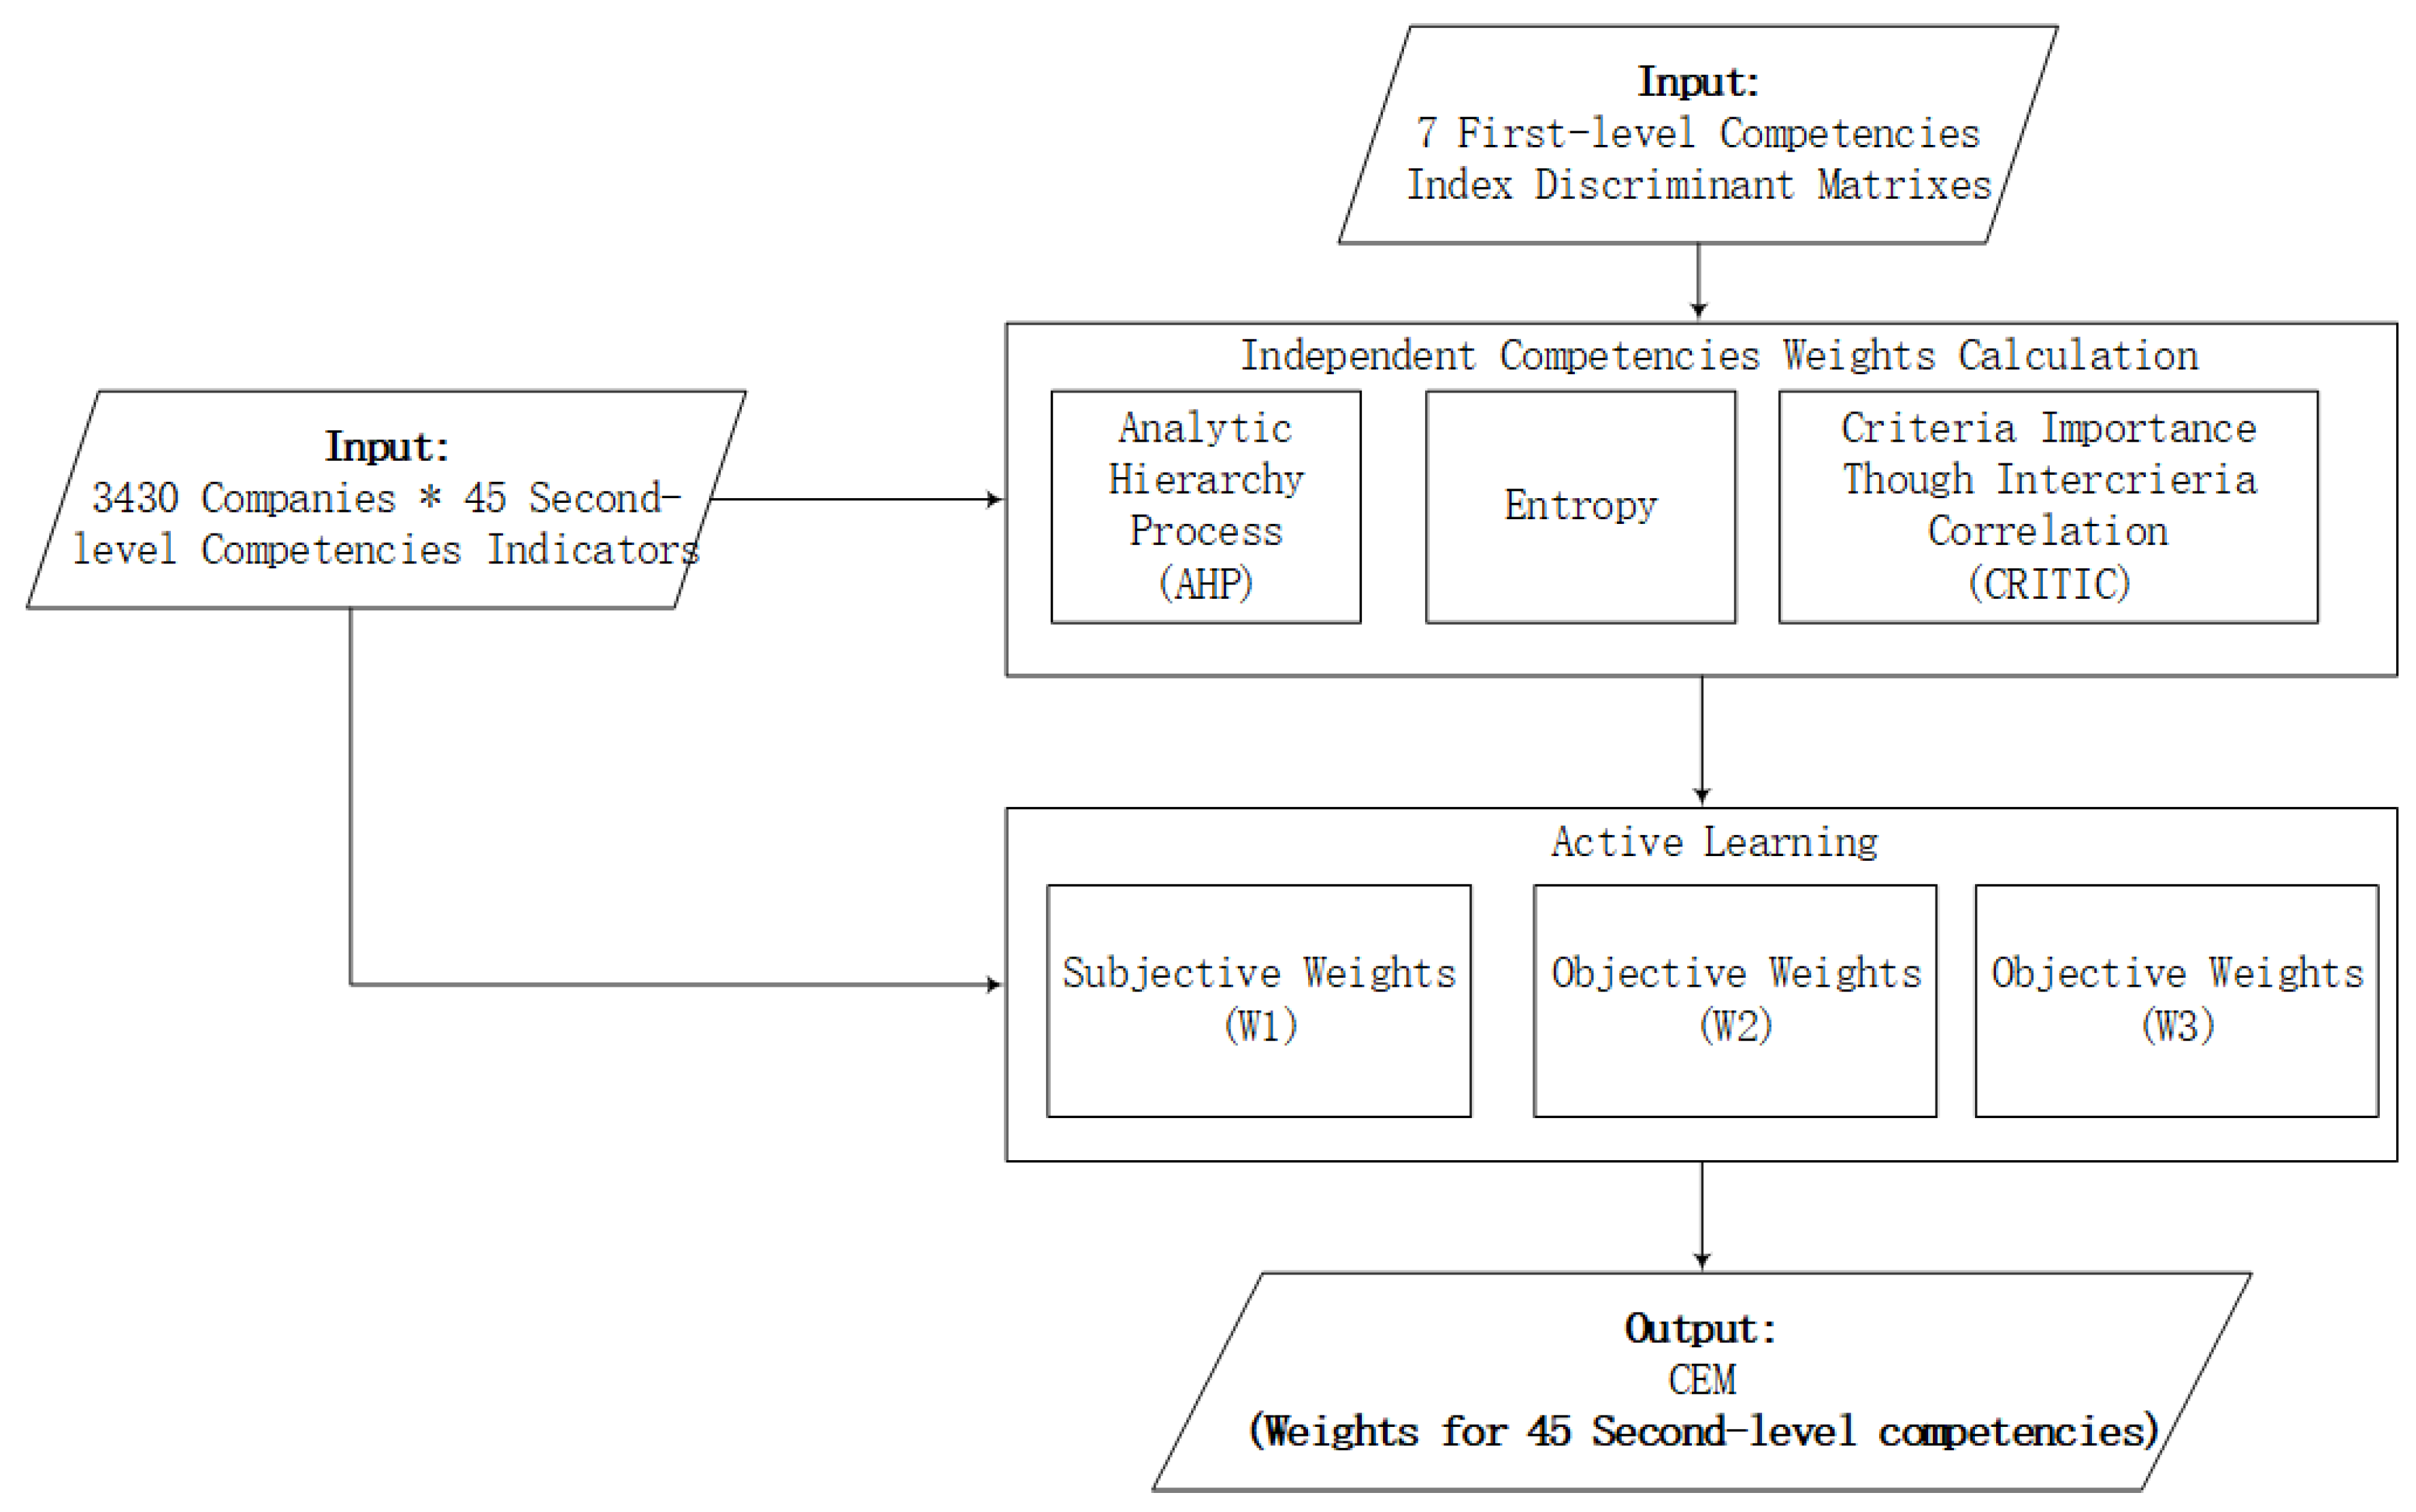
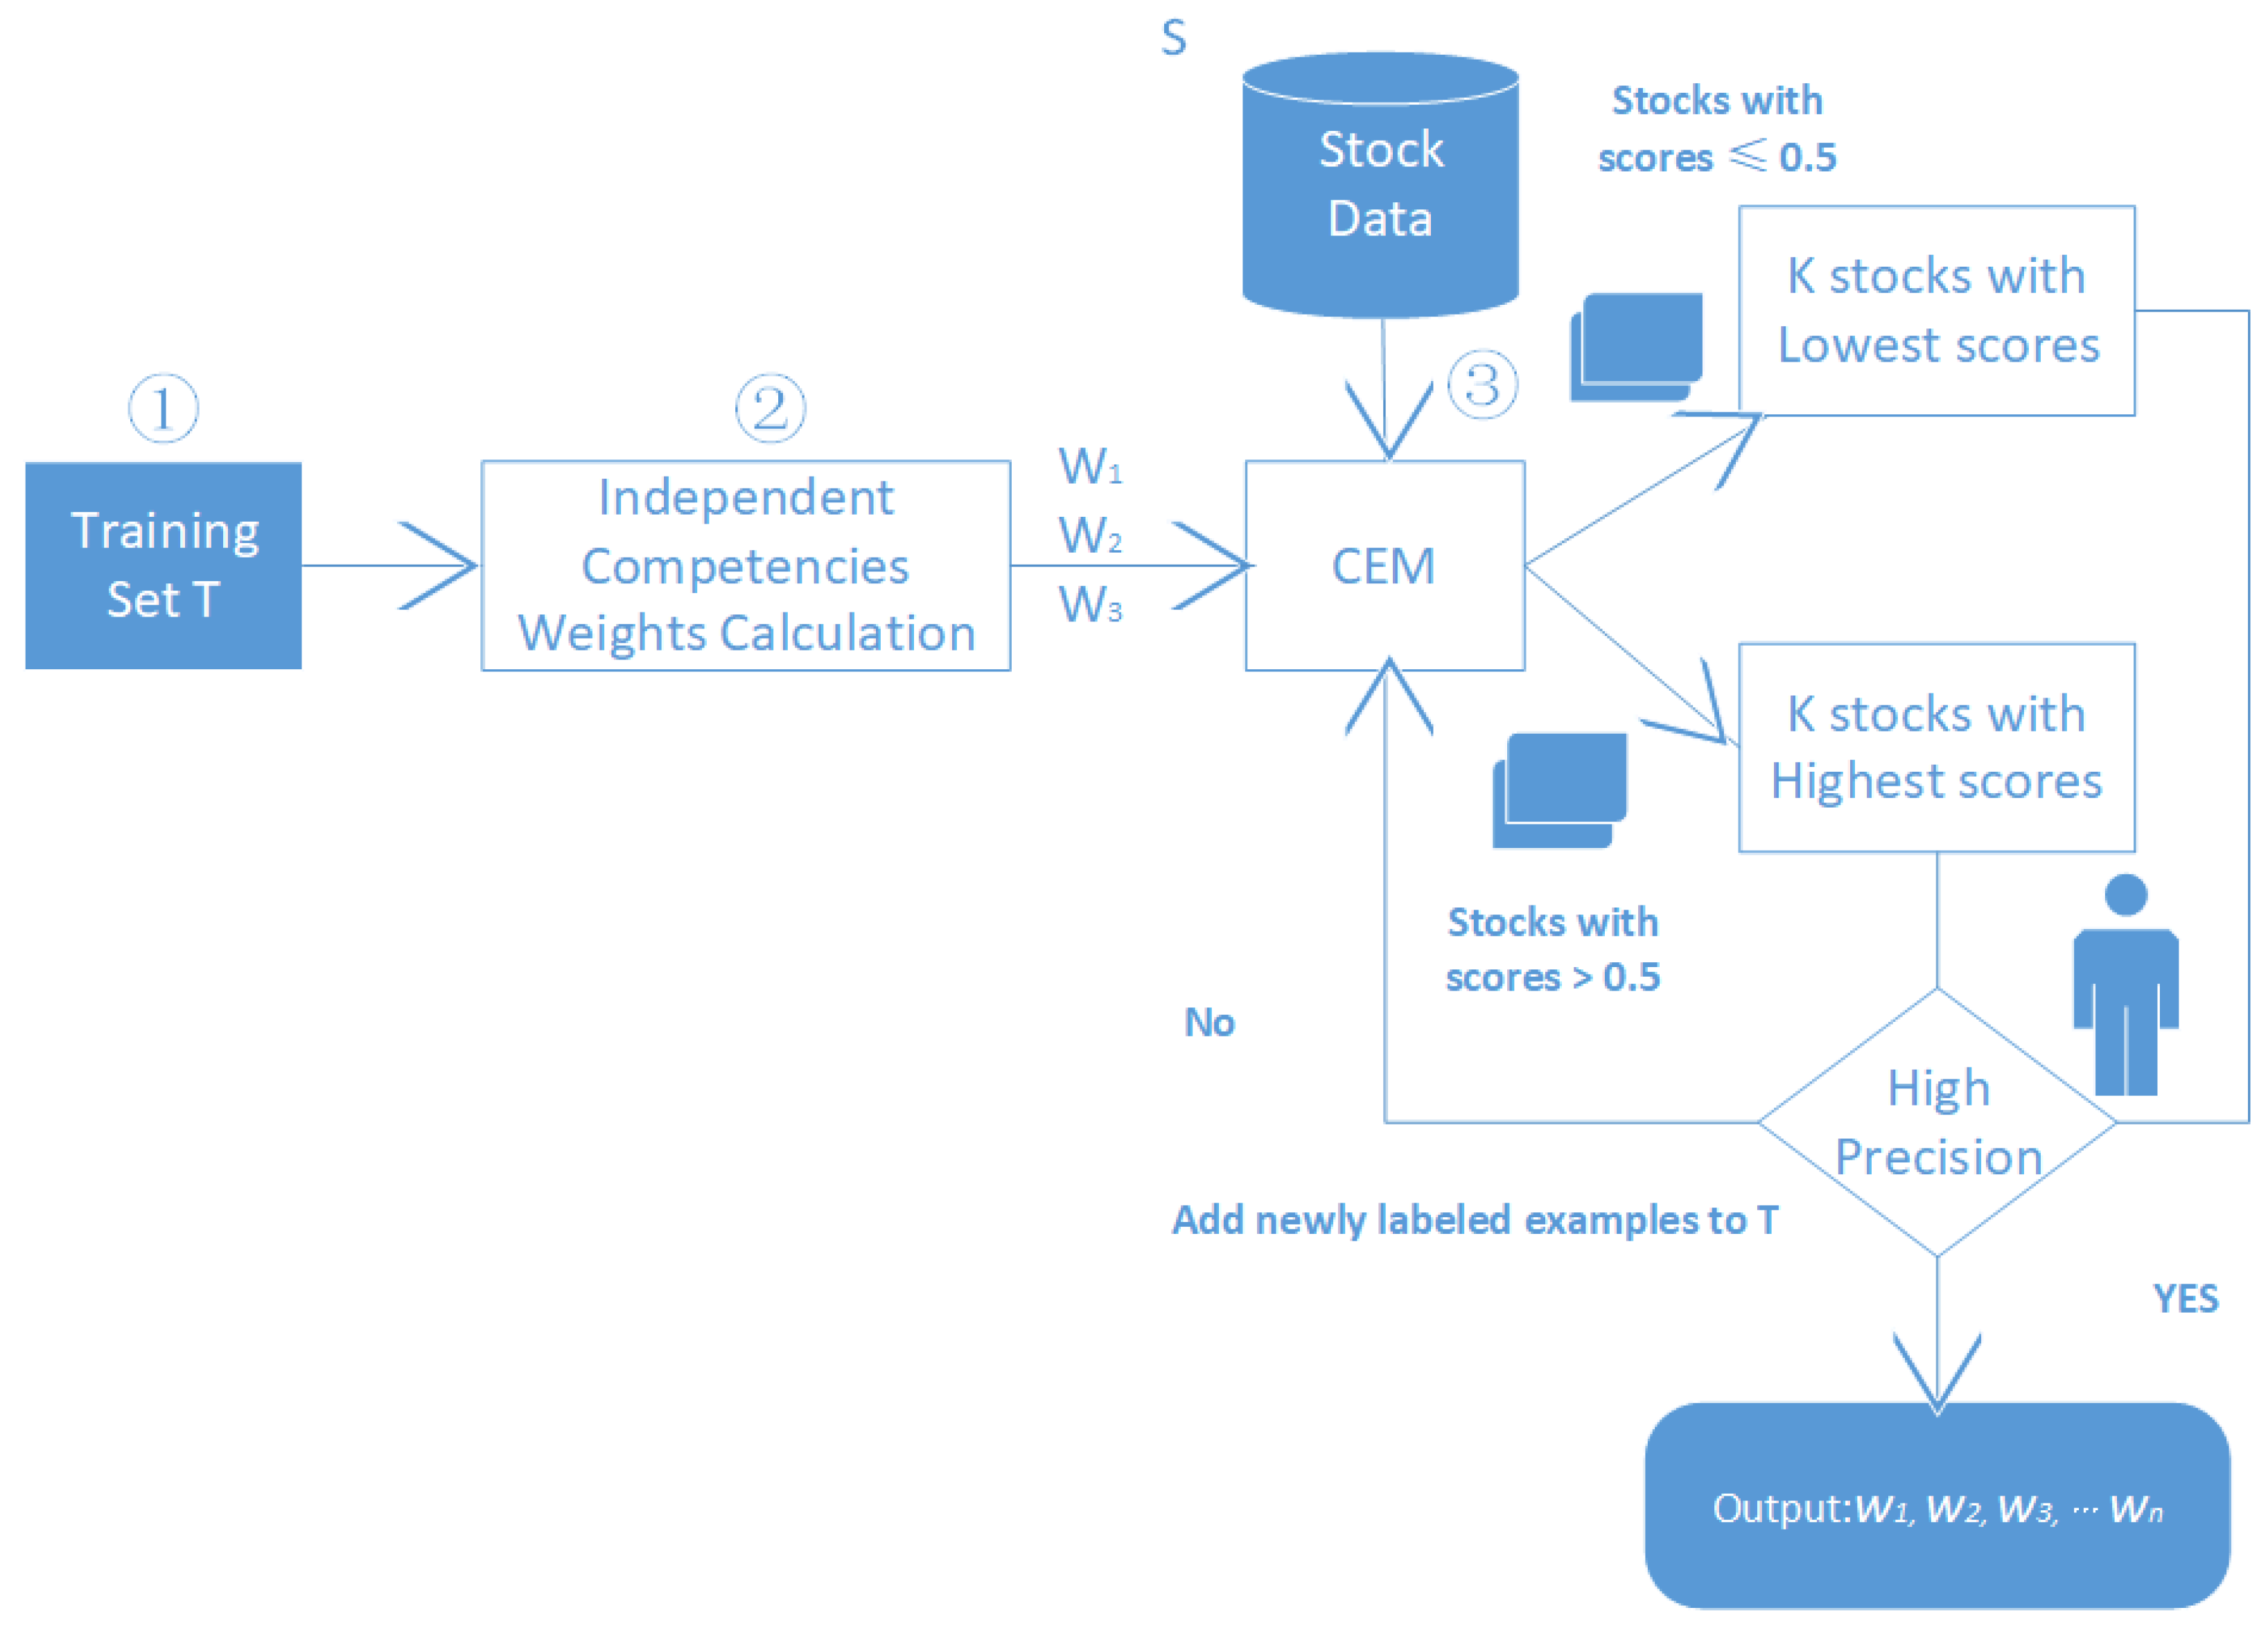
As SMEs entered the market, their profitability and net profit rate in a certain period largely reflect the competitiveness of the company in the current market. In this section, we hope to propose a comprehensive evaluation model (CEM), which ultimately ranks the competitiveness of the enterprise as closely as possible to the net profit margin of the SMEs within a certain period of time. In this way, through the weights of the various competencies indicators in the model, we can know which competencies are the core competencies (which greatly affected the competitiveness of an SME) for SMEs in the current Chinese market, and, at the same time, we can discover some common characteristics of SMEs with high scores under this CEM. The construction framework of CEM is shown in
Figure 5.
In this article, we applied AHP, entropy and the CRITIC (Criteria Importance Though Intercrieria Correlation) method to the same hierarchical structure (as in
Figure 1 and
Table 1,
Table 2,
Table 3,
Table 4,
Table 5,
Table 6 and
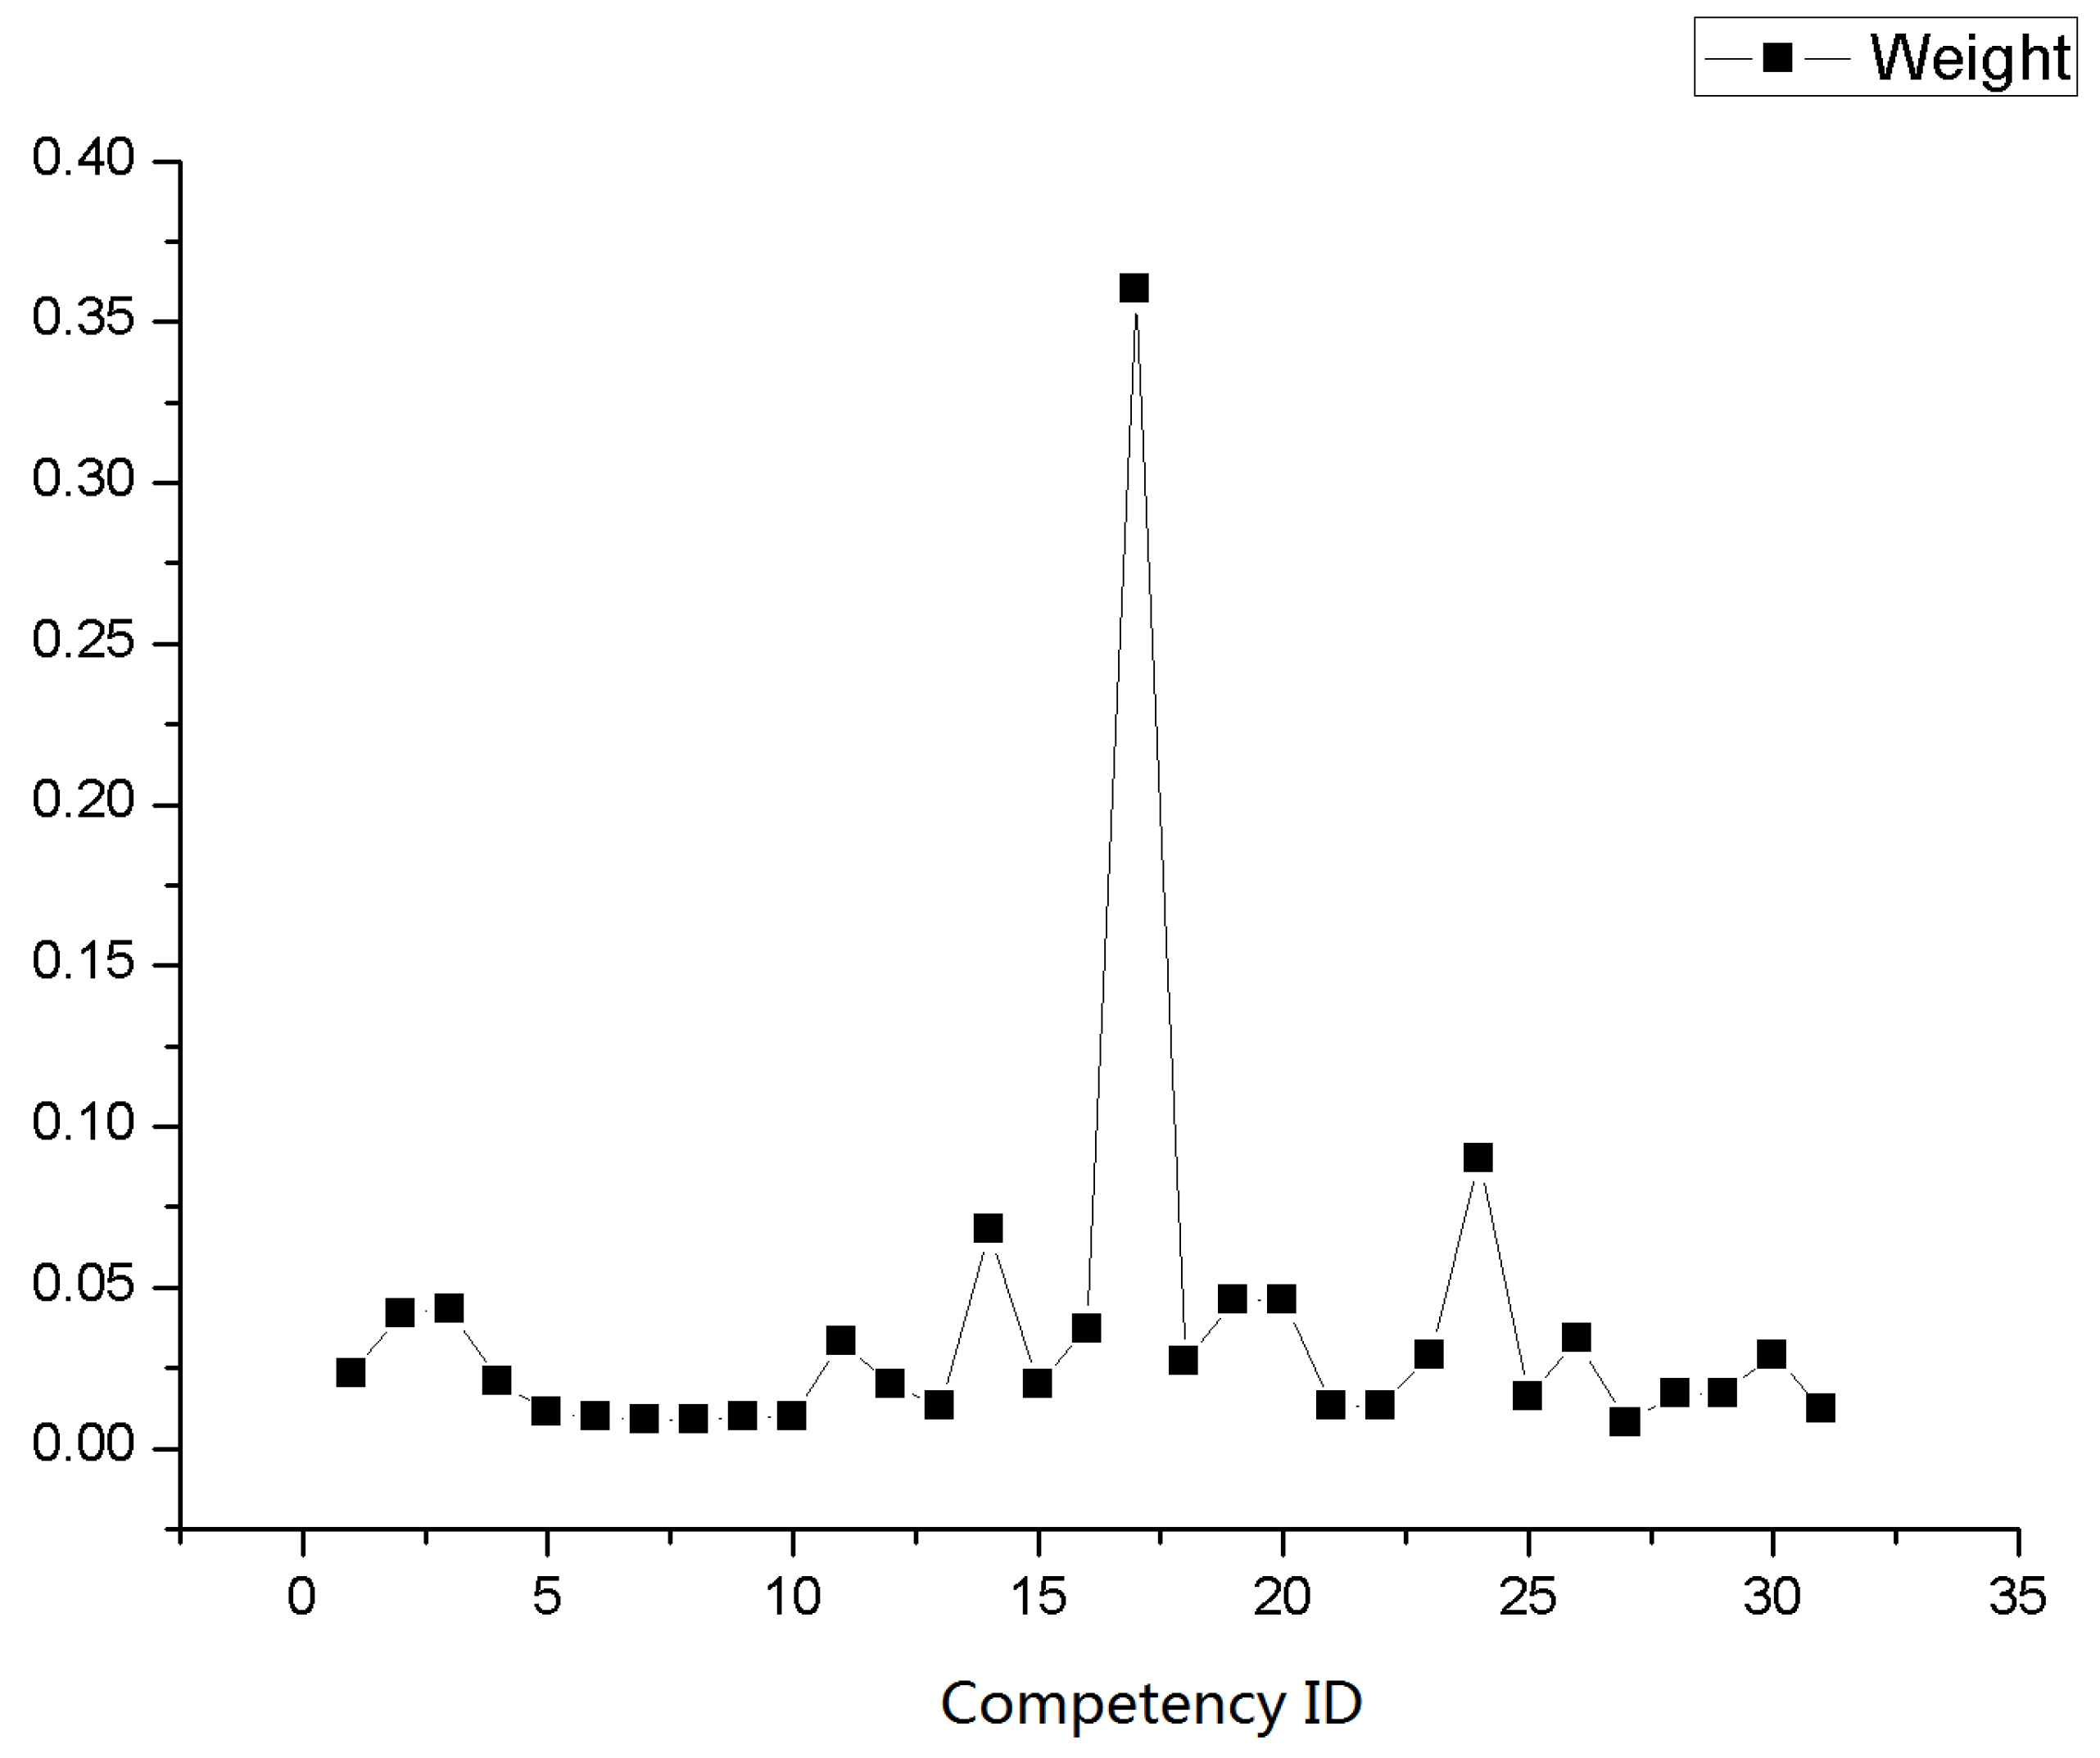
Table 7). All of the three methods above were applied to calculate the weight of the second layer of competencies (45 sub-competencies, see in
Table 1,
Table 2,
Table 3,
Table 4,
Table 5,
Table 6 and
Table 7). As shown in
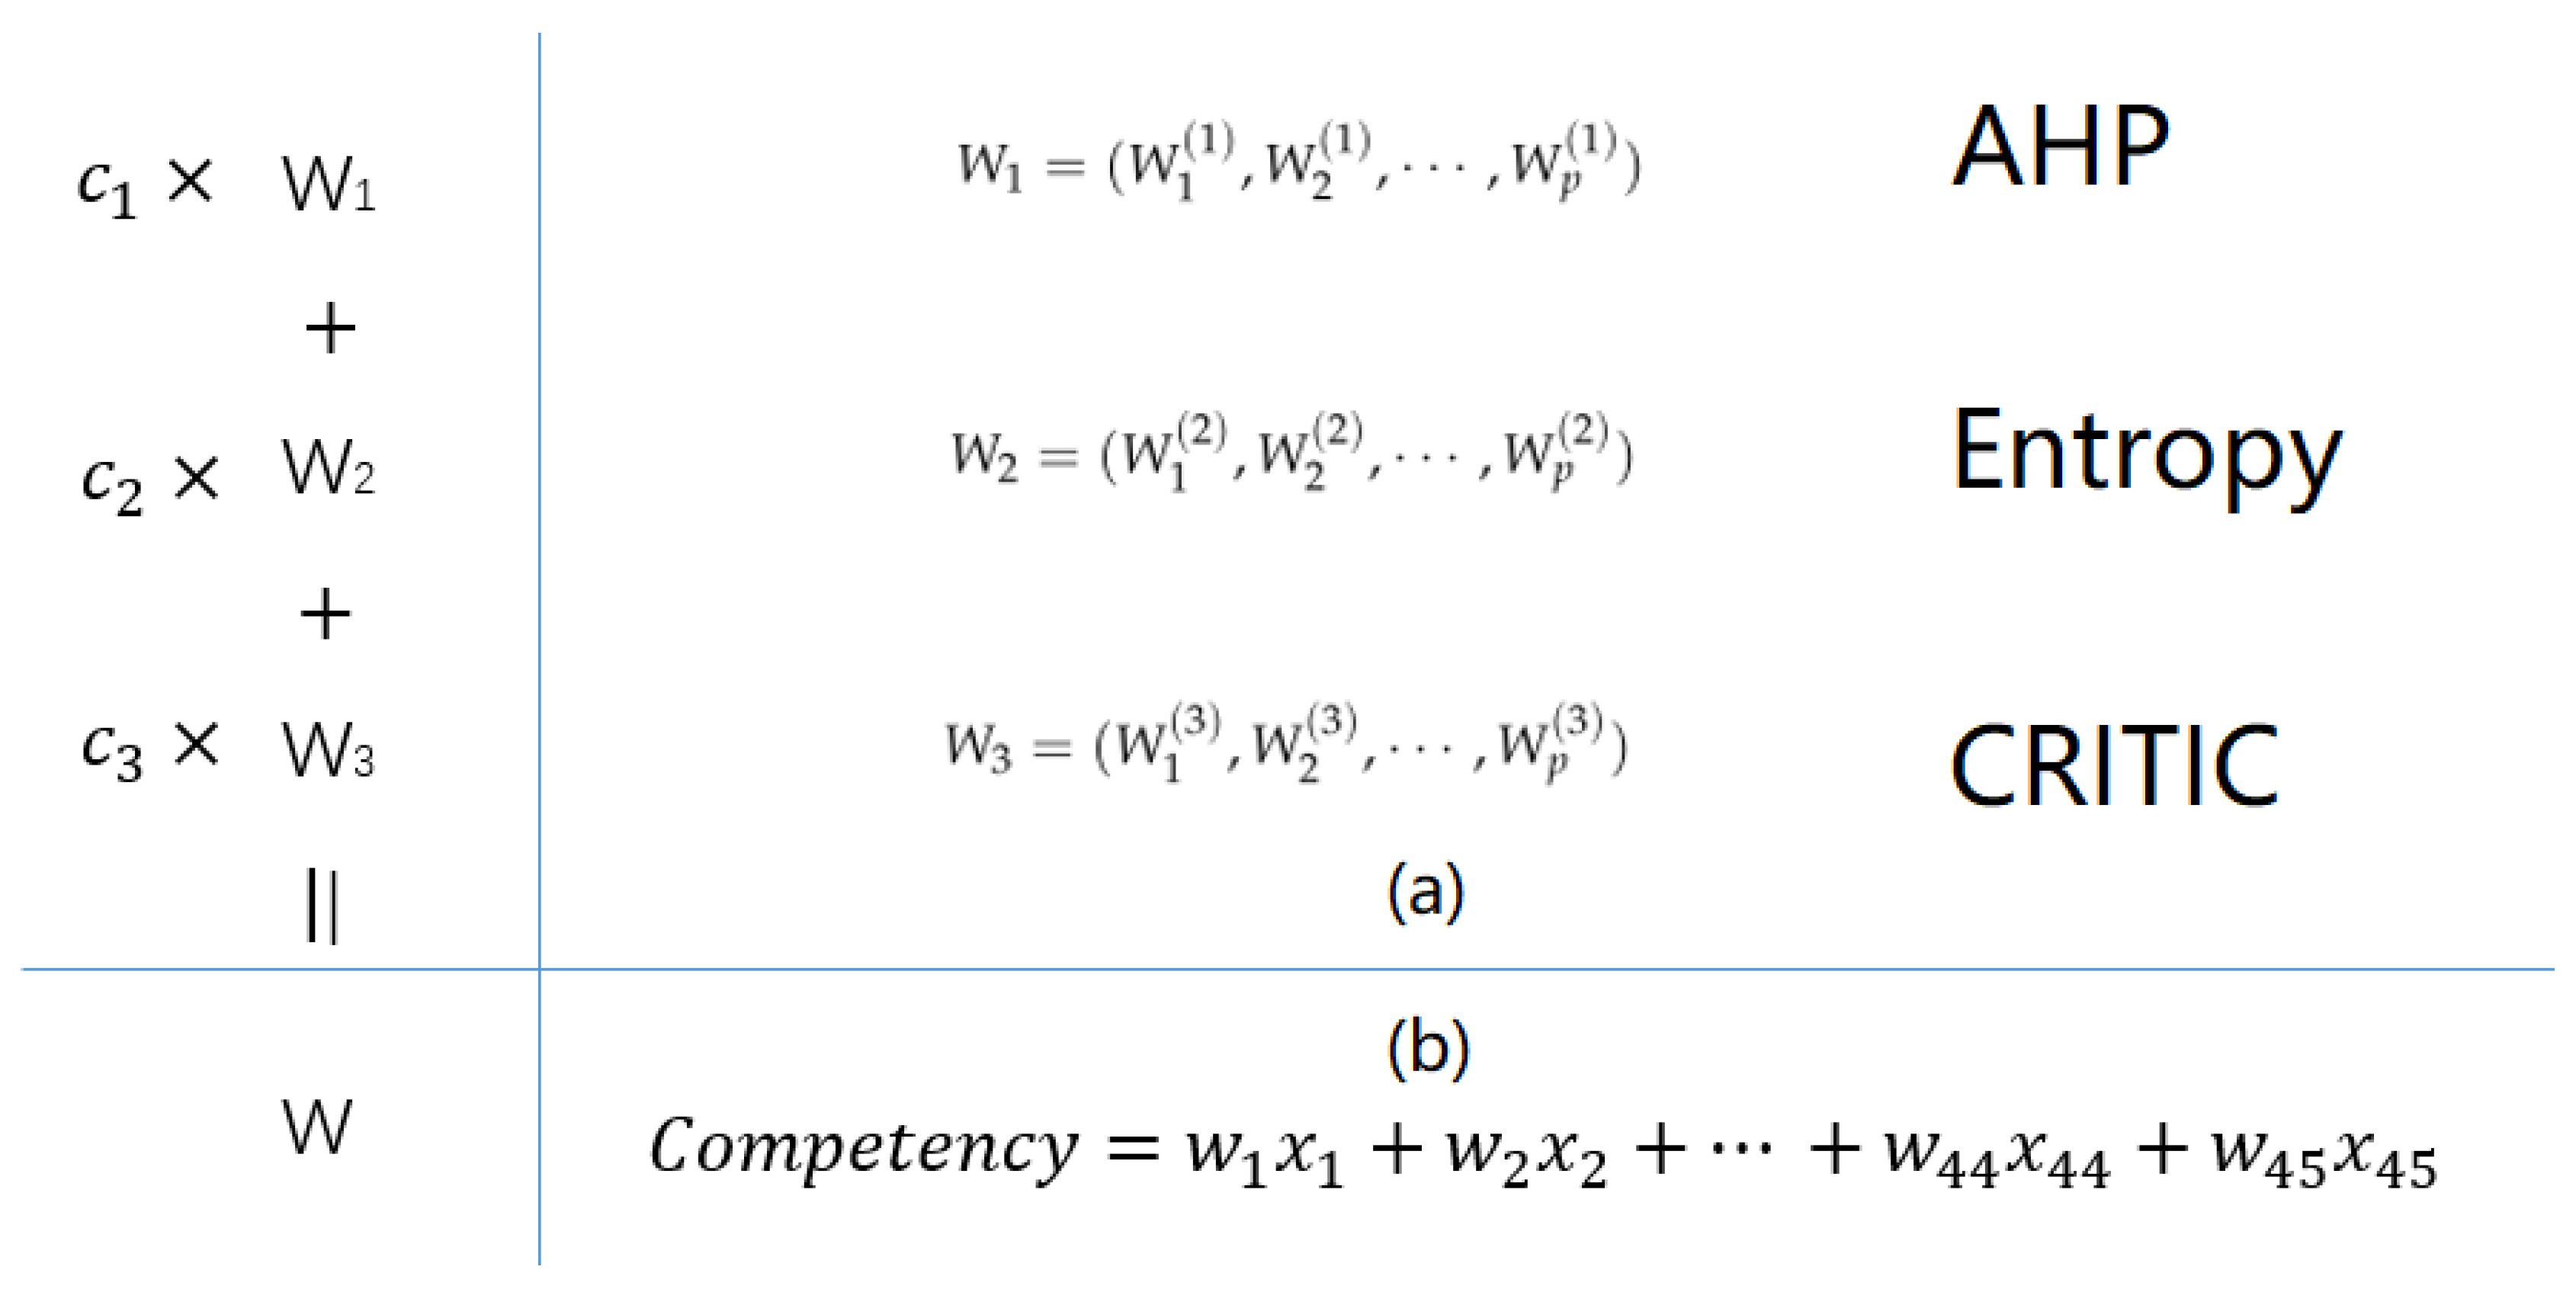
Figure 6, we want to obtain a generalized linear function
Figure 6b, in which
represents the specific value of each sub-competency,
represents the competitive weight in the generalized linear function, and the final
represents the comprehensive competency of a certain SME. For each of the method (AHP, Entropy and CRITIC), we calculate the weights of the generalized linear functions corresponding to them, and obtain the weight vectors
(as in Formula (
2)),
(as in Formula (
4)) and
(as in Formula (
9)). The fused generalized linear function whose weight vector
W is obtained by linear combination of the three weight vectors (as in Formula (
11)), and the weight
of each vector will be adjusted by the active learning process (as in Algorithm 1).
Once we calculate the corresponding weights through AHP, Entropy or CRITIC, we obtain the corresponding generalized linear function, which can calculate the comprehensive competency of an SME under the corresponding method. Here, we calculated the comprehensive competency of 3430 SMEs by the generalized linear functions of AHP, Entropy and CRITIC. It should be noted that each competitiveness index has been normalized, and its value is between 0 and 1, so we set a threshold of 0.5 and SME with comprehensive competency greater than 0.5 is considered to be highly competitive, an SME with a competency less than 0.5 is considered to be weakly competitive. Therefore, 3430 SMEs were divided into two categories. At this time, we will refer to the actual situation of the market value of the corresponding SMEs (the top 50% of the market capitalization of 3430 SMEs were regarded as strong competitiveness, and the latter 50% were regarded as having weaker competitiveness), calculating the accuracy and error rate of the competitive calculation function of the AHP, Entropy and CRITIC methods. Finally, the performance of CEM obtained through active learning will be compared with the performances of these three methods.
AHP. Analytic Hierarchy Process (AHP) is an effective method of operations research. It has a complete set of processing methods and processes for analyzing and quantifying simultaneous problems, which can introduce people’s judgment and related experiences into the system and quantify them, having a scientific way of thinking. AHP’s main features are: when analyzing problems with hierarchical structures, the problem is broken down into multiple single-layer problems, and finally a comprehensive evaluation is performed; emphasis is placed on the contrast of different factors, and weights are often used to make it impractical ranging from level 1 to 9.
We firstly established a three-tiered structure through AHP. The AHP structure we use here is shown as in
Figure 1. Detailed information of sub-criteria are illustrated in
Table 1,
Table 2,
Table 3,
Table 4,
Table 5,
Table 6 and
Table 7. The target layer is the comprehensive development capability of the enterprise, the criteria layer is the first-level competencies layer, and the sub-criterion layer is the second-level competencies layer; then, the questionnaires are designed and the experts were asked to adopt the 1 to 9 scale method to construct the judgment matrix between each layer of factors, then calculating competencies’ weights.
The expert team consists of 18 people in the following three types: six CEM executives, long-term responsible for CEM market business, familiar with current market conditions; six financial professors from Tsinghua University and Peking University, who maintain long-term research in CEM field and six managers of the NEEQ website, the main indicators of NEEQ are set by them. Since the expert team includes researchers with rich research experience, business operators with a lot of market experience and designers of NEEQ systems, we can think that the scores of the expert teams are authoritative.
The weight vector of the criterion layer (first-level competencies layer, seven competencies) obtained by the AHP method is:
The weight vector of the sub-criterion layer (second-level competencies layer, 45 sub-competencies) obtained by the AHP method is:
Entropy. The entropy value is a thermodynamic concept used to measure the disorder of the system. The principle of the entropy method is that, if the index’s entropy value is smaller, the more information the indicator provides, the higher the weight in the evaluation. The specific calculation method is as follows:
The weight of the
ith sample in the
jth indicator is:
The entropy of the
jth indicator is:
The difference coefficient of index
is:
The weight of the
jth indicator is:
Similarly, the entropy method is applied to calculate the weights vector of the second-level competencies (second-level competencies layer, 45 sub-competencies) relative to the target layer, which is expressed as:
CRITIC. The CRITIC method (the importance of Criteria is related to Intercrieria) is an objective weighting method. When calculating index weights, two factors are considered. One is the contrast intensity, also the conflict, which refers to the size of the difference between each data in a certain index column. The difference is shown by the standard deviation. The larger the contrast intensity is, the greater the weight of the corresponding indicator is; the correlation between the indicators is also a consideration factor. If the correlation between a certain indicator and other indicators is relatively large, it means that part of the information expressed by this indicator can be replaced by other indicators. The weight of such indicator should be small. The CRITIC method is calculated as follows:
In Equation (
8),
refers to the correlation coefficient between index
k and index
j.
represents for the standard deviation of index
j:
The CRITIC method calculates the weight vector of the second-level competencies (second-level competencies layer, 45 sub-competencies) relative to the target layer.
The advantage of the AHP algorithm is that it considers the opinions of experts on the importance of competencies. The disadvantage is that they sometimes result in subjective misjudgments.
Disturbance and objectively empowering methods (Entropy and CRITIC), rely entirely on objective data and lack understanding of practical issues.
Therefore, in order to overcome the shortcomings of the two methods of weighting, to exert their respective advantages, the solution is required to obtain the optimal combination of the two methods of weighting.
3.4. Active Learning and Evaluating
We finally hope to get a classifier similar to the following Formula (
10):
Through this classifier, the scores of various competency indicators of SMEs (
) are taken as input, and finally the competitiveness score of the enterprise
is obtained. In Formula (
10), the value of A is given by the following Formula (
11):
When the value of is greater than a certain threshold V, it can be considered that the enterprise has strong competitiveness. On the contrary, the enterprise is considered to have weaker competitiveness. In this way, the CEM can be based on the weight of subjective factors and the weight of objective factors comprehensively determine the competitiveness of the company. In the traditional evaluation model, there is no comprehensive weight calculation process. A simple synthesis idea is to use a large amount of annotation data to train the CEM. However, this requires a lot of manual annotation and is very time consuming.
Here, we have introduced active learning to combine the various subjective weights and objective weights. Active learning requires only a small number of manual annotations with very few rounds, with a good enough training result obtained. The process of active learning is shown in
Figure 7.
Our goal is to obtain a generalized linear function
Figure 6b, with high precision in judging the comprehensive competencies for SMEs. As is illustrated above, CEM combines the weights of AHP(
), Entropy(
) and CRITIC(
) in Formula (
11). Here, we used an active learning algorithm to carry out the adjustment work for the factor
of these three weights. Firstly, we set the training set
T to be empty. We used AHP, Entropy and CRITIC to calculate their independent competitive weight vectors (
,
,
), and combined the three weights with the same coefficient to obtain the initial CEM (
). Next, we input each index value of SME into CEM. Here, the threshold of
is set to 0.5,
k stocks with the highest comprehensive competitiveness score
and
k stocks with the lowest comprehensive competitiveness scores are taken respectively, which are judged by domain experts. If a stock is judged as “low competitiveness” by CEM while actually behaves “highly competitive”, then the record is marked as an erroneous judgment. Conversely, it is a correct judgment. When the accuracy of the judgment is higher than a certain value (e.g., 0.8), which means that the current round meets the accuracy rate greater than the value. This indicates that the model has a good training effect and the model in this round will be output as final CEM. Otherwise, the marked data will be input into the training set
T, and the coefficients of each weight in the model are adjusted through active learning again. A more systematic algorithm description is shown below in Algorithm 1:
| Algorithm 1 Framework of Active Learning for Coefficients of AHP Weight, Entropy Weight and CRITIC Weight. |
- Input:
The initial coefficient for AHP weight, ; The initial coefficient for Entropy weight, ; The initial coefficient for CRITIC weight, ; Threshold for judgment precision, ; Number of records selected for human judgment, k; Stock data set, ; CEM function, ; Learning module function ; - Output:
The initial coefficient for AHP weight, ; The initial coefficient for Entropy weight, ; The initial coefficient for CRITIC weight, ; - 1:
Training Set ; - 2:
for company do - 3:
- 4:
end for - 5:
sorting companies according to ; - 6:
for stock companies with highest scores and k companies with lowest scores do - 7:
if companies in is with high competency then - 8:
; - 9:
else - 10:
; - 11:
end if - 12:
Put into T; - 13:
end for - 14:
Precision ← calculating precision of - 15:
if Precision > then return ,,; - 16:
else - 17:
,, = - 18:
repeat Step 5 to Step 15 - 19:
until Precision > return ,,; - 20:
end if
|
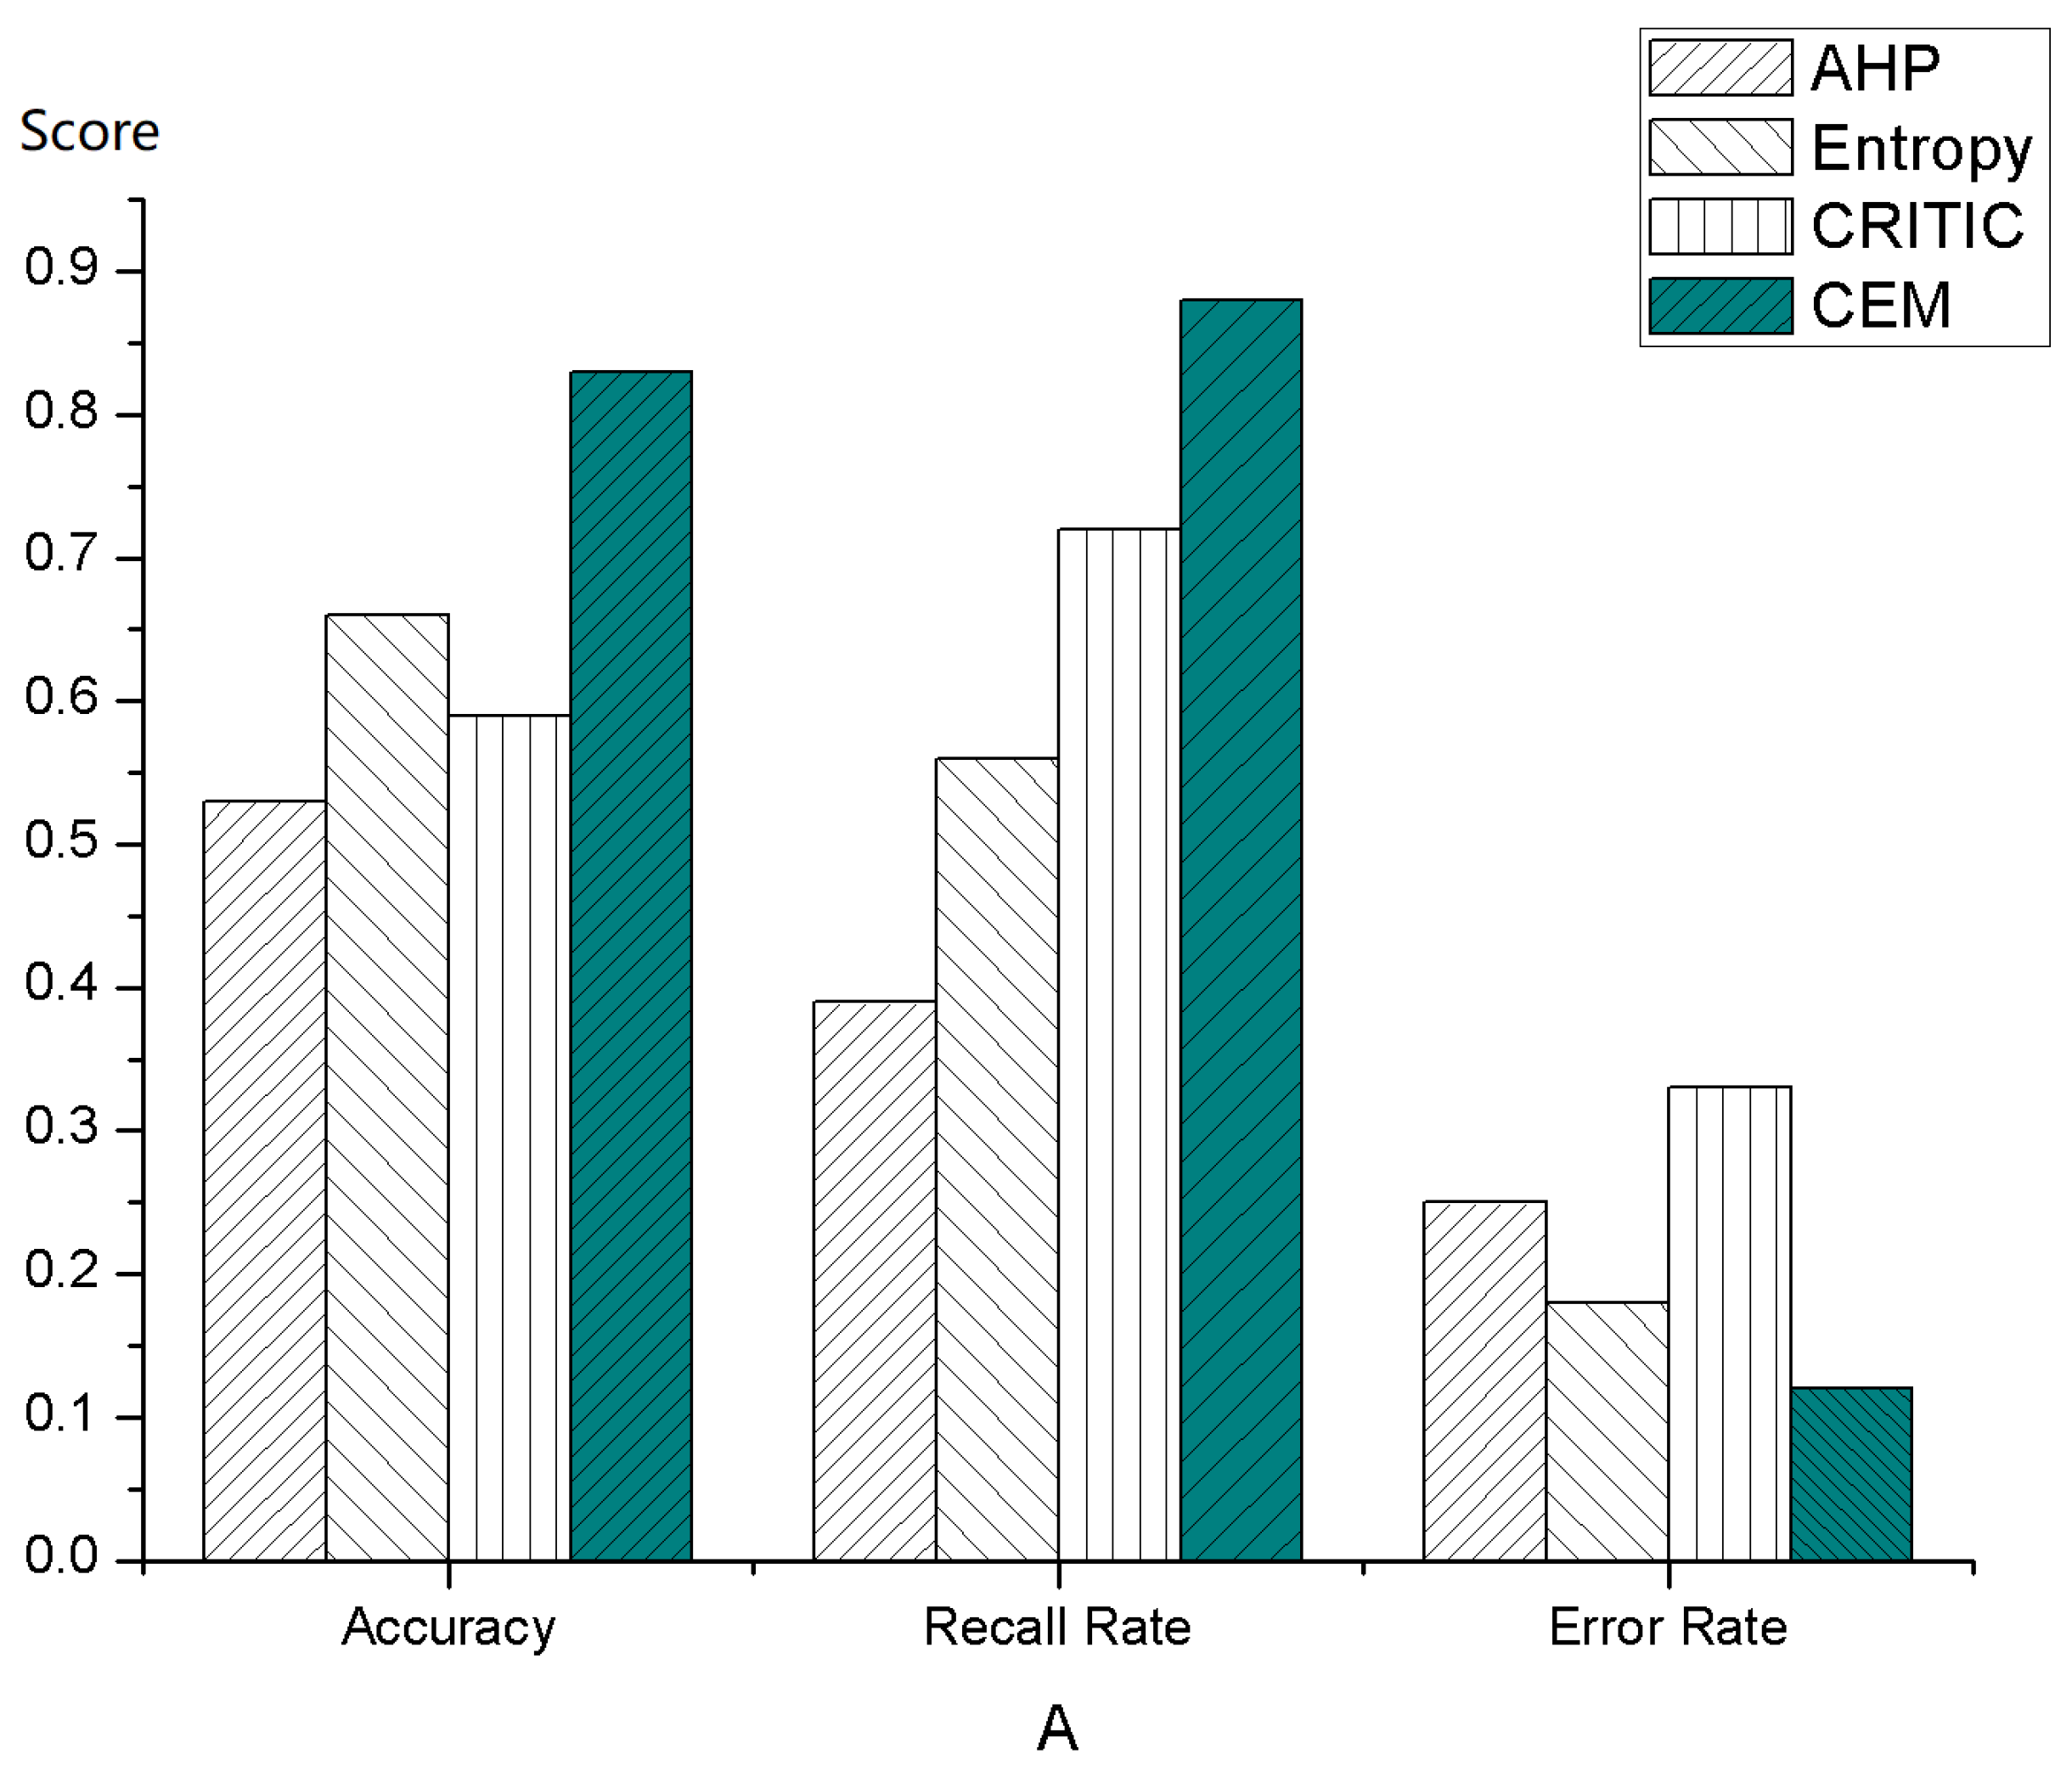
Here, we use the accuracy rate (the ratio of the CEM decision result to the actual situation), the recall rate (the ratio of the highly competitive SME in reality is determined by the CEM to be highly competitive) and the error rate. The comparison results show that CEM is better than the three independent methods in Accuracy (0.82) and Recall (0.85). At the same time, the CEM algorithm proposed in this paper has the lowest error rate, as is revealed in
Figure 8.
We also compared the time complexity of different competitiveness evaluation algorithms, as shown in
Table 8. The value
k is the number of samples extracted from extreme values during each round of active learning, which is much less than the number of samples
n. From
Table 8, it can be found that CEM has the best time complexity.


