Congestion Quantification Using the National Performance Management Research Data Set


Abstract
:1. Introduction
2. Data and Case Study Description
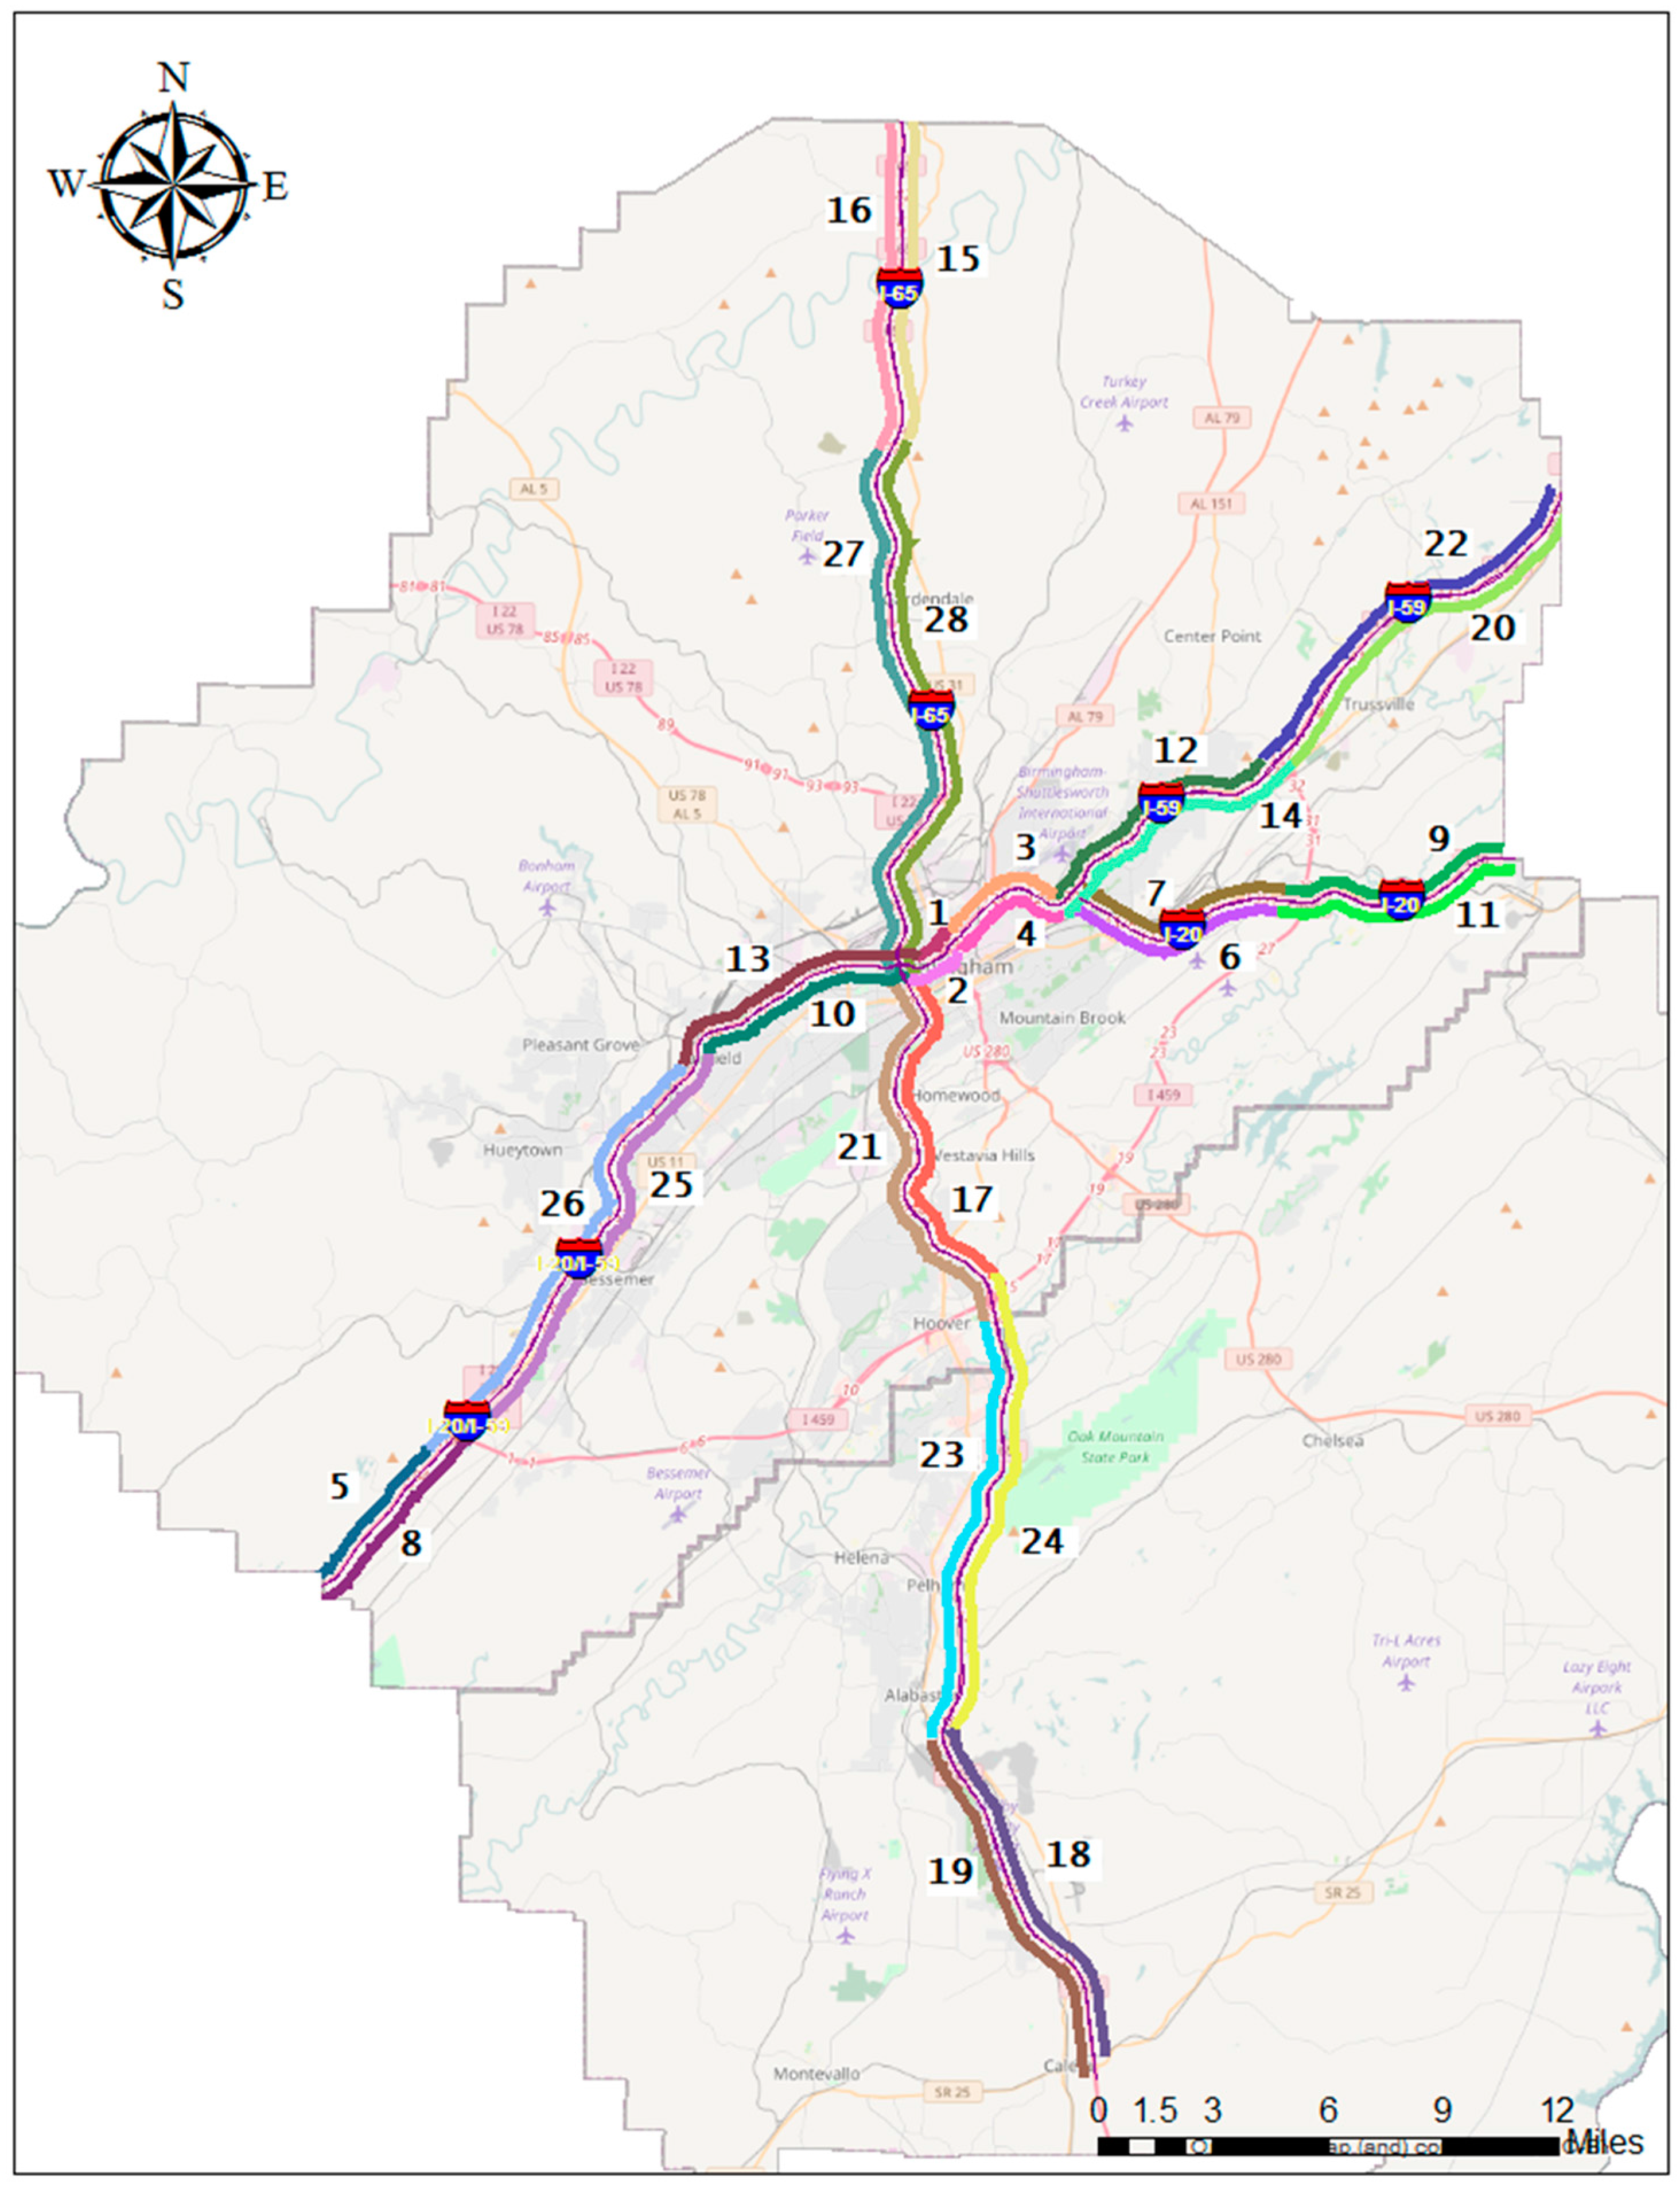
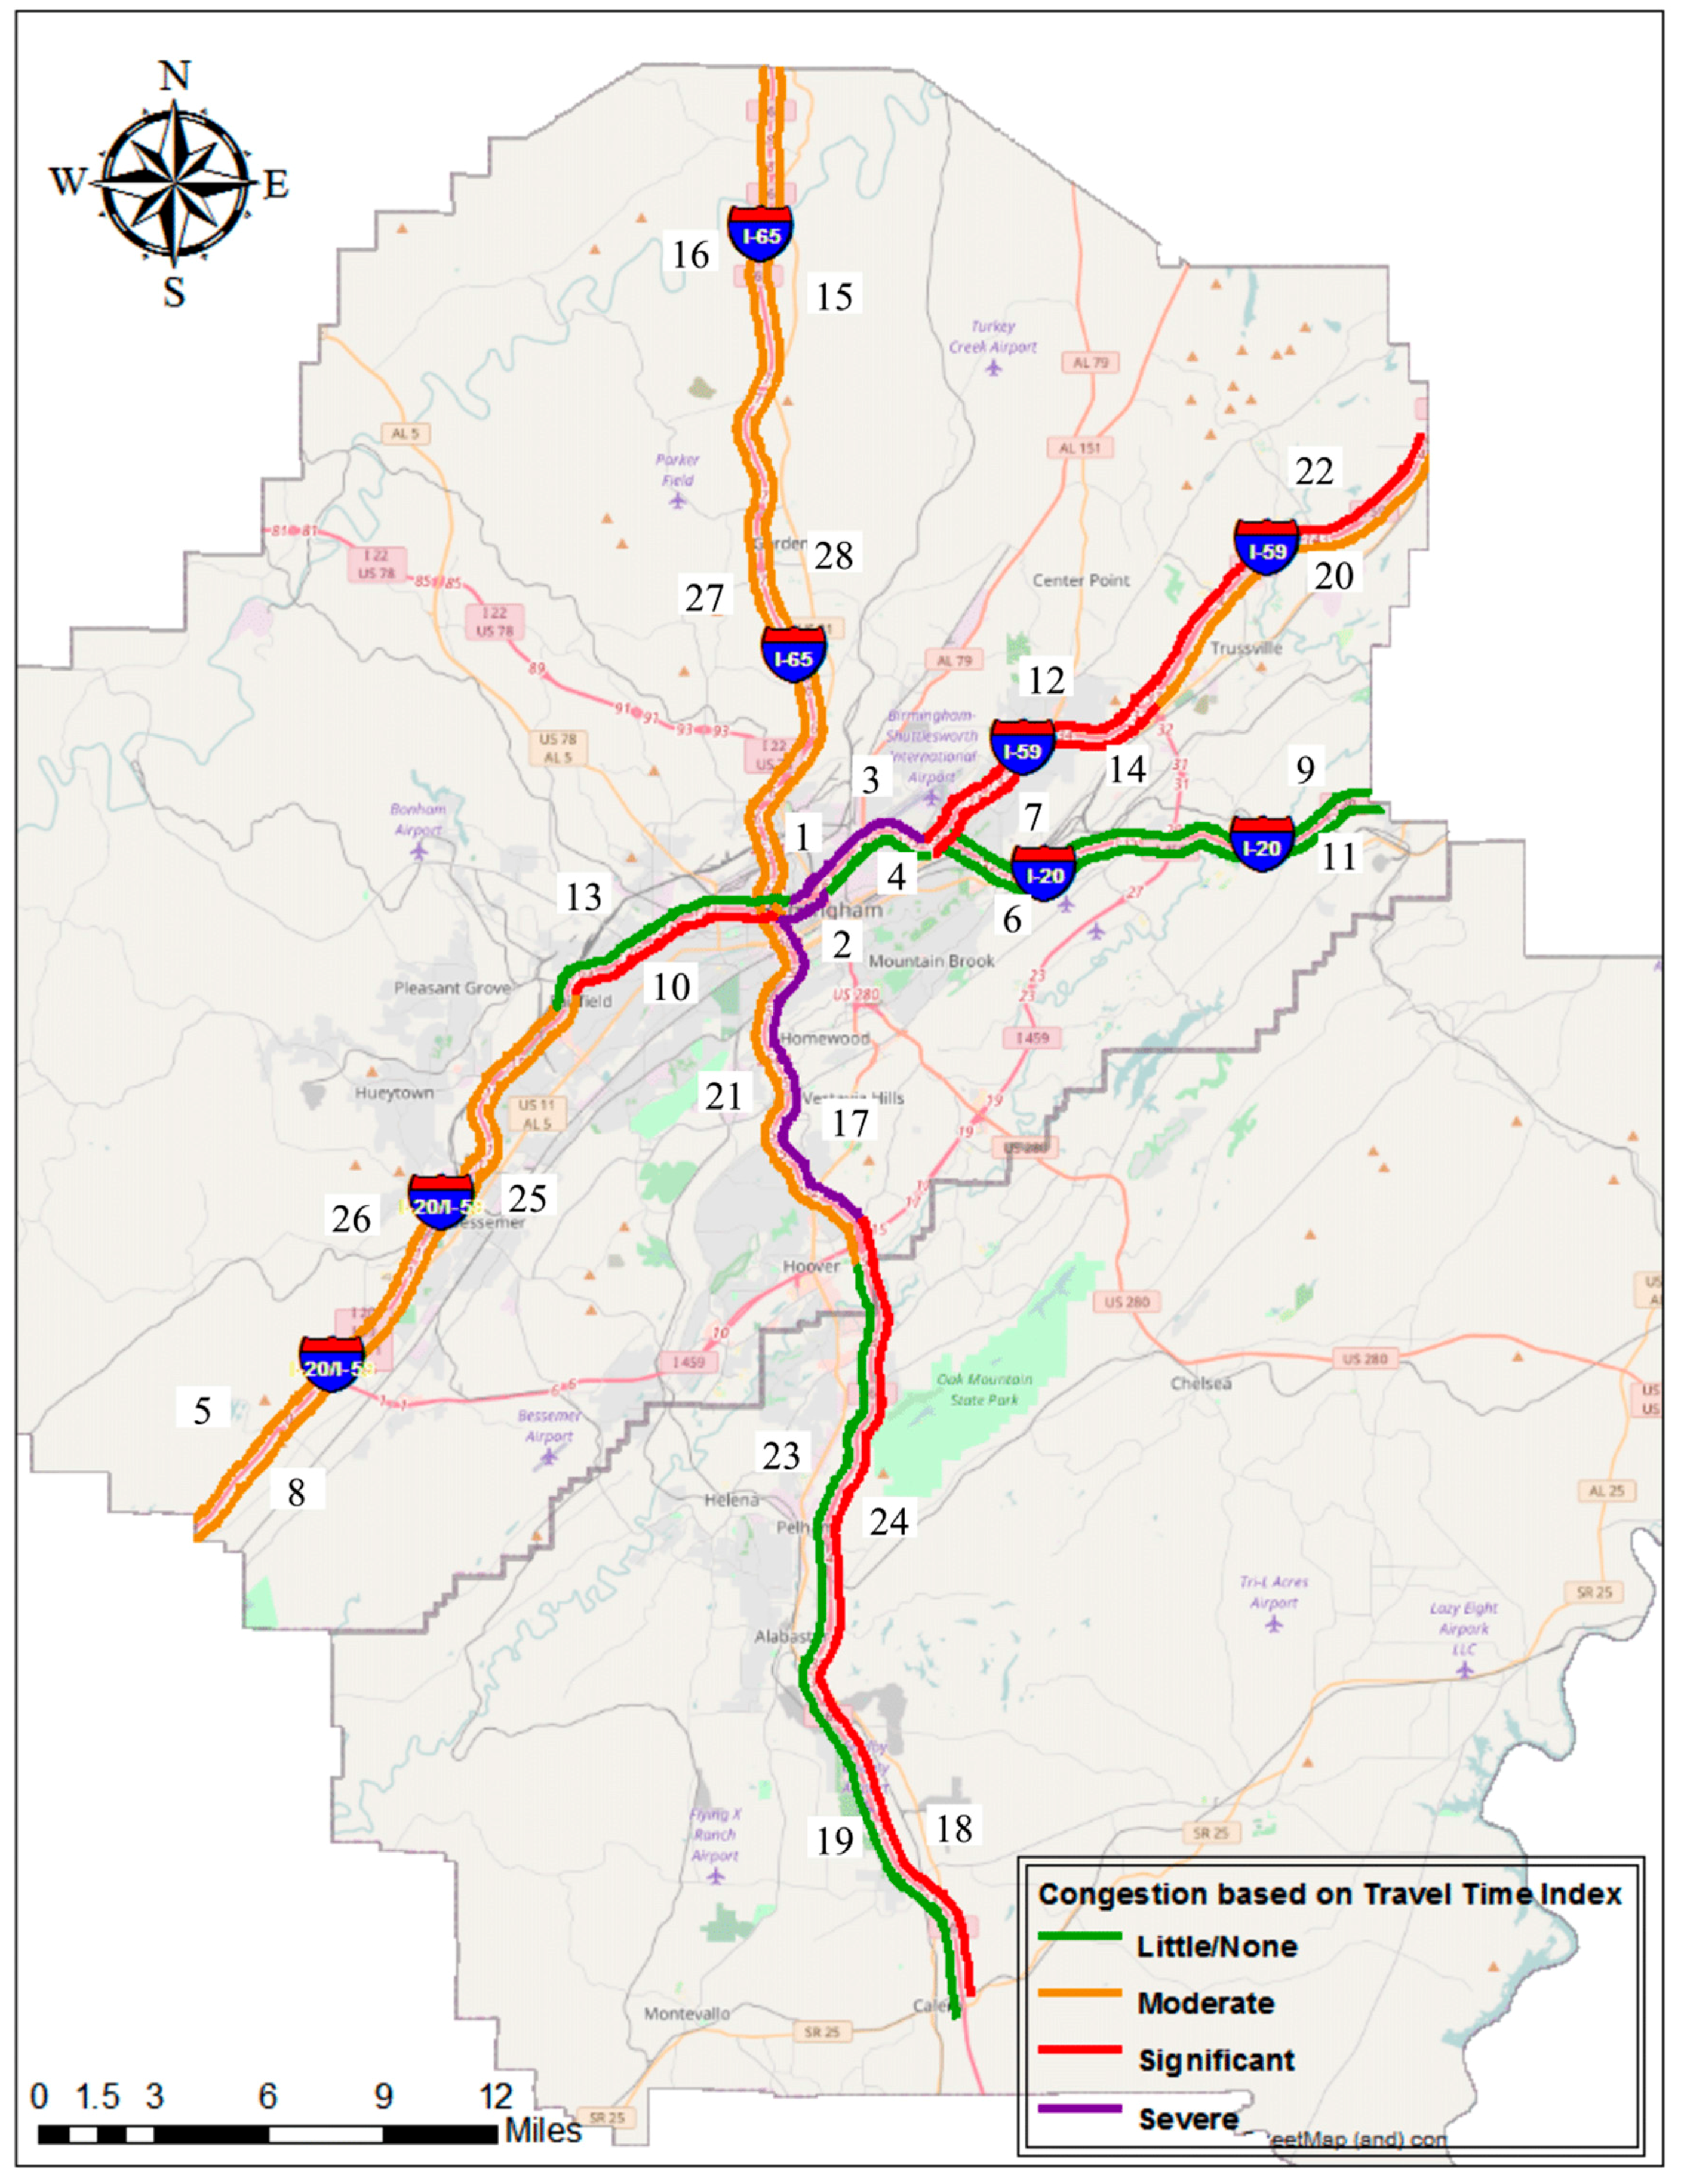
2.1. Site Location
2.2. Data Set Overview
3. Methodology
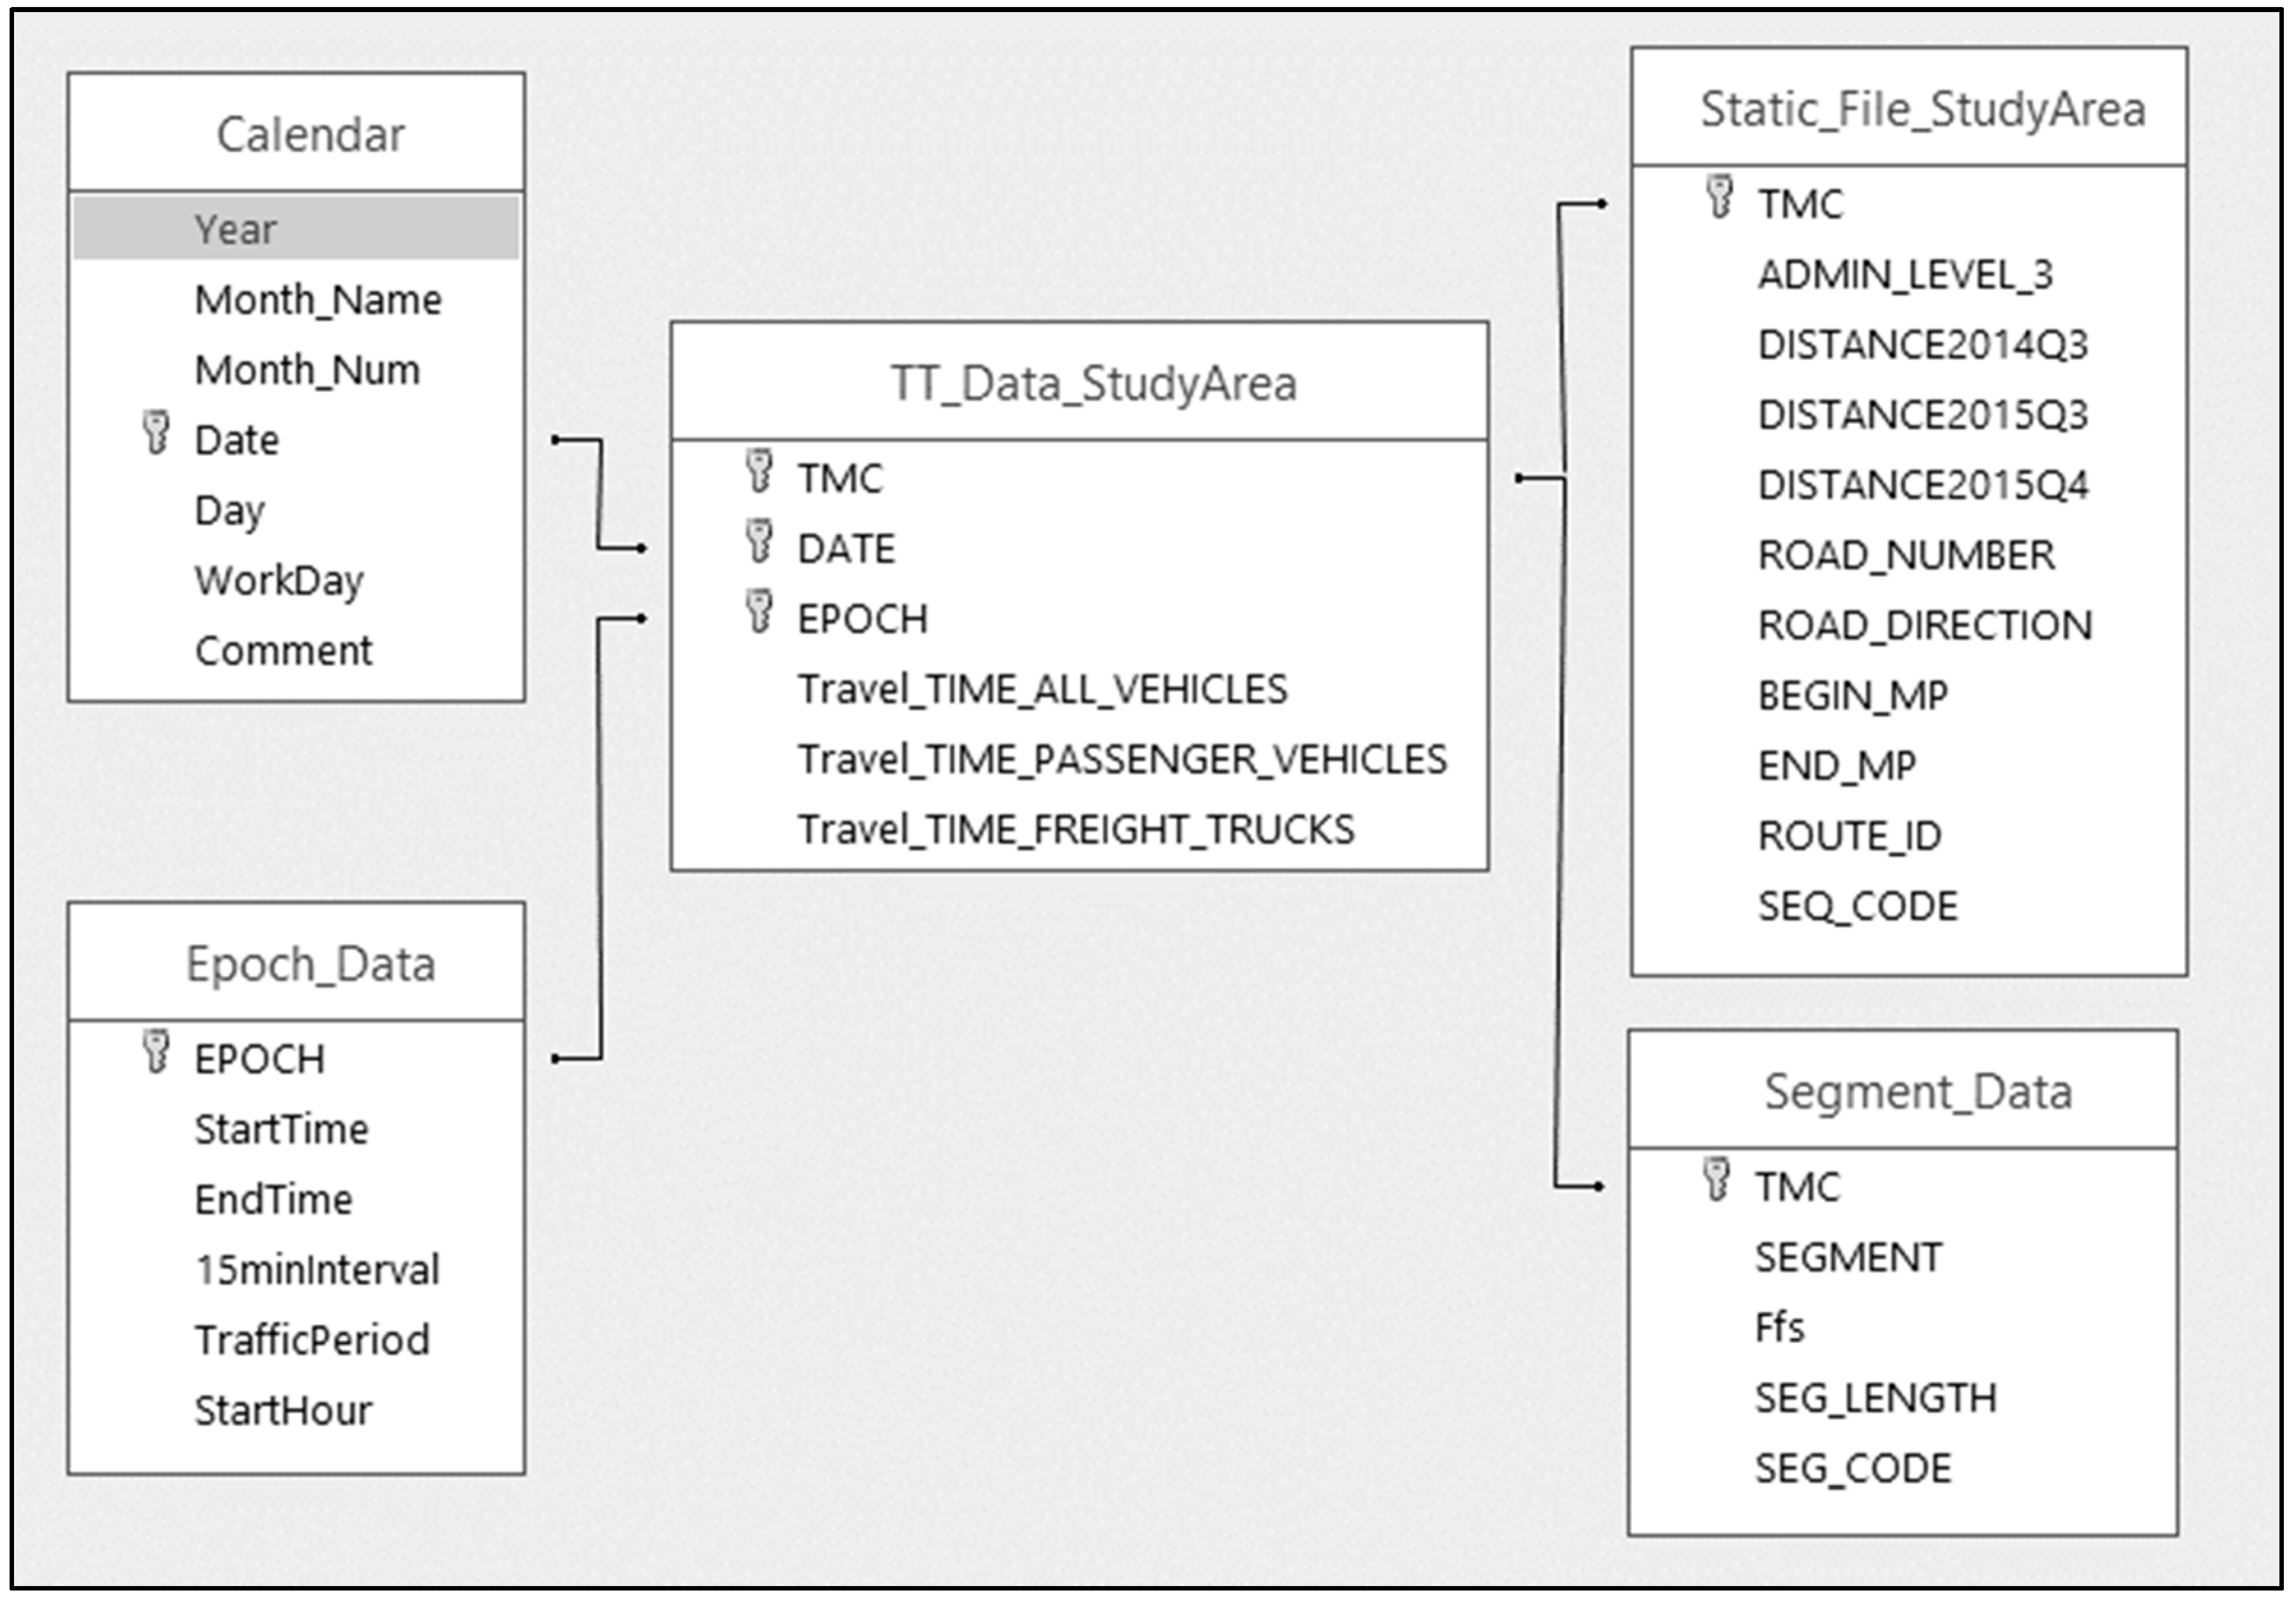
3.1. Data Management
Database Architecture
3.2. Mobility Performance Measures
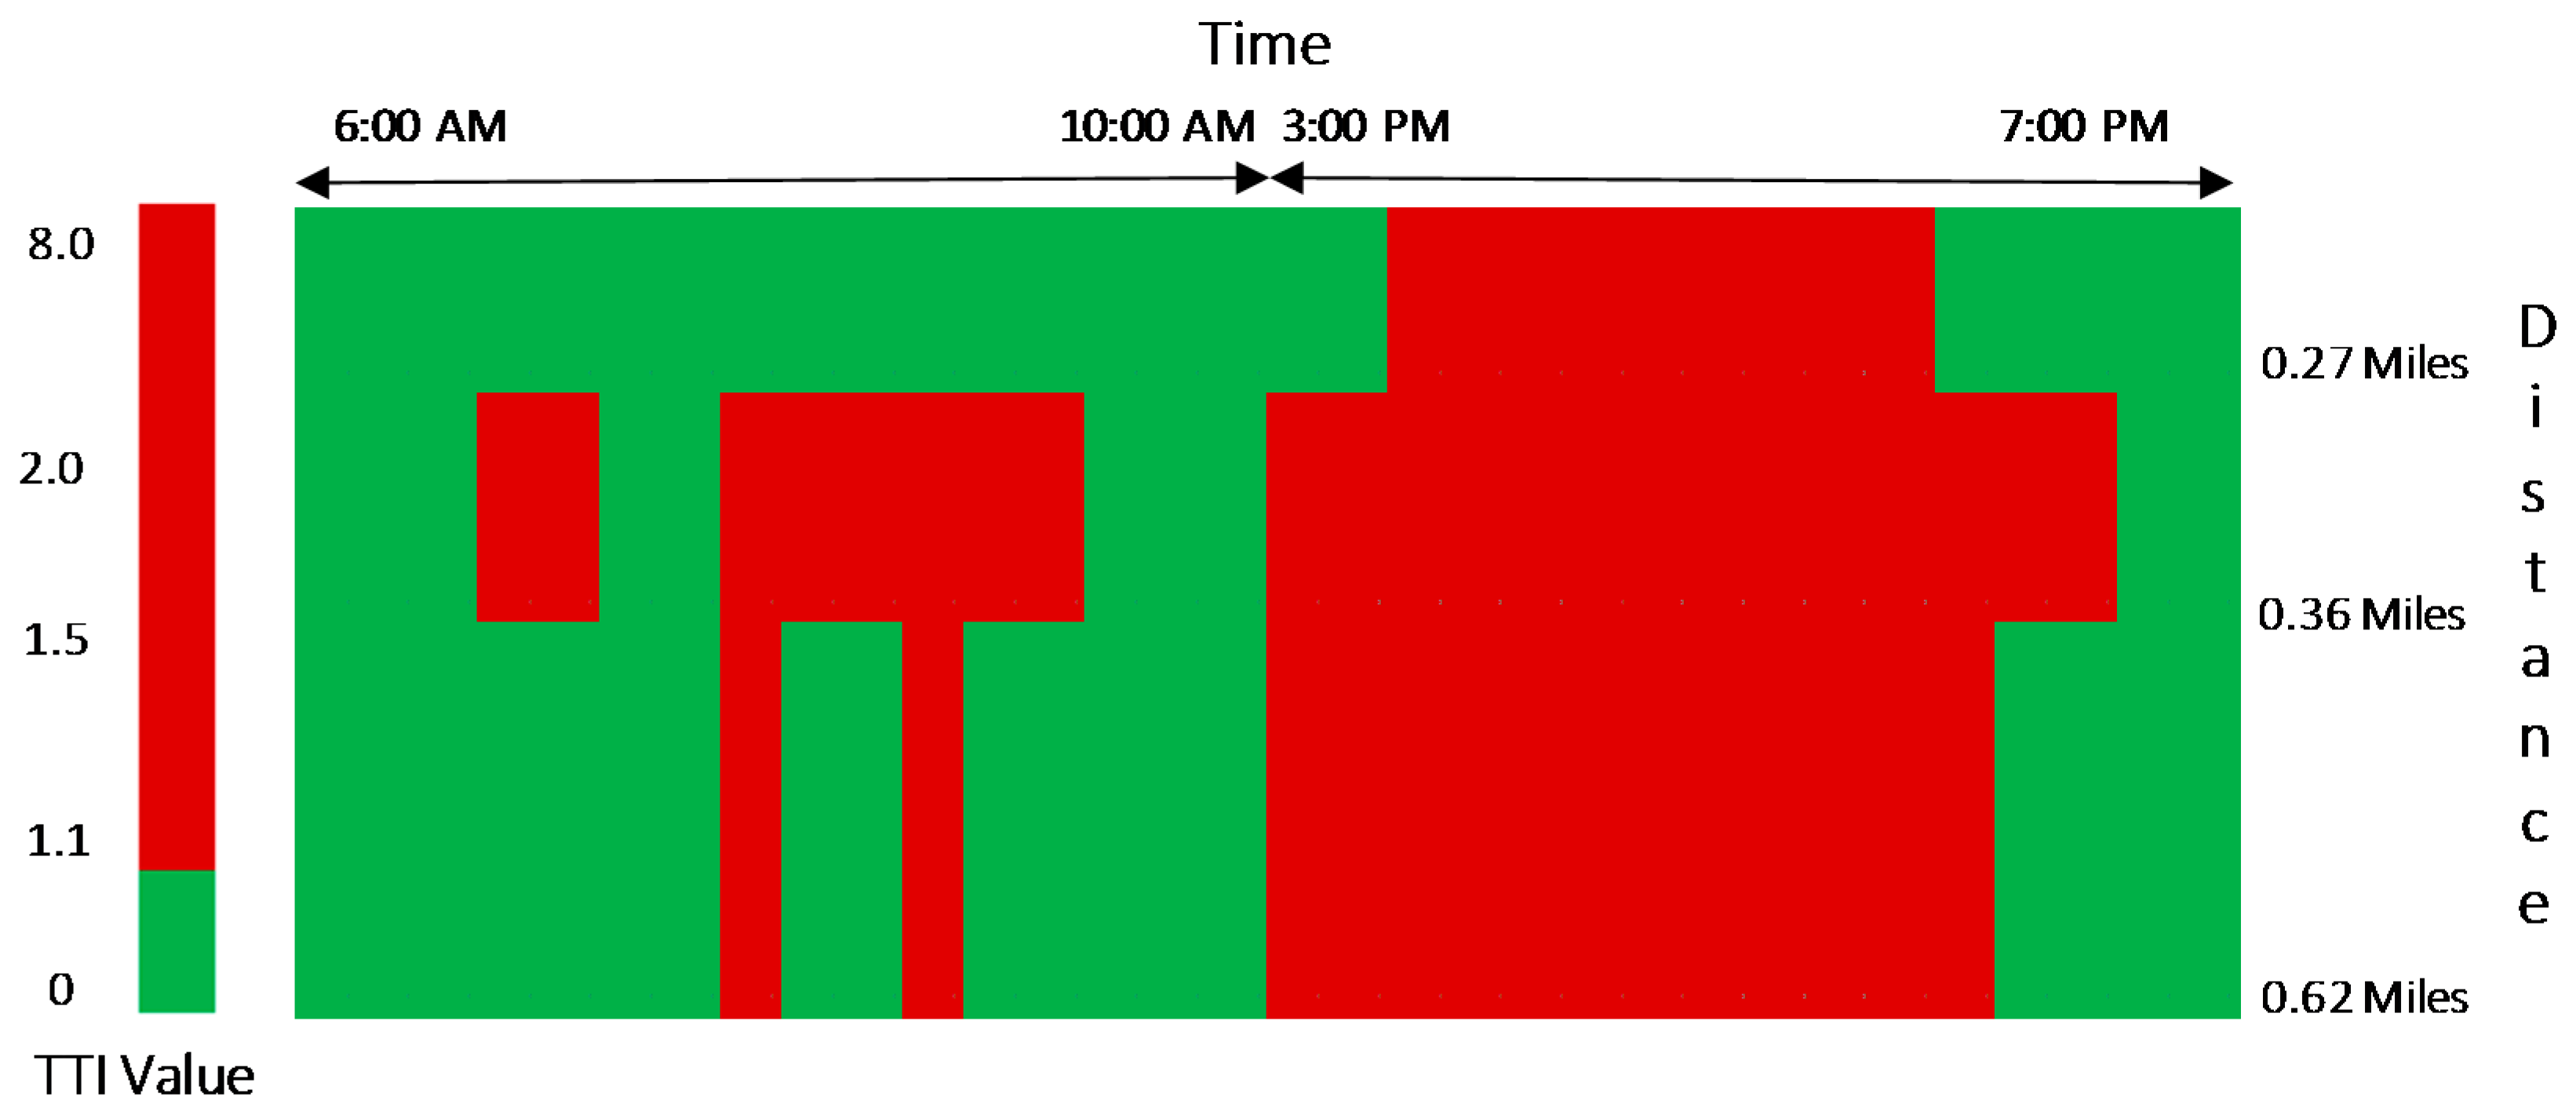
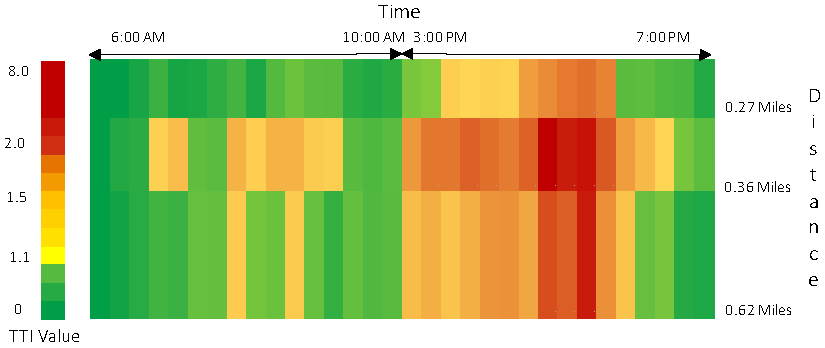
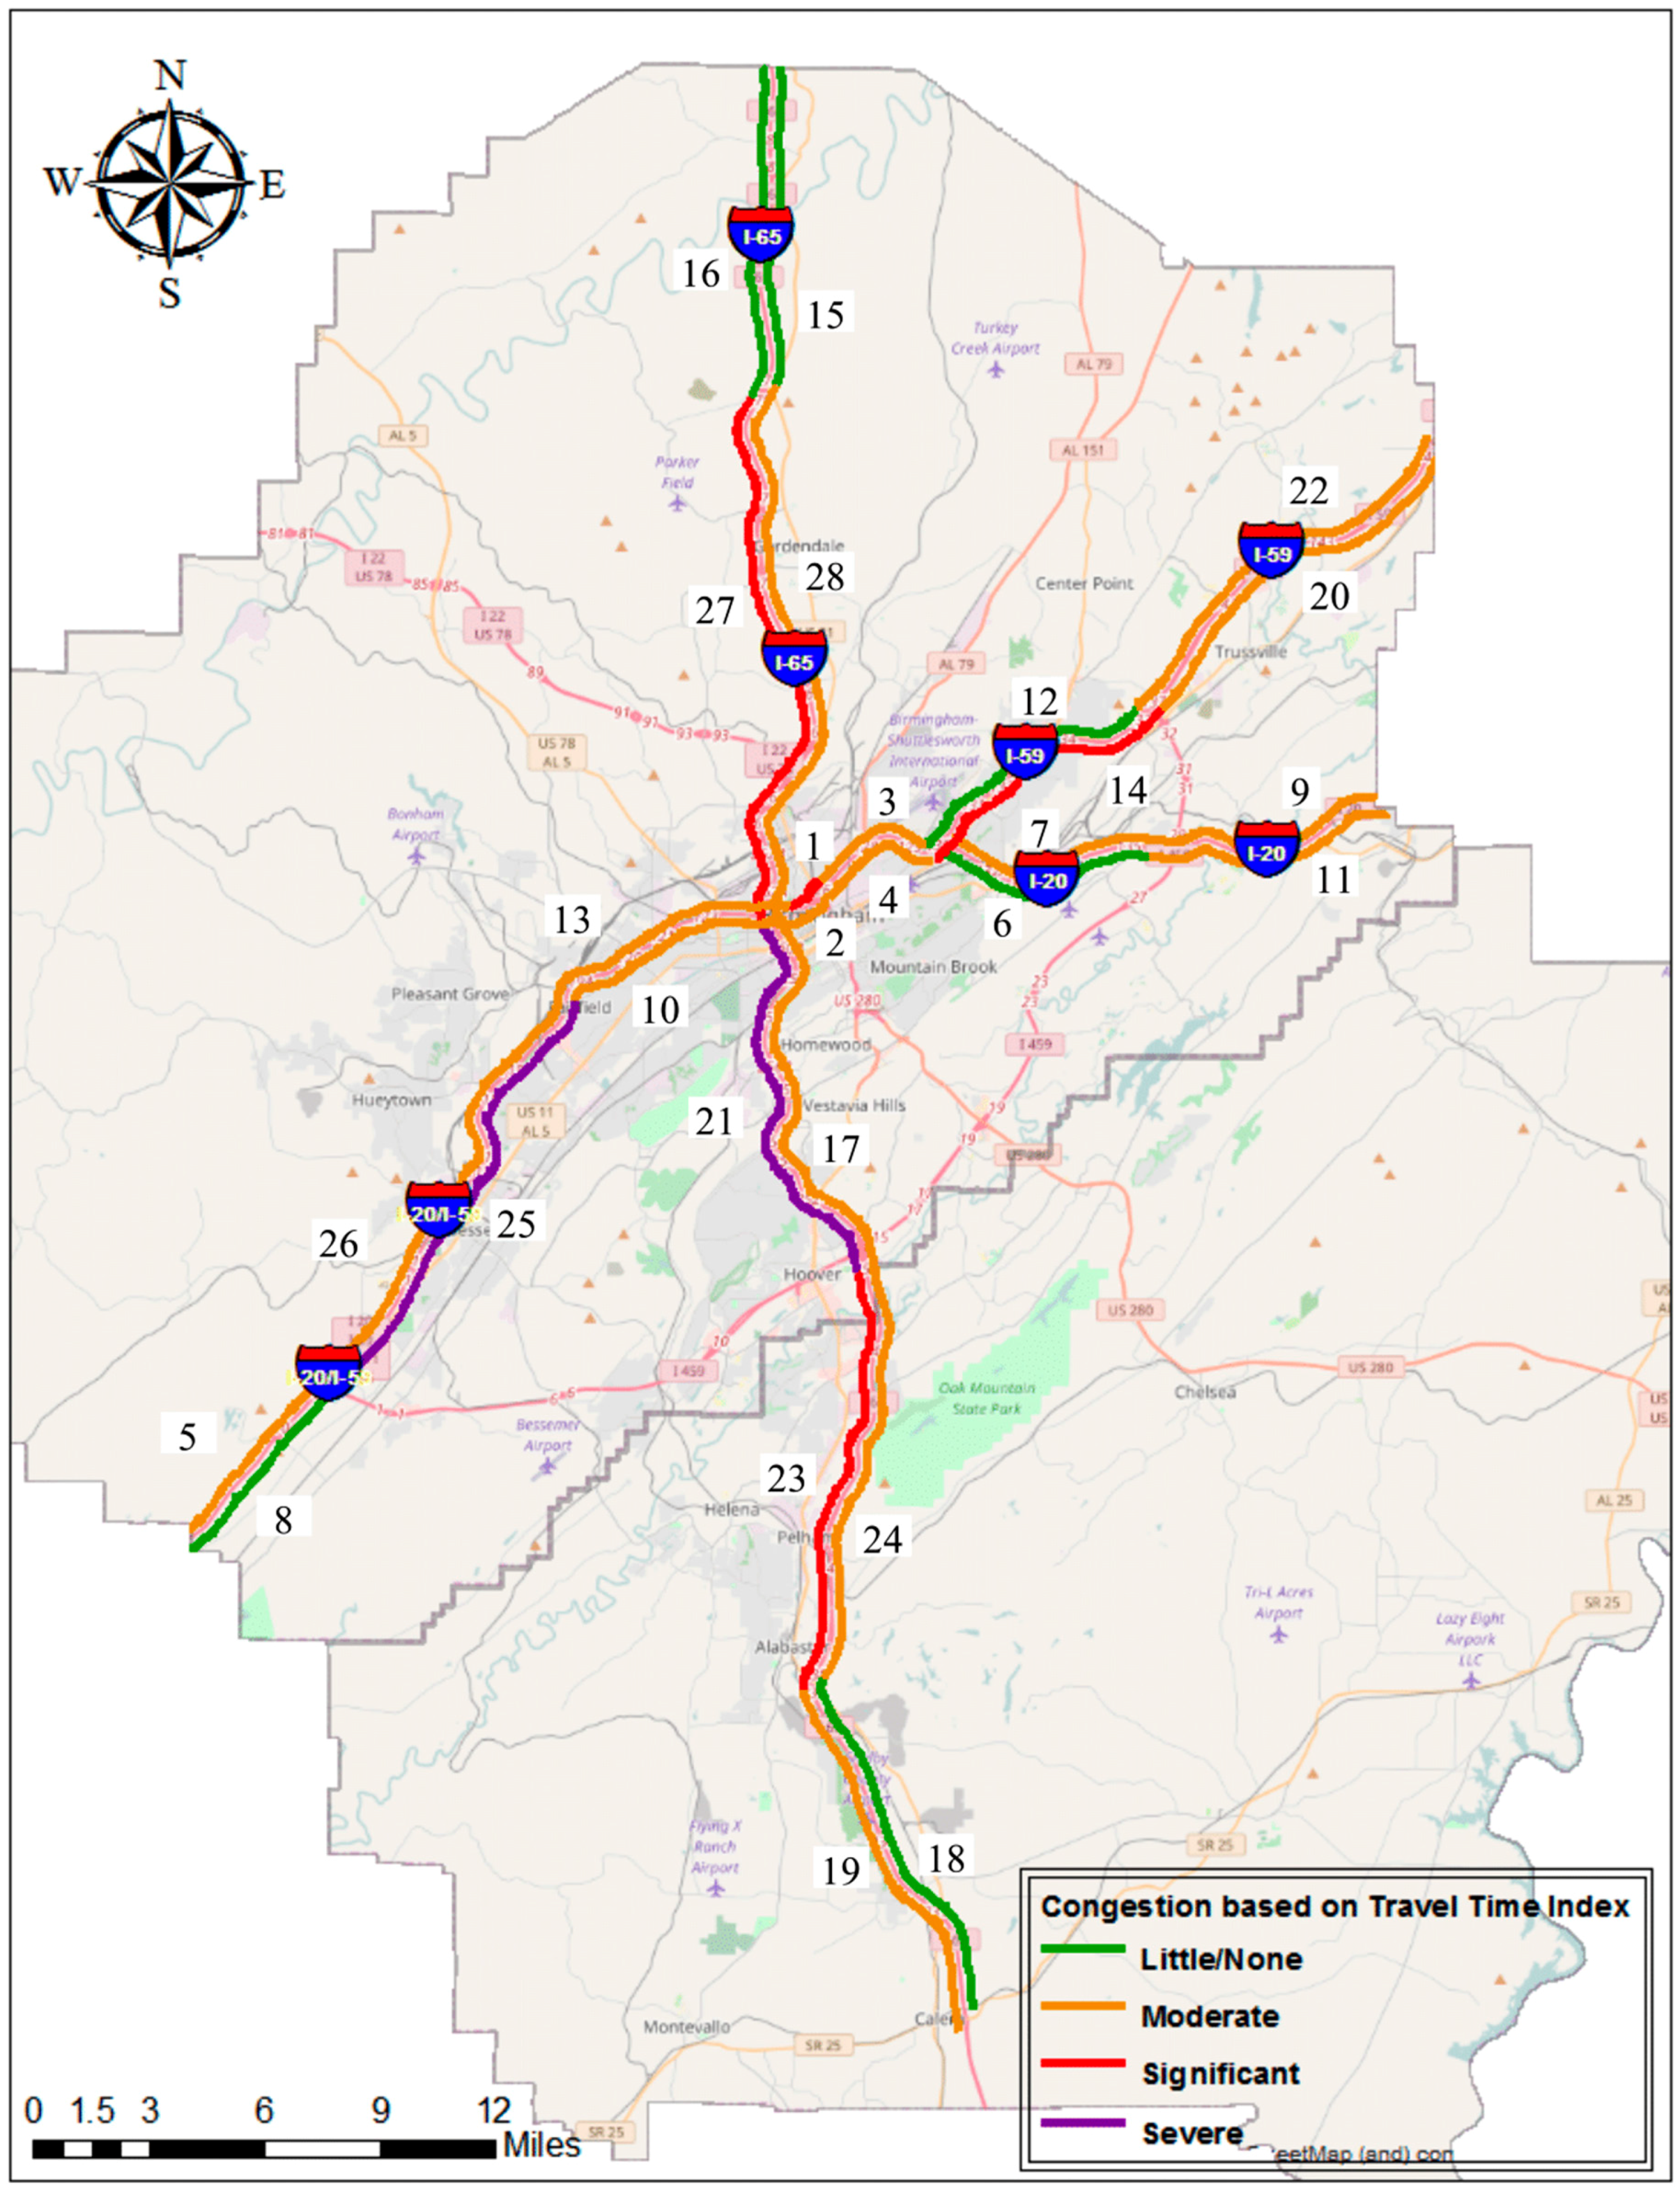
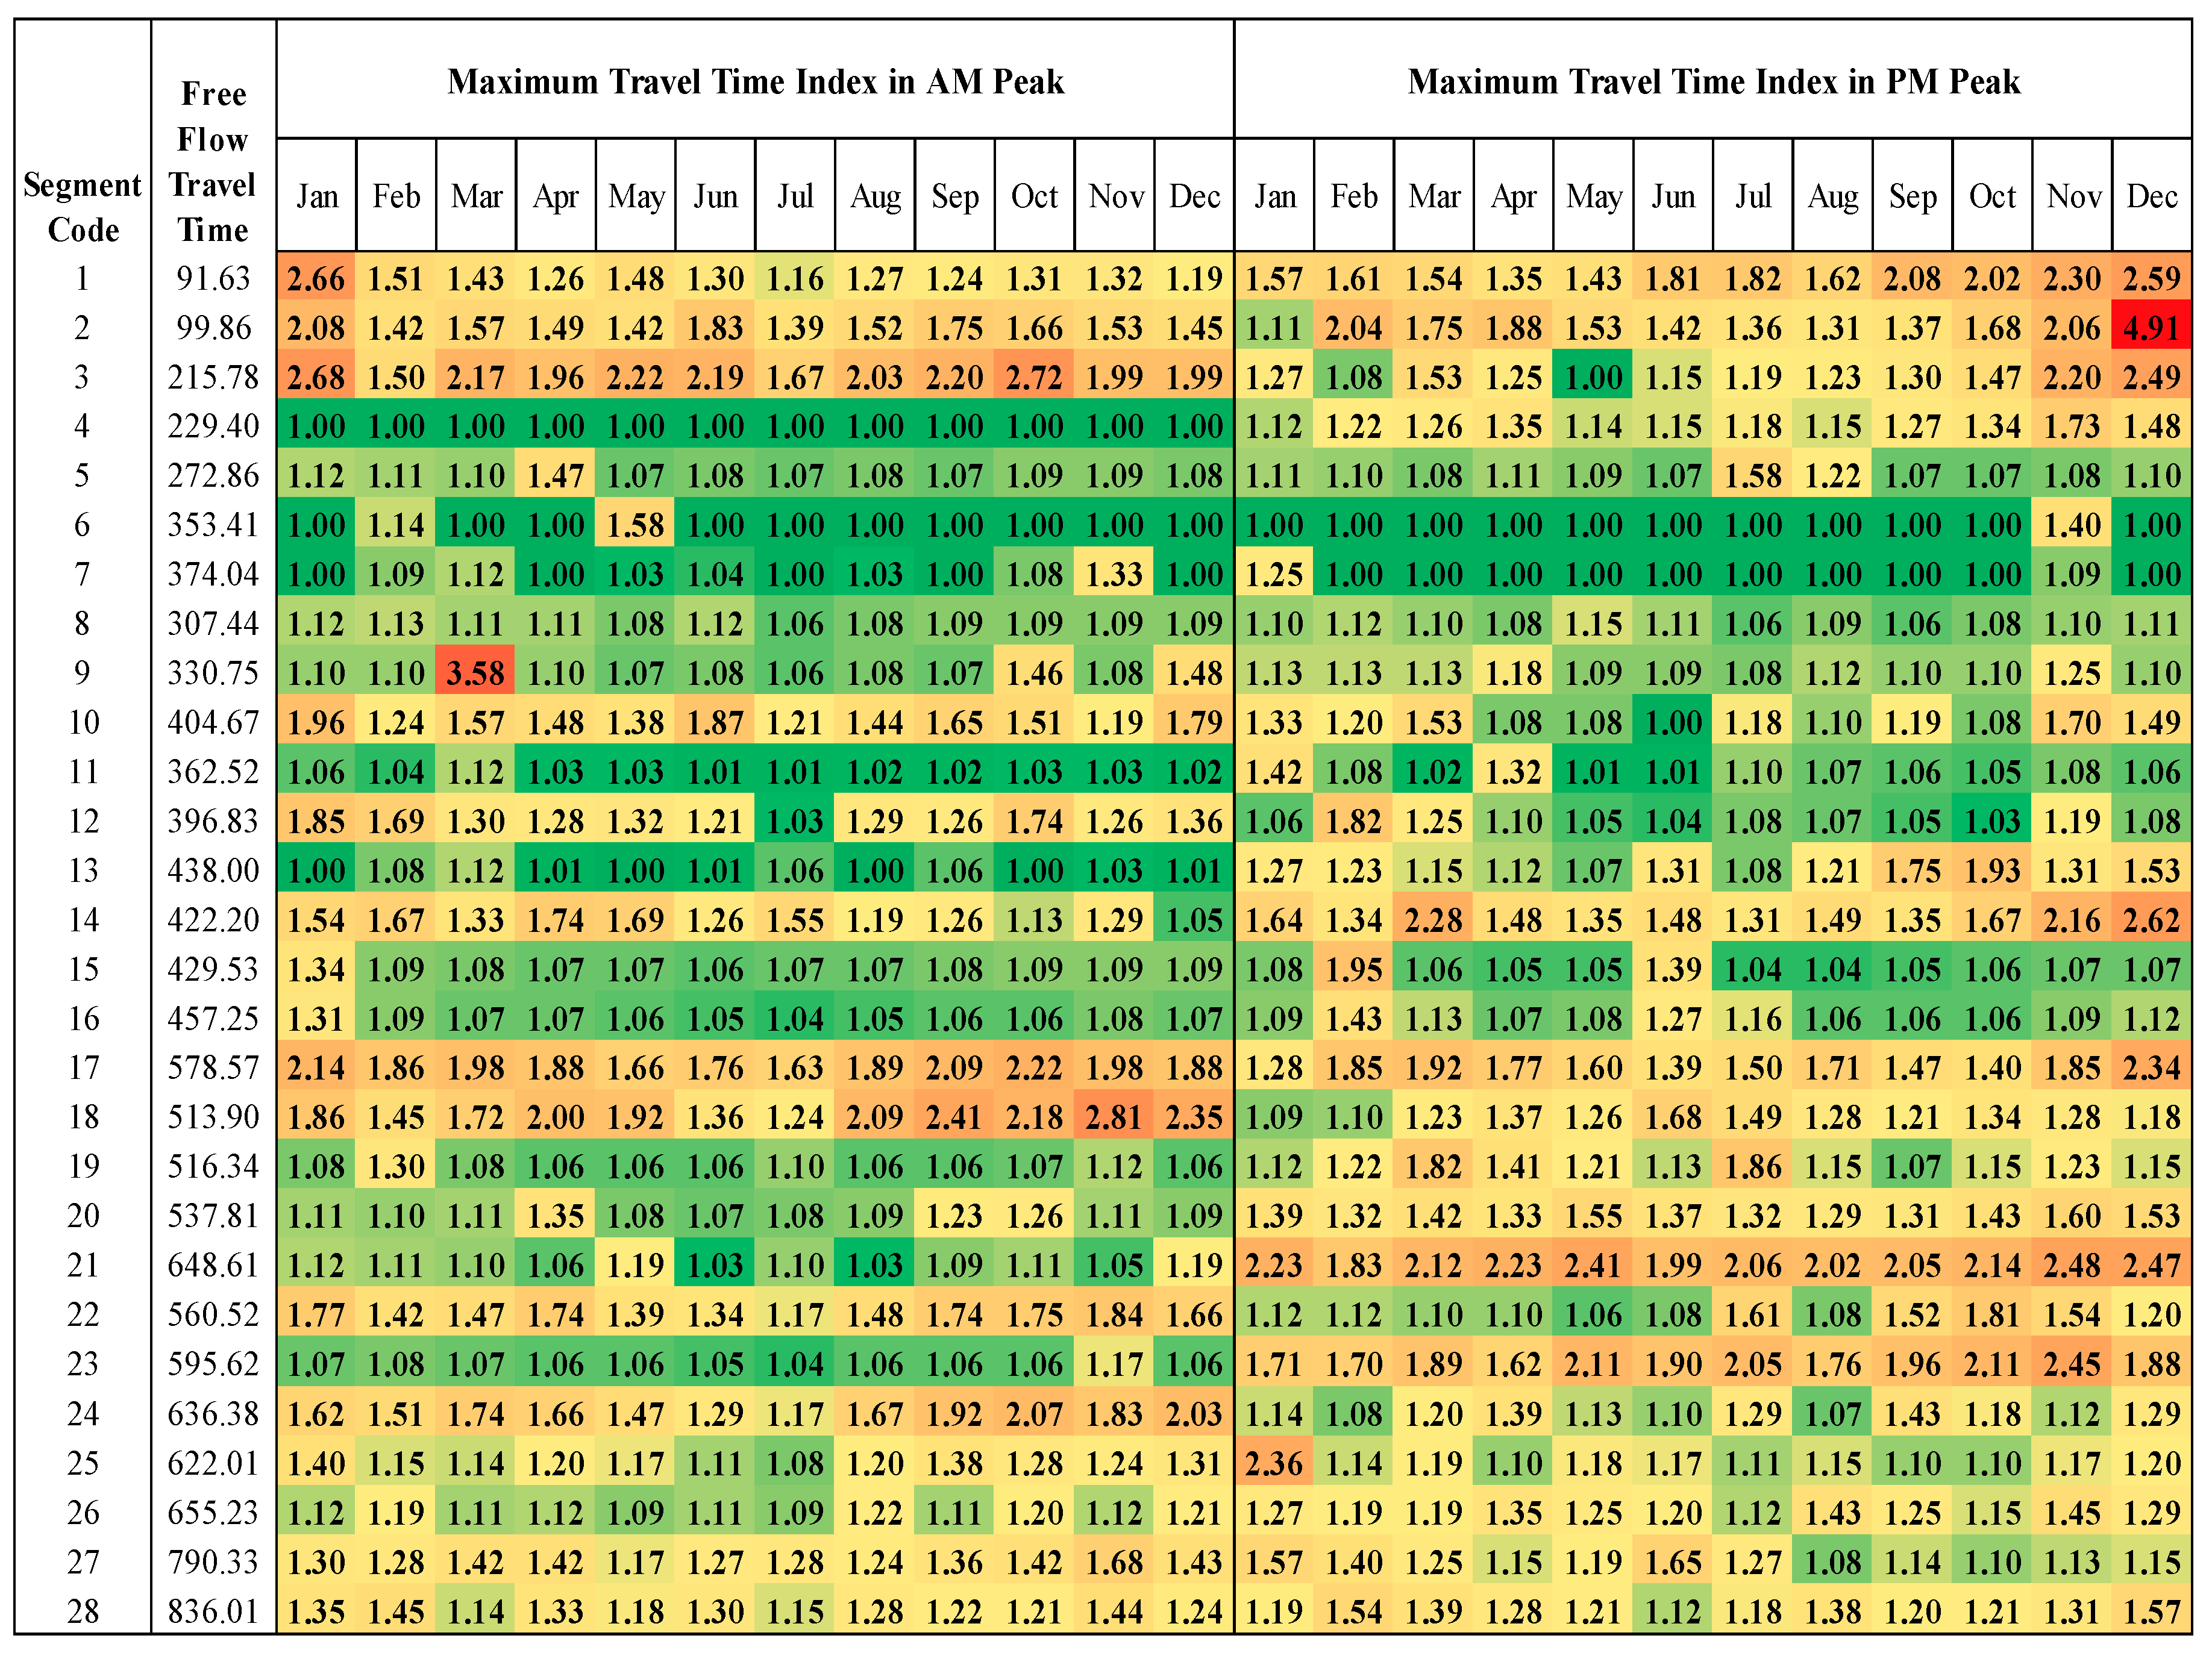
3.2.1. Travel Time Index (TTI)
| ▪ 1.10 < TTI < 1.50 | moderate congestion |
| ▪ 1.50 < TTI < 2.00 | significant congestion |
| ▪ TTI > 2.00 | severe congestion |
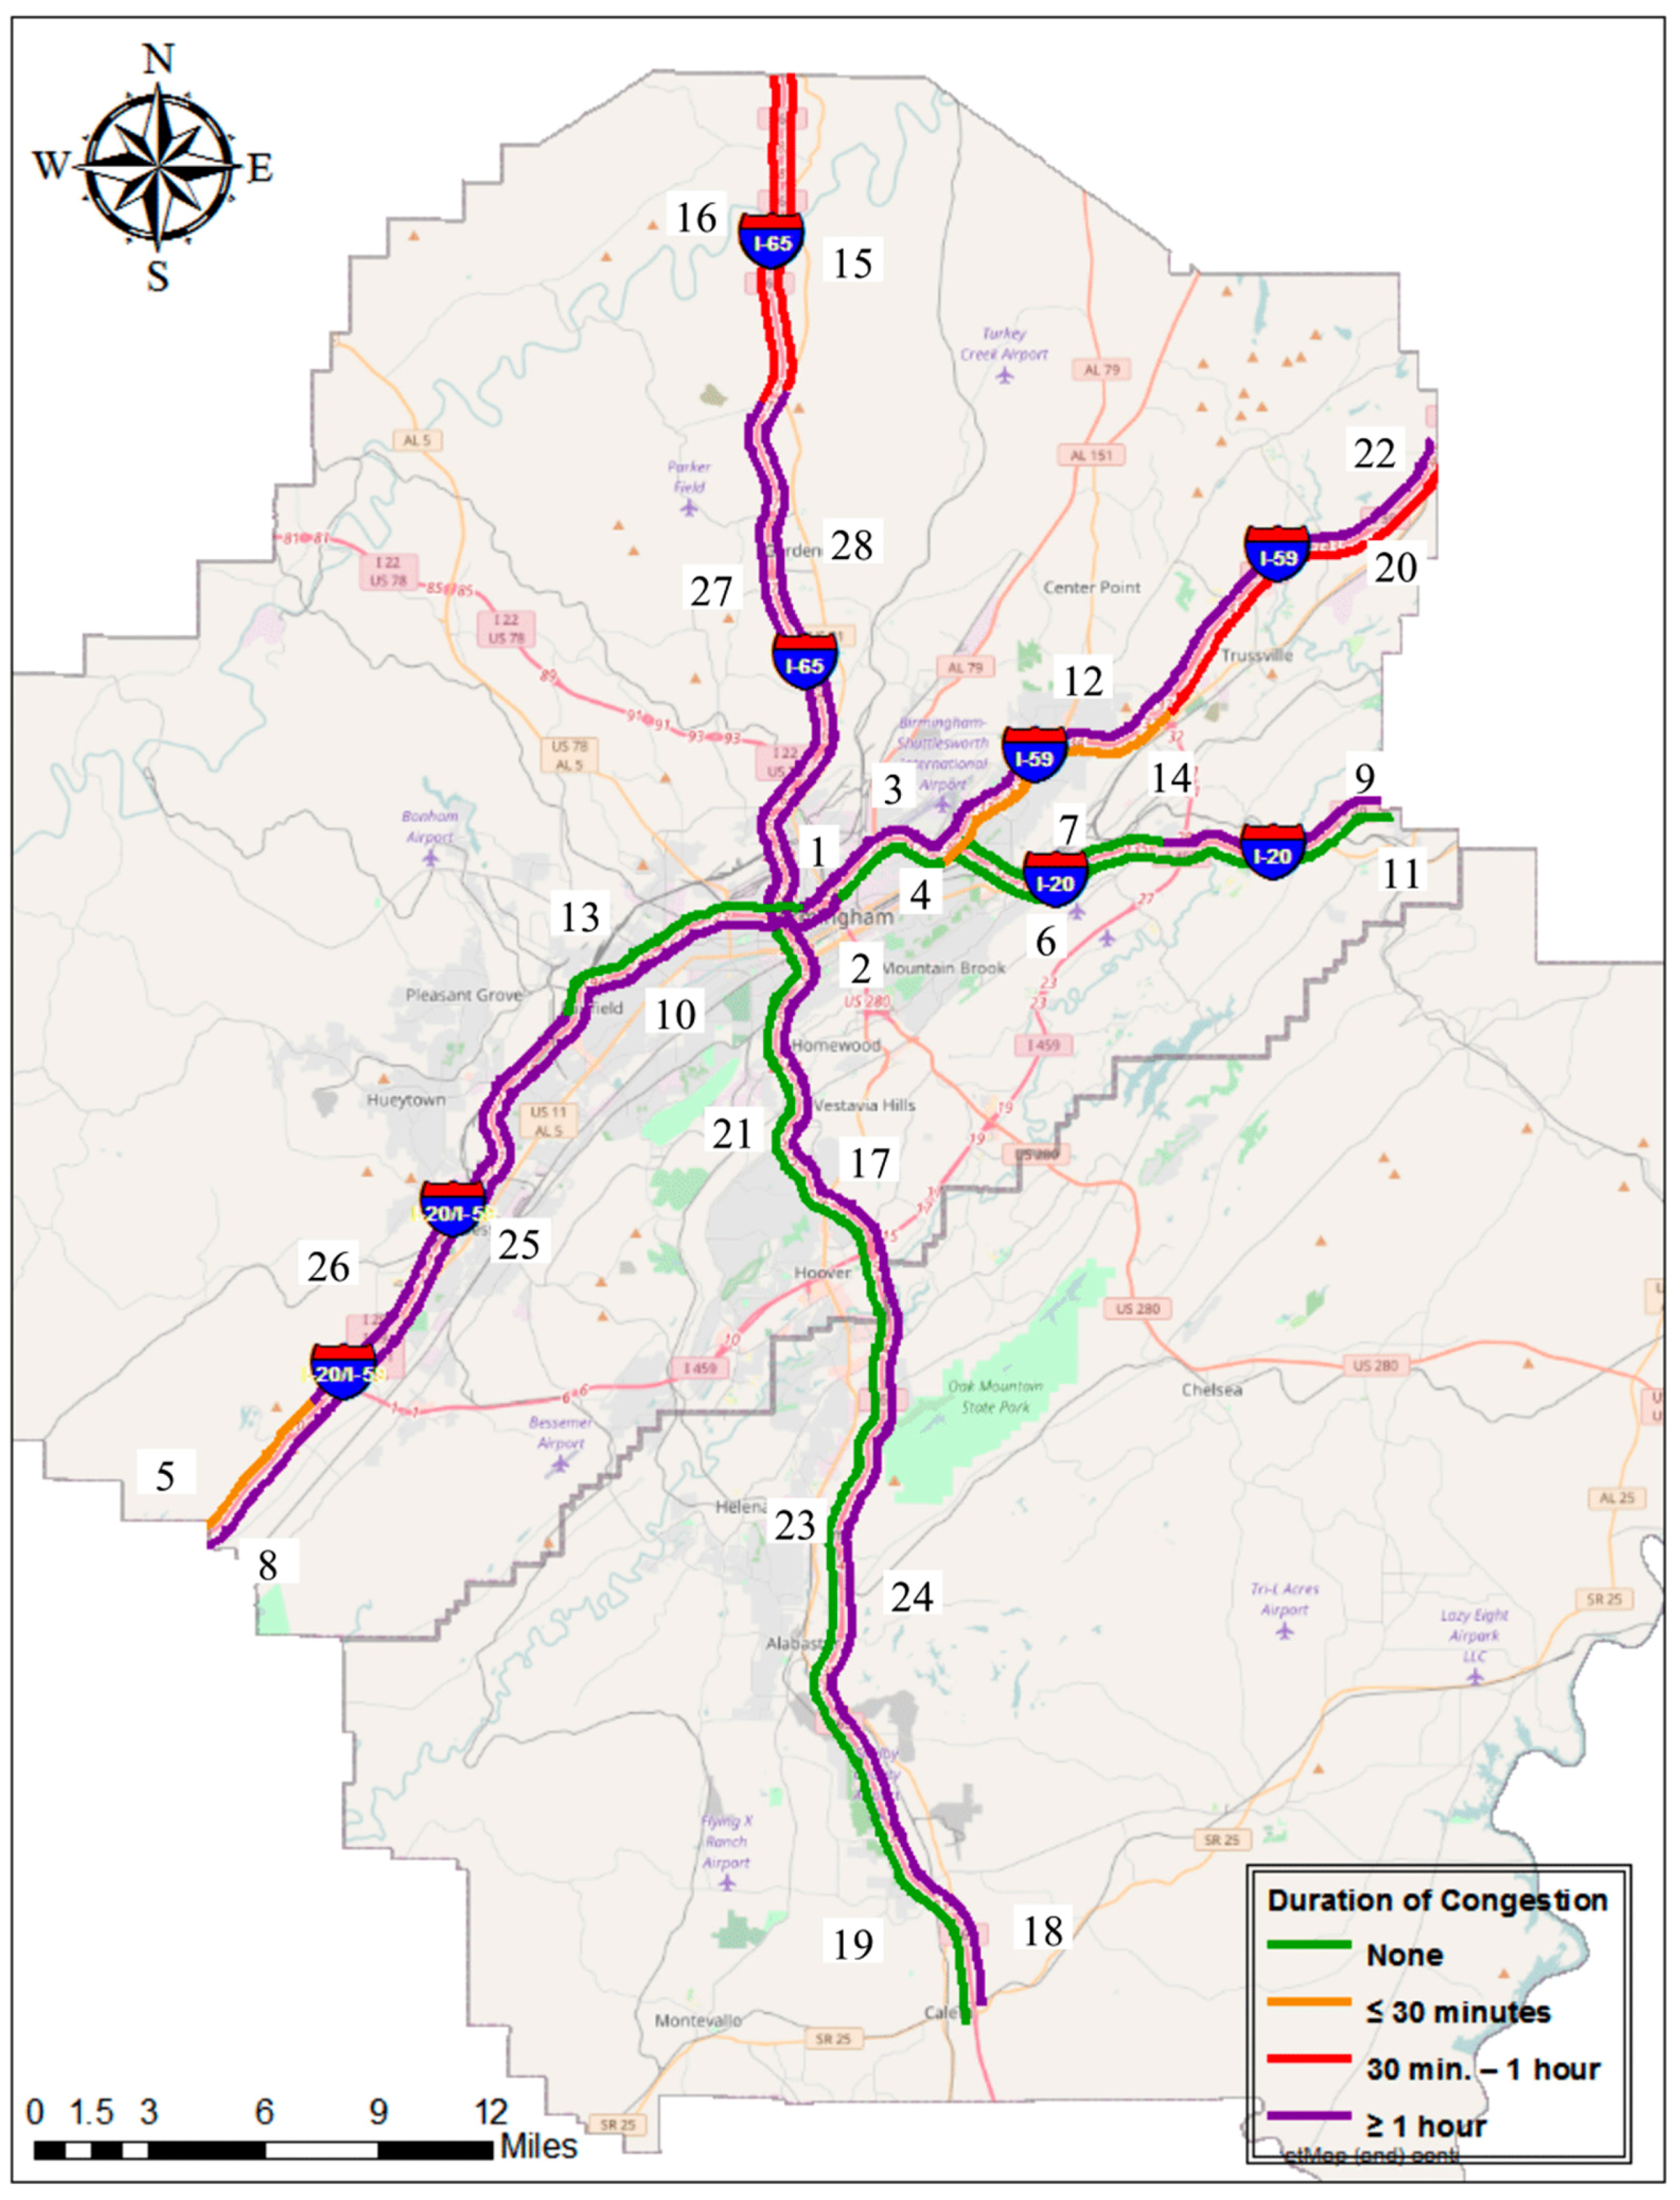
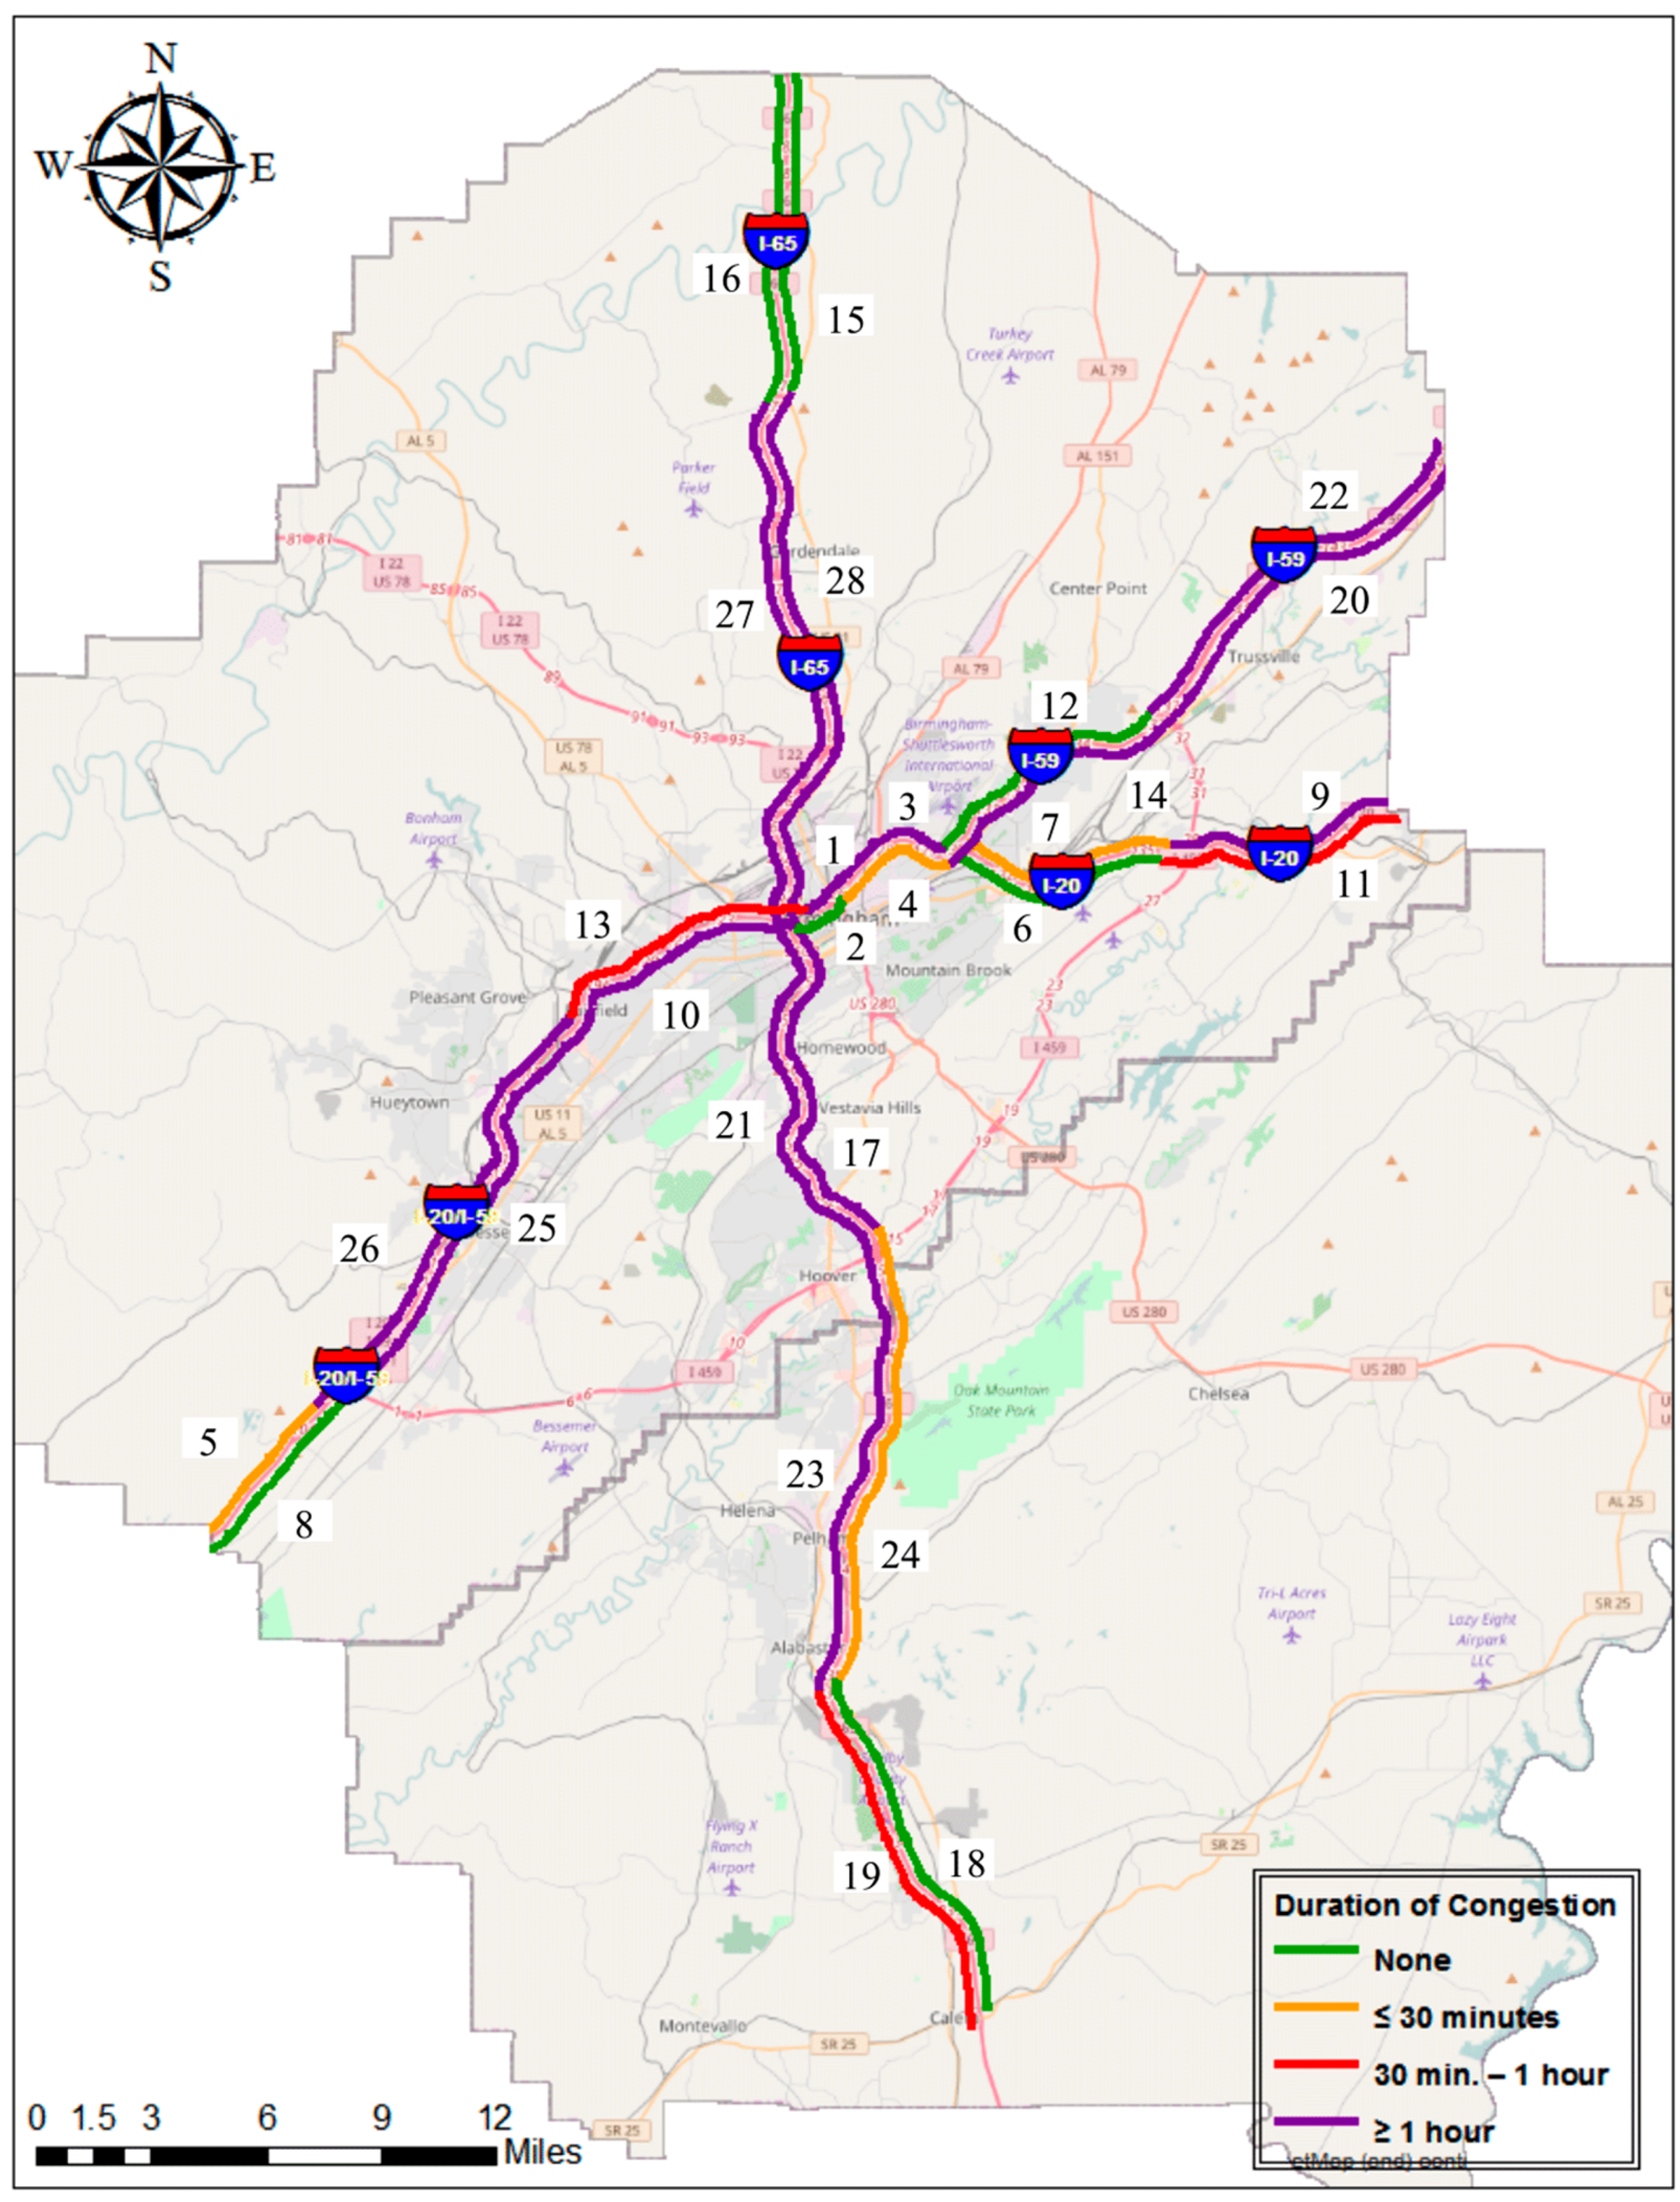
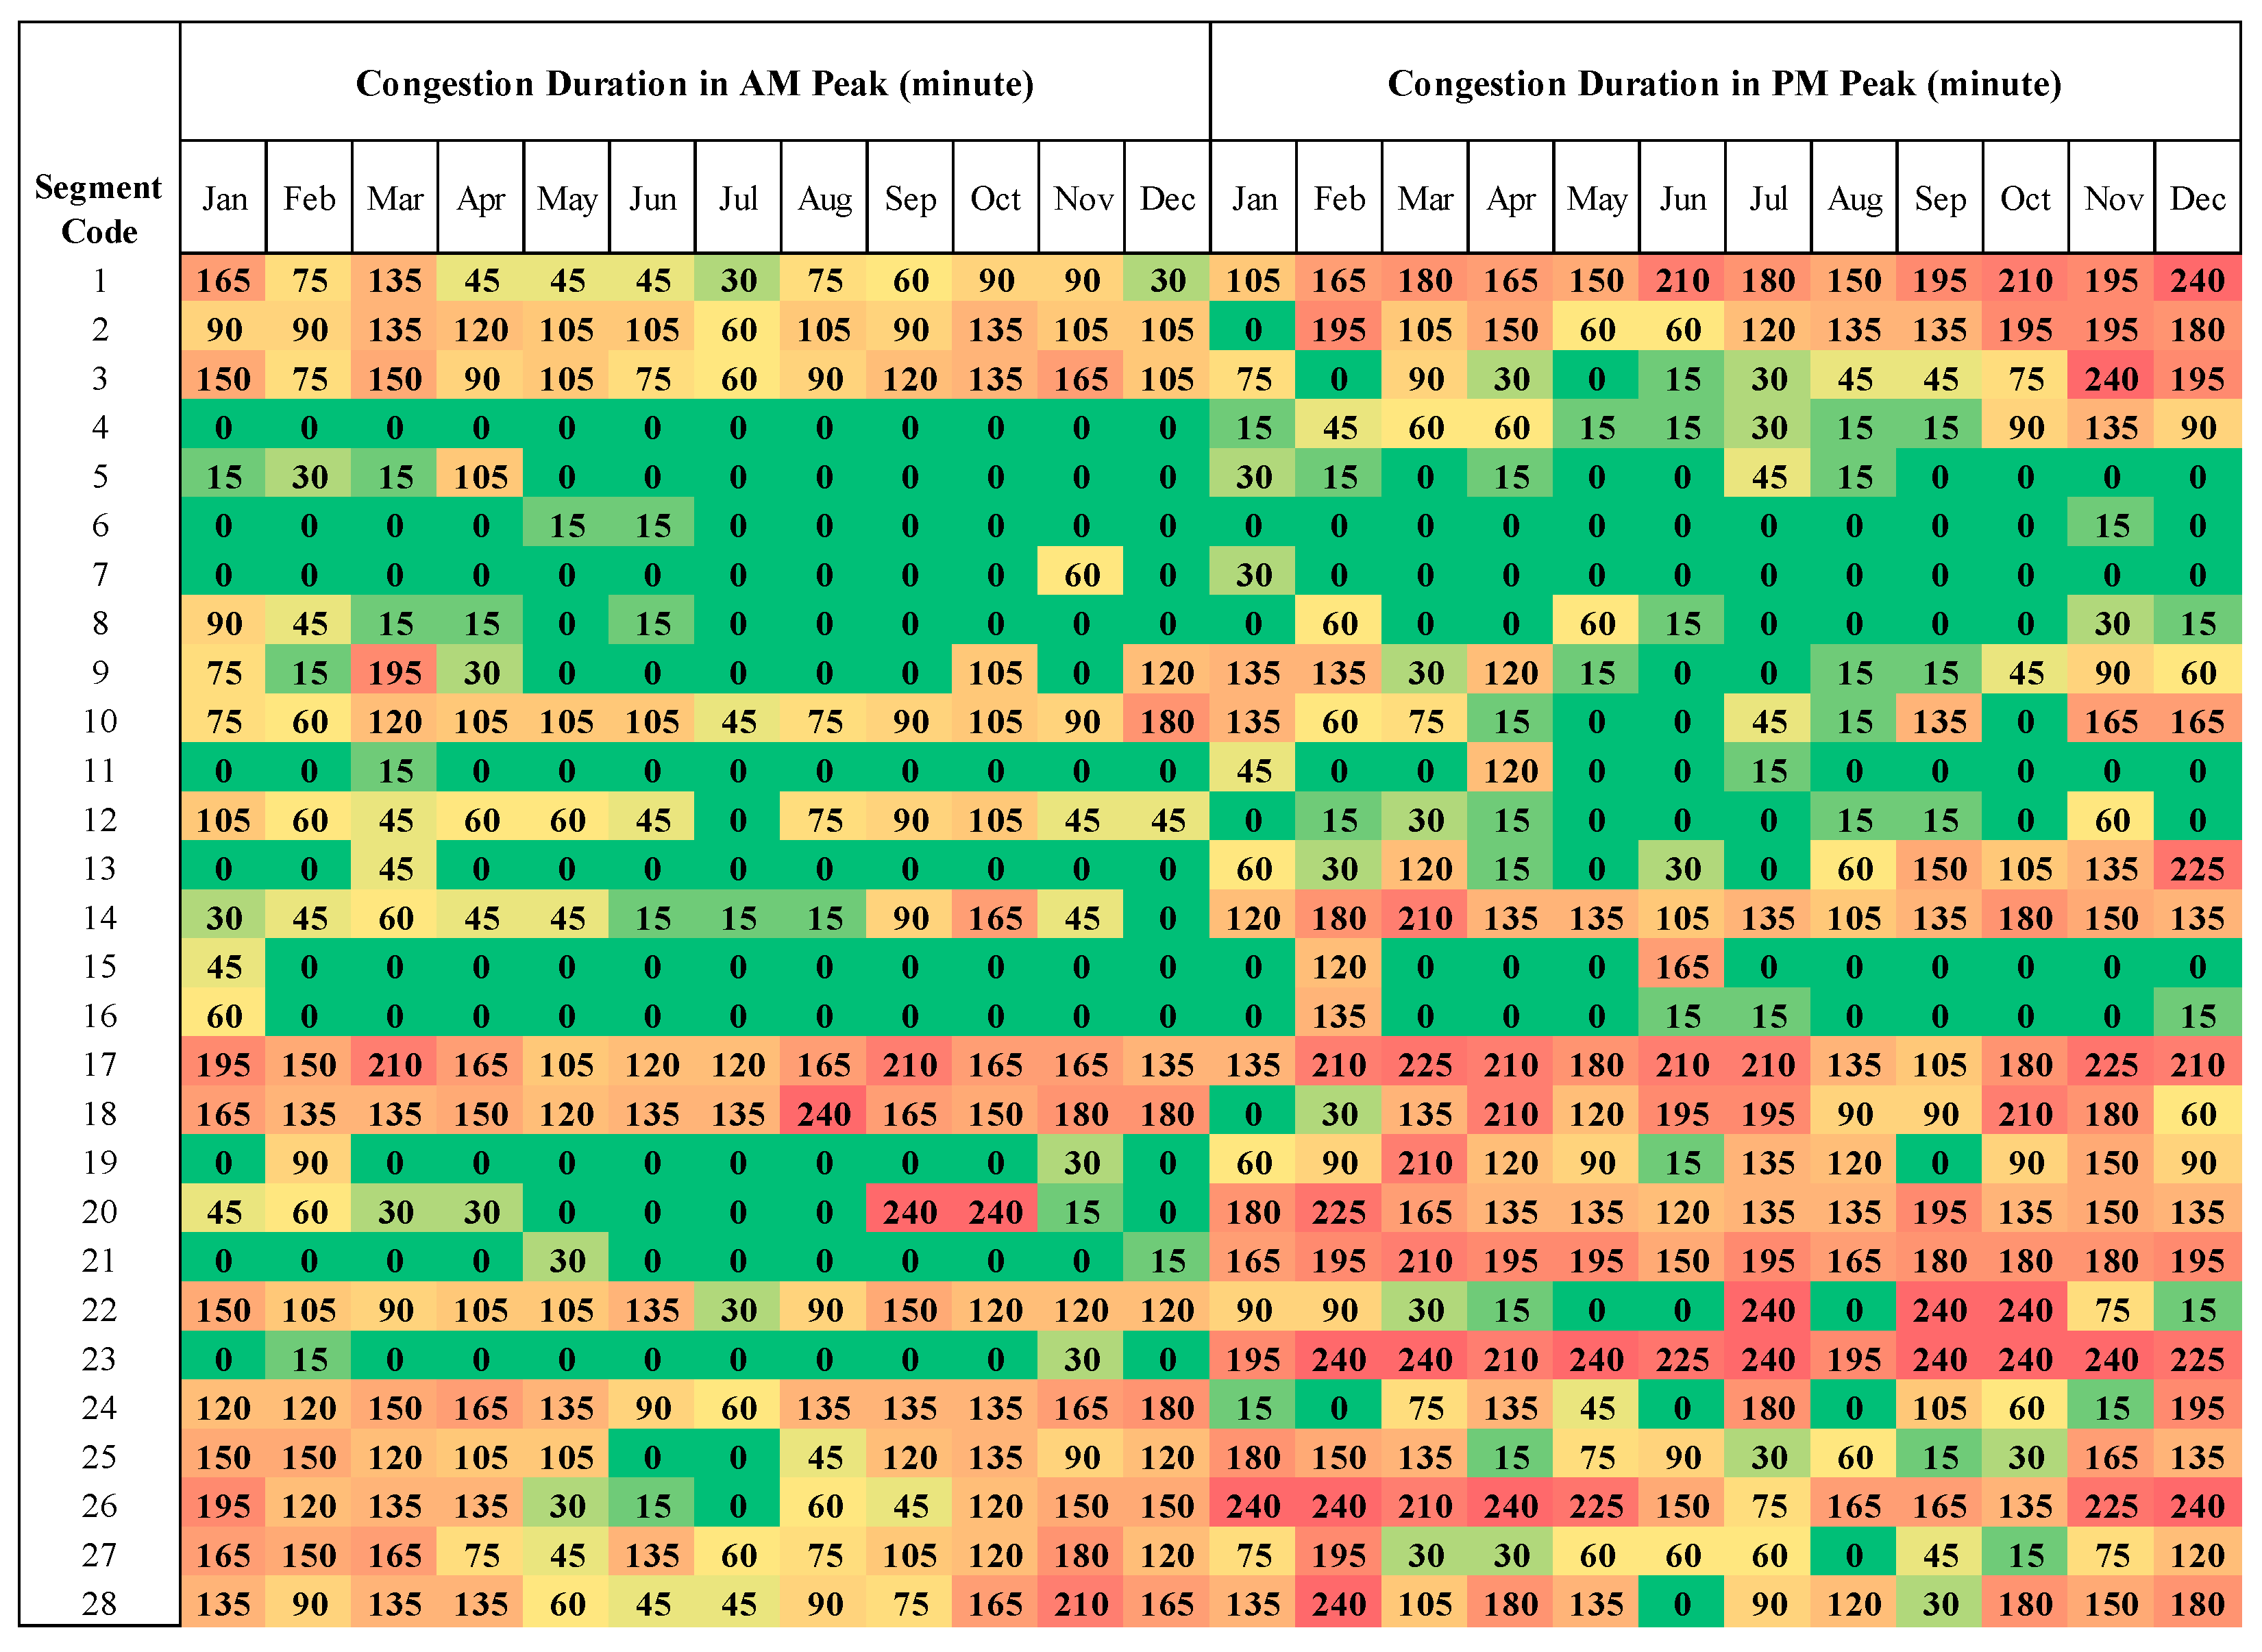
3.2.2. Duration of Congestion (DOC)
| ▪ 0 < DOC < 30 min | moderate congestion persistency |
| ▪ 30 < DOC < 60 min | significant congestion persistency |
| ▪ DOC > 60 min | severe congestion persistency |
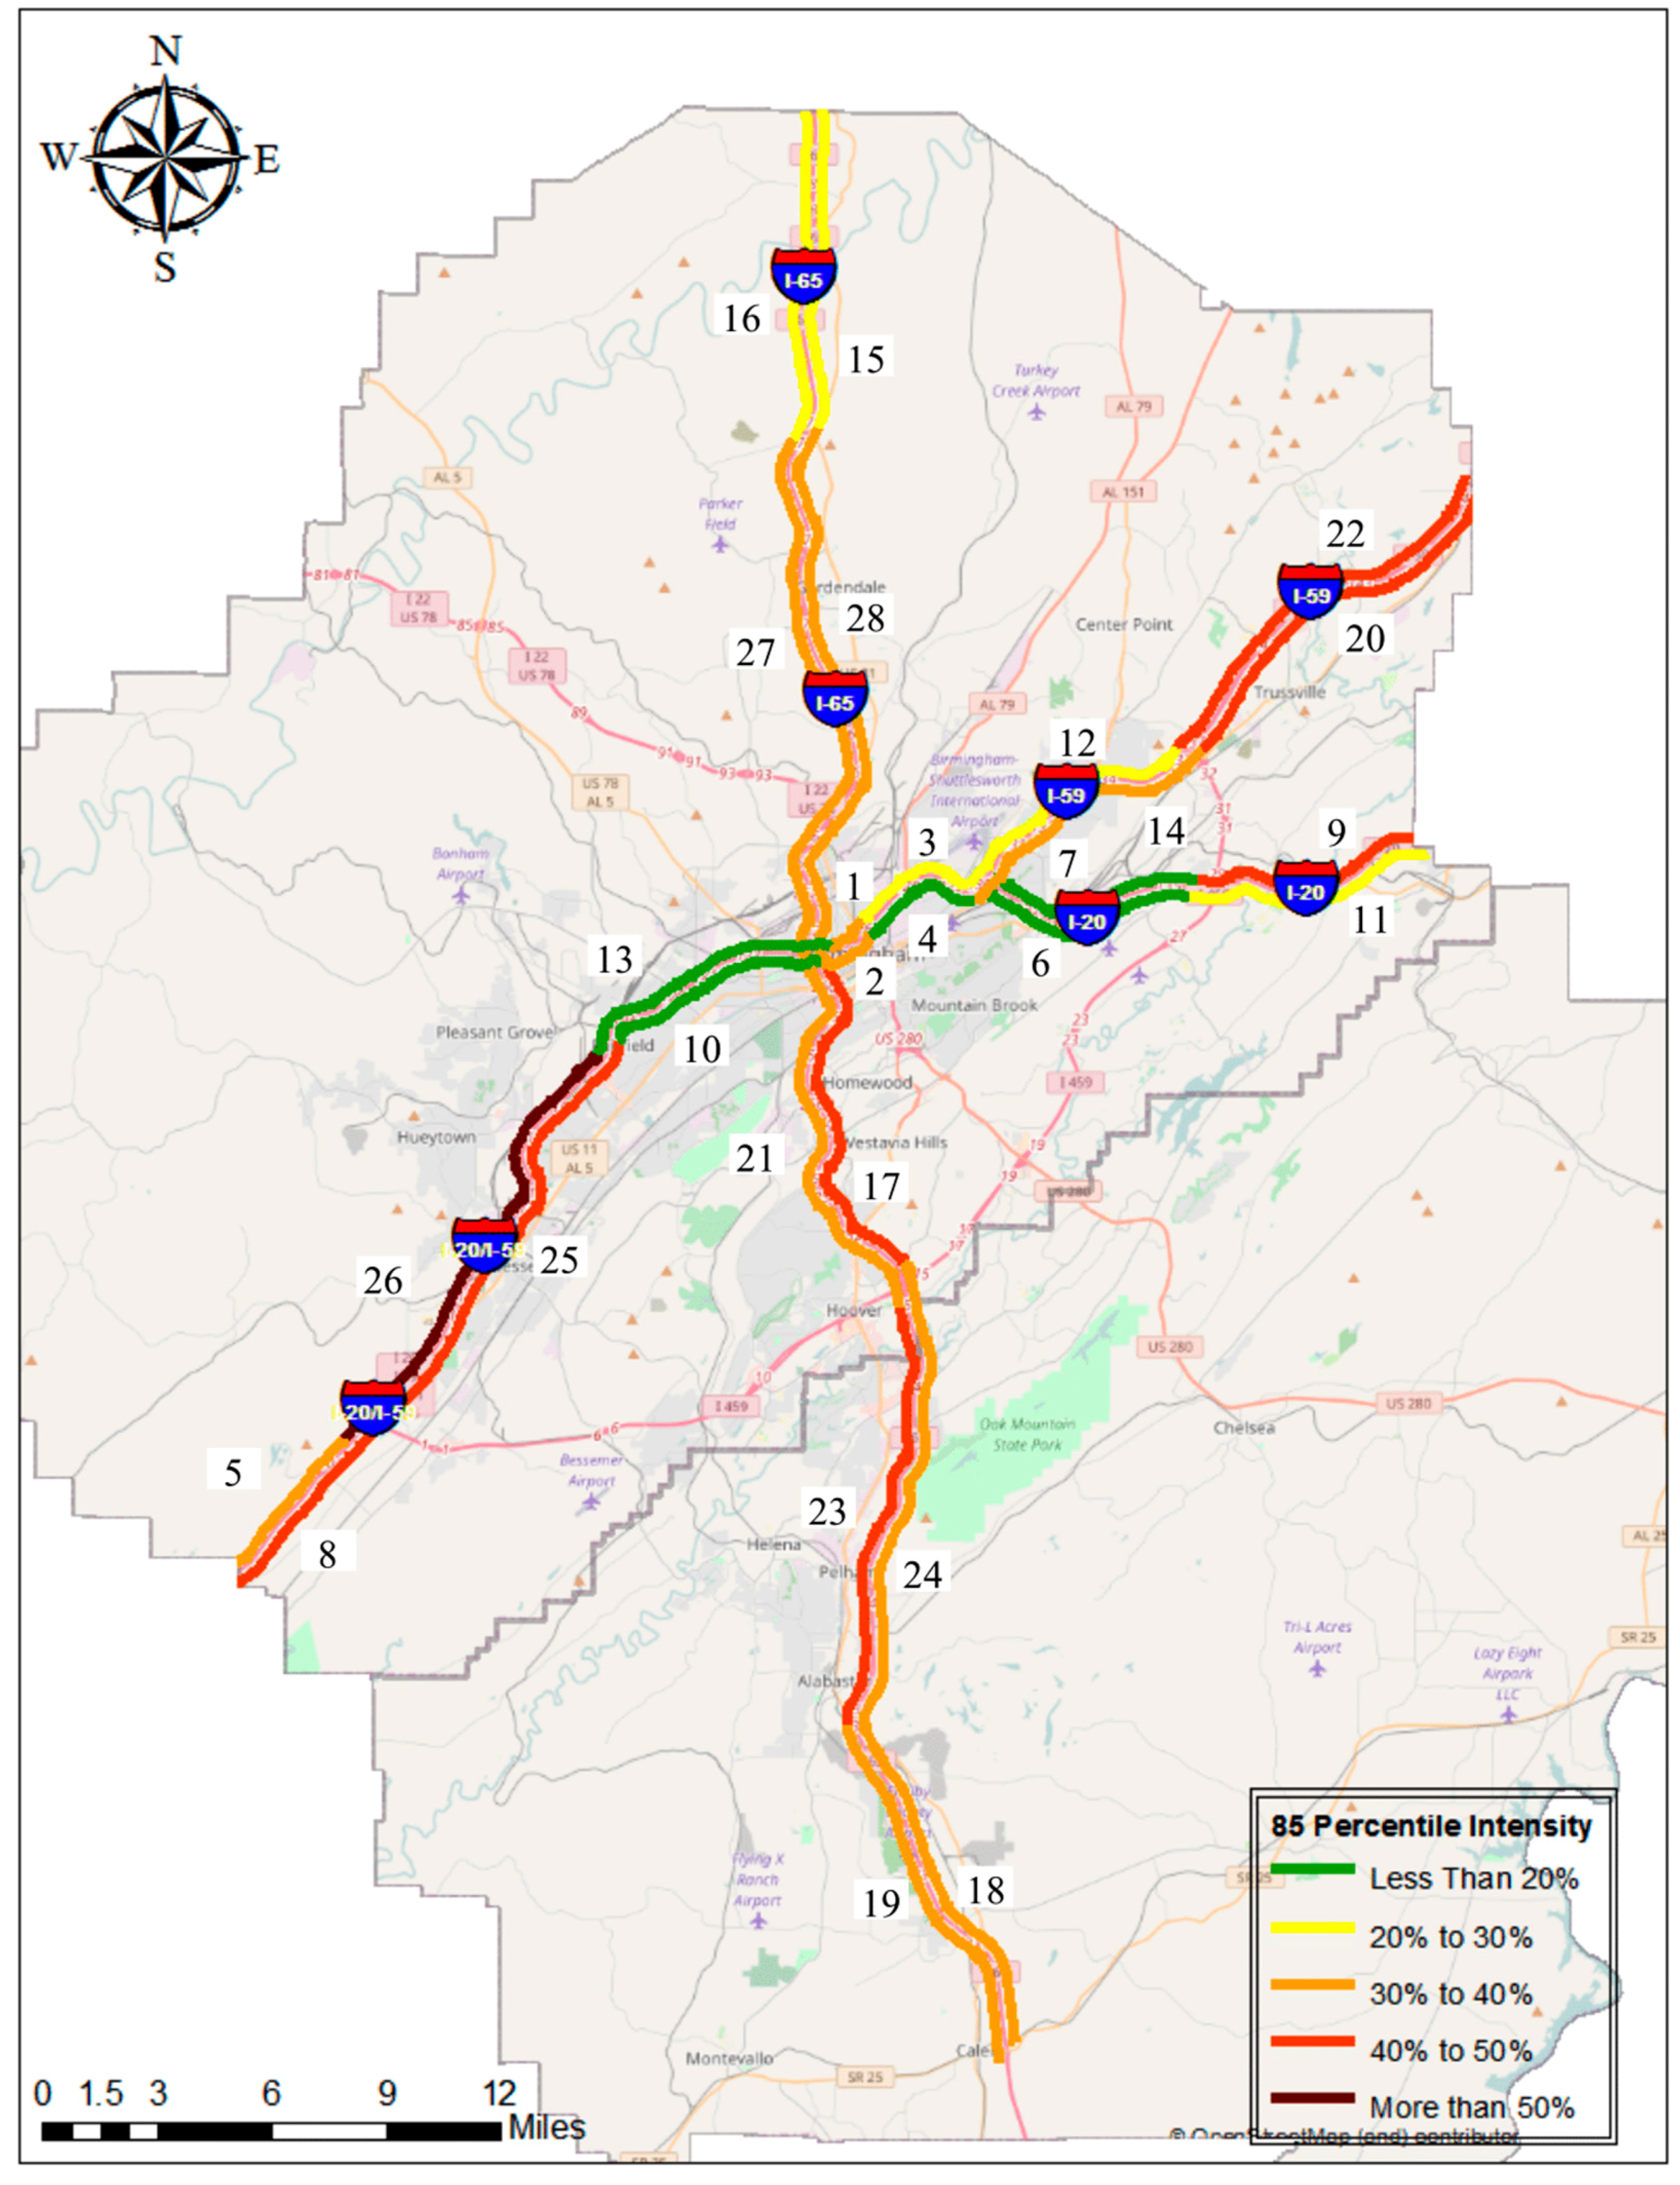
3.2.3. Congestion Intensity
- i: segment code
- j: work day
- n: TMC number along with segment i
- DOC: Duration of Congestion in minutes
- Time: Study period (6:00 a.m. to 10:00 a.m. and 3:00 p.m. to 7:00 p.m.) in minutes
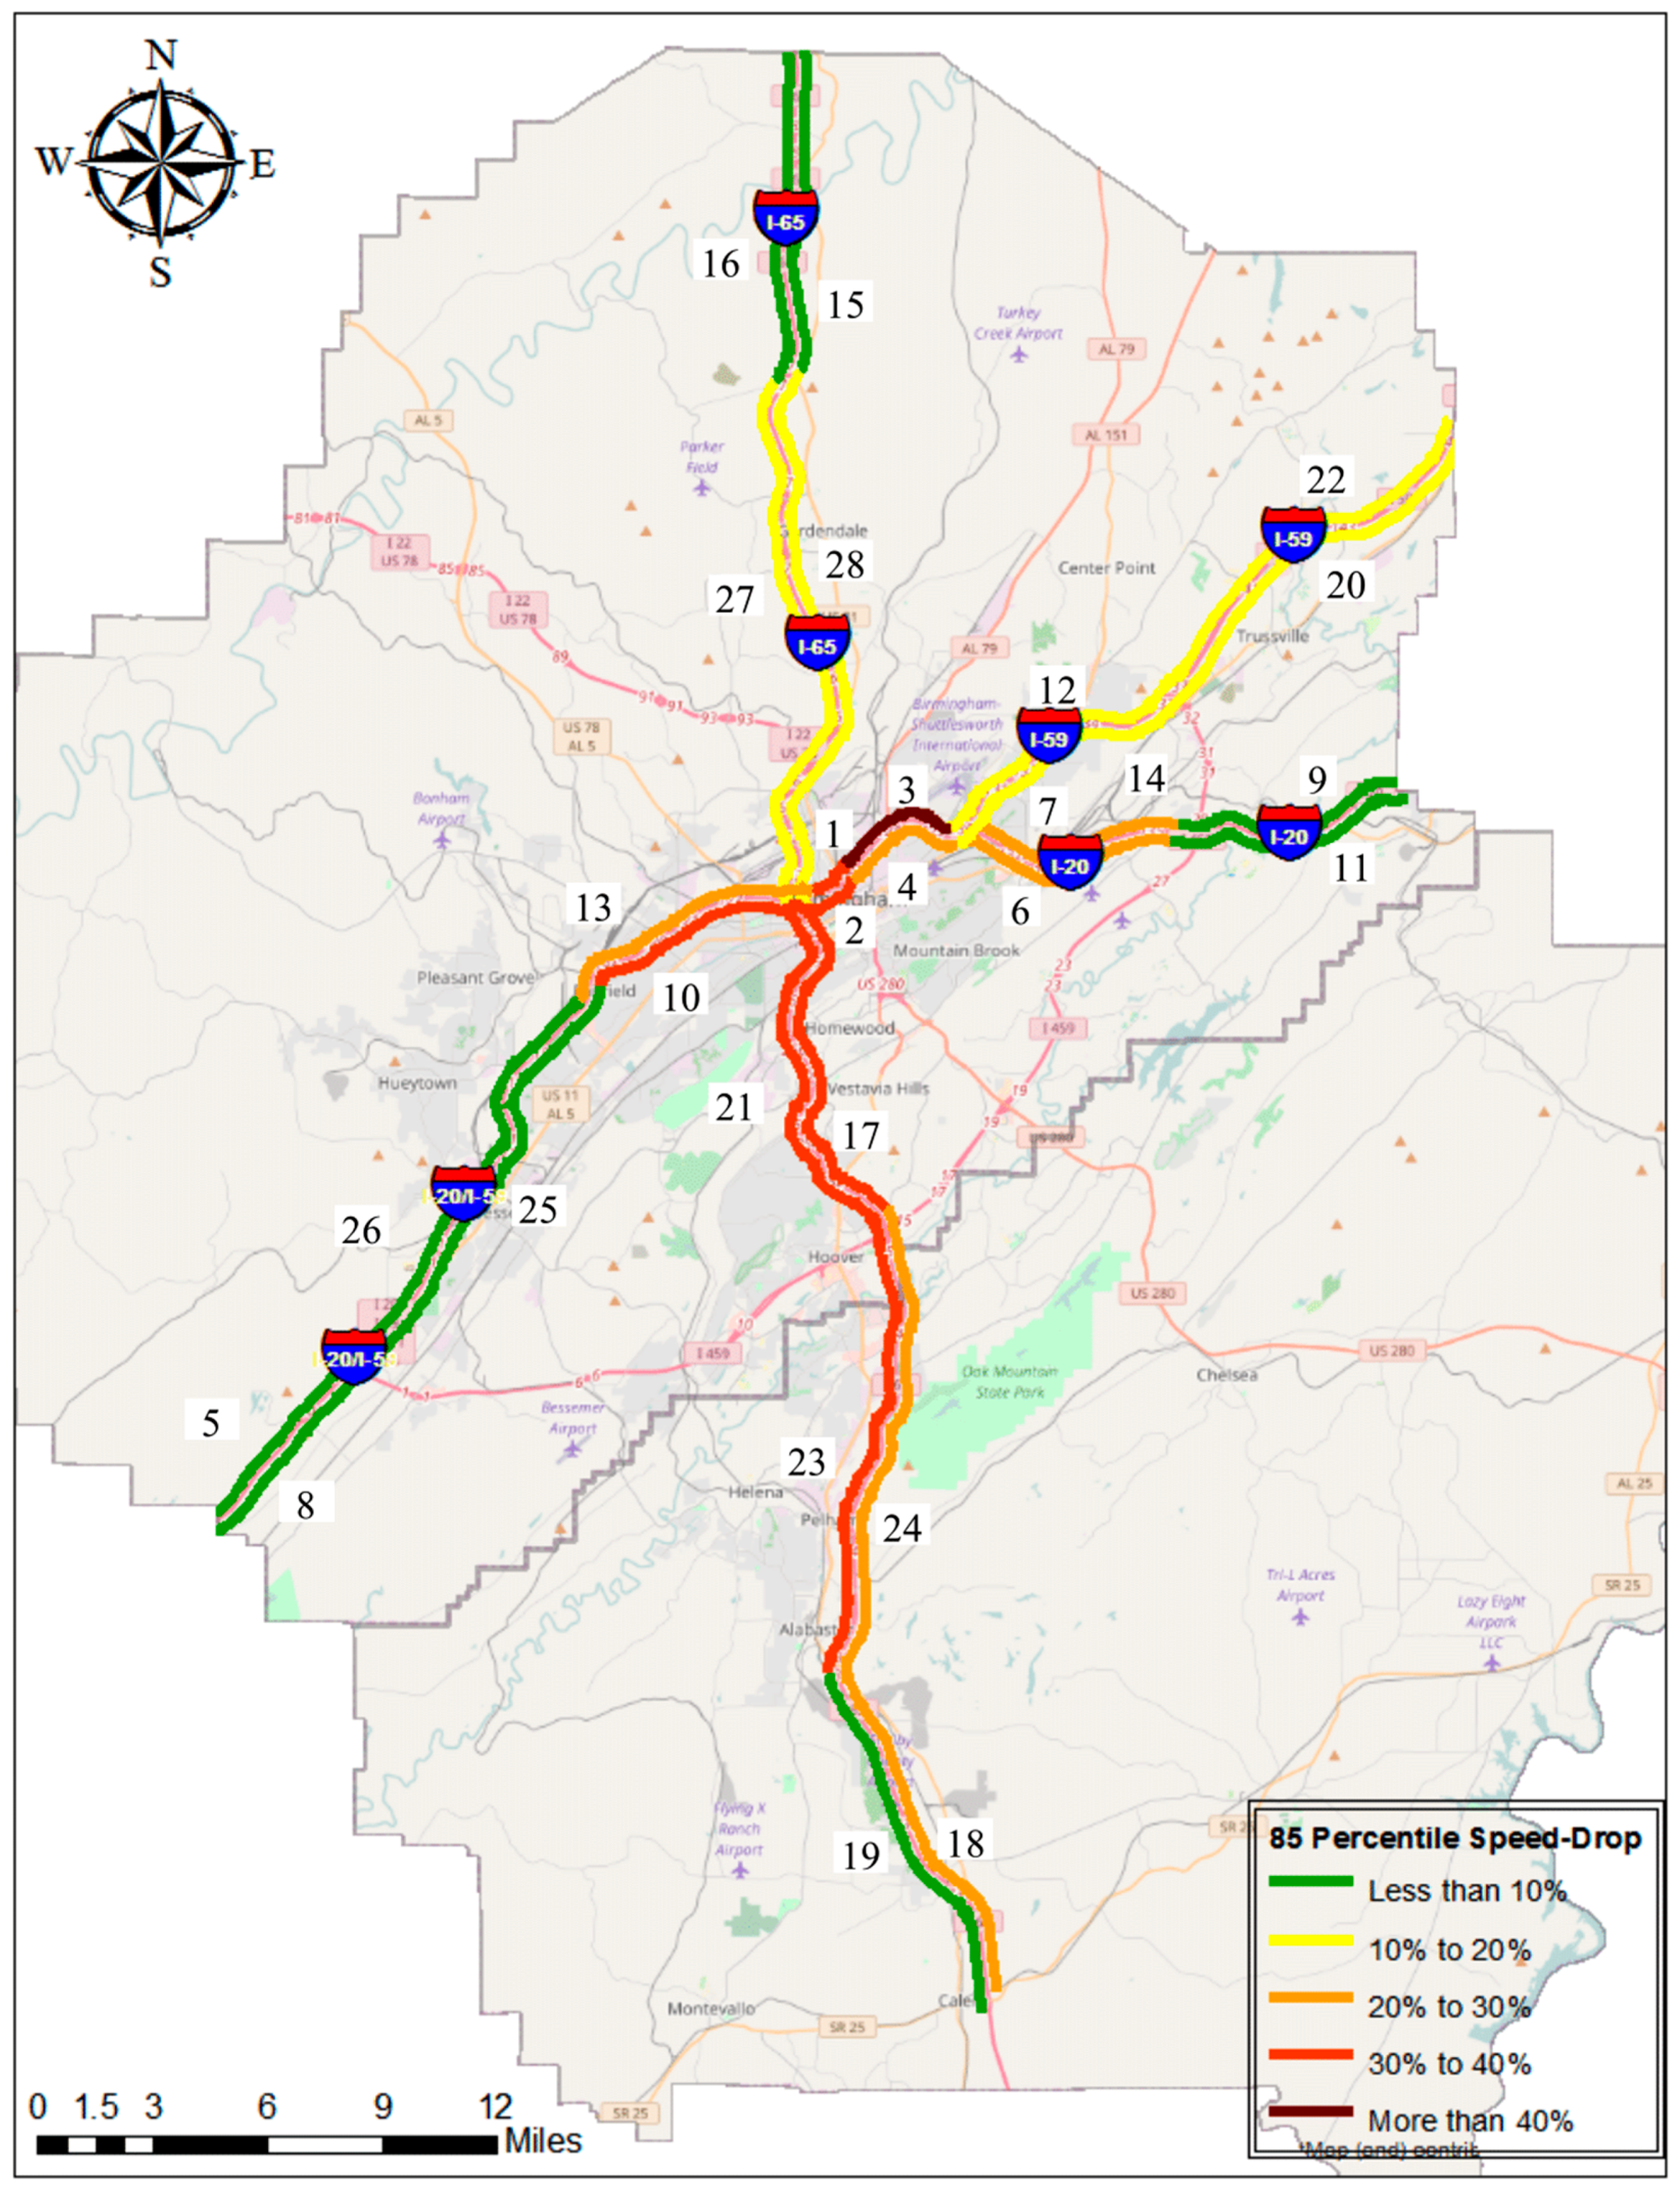
3.2.4. Speed-Drop
- i: segment code
- j: work day
- m: cell inside the space-time map
- Cng SP: Congested Speed
- Cutoff SP: Cutoff Speed
- VMTm: Vehicle Mile Traveled for cell m, and
- VMT of Congested Area: Total Vehicle Mile Traveled in the congested area
- CellArea: Area for cell m that is equal to EPOCH x Length of TMC, and
- CongestedArea: Total congested area calculated according to the nominator in Equation (2).
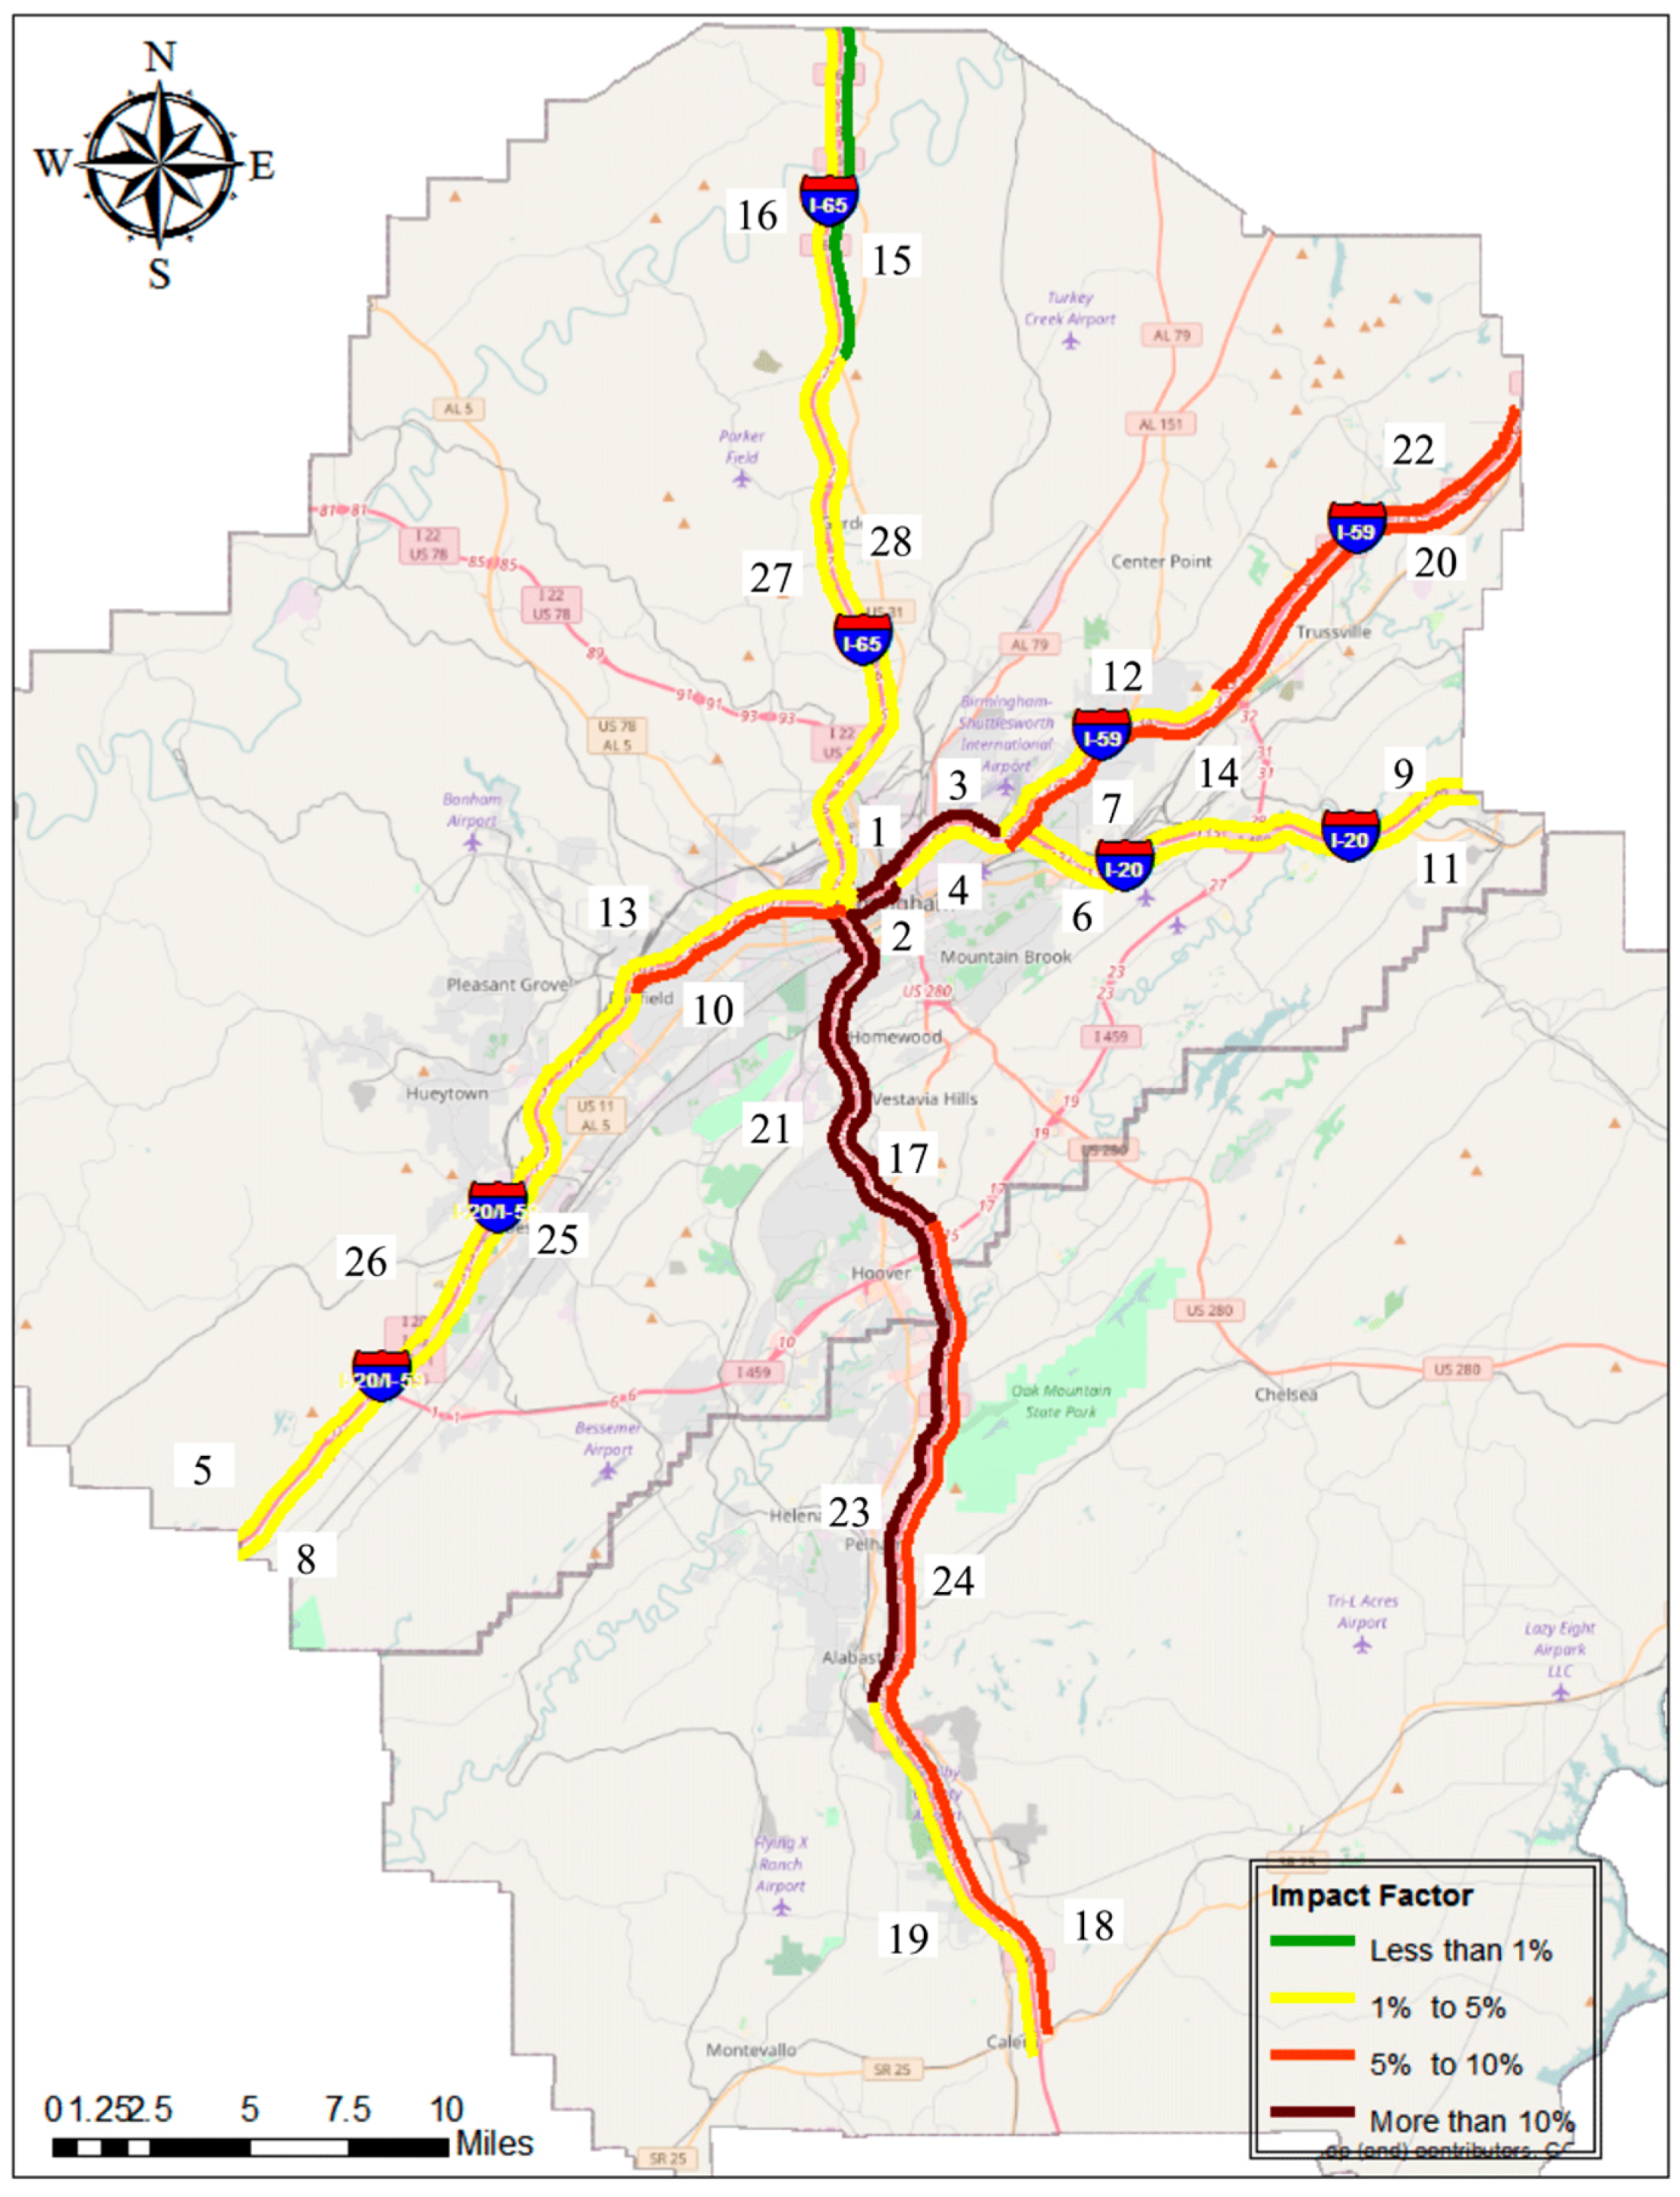
3.2.5. Impact Factor (IF)
- i: Segment code
- j: work day
4. Analysis and Results
4.1. Travel Time Index (TTI)
4.2. Duration of Congestion (DOC)
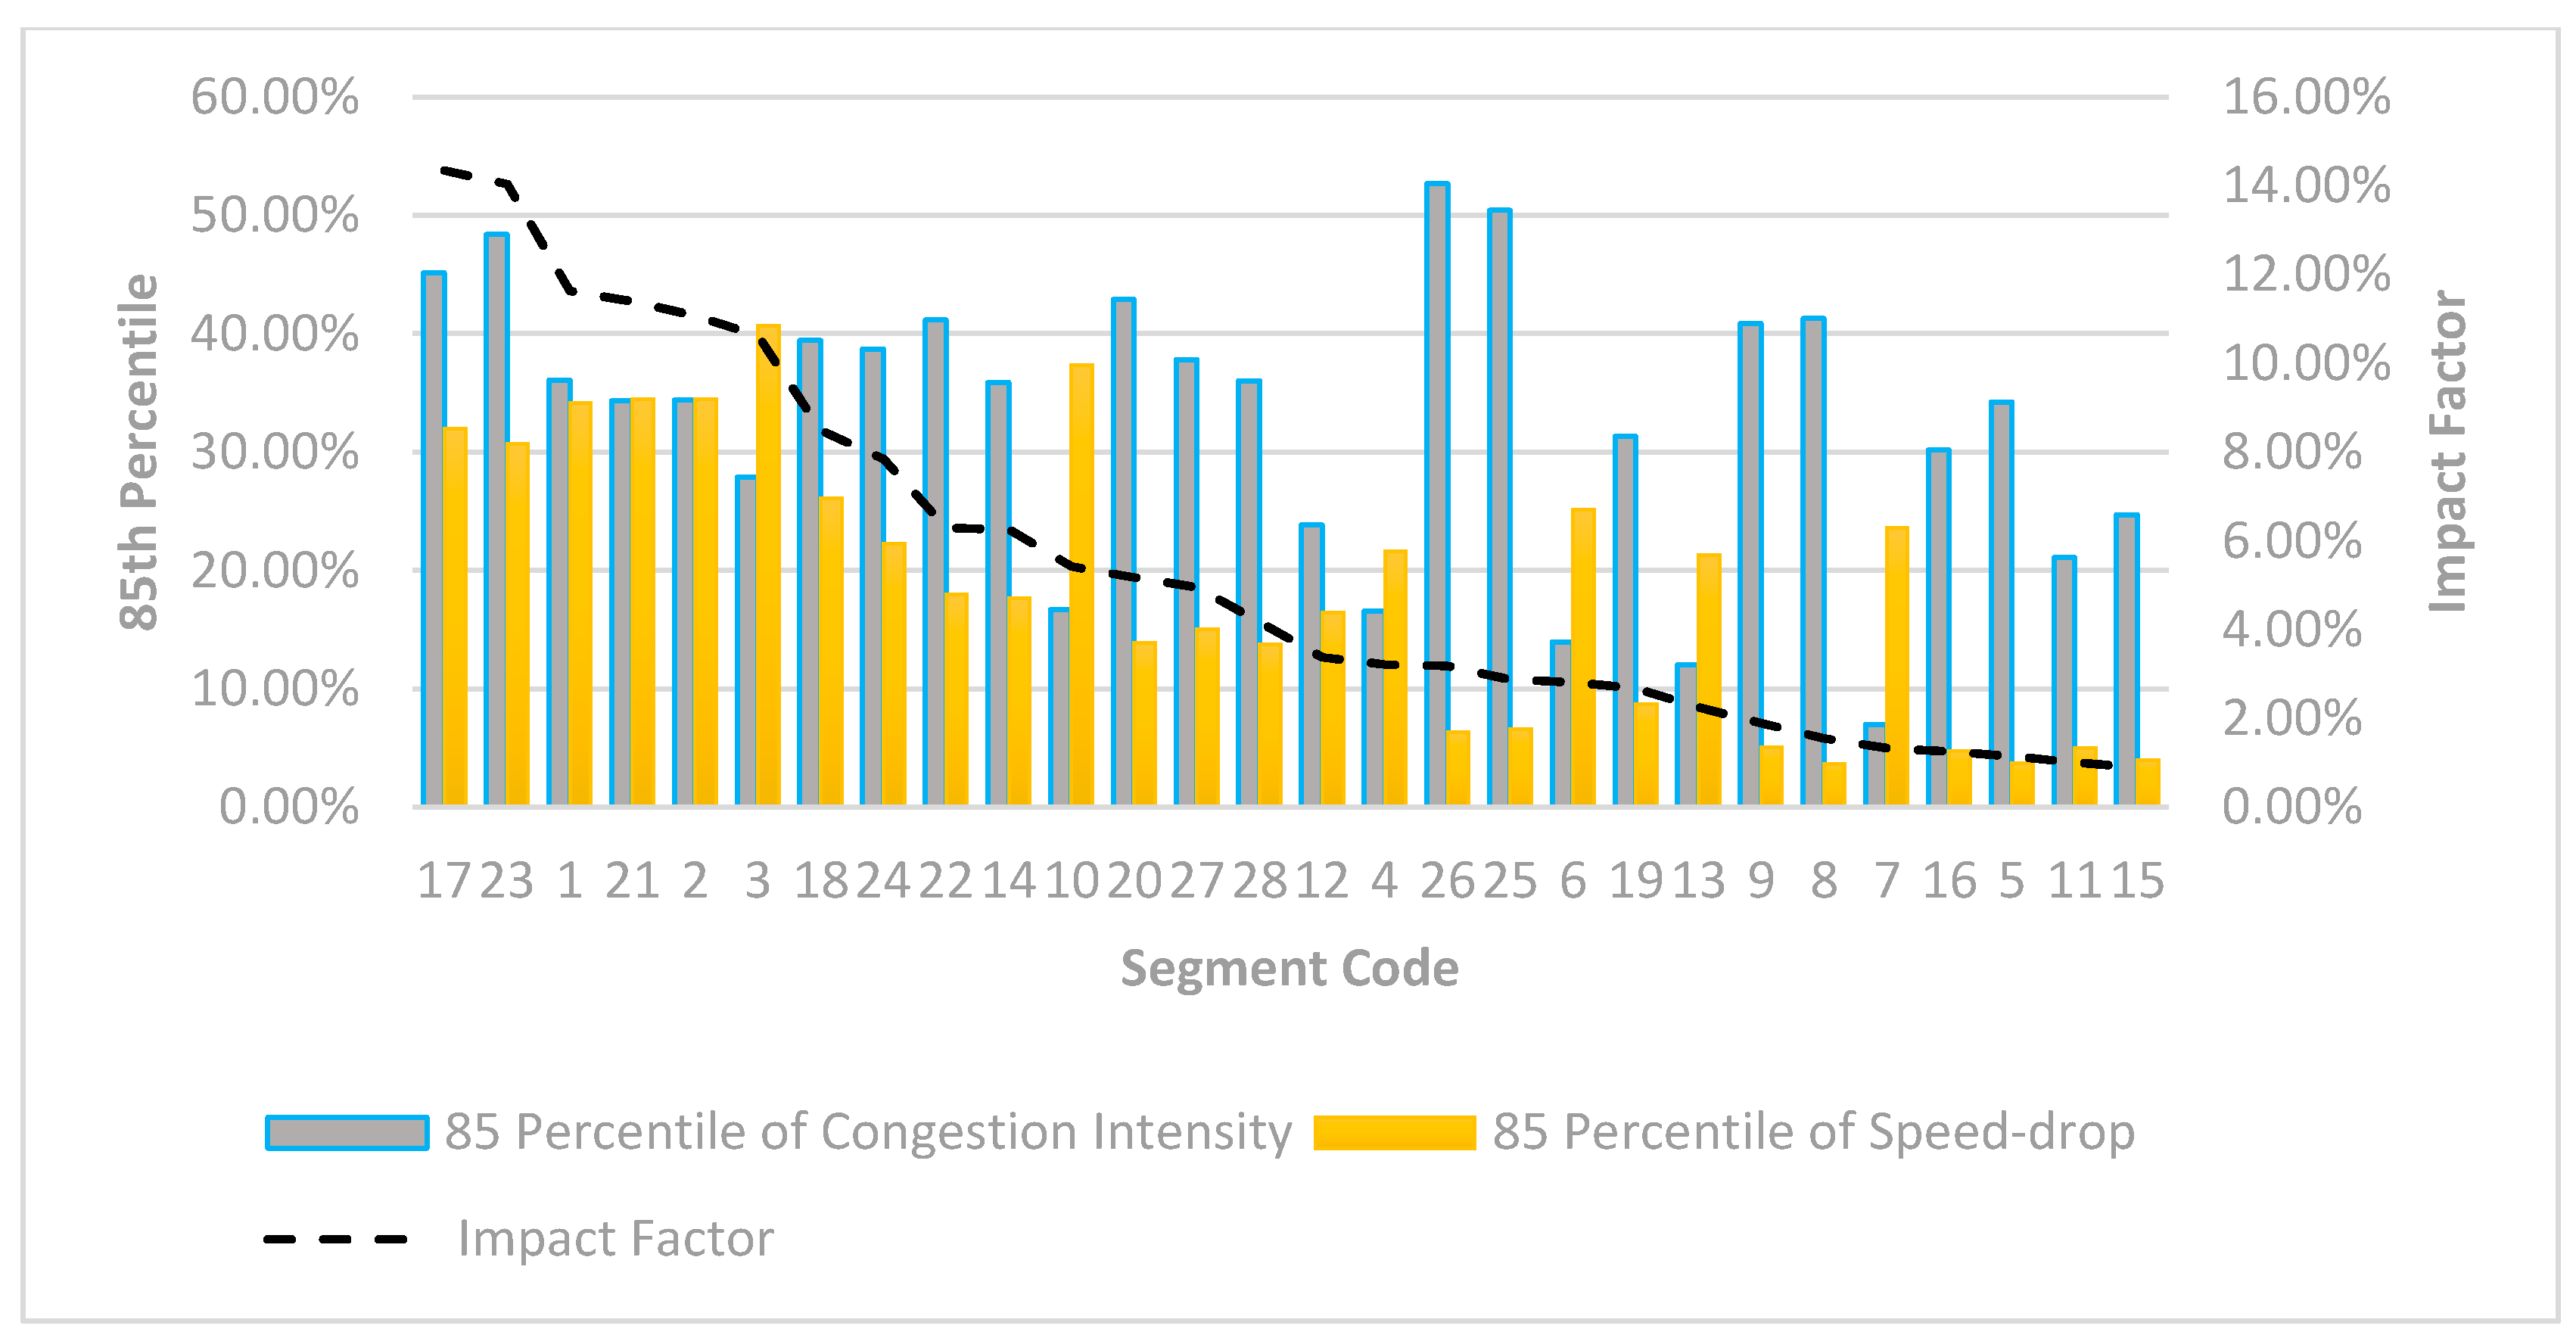
4.3. 85th Percentile of Congestion Intensity and Speed-Drop
4.4. Impact Factor
5. Conclusions and Recommendations
Acknowledgments
Author Contributions
Conflicts of Interest
References
- Schrank, D.; Eisele, B.; Lomax, T. Urban Mobility Report; Texas A&M Transportation Institute: College Station, TX, USA, 2015. [Google Scholar]
- Gharaibeh, N.; Zwahlen, T.M. NCHRP Synthesis 508: Data Management and Governance Practices; N.A.O. Sciences: Buckingham, UK, 2017. [Google Scholar]
- Lomax, T.; Turner, S.; Shunk, G. NCHRP, R. 398: Quantifying Congestion; Transportation Research Board: Washington, DC, USA, 1997. [Google Scholar]
- Introduction to the National Performance Management Research Data Set (NPMRDS); HERE and the Volpe Center: Cambridge, MA, USA, 2013.
- Rafferty, P.; Hankley, C. Applying National Probe Data for Performance Measures: Crafting and Visualizing Mobility from the NPMRDS; Wisconsin Traffic Operations and Safety Laboratory: Madison, WI, USA, 2014. [Google Scholar]
- Liao, C.-F. Using Truck GPS Data for Freight Performance Analysis in the Twin Cities Metro Area; Minnesota Department of Transportation Research Services & Library, Department of Civil Engineering University of Minnesota: Minneapolis, MN, USA, 2014. [Google Scholar]
- Torrey, W.F. Cost of Congestion to the Trucking Industry; American Transportation Research Institute (ATRI): Arlington, VA, USA, 2014. [Google Scholar]
- Schoener, G. I-95 Corridor Coalition Probe Data Comparison; UMD CATT Lab: College Park, MD, USA, 2014; Available online: http://i95coalition.org/ (accessed on 25 November 2017).
- Travel Time Reliability Reference Manual. 2014. Available online: https://en.wikibooks.org/wiki/Travel_Time_Reliability_Reference_Manual/INRIX_Data_Types (accessed on 25 November 2017).
- The iPeMS MAP-21 Module: Producing the Information You Need from the National Performance Management Research Data Set (NPMRDS); ITERIS Inc.: Santa Ana, CA, USA, 2015.
- Federal Highway Administration (FHWA). 2015 Urban Congestion Trends: Communicating Improved Operations with Big Data; Federal Highway Administration: Washington, DC, USA, 2016.
- Nam, D.; Park, D.; Khamkongkhun, A. Estimation of value of travel time reliability. J. Adv. Transp. 2005, 39, 39–61. [Google Scholar] [CrossRef]
- Bell, M.G.H.; Iida, Y. The Network Reliability of Transport. In Proceedings of the 1st International Symposium on Transportation Network Reliability (INSTR), Kyoto, Japan, 31 July–1 August 2001; Pergamon Press: Oxford, UK, 2003. [Google Scholar]
- Lomax, T.; Schrank, D.; Turner, S. Selecting Travel Reliability Measures; Texas Transportation Institute: College Station, TX, USA, 2003. [Google Scholar]
- National Academies of Sciences, Engineering, and Medicine. Cost-Effective Performance Measures for Travel Time Delay, Variation, and Reliability; The National Academies Press: Washington, DC, USA, 2008. [Google Scholar]
- Tu, H.; Lint, J.W.V.; Zuylen, H.J.V. Travel Time Reliability Model on Freeways. In Proceedings of the 87th Annual Meeting of Transportation Research Board, Washington, DC, USA, 13–17 January 2008. [Google Scholar]
- Federal Highway Administration (FHWA). Travel Time Reliability: Making It There on Time; All the Time; U.S. Department of Transportation: Washington, DC, USA, 2006.
- Federal Highway Administration (FHWA). Traffic Bottlenecks: Identification and Solutions; FHWA: Washington, DC, USA, 2016.


| Road Number | Segment Name | Travel Direction | Segment Code | TMC Count | Length (mile) |
|---|---|---|---|---|---|
| I-20 | I20/59 to I459 | Eastbound | 6 | 6 | 5.87 |
| Westbound | 7 | 6 | 5.96 | ||
| I459 to St. Clair County | Eastbound | 11 | 3 | 6.65 | |
| Westbound | 9 | 3 | 6.43 | ||
| I-20/I-59 | I459 to Valley Road | Eastbound | 25 | 6 | 12.09 |
| Westbound | 26 | 6 | 12.74 | ||
| I65 to RME | Eastbound | 2 | 3 | 1.39 | |
| Westbound | 1 | 3 | 1.27 | ||
| RME to I20/59 Split | Eastbound | 4 | 4 | 3.44 | |
| Westbound | 3 | 4 | 3.34 | ||
| Tuscaloosa Co. Line to I459 | Eastbound | 8 | 2 | 5.98 | |
| Westbound | 5 | 3 | 6.54 | ||
| Valley Road to I65 | Eastbound | 10 | 8 | 7.04 | |
| Westbound | 13 | 9 | 7.76 | ||
| I-59 | I20/59 to I459 | Northbound | 14 | 7 | 7.76 |
| Southbound | 12 | 6 | 7.47 | ||
| I459 to St. Clair County | Northbound | 20 | 4 | 10.45 | |
| Southbound | 22 | 5 | 10.85 | ||
| I-65 | Chilton County Line to US31 in Alabaster | Northbound | 18 | 3 | 9.99 |
| Southbound | 19 | 3 | 10.04 | ||
| I20/59 to US31/Mary Buckelew | Northbound | 28 | 10 | 15.10 | |
| Southbound | 27 | 9 | 14.42 | ||
| I459 to I20/59 | Northbound | 17 | 10 | 9.44 | |
| Southbound | 21 | 11 | 10.69 | ||
| US31 (Exit 275) to Cullman County Line | Northbound | 15 | 8 | 13.96 | |
| Southbound | 16 | 9 | 16.65 | ||
| US31 in Alabaster to I459 | Northbound | 24 | 6 | 12.53 | |
| Southbound | 23 | 6 | 11.83 |
| Segment Code | 85 Percentile of intensity | 85 Percentile of Speed Drop |
|---|---|---|
| 26 | 52.67% | 6.31% |
| 25 | 50.44% | 6.62% |
| 23 | 48.40% | 30.70% |
| 17 | 45.15% | 31.99% |
| 20 | 42.92% | 13.86% |
| 8 | 41.30% | 3.66% |
| 22 | 41.15% | 17.96% |
| 9 | 40.88% | 5.04% |
| 18 | 39.43% | 26.10% |
| 24 | 38.74% | 22.28% |
| 27 | 37.84% | 15.02% |
| 1 | 36.12% | 34.17% |
| 28 | 36.06% | 13.73% |
| 14 | 35.87% | 17.67% |
| 2 | 34.43% | 34.51% |
| 21 | 34.36% | 34.52% |
| 5 | 34.26% | 3.74% |
| 19 | 31.33% | 8.73% |
| 16 | 30.19% | 4.74% |
| 3 | 27.88% | 40.67% |
| 15 | 24.71% | 4.00% |
| 12 | 23.84% | 16.42% |
| 11 | 21.12% | 4.99% |
| 10 | 16.68% | 37.35% |
| 4 | 16.56% | 21.65% |
| 6 | 13.97% | 25.17% |
| 13 | 12.04% | 21.31% |
| 7 | 7.00% | 23.63% |
| Segment Code | |
|---|---|
| 23 | 14.85% |
| 17 | 14.44% |
| 1 | 12.34% |
| 2 | 11.88% |
| 21 | 11.86% |
| 3 | 11.34% |
| 18 | 10.29% |
| 24 | 8.63% |
| 22 | 7.39% |
| 14 | 6.34% |
| 10 | 6.23% |
| 20 | 5.95% |
| 27 | 5.68% |
| 28 | 4.95% |
| 12 | 3.92% |
| 4 | 3.59% |
| 6 | 3.51% |
| 25 | 3.34% |
| 26 | 3.32% |
| 19 | 2.74% |
| 13 | 2.57% |
| 9 | 2.06% |
| 7 | 1.65% |
| 8 | 1.51% |
| 16 | 1.43% |
| 5 | 1.28% |
| 11 | 1.05% |
| 15 | 0.99% |
© 2017 by the authors. Licensee MDPI, Basel, Switzerland. This article is an open access article distributed under the terms and conditions of the Creative Commons Attribution (CC BY) license (http://creativecommons.org/licenses/by/4.0/).
Share and Cite
Sisiopiku, V.P.; Rostami-Hosuri, S. Congestion Quantification Using the National Performance Management Research Data Set. Data 2017, 2, 39. https://doi.org/10.3390/data2040039
Sisiopiku VP, Rostami-Hosuri S. Congestion Quantification Using the National Performance Management Research Data Set. Data. 2017; 2(4):39. https://doi.org/10.3390/data2040039
Chicago/Turabian StyleSisiopiku, Virginia P., and Shaghayegh Rostami-Hosuri. 2017. "Congestion Quantification Using the National Performance Management Research Data Set" Data 2, no. 4: 39. https://doi.org/10.3390/data2040039