
CHASE-PL—Future Hydrology Data Set: Projections of Water Balance and Streamflow for the Vistula and Odra Basins, Poland


1
Department of Hydraulic Engineering, Warsaw University of Life Sciences, ul. Nowoursynowska 159, 02-776 Warsaw, Poland
2
Potsdam Institute for Climate Impact Research, Telegraphenberg A31, 14473 Potsdam, Germany
*
Author to whom correspondence should be addressed.
Data 2017, 2(2), 14; https://doi.org/10.3390/data2020014
Submission received: 11 March 2017
/
Revised: 9 April 2017
/
Accepted: 10 April 2017
/
Published: 26 April 2017
(This article belongs to the Special Issue Open Data and Robust & Reliable GIScience)
Abstract
:There is considerable concern that the water resources of Central and Eastern Europe region can be adversely affected by climate change. Projections of future water balance and streamflow conditions can be obtained by forcing hydrological models with the output from climate models. In this study, we employed the SWAT hydrological model driven with an ensemble of nine bias-corrected EURO-CORDEX climate simulations to generate future hydrological projections for the Vistula and Odra basins in two future horizons (2024–2050 and 2074–2100) under two Representative Concentration Pathways (RCPs). The data set consists of three parts: (1) model inputs; (2) raw model outputs; (3) aggregated model outputs. The first one allows the users to reproduce the outputs or to create the new ones. The second one contains the simulated time series of 10 variables simulated by SWAT: precipitation, snow melt, potential evapotranspiration, actual evapotranspiration, soil water content, percolation, surface runoff, baseflow, water yield and streamflow. The third one consists of the multi-model ensemble statistics of the relative changes in mean seasonal and annual variables developed in a GIS format. The data set should be of interest of climate impact scientists, water managers and water-sector policy makers. In any case, it should be noted that projections included in this data set are associated with high uncertainties explained in this data descriptor paper.
Data Set: CHASE-PL—Future Hydrology (CPL-FH) data set is stored in the 4TU Centre for Research Data repository with the DOI: 10.4121/uuid:931bc857-9261-4bd8-b76c-ce5586948df3.
Data Set License: The data set is available through a standard open access (unrestricted) license of 4TU Centre for Resarch Data. General Terms of Use apply: http://researchdata.4tu.nl/en/publishing-research/uploading-data/. In particular, for non-commercial use, the product is available free of charge. For commercial use, the data might be made available conditioned on a fee to be agreed with WULS-SGGW representatives, owners of the IPR of the data set.
1. Summary
Climatic change, manifested both in observations and model projections, is not limited to the ubiquitous warming. In many areas, including Central and Eastern Europe (CEE), change of atmospheric precipitation is even more important, impact-wise. In much of CEE, mean renewable surface water resources are rather low. At the same time the region is affected by severe floods [1]. Hence, there is considerable concern that the water resources of the CEE region can be adversely affected by climate change.
A common approach to assess climate change effects on hydrology is forcing hydrological models with the output from (bias-corrected) climate models, either statistically-downscaled General Circulation Models (GCMs), or Regional Climate Models (RCMs) coupled with GCMs through dynamical downscaling. Although studies reporting the impacts of climate change on hydrology in catchments, regions, continents and the whole globe are numerous, the underlying data sets of projected water balance and streamflow have been extremely rarely published to date. A few exceptions are: Future Flows and Groundwater Levels data set for the U.K. [2] as well as a more general and thematically-wider data set of model simulations from the Inter-sectoral Impact Model Intercomparison Project (ISIMIP, https://www.isimip.org/outputdata/).
To our knowledge, there does not exist any open access data set concerning future water balance and streamflow projections for CEE or any of its large parts. Thus, the data set described herein, covering two large river basins located in CEE, the Vistula and Odra basins (VOB), attempts to fill this gap. The VOB region covers most of Poland and parts of neighbour countries (Germany, Czech Republic, Slovakia, Ukraine and Belarus). The Vistula and Odra basins occupy 193,831 and 119,041 km, of which 87 % and 88 %, respectively, lie in Poland.
The CHASE-PL—Future Hydrology (CPL-FH) data set was developed within the CHASE-PL (Climate Change Impact Assessment for Selected Sectors in Poland) project funded within the Polish-Norwegian Research Programme. The project already delivered three state-of-the art, high-resolution spatial hydro-meteorological data sets for this area:
CPLFD-GDPT5 and CPL-NH are data sets of the hydro-meteorological variables for the historical period: the former storing gridded observations of precipitation and temperature, and the latter storing the simulated water balance components and natural streamflow. CPLCP-GDPT5 stores projections of climate variables for two future time horizons, bias-corrected against the CPLFD-GDPT5 data set. The CPL-FH data set, described in this paper, is the last one in the chain, and closes the modelling matrix performed in CHASE-PL (Figure 1).
The main tool used to develop the CPL-FH (as well as CPL-NH) data set was the hydrological model SWAT (Soil & Water Assessment Tool, [9]). This semi-distributed, process-based, continuous-time watershed model has been very widely used for climate change impact assessments on water resources in all world regions [10,11]. Indeed, as of 22 February 2017, the SWAT Literature Database of the Peer-Reviewed Journal Articles https://www.card.iastate.edu/swat_articles/index.aspx contains 299 publications under the “Climate change” category. This model has been selected in this study due to a long-lasting history of its successful applications in Poland [12,13], but also due to its flexibility, aforementioned popularity and its open source code.
The data set described herein has already been used for studying the impacts of climate change on mean annual and seasonal runoff [14], on high and low river flows [15] and for a cross-comparison with the HBV model in eight small Polish catchments [16]. It is expected that the data set has the potential to attract more researchers to study the hydrological impacts of climate change in CEE. It should be of interest of water managers and water-sector policy makers in the context of climate change adaptation. It should also attract attention of regional impact modellers from other disciplines than hydrology, e.g., agricultural modellers (e.g., with respect to projected changes in soil water, evapotranspiration and water availability for irrigation) and freshwater ecologists (e.g., with respect to projected alterations of streamflow that may affect freshwater biota).
2. Data Description
The data set consists of three parts described in the sub-sequent sub-sections: (1) model inputs; (2) raw model outputs; (3) aggregated model outputs. While the second part, raw model outputs, is the essence of this data set, the other two are also important: the model inputs allow the experienced users to reproduce the outputs, or to create the new ones by adjusting settings or parameters; the aggregated model outputs are useful for various users not interested in daily projections based on single climate model, but in the impact indicators, such as the relative changes in mean seasonal runoff measured by different statistics of the climate model ensemble. These indicators are stored in GIS format which enables immediate viewing of spatial variability of projected impacts in different variables.
2.1. Model inputs
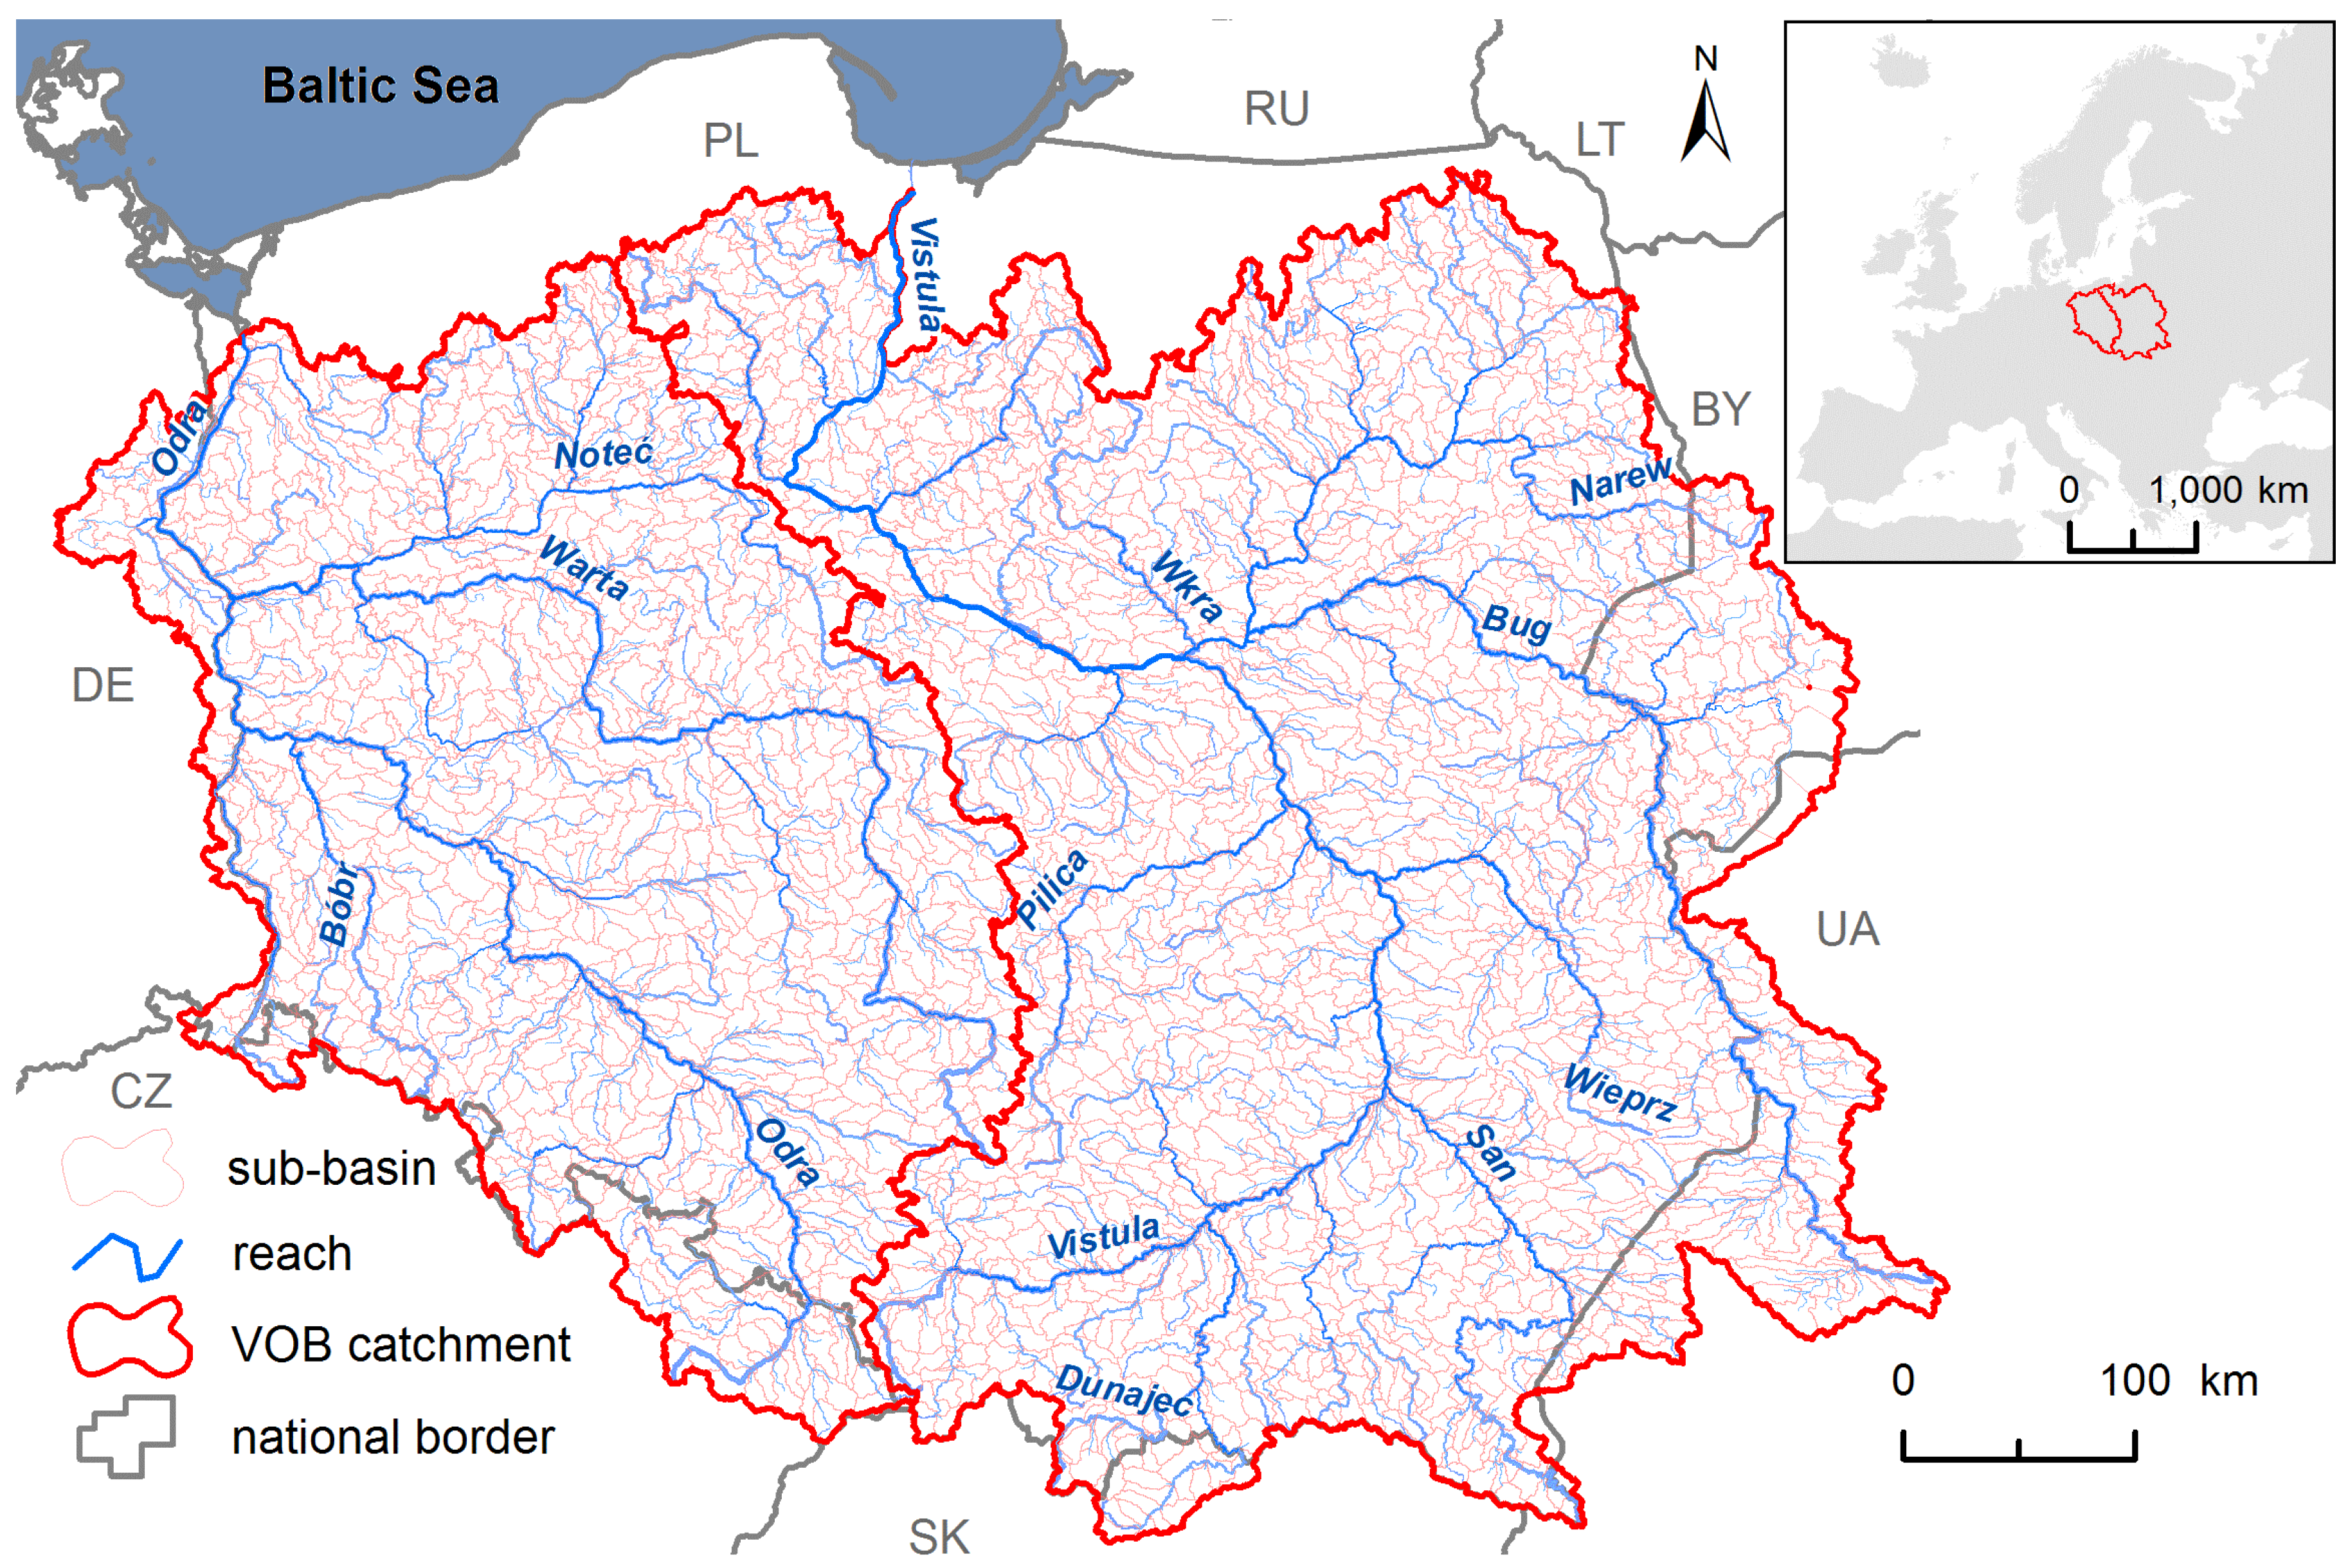
The zipped directory of SWAT input files (Txtinout.zip) contains the full collection of all files necessary to run the SWAT project of the VOB. In total, there are 170,475 files in the directory. As described in more detail by [14], the SWAT project consists of 2633 sub-basins and reaches (Figure 2) and of 21,311 Hydrological Response Units (HRUs), basic spatial entities used for modelling. The SWAT2012 executable, revision 635, was used for running all simulations. Since SWAT is a public domain model, its code is available at the model’s website http://swat.tamu.edu/software/swat-executables/.
The zipped Txtinout directory contains the climate input files: precipitation files (*.pcp), temperature files (*.tmp), weather generator files (*.wgn), sub-basin files (*.sub) and snow files (*.sno), all related to the calibrated and validated model that runs for the period 1951–2013. There is another zipped file (ClimateScenarios.zip) that contains modified climate inputs that were constructed based on the RCM outputs with the help of the ArcSWAT GIS interface. In total, 45 groups of files originating from nine climate models (Table 1), three time horizons (reference period 1971–2000, near future 2021–2050, and far future 2071–2100) and two Representative Concentration Pathways (RCPs) (4.5 and 8.5) are included. The directory naming follows a convention: R_cmZ_YYYY-YYYY, where:
- R can be “ref”, meaning reference. “rcp45” or “rcp85” meaning different Representative Concentration Pathways, RCP 4.5 and RCP 8.5, respectively;
- cmZ—defined GCM-run-RCM combination, where Z refers to the codes from Table 1.
- YYYY-YYYY defines the beginning and ending year of the simulation period, i.e., either 1971–2000, or 2021–2050, or 2071–2100.
An explanation how to proceed with running the model for one of these 45 climate scenarios is explained in Section 4.
2.2. Raw Model Outputs
The data set contains the simulation output from SWAT for 46 different model runs, zipped in RawModelOutput.zip file:
- The calibrated and validated SWAT model run for the historical period 1954–2013 (cf. [14]);
- Model runs forced with nine different bias-corrected RCM data (cf. Section 3) for the reference period 1974-2000 (Ref);
- Model runs forced with nine different RCM data under RCP 4.5 for the near future (NF), i.e., 2024–2050;
- Model runs forced with nine different RCM data under RCP 8.5 for NF;
- Model runs forced with nine different RCM data under RCP 4.5 for the far future (FF), i.e., 2074–2100;
- Model runs forced with nine different RCM data under RCP 8.5 for FF.
As regards SWAT simulations forced with RCM data, all of them were performed for 30-year periods, but due to the fact that three first years of each run were used as the warm-up period, they were truncated from the time series. All simulations were carried out with a daily time step. Two types of output variables can be distinguished: sub-basin-level variables (water balance) and reach-level variables (streamflow, cf. Table 2). The former were aggregated to the monthly scale, due to a large number of variables and space limitations, and the latter were stored in the original daily scale.
Model output from the calibrated and validated SWAT run constitutes an upgrade of the CPL-NH data set [5]. The upgrade is related to fixing a minor bug in reach evaporation that was present in the previous version of the data set. The updated data set comes from the same forcing [3] but uses slightly different parametrization than the one before.
Raw model output data are stored as comma separated values (.csv format), 46 files for sub-basin variables and 46 files for the reach variable, i.e., streamflow. All files follow the naming convention X_subbasin.csv or X_reach.csv, where X can attain one of 46 values: “Calibration_1954-2013”, in the case of the calibrated and validated model for the period 1954-2013, or "R_cmZ_YYYY-YYYY", where (as in Section 2 in the case of directory naming):
- R can be “ref”, meaning reference. “rcp45” or “rcp85” meaning different Representative Concentration Pathways, RCP 4.5 and RCP 8.5, respectively;
- cmZ—defined GCM-run-RCM combination, where Z refers to the codes from Table 1.
- YYYY-YYYY defines the beginning and ending year of the simulation period, i.e., either 1974–2000, or 2024–2050, or 2074–2100.
For clarity, the list of all files is described in Supplementary Material Table S1. All files have similar, simple structure: one column with sub-basin/reach ID, one column with (daily or monthly) date, and the subsequent columns with variables from Table 2 and respective values.
2.3. Aggregated Model Outputs
The aggregated model outputs include the multi-model ensemble (cf. Table 1) 5-th percentiles, medians, and the 95-th percentiles of the relative changes in the multi-annual or multi-seasonal mean values of analysed variables (cf. Table 2) between respective future horizons and the reference period. The statistics are calculated for all sub-basins and reaches, for two future horizons (always with respect to the reference period) under both RCPs. The data are stored in eight shapefiles according to the following convention: subbasin_aggreg_R_YYYY-YYYY_wrt_1974-2000.shp for the water balance data pertaining to SWAT sub-basins, and reach_aggreg_R_YYYY-YYYY_wrt_1974-2000.shp for the flow data data pertaining to SWAT reaches, where:
- R can be “rcp45” or “rcp85” meaning different Representative Concentration Pathways, RCP 4.5 and RCP 8.5, respectively;
- YYYY-YYYY defines the beginning and ending year of the future projection horizon, i.e., 2024–2050, or 2074–2100 (note that three first years are truncated).
Each shapefile stores geographic vector data of 2,633 SWAT sub-basins (polygons) or reaches (polylines) as well as a list of attributes, among which are the standard attributes computed by ArcSWAT in the SWAT project creation phase and the ensemble statistics related to particular variables from Table 2. The names of these fields are Var_X_time, where Var denotes the variable codes from Table 2, X denotes one of three possible ensemble statistics: “L” for low change, i.e., 5-th percentile; “M” for median change, i.e., 50-th percentile; and “H” for high change, i.e., 95-th percentile, and time denotes a temporal aggregation: “Ann” for annual, and “DJF”, “MAM”, “JJA” and “SON” for corresponding seasons (winter, spring, summer, autumn, respectively).
The aggregated model outputs can be also visually analysed in the interactive geoportal of the CHASE-PL project: http://climateimpact.sggw.pl (section Maps—Impact).
3. Methods
The standard workflow of performing hydrological projections using mathematical models is as follows: (1) model setup; (2) model calibration and evaluation (sometimes with uncertainty analysis); (3) model application for climate impact assessment. The setup and calibration of the SWAT model for the Vistula and the Odra basins were thoroughly described in [6]. A brief overview is given below.
3.1. Calibrated SWAT Model
The SWAT model applied in this study is a river basin scale model originally developed to quantify the impact of land management practices in large, complex watersheds [9]. In SWAT, river basins are partitioned into sub-basins, which are further divided into Hydrologic Response Units (HRUs), the objects based on a combination of soil, land cover and slope overlay within each sub-basin. All water balance components are calculated separately for each HRU, spatially aggregated at the sub-basin level and routed through the river network to the basin outlet. In the present study the temperature-based Hargreaves method was used for calculation of potential evapotranspiration (PET). The modified USDA Soil Conservation Service (SCS) curve number method was selected for calculating surface runoff. The remaining hydrological processes were simulated using the default SWAT methods, fully described in [17].
For the model calibration, a dataset of 80 relatively unmodified catchments, representing different climatic conditions characteristic for different parts of the VOB, was selected and disaggregated into eight clusters based on flow regime similarity. Clusters were distinguished using the first five principal components calculated from the large set of flow metrics, i.e., Indicators of Hydrologic Alteration [18]. Hierarchical agglomerative clustering technique with Ward’s minimum distance criterion was used.
Each cluster was calibrated independently, with an objective of achieving satisfactory fit for clusters as a whole, rather than for each individual catchment. This objective was fulfilled, with the cluster-median daily Kling-Gupta Efficiency (KGE, [19]) above 0.5 in calibration and validation periods. The optimal parameter values were transfered from donor clusters to target ungauged sub-catchments using the hydrological distance approach [20,21]. In this approach, hydrological similarity was evaluated based on a set of climatic-physiographic properties of the donor and target catchments. The KGE values were also higher than 0.5 for each of 30 gauges selected for spatial evaluation, which showed that the designed regionalization scheme worked well. The list of parameters used in calibration, as well as their optimal values and ranges is presented in Table S2 of the Supplementary Materials. In summary, calibration and evaluation results demonstrated that SWAT can be applied for climate change impact assessment in the VOB.
It should be noted that the model does not include water management (reservoirs, canals, withdrawals, discharges, etc.) in its setup, but simulates natural streamflow. This means that the developed projections show the pure effect of climate change, not damped or magnified by water management.
3.2. Climate Projections
The CPLCP-BCDPT5 data set [7] was used here for developing hydrological projections with the help of the SWAT model. This dataset contains projections of daily values of minimum and maximum temperature and precipitation from a multi-model ensemble of nine EURO-CORDEX RCM simulations (cf. Table 1) for the reference period, near future and far future under RCPs 4.5 and 8.5. Two contrasting RCPs manifest future greenhouse gas (GHG) emission pathways and different levels of global climate warming (approximately 2 degrees higher in RCP 8.5 than in RCP 4.5 in 2100). Selected simulations consisted of combinations of four GCMs with four RCMs and were bias-corrected using the quantile mapping method (R package ‘qmap’ developed by the Norwegian Meteorological Institute, [22]). The discussion of projected changes in temperature and precipitation in the VOB can be found in [8]. The CPLCP-BCDPT5 data set was used to create the SWAT weather input files pertaining to particular scenarios. The SWAT model was then run for each of these scenarios, and the outputs of these model runs compose the present data set.
3.3. Uncertainty
Projections are model-derived estimates of future climate, while predictions are essentially projections where there is a high degree of confidence in a specific outcome. Hence, hydrological projections described in this paper, derived based on climate projections should not be confused with predictions.
The cascade of uncertainty [23], illustrates the increase of uncertainty along the process of developing climate change impact projections. On top of the uncertainty pyramid are the unknowns about the future society (demography, economy, technology, governance), followed by the uncertain future trajectories of atmospheric GHGs concentrations dependent not only on future socio-economic factors but also on the effectiveness of mitigation policies. One step lower in the cascade are the uncertainties related to climate models (GCMs, RCMs, downscaling, bias correction). For this reason, it is recommended that a range of scenarios (represented by different RCPs, GCMs, RCMs) be applied in impact assessments rather than a single best guess or average case [24,25].
This study explicitly takes into account the uncertainties related to GHG emissions and climate models, whereas it neglects other types of uncertainties. The plausible range of future GHG forcings is represented by two contrasting RCPs. The climate model ensemble includes nine GCM-RCM combinations. Only one impact model, SWAT, was used to derive hydrological projections. This is due to the fact that setting up and calibrating a large-scale model at high spatial and temporal resolution is a very time-consuming undertaking (cf. [6]). Even one impact model can be associated with high uncertainties: structural and parametric ones. These two are not quantified in this study, although the Sequential Uncertainty Fitting version 2 (SUFI-2) method was applied for the uncertainty assessment in the calibration process [6]. This technique allowed to estimate the 95 prediction prediction uncertainty (95PPU) band around the flow time series simulated using the optimal parameter set. Furthermore, under-estimation of low flows in small catchments is a typical problem associated with this data set, whereas the model performs better for high flows [15]. In summary, it should be emphasized that future water balance and streamflow projections presented in the described data set are associated with high uncertainties, but also that the overall uncertainty is potentially underestimated due to ignoring some of its important sources.
4. User Notes
4.1. Model Execution
Execution of the model using the input data from the Txtinout directory should start with setting all necessary parameters in the file.cio configuration file (cf. [17]). The user can adjust the simulation start and end dates, output print time step (day, month, year), the range of variables printed, etc. Four SWAT executable files are available: for 32-bit and 64-bit operation systems, and a release and debug versions. The model was calibrated using revision 635 of SWAT2012 executable, so care should be taken when using other revisions, such as the ones constantly updated on the SWAT website http://swat.tamu.edu/software/swat-executables/. Execution of the model (e.g., rev635_64rel.exe file for the release version on the 64-bit OS) takes place in the Windows command line window in the Txtinout directory. The model output files (e.g., output.sub and output.rch) are saved in the same directory.
For running the model with one of 45 climate scenario data from the ClimateScenarios.zip file, the user needs to replace all the files in the Txtinout directory with the respective files from the directory storing input data pertaining to a given scenario and rerun the executable file.
For editing large output files (one file can have even several gigabytes), the use of a free text editor for Windows EditPad Lite is recommended.
4.2. Post-Processing of Model Outputs
The user may wish to perform his/her own analysis of the raw model outputs (cf. Section 2.2 and Supplementary Materials Table S1), that will require some post-processing. One option to do it is to connect the respective files to the database software (e.g., PostgreSQL, OpenOffice Base, MS Access) and next, export the subset of data of interest after performing an SQL query (e.g., selecting specified sub-basin numbers and date ranges). In a typical situation, the user will want to select sub-basins related to his/her study area of interest. This can be achieved in two ways:
- By selecting sub-basin numbers from the subbasins.shp file based on a query in the GIS software (e.g., QGIS);
- By connecting a table SubbasinDomainLev3.csv (located in RawModelOutputs.zip) to the database. This coded domain table stores geographical names of the rivers based on the Map of Hydrographical Division of Poland (MPHP 2012). Three highest Strahler [26] stream orders are included, e.g., Wisła/Narew/Biebrza.
The use of aggregated model outputs is straightforward. Shapefiles can be directly opened in GIS software and maps showing projected changes in different variables can be easily displayed.
Supplementary Materials
The following are available online at https://www.mdpi.com/2306-5729/2/2/14/s1, Table S1: List of raw model output files, Table S2: The list of calibration parameters.
Acknowledgments
Support of the project CHASE-PL (Climate change impact assessment for selected sectors in Poland) of the Polish–Norwegian Research Programme operated by the National Centre for Research and Development (NCBiR) under the Norwegian Financial Mechanism 2009-2014 in the frame of Project Contract No. Pol Nor/200799/90/2014 is gratefully acknowledged. Several CHASE-PL project scientists, notably Tomasz Berezowski, Zbigniew W. Kundzewicz, Abdelkader Mezghani and Tomasz Okruszko, contributed to the development of the described data set. The first author is grateful for support to the Alexander von Humboldt Foundation and to the Ministry of Science and Higher Education of the Republic of Poland. Two anonymous referees helped to improve the manuscript.
Author Contributions
M.P. conceived and designed the experiments; M.S. performed the experiments; M.P., M.S. and I.K. processed and analyzed the data; M.S and I.K. organised the data set; M.P. wrote the paper, with inputs from M.S. and I.K.
Conflicts of Interest
The authors declare no conflict of interest.
Abbreviations
The following abbreviations are used in this manuscript:
| .csv | comma-separated values file |
| 95PPU | 95 percent prediction uncertainty |
| Ann | annual |
| CEE | Central and Eastern Europe |
| CHASE-PL | Climate Change Impact Assessment for Selected Sectors in Poland |
| CPLCP-GDPT5 | CHASE-PL Climate Projections—Gridded Daily Precipitation and Temperature 5 km data set |
| CPLFD-GDPT5 | CHASE-PL Forcing Data—Gridded Daily Precipitation and Temperature 5 km data set |
| CPL-FH | CHASE-PL—Future Hydrology data set |
| CPL-NH | CHASE-PL—Natural Hydrology |
| DJF | winter |
| FF | far future |
| GCM | General Circulation Models |
| GHG | greenhouse gas |
| GIS | Geographic Information System |
| HRU | Hydrologic Response Units |
| ISIMIP | Inter-sectoral Impact Model Intercomparison Project |
| JJA | summer |
| KGE | Kling-Gupta Efficiency |
| MAM | spring |
| NF | near future |
| PET | potential evapotranspiration |
| RCM | Regional Climate Models |
| SCS | Soil Conservation Service |
| SON | autumn |
| SUFI-2 | Sequential Uncertainty Fitting version 2 |
| SWAT | Soil&Water Assessment Tool |
| U.K. | United Kingdom |
| USDA | United States Department of Agriculture |
| VOB | Vistula and Odra basins |
References
- Kundzewicz, Z.; Ulbrich, U.; Brücher, T.; Graczyk, D.; Krüger, A.; Leckebusch, G.; Menzel, L.; Pińskwar, I.; Radziejewski, M.; Szwed, M. Summer Floods in Central Europe—Climate Change Track? Nat. Hazards 2005, 36, 165–189. [Google Scholar] [CrossRef]
- Prudhomme, C.; Haxton, T.; Crooks, S.; Jackson, C.; Barkwith, A.; Williamson, J.; Kelvin, J.; Mackay, J.; Wang, L.; Young, A.; et al. Future Flows Hydrology: An ensemble of daily river flow and monthly groundwater levels for use for climate change impact assessment across Great Britain. Earth Syst. Sci. Data 2013, 5, 101–107. [Google Scholar] [CrossRef]
- Berezowski, T.; Szcześniak, M.; Kardel, I.; Michałowski, R.; Okruszko, T.; Mezghani, A.; Piniewski, M. CPLFD-GDPT5: High-resolution gridded daily precipitation and temperature data set for two largest Polish river basins. Earth Syst. Sci. Data 2016, 8, 127–139. [Google Scholar] [CrossRef]
- Berezowski, T.; Piniewski, M.; Szcześniak, M.; Kardel, I. CHASE-PL Forcing Data: Gridded Daily Precipitation & Temperature Dataset 5 km (CPLFD-GDPT5). 2015. Available online: https://doi.org/10.4121/uuid:e939aec0-bdd1-440f-bd1e-c49ff10d0a07 (accessed on 19 April 2017).
- Piniewski, M.; Szcześniak, M.; Kardel, I.; Berezowski, T. CHASE-PL—Natural Hydrology Dataset (CPL-NH). 2015. Available online: https://doi.org/10.4121/uuid:b8ab4f5f-f692-4c93-a910-2947aea28f42 (accessed on 19 April 2017).
- Piniewski, M.; Szcześniak, M.; Kardel, I.; Berezowski, T.; Okruszko, T.; Srinivasan, R.; Vikhamar-Schuler, D.; Kundzewicz, Z.W. Hydrological modelling of the Vistula and Odra river basins using SWAT. Hydrol. Sci. J. 2017. accepted. [Google Scholar]
- Mezghani, A.; Dobler, A.; Haugen, J. CHASE-PL Climate Projections: 5-km Gridded Daily Precipitation & Temperature Dataset (CPLCP-GDPT5). 2016. Available online: https://doi.org/10.4121/uuid:e940ec1a-71a0-449e-bbe3-29217f2ba31d (accessed on 19 April 2017).
- Piniewski, M.; Mezghani, A.; Szcześniak, M.; Kundzewicz, Z. Regional projections of temperature and precipitation changes: Robustness and uncertainty aspects. Meteorol. Z. 2017. [Google Scholar] [CrossRef]
- Arnold, J.G.; Srinivasan, R.; Muttiah, R.S.; Williams, J.R. Large area hydrologic modeling and assessment part I: Model development. J. Am. Water Resour. Assoc. 1998, 34, 73–89. [Google Scholar] [CrossRef]
- Ficklin, D.L.; Luo, Y.; Luedeling, E.; Zhang, M. Climate change sensitivity assessment of a highly agricultural watershed using {SWAT}. J. Hydrol. 2009, 374, 16–29. [Google Scholar] [CrossRef]
- Krysanova, V.; Srinivasan, R. Assessment of climate and land use change impacts with SWAT. Reg. Environ. Chang. 2015, 15, 431–434. [Google Scholar] [CrossRef]
- Marcinkowski, P.; Piniewski, M.; Kardel, I.; Gielczewski, M.; Okruszko, T. Modelling of discharge, nitrate and phosphate loads from the Reda catchment to the Puck Lagoon using SWAT. Ann. Warsaw Univ. Life Sci. SGGW Land Reclama. 2013, 45, 125–141. [Google Scholar] [CrossRef]
- Piniewski, M.; Okruszko, T. Multi-Site Calibration and Validation of the Hydrological Component of SWAT in a Large Lowland Catchment. In Modelling of Hydrological Processes in the Narew Catchment; Świątek, D., Okruszko, T., Eds.; Geoplanet: Earth and Planetary Sciences; Springer: Berlin/Heidelberg, Germany, 2011; pp. 15–41. [Google Scholar]
- Piniewski, M.; Szcześniak, M.; Huang, S.; Kundzewicz, Z. Projections of runoff in the Vistula and the Odra river basins with the help of the SWAT Model. Hydrol. Res. 2017. accepted. [Google Scholar]
- Piniewski, M.; Szcześniak, M.; Kundzewicz, Z.W.; Mezghani, A.; Hov, Ø. Changes in low and high flows in the Vistula and the Odra basins: model projections in the European-scale context. Hydrol. Processes 2017. accepted. [Google Scholar] [CrossRef]
- Piniewski, M.; Meresa, H.; Romanowicz, R.; Osuch, M.; Szcześniak, M.; Kardel, I.; Okruszko, T.; Mezghani, A.; Kundzewicz, Z. What can we learn from the projections of changes of flow patterns? Results from Polish case studies. Acta Geophys. 2017. under review. [Google Scholar]
- Neitsch, S.; Arnold, J.; Kiniry, J.; Williams, J. Soil and Water Assessment Tool Theoretical Documentation, Version 2009; Technical Report TR-406; Texas A&M University: College Station, TX, USA, 2011. [Google Scholar]
- Mathews, R.; Richter, B.D. Application of the Indicators of Hydrologic Alteration Software in Environmental Flow Setting1. JAWRA J. Am. Water Resour. Assoc. 2007, 43, 1400–1413. [Google Scholar] [CrossRef]
- Gupta, H.V.; Kling, H.; Yilmaz, K.K.; Martinez, G.F. Decomposition of the mean squared error and NSE performance criteria: Implications for improving hydrological modelling. J. Hydrol. 2009, 377, 80–91. [Google Scholar] [CrossRef]
- He, Y.; Bárdossy, A.; Zehe, E. A review of regionalisation for continuous streamflow simulation. Hydrol. Earth Syst. Sci. 2011, 15, 3539–3553. [Google Scholar] [CrossRef]
- Sellami, H.; La Jeunesse, I.; Benabdallah, S.; Baghdadi, N.; Vanclooster, M. Uncertainty analysis in model parameters regionalization: A case study involving the SWAT model in Mediterranean catchments (Southern France). Hydrol. Earth Syst. Sci. 2014, 18, 2393–2413. [Google Scholar] [CrossRef]
- Gudmundsson, L.; Bremnes, J.B.; Haugen, J.E.; Engen-Skaugen, T. Technical Note: Downscaling RCM precipitation to the station scale using statistical transformations – a comparison of methods. Hydrol. Earth Syst. Sci. 2012, 16, 3383–3390. [Google Scholar] [CrossRef]
- Wilby, R.L.; Dessai, S. Robust adaptation to climate change. Weather 2010, 65, 180–185. [Google Scholar] [CrossRef]
- Carter, T.; Hulme, M. Key Findings from the First ECLAT-2 workshop “Representing Uncertainties in Climate Change Scenarios and Impact Studies”. In ECLAT-2 Workshop Report No. 2; Cramer, W., Doherty, R., Hulme, M., Viner, D., Eds.; Climatic Research Unit, UEA: Norwich, UK, 2000; pp. 10–14. [Google Scholar]
- Teutschbein, C.; Seibert, J. Regional Climate Models for Hydrological Impact Studies at the Catchment Scale: A Review of Recent Modeling Strategies: Regional climate models for hydrological impact studies. Geogr. Compass 2010, 4, 834–860. [Google Scholar] [CrossRef]
- Strahler, A. Quantitative analysis of watershed geomorphology. Trans. Am. Geophys. Union 1957, 38, 913. [Google Scholar] [CrossRef]
Figure 1.
A matrix of hydrometeorological data sets released within the CHASE-PL project. The CPL-FH data set described in this paper is outlined in red. Arrows show logical connections between data sets.
Figure 1.
A matrix of hydrometeorological data sets released within the CHASE-PL project. The CPL-FH data set described in this paper is outlined in red. Arrows show logical connections between data sets.
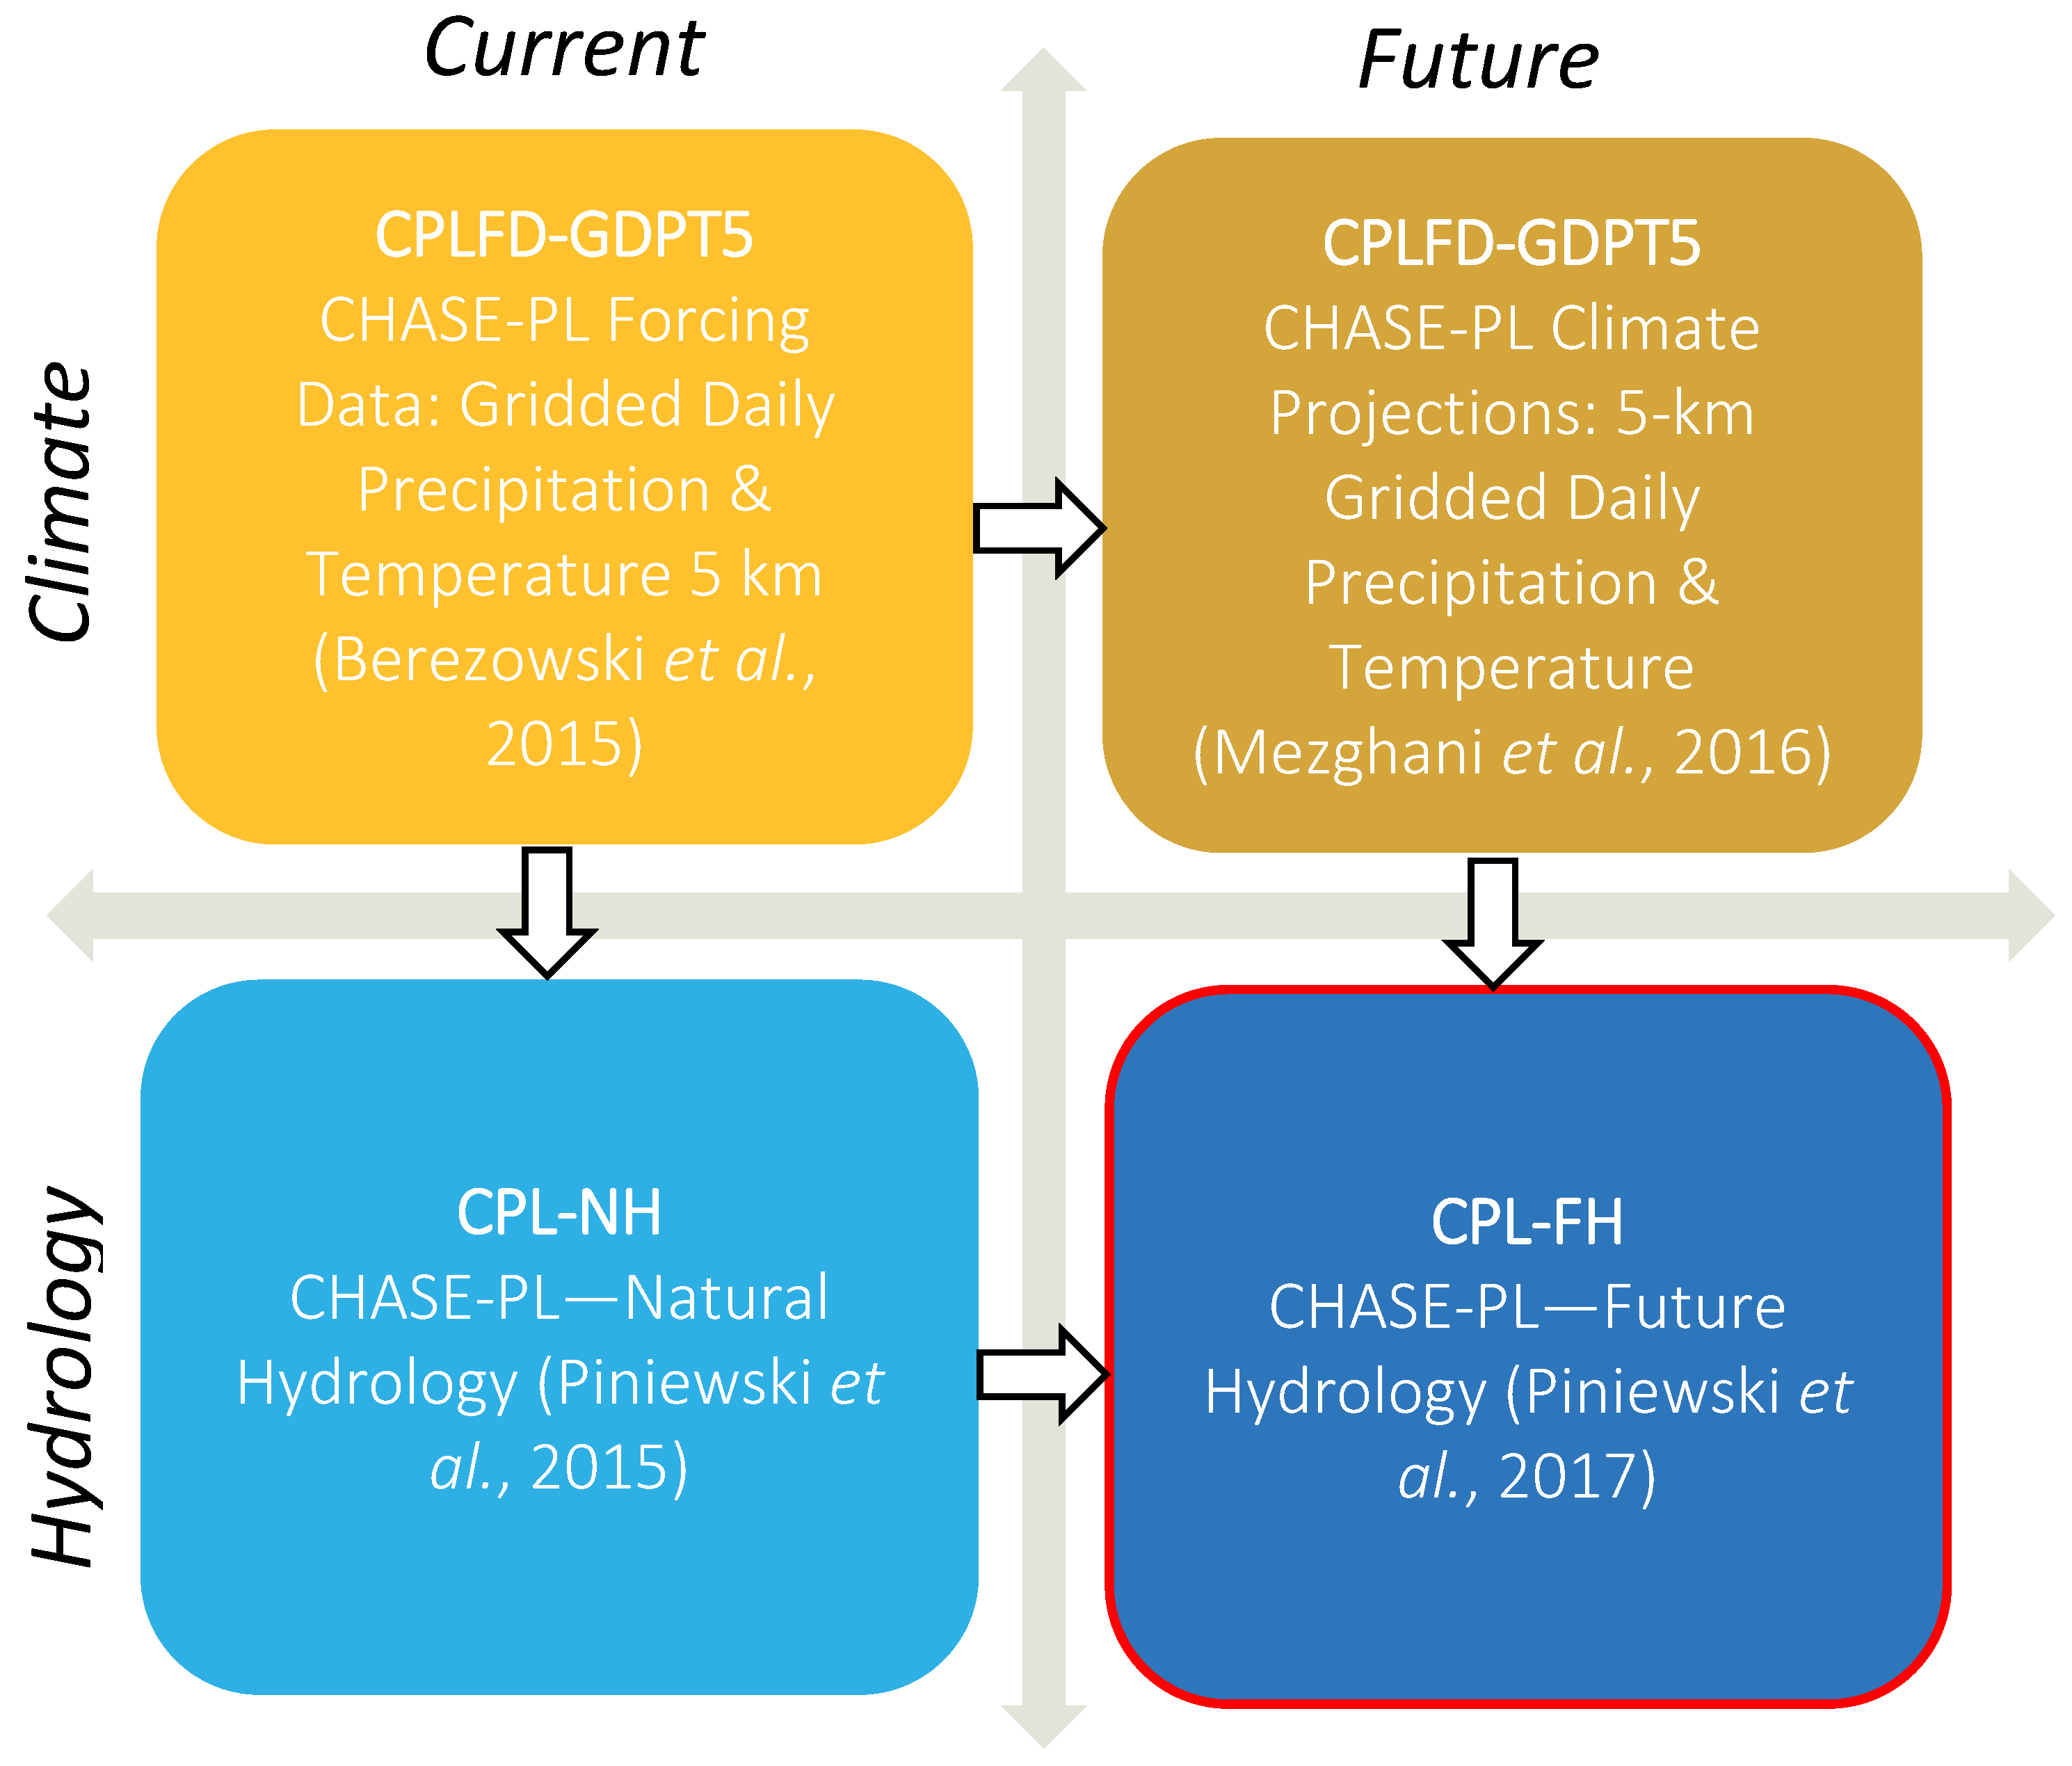
Figure 2.
Map of SWAT-subasins and reaches used in the setup of the Vistula and Odra basins model.


Table 1.
List of available GCM-run-RCM combinations composing the multi-model ensemble (MME). Each combination was available for the historical period (1971–2000) and two future periods (2021–2050 and 2071–2100) under two RCPs (4.5 and 8.5), which creates 45 different combinations. Spatial resolution of original RCM simulations was 0.11 degree (12.5 km). All original RCM simulations are published and distributed via the Earth System Grid Federation (ESGF).
| Code | GCM | RCM | Institute |
|---|---|---|---|
| 01 | CNRM-CERFACS-CNRM-CM5 | CLMcom-CCLM4-8-17 | CLMcom |
| 02 | CNRM-CERFACS-CNRM-CM5 | SMHI-RCA4 | SMHI |
| 03 | ICHEC-EC-EARTH | CLMcom-CCLM4-8-17 | CLMcom |
| 04 | ICHEC-EC-EARTH | SMHI-RCA4 | SMHI |
| 05 | ICHEC-EC-EARTH | KNMI-RACMO22E | KNMI |
| 06 | ICHEC-EC-EARTH | DMI-HIRHAM5 | DMI |
| 07 | IPSL-IPSL-CM5A-MR | SMHI-RCA4 | SMHI |
| 08 | MPI-M-MPI-ESM-LR | CLMcom-CCLM4-8-17 | CLMcom |
| 09 | MPI-M-MPI-ESM-LR | SMHI-RCA4 | SMHI |
Table 2.
List of SWAT output variables for each simulation run.
| Variable Code | Output File | Description | Units |
|---|---|---|---|
| PCP | .sub | Total amount of precipitation falling on the sub-basin during time step | mm |
| SNOM | .sub | Amount of snow or ice melting during time step (water-equivalent) | mm |
| PET | .sub | Potential evapotranspiration from the sub-basin during time step | mm |
| ET | .sub | Actual evapotranspiration from the subbasin during time step | mm |
| SW | .sub | Soil water content—amount of water in the soil profile at the end of the time period. | mm |
| PERC | .sub | Water that percolates past the root zone during the time step (mm). There is potentially a lag between the time the water leaves the bottom of the root zone and reaches the shallow aquifer. Over a long period of time, this variable should equal groundwater percolation. | mm |
| SURQ | .sub | Surface runoff contribution to streamflow during time step | mm |
| GWQ | .sub | Groundwater contribution to streamflow. Water from the shallow aquifer that returns to the reach during the time step | mm |
| WYLD | .sub | Water yield. The net amount of water that leaves the subbasin and contributes to streamflow in the reach during time step | mm |
| FLOW | .rch | Natural discharge of water in the reach | m s |
© 2017 by the authors. Licensee MDPI, Basel, Switzerland. This article is an open access article distributed under the terms and conditions of the Creative Commons Attribution (CC BY) license (http://creativecommons.org/licenses/by/4.0/).
Share and Cite
MDPI and ACS Style
Piniewski, M.; Szcześniak, M.; Kardel, I. CHASE-PL—Future Hydrology Data Set: Projections of Water Balance and Streamflow for the Vistula and Odra Basins, Poland. Data 2017, 2, 14. https://doi.org/10.3390/data2020014
AMA Style
Piniewski M, Szcześniak M, Kardel I. CHASE-PL—Future Hydrology Data Set: Projections of Water Balance and Streamflow for the Vistula and Odra Basins, Poland. Data. 2017; 2(2):14. https://doi.org/10.3390/data2020014
Chicago/Turabian StylePiniewski, Mikołaj, Mateusz Szcześniak, and Ignacy Kardel. 2017. "CHASE-PL—Future Hydrology Data Set: Projections of Water Balance and Streamflow for the Vistula and Odra Basins, Poland" Data 2, no. 2: 14. https://doi.org/10.3390/data2020014