Investigating How the Disclosure of Production Methods Influences Consumers’ Sensory Perceptions of Sparkling Wines


School of Nutrition and Dietetics, Acadia University, Wolfville, NS B4P 2R6, Canada
*
Author to whom correspondence should be addressed.
Beverages 2020, 6(4), 66; https://doi.org/10.3390/beverages6040066
Submission received: 17 September 2020
/
Revised: 1 November 2020
/
Accepted: 18 November 2020
/
Published: 20 November 2020
(This article belongs to the Special Issue Improving Wine Quality and Safety)
Abstract
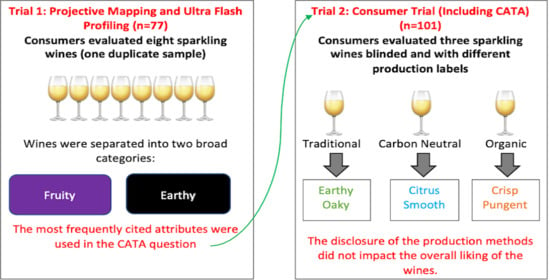
:The primary objective was to identify how the disclosure of production methods, including sustainable practices, would impact consumers’ sensory perceptions. The secondary objective was to identify the attributes consumers use to describe Nova Scotia (NS) sparkling wines. The first trial used projective mapping (PM) and ultra-flash profiling (UFP) to describe eight sparkling wines (n = 77). In the second trial, a check-all-that-apply (CATA) questionnaire and 9-point hedonic scales were used (n = 101). Three sparkling wines, from the previous trial, were evaluated blinded and with a production claim. The first trial found that consumers separated the wines based on their fruit- or earth-like attributes. In the CATA trial, desirable attributes, such as sweet and smooth, were used more frequently to describe the wines with sustainable production methods. No significant differences were found in the overall liking scores after the disclosure of the production methods (α = 0.05). These findings indicate that disclosure of production methods did not impact participants’ sensory perceptions of sparkling wine. In addition, an evaluation among different generations should be considered, as millennials have been found to hold sustainable practices to greater value.
1. Introduction
In recent years, consumers have been increasing demand for the application of more environmentally friendly practices in many different industries, including wine [1,2]. Viticulture has been criticized for environmental costs related to soil erosion, pollution of water and air, pesticide drift and chemical residues, and negative impacts on biodiversity [3,4]. The various steps of wine production all contribute to resource depletion and environmental emission, as the cultivation of grapes, the winemaking process, the fabrication of bottles, the bottling of wine, the transportation for sales, refrigeration, and disposal of bottles all require various materials and energy [5]. Thus far, improvements in wine production’s environmental aspects have been centred around energy and water efficiency, pesticide reduction, soil conservation, and solid waste management [4,6].
A review of consumers’ willingness-to-pay for wine with sustainability characteristics found that sustainability cues were often perceived as quality indicators, with organic and environmental sustainability being the leading indicators [7,8]. According to a study, more than 80% of consumers are willing to pay extra to support the use of these practices [2,9]. Those who are willing to pay more and purchase organic wine are more concerned about the health benefits of a product, are more environmentally conscious, and desire more information about the products they are purchasing [10,11]. Not only do the consumers advocate for these changes through purchasing actions, but these values are often reflected in the perceived quality of the wine in a way that is in line with their expectations and beliefs [12,13]. Furthermore, a study analyzing ten case studies in Italy found that a reduced carbon footprint and subsequent claims about the wine and vineyard can lead to competitive advantages including customers’ loyalty and entrance into foreign markets [14]. Additionally, adoption of environmental practices and sustainable social practices had added value to sparkling wines [15]. On the other hand, a study completed on the attitudes of consumers on organic wines found they expected organic wines to be more expensive, trendy, have a distinctive taste, and not be ideal for dinner with family and friends [16]. Only half of the consumers express belief that sustainable techniques will change the quality of wine or their perceptions of it [9]. However, not many studies have investigated if these sustainable production claims affect consumers’ sensory perceptions of the wine.
Firstly, projective mapping (PM) and ultra-flash profiling (UFP) will determine the attributes consumers used to describe Nova Scotia (NS) sparkling wines. Nova Scotia, Canada, is a relatively new wine-producing region, and to benefit the industry, this research will identify the attributes consumers use to classify the province’s sparkling wine varieties and consumers’ perceived attributes. PM is a cost and time-efficient method, where participants are instructed to position varying samples on a two-dimensional plane, distancing samples in a way that reflects their similarities or differences [17]. Thus, if the participant perceived two samples as being similar, they would be positioned closer together on the two-dimensional plane. Ultra-flash profiling is commonly used alongside projective mapping. This method can provide participants with a list of characteristics. For each of the samples evaluated, participants are asked to supply descriptors that they perceive to be related to the given sample. This information provides further explanation as to why a participant finds samples similar or dissimilar [18]. The most frequently used attributes in the PM and UFP trial will then be included in a check-all-that-apply (CATA) questionnaire.
Nine-point hedonic scales and a CATA question will be used to determine if consumers’ sensory evaluations of sparkling wine change when they are labelled as produced following different production methods (organic, carbon-neutral, traditional). CATA is a method that has been used successfully to evaluate the impact of information disclosure on sensory perceptions of foods [19]. It has been effectively used in characterizing a wide variety of foods, including alcoholic beverages and wine, despite their complexity [20,21,22,23]. CATA is a method that provides a list of terms to participants, who are then instructed to select the descriptors that they perceive are associated with the given sample [23].
In this context, this study’s first objective is to use projective mapping and ultra-flash profiling to describe NS sparkling wines. The second objective is to investigate the influence production methods have on consumer sensory perception and liking of NS sparkling wines. Participants will be asked to evaluate sparkling wines blinded and then accompanied by sustainability claims using an acceptance test and a CATA questionnaire.
2. Materials and Methods
2.1. Samples and Sample Presentation
In the PM and UFP task, seven different NS sparkling wines were evaluated. These wines are a representative sample of sparkling wines produced in NS. All wines are available across the province and were randomly selected to be involved in the study. One sample was presented twice (W3), as it is recommended to evaluate consistency [24], so each participant received eight wine samples. In the consumer acceptability trial, three of the wines (W2, W3, W5) in the PM/UFP trial were selected to be included. The wines’ alcohol content varied from 10.5–12.0%, with the majority being around 11%. The predominant closure was a cork, with one being a screw top. Descriptive details of the wine samples are listed in Table 1. For all sensory trials, samples were prepared and presented following the same procedure. Each wine’s sample size was 30 mL, and the samples were presented in a small, clear standard ISO wine glass. All wine bottles were stored in the fridge (4 °C) until 10 min before testing began, when they were removed from the fridge. The wines were opened slowly, with the cork held by the researcher’s hand and without shaking the bottle, as suggested by Gallart et al. [25]. The one sample with a screw top closure was opened slowly and without shaking, as well. The wine samples were then immediately served to the participants. For the PM and UFP trial, the eight samples were all labelled with random three-digit codes identified on the glass and a placemat. Each sample was then situated on a placemat on a white tray following a balanced presentation order, on top of their designated 3-digit code. For the consumer acceptability trial, each wine was presented one at a time in a balanced order and was labelled with different random three-digit codes on the wine glass and a placemat. In both trials, each participant was also provided with a glass of filtered water to cleanse their palates.
2.2. Testing Environment
All testing was completed at the Centre for the Sensory Research of Food at Acadia University, using individual sensory booths on computers using Compusense Cloud software (Guelph, ON, Canada). The trials took place in the booths under white fluorescent light, at a temperature of 25 °C, and in a ventilated area.
2.3. Participants
Approval for the study (both trials) was received from the Acadia University Research Ethics Board (REB 18–22). Participants were recruited from Annapolis Valley, Nova Scotia community and were recruited using posted advertisements and word of mouth. All participants were 19 years of age or older, as this is the legal drinking age in the province of Nova Scotia, Canada, and did not work in the wine industry. All participants (Table 2) had consumed wine in the last two weeks and were screened to ensure they regularly bought and consumed wine (2–3 times a month). The participants’ demographics are presented in Table 2. Seventy-seven participants completed the PM and UFP trial, and 101 participants completed the consumer acceptability trial. Participants were screened to ensure they only participated in one trial.
2.4. Projective Mapping and Ultra-Flash Profiling
The evaluation of the eight NS sparkling wines (seven different wines and one replicate sample) was completed using Compusense Cloud software (Guelph, ON, Canada). The moderator demonstrated the procedure for the participants by placing sandwich cookie samples on the screen created by the Compusense Cloud software. Participants were directed to taste a sample and then to place the sample on the computer screen. Participants were instructed to place wines that they thought were similar close together, and those they perceived to be different were to be placed further apart [17]. The participants were also asked to complete a UFP task and provide descriptive words for each sample [26,27]. The participants were informed that these words or attributes could include the appearance, aroma, taste, and mouthfeel of the wine. Participants were encouraged to take as many sniffs or sips as necessary to assess the wine. Participants were allowed to drink the samples in any order they wished and were asked to wait 30 s between samples. In between evaluating samples, participants were instructed to take a drink of distilled water. When the participants had completed the task, they were asked various questions about their wine consumption habits and demographics (Table 2).
2.5. Consumer Acceptability Trial
Three NS sparkling wines (W2, W3, and W5) from the previous trial were selected to be evaluated based on discussions with professionals in the NS wine industry. The wine professionals were asked to choose the three sparkling wines that best represented the cross-section of the sparkling wines produced in NS. Initially, each wine was evaluated blinded (without the production method identified). Participants (n = 101) were asked to rate their overall liking and liking of each sample’s appearance, flavour, and mouthfeel using a 9-point hedonic scale (1 = Dislike Extremely to 9 = Like Extremely). Participants were then asked to complete a CATA questionnaire. The descriptors included in the CATA questionnaire were the most frequently used descriptors in the PM and UFP trial (sweet, sour, watery, strong, bitter, dry, citrus, astringent, crisp, apples, pungent, pear, strong aftertaste, earthy, floral, berry, smooth, oak, wood, carbonated, burnt, vanilla, peach, and mineral). In order to account for possible CATA attributes order bias, terms were randomized [28]. The participants were instructed to check or click all of the attributes they felt described the wine sample. After they evaluated all three wine samples blinded, they then completed a questionnaire about sustainability and food shopping habits (1 = Strongly Disagree to 7 = Strongly Agree; Table 3) adopted from Stranieri, Ricci, and Banterle [29]. After completing the questionnaire, participants were then asked to evaluate the same three wines accompanied by a fabricated production claim: 1. “This wine is produced following traditional methods”, 2. “This wine has a carbon-neutral label indicating that all greenhouse gases released during wine production, packaging and delivery have been reduced to zero”, and 3. “This wine is certified organic”. The wines were randomly matched with their respective production claim. The production claim was presented to the participant simultaneously with the wine sample. Once again, the wine samples (different random 3-digit codes and different order of presentation) were evaluated using the 9-point structured hedonic scales and a CATA questionnaire, as described above. The participants finished the trial by completing wine consumption habits and demographic questions (Table 2).
2.6. Statistical Analysis
2.6.1. Projective Mapping and Ultra–Flash Profiling
All of the coordinates (x and y coordinates, the bottom left corner of the map was considered the origin) from the PM task were collected by the Compusense Cloud software and as well as the descriptors used in the UFP task. Frequency counts were completed for each descriptor. If a participant expressed an attribute intensity, each intensity was considered a separate attribute (e.g., carbonated, low carbonation, very carbonated would be considered to be separate attributes). Multiple factor analysis (MFA) was used to analyze the results. In this study, the samples’ position by the participants resulted in two variables, x and y coordinates (PM), and the descriptors used in the UFP task were added as supplementary data. Only descriptors identified by the participants four or more times were included in the analysis [30].
2.6.2. Consumer Acceptability Trial
A two-way ANOVA using a general linear model was completed on the results of the 9-point hedonic scales. The fixed effects were information (blinded vs. with production claims), treatment (3 wine samples), and their interactions. The ANOVA was followed by Tukey’s honestly significant difference (HSD) test. The frequency of attributes identified by participants in the CATA task for each wine was summed. A contingency table was used to summarize the frequency choice of each descriptor across all of the participants. Cochran’s Q test was used to establish the difference between the different treatments’ frequencies for each descriptor. If there was a significant difference among the attributes, then post-hoc multiple pairwise comparisons were conducted using McNemar’s test with Bonferroni alpha adjustment. A penalty lift analysis was carried out following the procedure by Meyners, Castura, and Carr [31] on both the blinded sparkling wines and the wines accompanied by the production claims. In the penalty lift analysis, liking is averaged across all observations in which the attribute under consideration was used to describe the product and across the observations in which the participants did not select it. The difference between these two mean values provides an estimate of the average change in liking due to the selected attribute [31]. All analysis was completed using XLSTAT software (Version 2019.1, New York, NY, USA) in Microsoft ExcelTM.
3. Results
3.1. Projective Mapping and Ultra–Flash Profiling
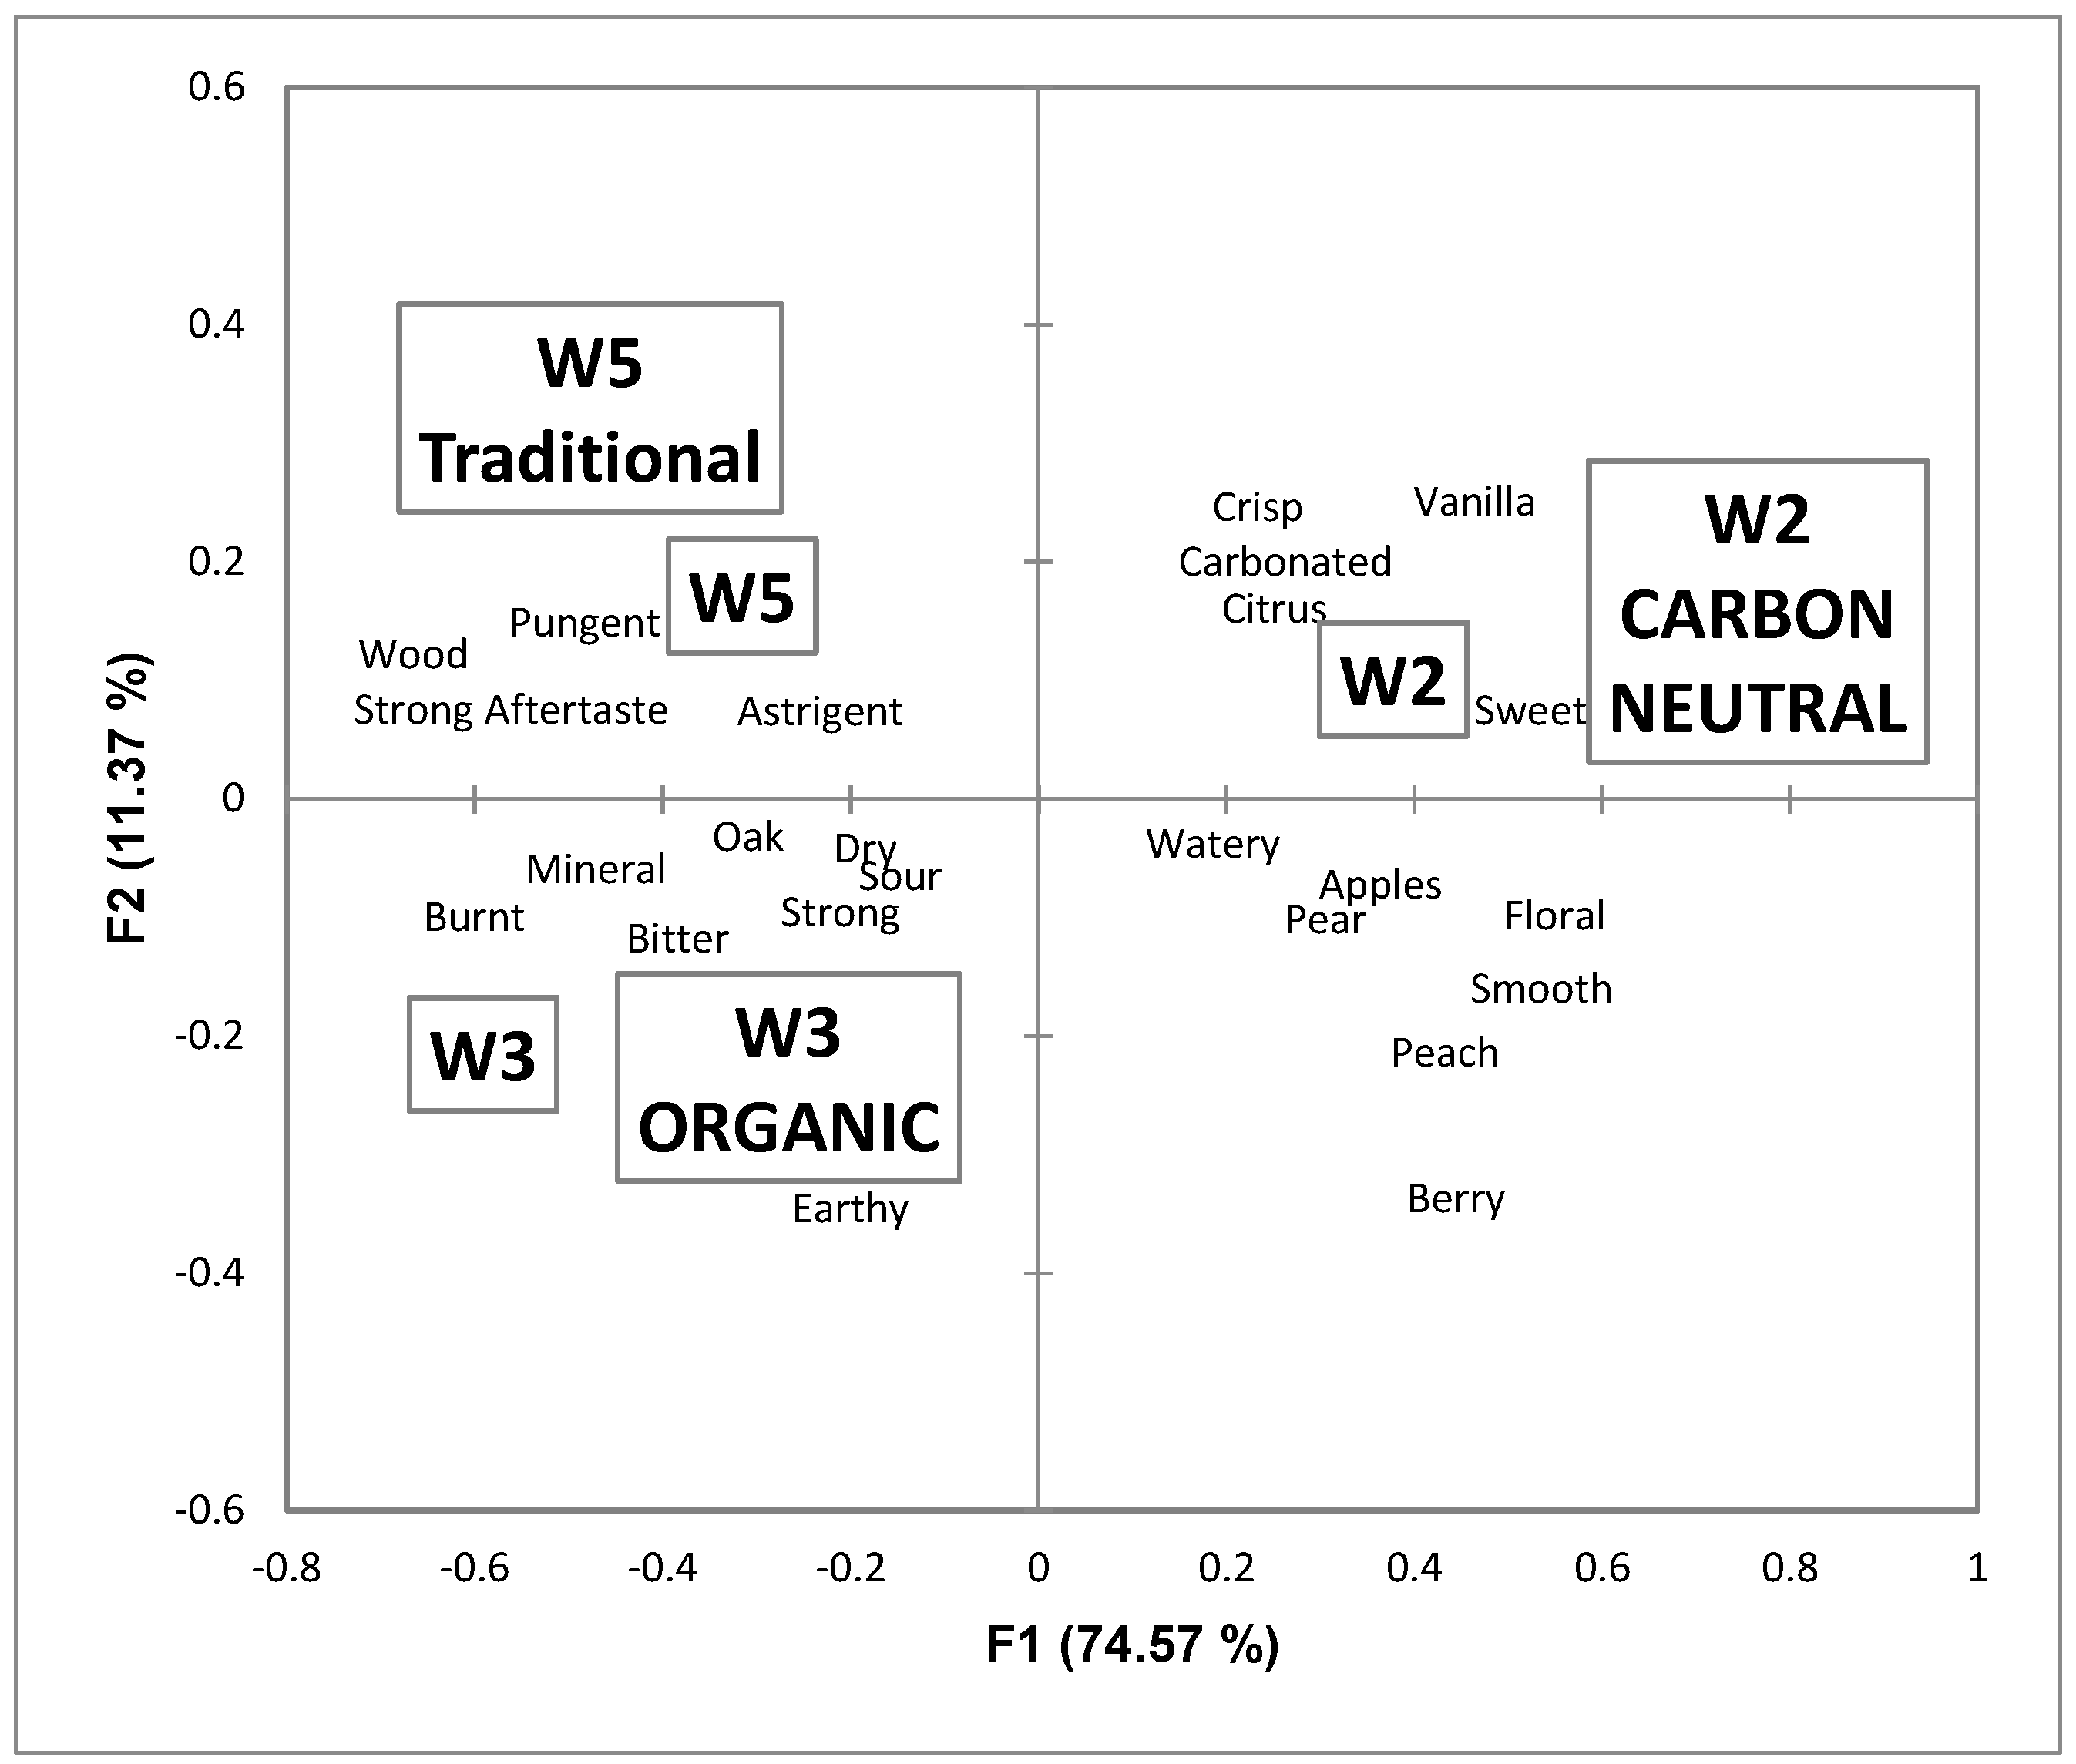
In Figure 1, the projective mapping task results are displayed, and 53.2% of the variation was explained. The participants identified 47 words to describe the sparkling wines, but only those used more four or more times were included in the analysis. W3.1 and W3.2, replicates of the same wine, were grouped and associated with the second dimension’s positive side. The proximity of the replicates reflects consumers’ ability to distinguish wines accurately through the projective mapping method. The positive side of the first dimension was associated with the attributes watery, strong, pungent, vanilla, burnt, oak, and bitter, as well as W4 and W7. The negative side of the first dimension was associated with the attributes smooth, pear, and carbonated. W5 and W1 were associated with these attributes (Figure 1).
As for the second dimension, the positive side was correlated with the attributes dry, astringent, strong aftertaste, and sour. The negative side was associated with the attributes sweet, apples, wood, carbonated, and berry. W7 and W3 (W3.1 and W3.2) were located on the positive side of the second dimension. W6, W4, and W2 were positioned on the negative side of this dimension. Although the same wine replicates were grouped, some opposing descriptors were placed closely together on the MFA plot (Figure 1). On the positive side of the first dimension, watery and strong are placed close together; however, without knowing if the descriptors were describing the appearance, mouthfeel, aroma, or taste of the wine, it is hard for the researchers to conclude if these descriptors conflict. Future studies using PM and UFP to describe wine samples may want to ask the participants to define the terms they use to define the wine samples or ask participants to identify which aspect of the wine (appearance, mouthfeel, aroma, or taste) they are describing. This result also indicated a limitation of the UFP task, as consumers used opposing terms to describe the wine samples.
3.2. Consumer Acceptability Trial
Table 4 demonstrated the results of a two-way ANOVA of the consumers’ mean liking scores. The participants’ liking of the wine’s appearance was not significantly different for any of the wine samples presented with or without its corresponding production claim. When the wine samples were evaluated, blinded, on the participants’ liking of the flavour, their overall liking of W2 was significantly different from W3 and W5. This result remains true when the wines were presented with the production claims, as W2, with its corresponding production claim, was liked significantly more than W3 and W5 when presented with production claims. W2′s mouthfeel was liked significantly more than the other wines, except for W3, when it was labelled as organic. When comparing the wines presented blinded and with their corresponding production claim, no significant differences were found in the liking of the flavour, appearance, texture, or overall liking of wine after production methods were disclosed (α = 0.05). This result was consistent for all three of the production statements, “this wine has a carbon-neutral label”; “this wine is certified organic”; and “this wine is produced following traditional methods”. This result indicates that the disclosure of production methods did not impact the perceptions of sparkling wines.
This correspondence analysis, based on the CATA results, seen in Figure 2, found that each wine is paired near their correct blinded counterpart. The penalty analysis paired CATA findings with the acceptability scores for each of the wines, both before and after production methods were revealed. This analysis provided information on the attributes that drive consumer liking, as seen in Figure 3. The analysis displayed that fruit-related attributes, including crisp, sweet, apples, and citrus, drove consumers’ liking of sparkling wine regardless of the production methods. Attributes that were contrary to fruit flavours significantly drove consumer’s dislike of sparkling wine (regardless of the disclosure of production methods). These characteristics included strong aftertaste, bitter, sour, strong, and dry.
Although the varying production disclosures did not impact the overall liking of wines, the frequency of the descriptors of wine used did change. The CATA frequency results, seen in Table 5 and evaluated using post-hoc multiple pairwise comparisons (McNemar’s test with Bonferroni alpha adjustment), did identify some changes in the participants’ perceptions when the labels were presented. Once the production claim, carbon-neutral, was presented with W2, citrus and smooth were chosen more frequently, whereas bitter was used less frequently (Table 5). Similarly, when W3 was presented with a certified organic label, the attributes crisp, carbonated, and pungent were chosen more frequently. Lastly, when W5 was presented with the traditional methods label and participants more frequently used earthy and oaky to describe the wine, than when they had evaluated the wine blinded. The presentation of the production claim did not significantly change the participants’ overall liking of the sparkling wine, but it did change the attributes they chose to describe the wine.
4. Discussion
The purpose of the PM and UFP was to identify the descriptors consumers use to describe NS sparkling wines, which could then be included in the CATA questionnaire. Nevertheless, some conclusions can be made based on the PM and UFP task. The wines were separated into wines that contained fruity attributes (peach, pear, sweet, berry, citrus) or earthy attributes (earthy, floral, bitter, strong, burnt, oak, wood). Previous studies on the sensory aspects of sparkling wines have found that fruit-related attributes are often perceived [32,33,34]. Although earthy attributes are not as commonly used as descriptors, mushroom/earthy characterization has been used before as reference for some sparkling wines [33]. Another similar categorization previously used would be vegetative–herbaceous [34].
The study’s primary objective was to identify how the disclosure of production methods, including sustainable practices, would impact consumers’ sensory perceptions, using 9-point hedonic scales and a CATA questionnaire. The disclosure of the production methods did not lead to a change in the participants’ liking of appearance, flavour, or mouthfeel, and no significant differences were found in the overall liking of wine (α = 0.05). Although the disclosure of production methods may not impact participants’ overall liking of wine, there may still be a link between these practices and consumers’ choice of wines. Olsen et al. [35] found a correlation between environmental values and the purchasing action of organic wines. However, the participants in the study by Olsen et al. [35] did not associate organic wine with enjoyment, but they did hypothesize that consumers are willing to make self-sacrifices and pay a premium price to support more sustainable practices. Although the demand for sustainability has increased, more recent studies show that the growing societal demand for ethical consumption has not yet become essential for wine consumers [13]. These studies support that as of right now, the sustainability of wines is currently not an area where wine marketing researchers should focus. Currently, only a small segment of the population is willing to sacrifice quality for a wine produced using sustainable practices, and those consumers show a preference for purchasing organic wine [36].
Building on the PM and UFP task results, the penalty analysis of the overall liking scores and CATA attributes determined that fruit-related attributes (crisp, sweet, apples, and citrus) drove consumers’ liking of sparkling wine regardless of the production methods. Attributes that were contrary to fruit flavours significantly drove participants’ disliking of sparkling wine. McMahon et al. [37] found that consumers prefer fruity, floral, and sweet taste in sparkling wines. However, McMahon et al. [37] also identified that some consumers prefer sparkling wines lacking in green flavours, yeasty flavours, sourness, and bitterness. It would seem that the majority of participants in the present study prefer sweet and fruity sparkling wines. Past studies on white wines [38,39] have indicated that consumers can be segmented based on sweetness, which could be applied to sparkling wines.
Looking further into the results of the CATA task (Table 5), changes in the frequency of the chosen attributes by the participants can be seen. For W2, when the carbon-neutral label was presented, the participants more frequently chose the citrus and smooth attributes, whereas the bitter attribute was chosen less frequently. The participants demonstrated an increase in the use of more appealing attributes, based on the penalty analysis (citrus and smooth), and a decrease in the unappealing attribute, bitterness, used to describe wines labelled as carbon neutral. This result agrees with past findings where consumers’ perceived quality attributes align with their expectations and beliefs [12,13]. Thus, if someone holds a strong belief in reducing carbon footprints, they may perceive the wine as having more pleasurable attributes; however, the overall liking scores were not significantly different.
The wine labelled as certified organic, the attributes crisp, carbonated, and pungent were used more frequently by the participants than when the wine was evaluated blinded. In previous studies, when a product is organic, the consumer often views it as higher quality [7,8]. This rationale would explain the increased use of crisp and carbonated words, which are associated with an increased liking of wine. Organic wine has also previously been classified by consumers as having a distinctive taste [14], which may explain the more frequent use of the pungent attribute (Table 5). When W5 was paired with the traditional methods claim, it was described as earthy and oaky. The earthy and oaky characteristics can be understood from consumers’ association of traditional methods and wine’s ageing in oak barrels. Although sparkling wines are usually fermented in glass bottles or stainless-steel tanks [40], the participants may associate traditional methods with oak barrels. In past studies, consumers did associate the traditional methods with wines aged in barrels; however, these studies investigated still wines (red and white wines) [41,42]. The majority of participants (73%) self-identified as having limited or no knowledge about wine (Table 2), and although sparkling wines are not usually produced using barrels, they may have still associated traditional methods with barrels. As such, this association may create an expectancy of more wood and earth-related flavours in the wine [43].
Participants’ responses to the shopping and sustainability habits questionnaire demonstrated that the presence of organic and sustainability logos was the lowest priority of the provided statements ranking only 4.3 and 4.4 on the 7-point Likert scale, as seen in Table 3. It was recycling of packaging and bottles that came as their priority, ranking 6.8 and 6.7. Therefore, the participants may prefer products to be sustainable but may not value it enough to impact their sensory perceptions or wine choices. Over half of the participants expressed that they do not usually spend more than CAD 20.99 on a bottle of wine (Table 2). The unwillingness to pay more than CAD 20.99 on a bottle of wine may be a limitation to the study; as both the sparkling varieties and sustainable production methods of wine increase the cost of a bottle, the participants in this study may not go through with the purchasing of such wine. Additionally, 80% of participants identified themselves as either interested or highly interested in wine (Table 2). However, about 70% consider themselves to have either none or limited knowledge of wine. The lack of knowledge surrounding wine, and thus production, may mean that the participants may not fully understand the benefits that come with each of the methods and impact their perception of the wine. In a study by Ginon et al. [44], it was found that a lack of education surrounding sustainability resulted in substantial differences in how consumers perceived labels.
It has been consistently shown that millennials, Gen Y (aged 25–39), are more educated on and concerned with environmental influences. The demand for sustainable practices and products is coming primarily from this demographic [45]. Studies have found that the average young consumers and their environmentally friendly attitude increase their willingness to pay higher prices for wines produced using sustainable methods [46]. The majority of participants, over 60%, were older than Gen Y in the consumer acceptability trial. If Gen Y was focused on, with a reasonably sized sample, a more accurate representation of potential changes in wines’ sensory perceptions could have been revealed. The greater value that they hold for sustainability may be more likely to influence one’s liking of wine significantly.
5. Conclusions
There were two objectives of this study. Firstly, to use PM and UFP to describe NS sparkling wines. The second objective is to investigate the influence production methods have on consumer sensory perception and liking of NS sparkling wines using CATA and hedonic scales. The PM and UFP identified two categories of descriptors, fruit- and earth-like attributes, to describe NS sparkling wines. In the second trial, no significant differences were found in consumers’ overall liking of sparkling wines after disclosing production methods (α = 0.05). A limited number of samples and production claims were evaluated in this study, and a future study should use a cross-over design (each wine evaluated with each production claim). Additionally, this study did not consider one’s purchasing actions; it would be useful to perform this study while investigating one’s willingness to purchase these wines. Conducting a study like this would provide more accurate information on consumers’ realistic behaviours and the demand for sustainably produced wine. Overall, this study’s findings are relevant to the wine industry and winemakers. It provides more information on the disclosure of production methods and how it may impact consumers’ perceptions of wine. It also provides context for those in marketing positions to more effectively resonate with their target consumer demographic.
Author Contributions
Conceptualization L.H., A.B., and M.B.M.; methodology, M.B.M.; software, M.B.M.; validation, L.H., A.B., and M.B.M.; formal analysis, L.H., A.B., and M.B.M.; investigation, L.H., A.B., and M.B.M.; resources, M.B.M.; data curation, L.H., A.B., and M.B.M.; writing—original draft preparation, L.H. and A.B.; writing—review and editing, M.B.M.; visualization, M.B.M.; supervision, M.B.M.; project administration, M.B.M.; funding acquisition, M.B.M. All authors have read and agreed to the published version of the manuscript.
Funding
This research was funded by Nova Scotia Department of Agriculture and the Centre for the Sensory Research of Food.
Acknowledgments
Thank you to all the volunteers who participated in this project.
Conflicts of Interest
The authors declare no conflict of interest.
References
- Gabzdylova, B.; Raffensperger, J.F.; Castka, P. Sustainability in the New Zealand wine industry: Drivers, stakeholders and practices. J. Clean. Prod. 2009, 17, 992–998. [Google Scholar] [CrossRef]
- D’Amico, M.; Di Vita, G.; Monaco, L. Exploring environmental consciousness and consumer preferences for organic wines without sulfites. J. Clean. Prod. 2016, 120, 64–71. [Google Scholar] [CrossRef]
- Ellison, K. The science of sustainable wine. Front. Ecol. Environ. 2008, 6, 56. [Google Scholar] [CrossRef] [Green Version]
- Mariani, A.; Vastola, A. Sustainable winegrowing: Current perspectives. Int. J. Wine Res. 2015, 7, 37–48. [Google Scholar] [CrossRef] [Green Version]
- Point, E.; Tyedmers, P.; Naugler, C. Life cycle environmental impacts of wine production and consumption in Nova Scotia, Canada. J. Clean. Prod. 2012, 27, 11–20. [Google Scholar] [CrossRef]
- Insight Environmental Consulting Ltd. Sustainable Practices for BC Vineyards. Available online: https://bcwgc.org/sites/default/files/Sustainable%20Practices_Vineyards_Guidebook_Condensed_February%202016.pdf (accessed on 14 September 2020).
- Barber, N.; Taylor, C.; Strick, S. Wine consumers’ environmental knowledge and attitudes: Influence on willingness to purchase. Int. J. Wine Res. 2009, 1, 59–72. [Google Scholar] [CrossRef] [Green Version]
- Schäufele, I.; Hamm, U. Consumers’ perceptions, preferences and willingness-to-pay for wine with sustainability characteristics: A review. J. Clean. Prod. 2017, 147, 379–394. [Google Scholar] [CrossRef]
- Forbes, S.L.; Cohen, D.A.; Cullen, R.; Wratten, S.D.; Fountain, J. Consumer attitudes regarding environmentally sustainable wine: An exploratory study of the New Zealand marketplace. J. Clean. Prod. 2009, 17, 1195–1199. [Google Scholar] [CrossRef] [Green Version]
- Fotopoulos, C.; Krystallis, A.; Ness, M. Wine produced by organic grapes in Greece: Using means—End chains analysis to reveal organic buyers’ purchasing motives in comparison to the non-buyers. Food Qual. Prefer. 2003, 14, 549–566. [Google Scholar] [CrossRef]
- Galati, A.; Schifani, G.; Crescimanno, M.; Migliore, G. “Natural wine” consumers and interest in label information: An analysis of willingness to pay in a new Italian wine market segment. J. Clean. Prod. 2019, 227, 405–413. [Google Scholar] [CrossRef]
- Fernqvist, F.; Ekelund, L. Credence and the effect on consumer liking of food—A review. Food Qual. Prefer. 2014, 32, 340–353. [Google Scholar] [CrossRef] [Green Version]
- Risius, A.; Klann, B.-O.; Meyerding, S.G.H. Choosing a lifestyle? Reflection of consumer extrinsic product preferences and views on important (extrinsic) wine characteristics in Germany. Wine Econ. Policy 2019, 10, 141–154. [Google Scholar] [CrossRef]
- Galletto, L.; Barisan, L. Carbon Footprint as a Lever for Sustained Competitive Strategy in Developing a Smart Oenology: Evidence from an Exploratory Study in Italy. Sustainability 2019, 11, 1483. [Google Scholar] [CrossRef] [Green Version]
- Barisan, L.; Lucchetta, M.; Bolzonella, C.; Boatto, V. How Does Carbon Footprint Create Shared Values in the Wine Industry? Empirical Evidence from Prosecco Superiore PDO’s Wine District. Sustainability 2019, 11, 3037. [Google Scholar] [CrossRef] [Green Version]
- Sirieix, L.; Remaud, H. Consumer Perceptions of Eco-Friendly vs. Conventional Wines in Australia. In Proceedings of the 5th International Academy of WIne Business Research Conference, Auckland, New Zealand, 8–10 February 2010; Available online: http://academyofwinebusiness.com/wp-content/uploads/2010/04/SirieixRemaud-Consumer-perceptions-of-eco-friendly-wines.pdf (accessed on 20 November 2020).
- Risvik, E.; McEwan, J.A.; Colwill, J.S.; Rogers, R.; Lyon, D.H. Projective mapping: A tool for sensory analysis and consumer research. Food Qual. Prefer. 1994, 5, 263–269. [Google Scholar] [CrossRef]
- Santos, B.A.; Pollonio, M.A.R.; Cruz, A.G.; Messias, V.C.; Monteiro, R.A.; Oliveira, T.L.C.; Faria, J.A.F.; Freitas, M.Q.; Bolini, H.M.A. Ultra-flash profile and projective mapping for describing sensory attributes of prebiotic mortadellas. Food Res. Int. 2013, 54, 1705–1711. [Google Scholar] [CrossRef]
- Grasso, S.; Monahan, F.J.; Hutchings, S.C.; Brunton, N.P. The effect of health claim information disclosure on the sensory characteristics of plant sterol-enriched turkey as assessed using the Check-All-That-Apply (CATA) methodology. Food Qual. Prefer. 2017, 57, 69–78. [Google Scholar] [CrossRef]
- Giacalone, D.; Bredie, W.L.P.; Frøst, M.B. “All-In-One Test” (AI1): A rapid and easily applicable approach to consumer product testing. Food Qual. Prefer. 2013, 27, 108–119. [Google Scholar] [CrossRef]
- Schumaker, M.R.; Diako, C.; Castura, J.C.; Edwards, C.G.; Ross, C.F. Influence of wine composition on consumer perception and acceptance of Brettanomyces metabolites using temporal check-all-that-apply methodology. Food Res. Int. 2019, 116, 963–972. [Google Scholar] [CrossRef]
- Vidal, L.; Giménez, A.; Medina, K.; Boido, E.; Ares, G. How do consumers describe wine astringency? Food Res. Int. 2015, 78, 321–326. [Google Scholar] [CrossRef]
- JJaeger, S.R.; Beresford, M.K.; Paisley, A.G.; Antúnez, L.; Vidal, L.; Cadena, R.S.; Giménez, A.; Ares, G. Check-all-that-apply (CATA) questions for sensory product characterization by consumers: Investigations into the number of terms used in CATA questions. Food Qual. Prefer. 2015, 42, 154–164. [Google Scholar] [CrossRef]
- Nestrud, M.A.; Lawless, H.T. Perceptual Mapping of Apples and Cheeses Using Projective Mapping and Sorting. J. Sens. Stud. 2010, 25, 390–405. [Google Scholar] [CrossRef]
- Gallart, M.; Tomás, X.; Suberbiola, G.; López-Tamames, E.; Buxaderas, S. Relationship between foam parameters obtained by the gas-sparging method and sensory evaluation of sparkling wines. J. Sci. Food Agric. 2004, 84, 127–133. [Google Scholar] [CrossRef]
- Perrin, L.; Symoneaux, R.; Maître, I.; Asselin, C.; Jourjon, F.; Pagès, J. Comparison of three sensory methods for use with the Napping® procedure: Case of ten wines from Loire valley. Food Qual. Prefer. 2008, 19, 1–11. [Google Scholar] [CrossRef]
- Varela, P.; Ares, G. Sensory profiling, the blurred line between sensory and consumer science. A review of novel methods for product characterization. Food Res. Int. 2012, 48, 893–908. [Google Scholar] [CrossRef]
- Meyners, M.; Castura, J.C. Randomization of CATA attributes: Should attribute lists be allocated to assessors or to samples? Food Qual. Prefer. 2016, 48, 210–215. [Google Scholar] [CrossRef]
- Stranieri, S.; Ricci, E.C.; Banterle, A. Convenience food with environmentally-sustainable attributes: A consumer perspective. Appetite 2017, 116, 11–20. [Google Scholar] [CrossRef]
- Kemp, B.; Pickering, G.; Willwerth, J.; Inglis, D. Investigating the use of partial napping with ultra-flash profiling to identify flavour differences in replicated, experimental wines. J. Wine Res. 2018, 29, 302–309. [Google Scholar] [CrossRef]
- Meyners, M.; Castura, J.C.; Carr, B.T. Existing and new approaches for the analysis of CATA data. Food Qual. Prefer. 2013, 30, 309–319. [Google Scholar] [CrossRef]
- Culbert, J.A.; Ristic, R.; Ovington, L.A.; Saliba, A.J.; Wilkinson, K.L. Influence of production method on the sensory profile and consumer acceptance of Australian sparkling white wine styles. Aust. J. Grape Wine Res. 2017, 23, 170–178. [Google Scholar] [CrossRef]
- Torrens, J.; Riu-Aumatell, M.; Vichi, S.; López-Tamames, E.; Buxaderas, S. Assessment of Volatile and Sensory Profiles between Base and Sparkling Wines. J. Agric. Food Chem. 2010, 58, 2455–2461. [Google Scholar] [CrossRef] [PubMed]
- Vecchio, R.; Lisanti, M.T.; Caracciolo, F.; Cembalo, L.; Gambuti, A.; Moio, L.; Siani, T.; Marotta, G.; Nazzaro, C.; Piombino, P. The role of production process and information on quality expectations and perceptions of sparkling wines. J. Sci. Food Agric. 2019, 99, 124–135. [Google Scholar] [CrossRef] [PubMed] [Green Version]
- Olsen, J.; Thach, L.; Hemphill, L. The impact of environmental protection and hedonistic values on organic wine purchases in the US. Int. J. Wine Bus. Res. 2012, 24, 47–67. [Google Scholar] [CrossRef]
- Schäufele, I.; Pashkova, D.; Hamm, U. Which consumers opt for organic wine and why? An analysis of the attitude-behaviour link. Br. Food J. 2018, 120, 1901–1914. [Google Scholar] [CrossRef]
- McMahon, K.M.; Diako, C.; Aplin, J.; Mattinson, D.S.; Culver, C.; Ross, C.F. Trained and consumer panel evaluation of sparkling wines sweetened to brut or demi sec residual sugar levels with three different sugars. Food Res. Int. 2017, 99, 173–185. [Google Scholar] [CrossRef]
- Blackman, J.; Saliba, A.; Schmidtke, L. Sweetness acceptance of novices, experienced consumers and winemakers in Hunter Valley Semillon wines. Food Qual. Prefer. 2010, 21, 679–683. [Google Scholar] [CrossRef]
- Lesschaeve, I.; Bowen, A.; Bruwer, J. Determining the Impact of Consumer Characteristics to Project Sensory Preferences in Commercial White Wines. Am. J. Enol. Vitic. 2012, 63, 487–493. [Google Scholar] [CrossRef]
- Buxaderas, S.; López-Tamames, E. Chapter 1-Sparkling Wines: Features and Trends from Tradition. In Advances in Food and Nutrition Research; Henry, J., Ed.; Academic Press: Cambridge, MA, USA, 2012; pp. 1–45. [Google Scholar]
- Crump, A.; Johnson, T.; Bastian, S.; Bruwer, J.; Wilkinson, K. Consumers’ knowledge of and attitudes toward the role of oak in winemaking. Int. J. Wine Res. 2014, 6, 21–30. [Google Scholar]
- Pérez-Magariño, S.; Ortega-Heras, M.; González-Sanjosé, M.L. Wine consumption habits and consumer preferences between wines aged in barrels or with chips. J. Sci. Food Agric. 2011, 91, 943–949. [Google Scholar] [CrossRef]
- Ubeda, C.; Kania-Zelada, I.; del Barrio-Galán, R.; Medel-Marabolí, M.; Gil, M.; Peña-Neira, Á. Study of the changes in volatile compounds, aroma and sensory attributes during the production process of sparkling wine by traditional method. Food Res. Int. 2019, 119, 554–563. [Google Scholar] [CrossRef]
- Ginon, E.; Ares, G.; Laboissière LHE dos, S.; Brouard, J.; Issanchou, S.; Deliza, R. Logos indicating environmental sustainability in wine production: An exploratory study on how do Burgundy wine consumers perceive them. Food Res. Int. 2014, 62, 837–845. [Google Scholar] [CrossRef] [Green Version]
- Wolf, M.M.; Carpenter, S.; Qenani-Petrela, E. A Comparison of X, Y, and Boomer Generation Wine Consumers in California. Food Distr. Res. Soc. 2005, 36, 26724. [Google Scholar]
- Pomarici, E.; Asioli, D.; Vecchio, R.; Næs, T. Young consumers’ preferences for water-saving wines: An experimental study. Wine Econ. Policy 2018, 7, 65–76. [Google Scholar] [CrossRef]
Figure 1.
Representations of the eight sparkling wine samples (one duplicate sample) and the terms used to describe the samples at the first two dimensions of the multiple factor analysis of the data from the projective mapping task and ultra-flash profile.
Figure 1.
Representations of the eight sparkling wine samples (one duplicate sample) and the terms used to describe the samples at the first two dimensions of the multiple factor analysis of the data from the projective mapping task and ultra-flash profile.

Figure 2.
Check-all-that-apply (CATA) terms used to describe the six wine samples (blinded and informed of the production method) in the first two dimensions of the correspondence analysis performed using the CATA data.
Figure 2.
Check-all-that-apply (CATA) terms used to describe the six wine samples (blinded and informed of the production method) in the first two dimensions of the correspondence analysis performed using the CATA data.

Figure 3.
Penalty analysis of the CATA attributes and overall liking when the participants’ evaluated the sparkling wine evaluated blinded (a) and informed about the production method (b).
Figure 3.
Penalty analysis of the CATA attributes and overall liking when the participants’ evaluated the sparkling wine evaluated blinded (a) and informed about the production method (b).


Table 1.
Geographical location, grape variety, price, alcohol percentage, and closure of wines assessed in the projective mapping trial.
Table 1.
Geographical location, grape variety, price, alcohol percentage, and closure of wines assessed in the projective mapping trial.
| Wine | Geographical Location | Grape Varieties | Price (Canadian Dollars (CAD)) | Alcohol Percentage | Closure of Wine |
|---|---|---|---|---|---|
| W1 | Canning | L’Acadie Blanc, Seyval Blanc, Chardonnay | 27.98 | 11.7% | Cork |
| W2 | Port Williams | L’Acadie Blanc, Frontenac Blanc, Muscat Ottonel | 23.99 | 10.5% | Cork |
| W3 | Gaspereau | L’Acadie Blanc, Chardonnay, Seyval Blanc | 34.99 | 11.5% | Cork |
| W4 | Grande Pre | L’Acadie Blanc, Seyval Blanc | 29.49 | 11.5% | Cork |
| W5 | Gaspereau | L’Acadie Blanc, Seyval Blanc, Pinot Noir, Chardonnay | 27.98 | 11.0% | Cork |
| W6 | Falmouth | L’Acadie Blanc | 18.99 | 11.0% | Screw Top |
| W7 | Canning | L’Acadie Blanc | 34.99 | 12.0% | Cork |
Table 2.
Demographic details for each trial.
| PM and UFP Trial (n = 77) | Consumer Acceptability Trial (n = 101) | |
|---|---|---|
| Characteristics | Sample Population | |
| Age | ||
| 19–20 | 5 (6.5%) | 7 (6.9%) |
| 21–29 | 22 (28.6%) | 29 (28.7%) |
| 30–39 | 12 (15.6%) | 19 (18.8%) |
| 40–49 | 13 (16.9%) | 15 (14.9%) |
| 50–59 | 14 (18.1%) | 18 (17.8%) |
| 60–69 | 11 (14.3%) | 13 (12.9%) |
| Gender | ||
| Male | 31 (40.3%) | 38 (37.6%) |
| Female | 46 (59.7) | 62 (62.4%) |
| Prefer not to say | 0 (0.0%) | 0 (0.0%) |
| What term best describes your interest in wine? | ||
| No interest | 2 (2.6%) | 3 (3.0%) |
| Limited interest | 11 (14.3%) | 15 (14.8%) |
| Interested | 47 (61.0%) | 62 (61.4%) |
| Highly interested | 17 (22.1%) | 21 (20.8%) |
| What term best describes your knowledge of wine? | ||
| No knowledge | 2 (2.6%) | 3 (3.0%) |
| Limited knowledge | 52 (67.5%) | 71 (70.3%) |
| Knowledgeable | 22 (28.6%) | 26 (25.7%) |
| Highly knowledgeable | 1 (1.3%) | 1 (1.0%) |
| How much do you typically spend on a bottle of wine? | ||
| Up to CAD 20.99 | 46 (59.7%) | 63 (62.4%) |
| CAD 21.00–30.99 | 29 (37.7%) | 35 (34.6%) |
| CAD 31.00–50.99 | 2 (2.6%) | 3 (3.0%) |
| More than CAD 51.00 | 0 (0.0%) | 0 |
Table 3.
Means and standard deviations of participants’ responses (n = 101) in the consumer acceptability trial to the questions about their attitudes towards sustainability and food shopping habits.
Table 3.
Means and standard deviations of participants’ responses (n = 101) in the consumer acceptability trial to the questions about their attitudes towards sustainability and food shopping habits.
| Statement | Mean | Standard Deviation |
|---|---|---|
| I check food products’ ingredient list on a regular basis. | 5.7 1 | 0.7 |
| I check food products’ nutrition facts on a regular basis. | 6.0 | 1.2 |
| I check the geographical origin of food products on a regular basis. | 4.9 | 1.0 |
| I check the product shelf life on a regular basis. | 5.4 | 1.9 |
| I check for the presence of organic logos on food products on a regular basis. | 4.3 | 1.4 |
| I check for the presence of sustainability logos or certifications on food products on a regular basis. | 4.4 | 1.1 |
| I believe institutions should invest more money in programs to reduce chemical products in agriculture. | 6.3 | 1.1 |
| I believe control activities on the environmental impact of agricultural practices are too scarce. | 5.5 | 1.4 |
| I am worried about the impacts of agricultural practices on the environment. | 5.9 | 1.3 |
| I am worried about the impacts of agricultural practices on human health. | 5.6 | 1.2 |
| I believe the agricultural practices have a strong impact on water pollution. | 6.1 | 1.2 |
| I believe that agricultural practices have a negative impact on human health. | 4.7 | 0.9 |
| I purposely purchase food products with recyclable packaging. | 4.7 | 0.9 |
| I recycle plastic and glass bottles. | 6.8 | 0.5 |
| I recycle food paper cartons. | 6.7 | 0.8 |
| I bring my own grocery bags when shopping. | 6.0 | 1.5 |
1 All data input on a 7-point Likert scale (1 = Strongly Disagree to 7 = Strongly Agree).
Table 4.
Consumer mean liking scores and standard deviations (SD) for appearance, flavour, mouthfeel, and overall liking for the sparkling wine evaluated blinded and informed about the production method.
Table 4.
Consumer mean liking scores and standard deviations (SD) for appearance, flavour, mouthfeel, and overall liking for the sparkling wine evaluated blinded and informed about the production method.
| Sample | Appearance | Flavour | Mouthfeel | Overall Liking | |
|---|---|---|---|---|---|
| W2—Blinded | Mean SD | 7.0a 1,2,3 1.4 | 6.7a 1.4 | 6.9a 1.5 | 6.8a 1.5 |
| W2—This wine has a carbon neutral label. | Mean SD | 6.8a 1.5 | 6.7a 1.6 | 6.8a 1.4 | 6.7a 1.4 |
| W3—Blinded | Mean SD | 6.9a 1.6 | 5.2b 0.9 | 6.1bcd 0.8 | 5.2b 0.8 |
| W3—This wine is certified organic. | Mean SD | 7.1a 1.3 | 5.7b 1.0 | 6.3abc 0.9 | 5.8b 1.0 |
| W5—Blinded | Mean SD | 6.8a 1.5 | 5.2b 0.9 | 5.6d 1.0 | 5.1b 0.9 |
| W5—This wine is produced following traditional methods. | Mean SD | 7.0a 1.3 | 5.6b 1.0 | 6.0cd 1.8 | 5.6b 1.0 |
1n = 101. 2 Means in the same column, with the same letter, are not significantly different at α = 0.05, as evaluated using a two-way ANOVA and Tukey’s honestly significant difference (HSD). 3 Data input on the 9-point hedonic scale, where 1 = Dislike Extremely, 5 = Neither Like or Dislike, and 9 = Like Extremely.
Table 5.
Frequency of selection of the CATA terms for the six wine samples (blinded and informed).
| Attributes | W2 | W3 | W5 | |||
|---|---|---|---|---|---|---|
| Blinded | This Wine Has a Carbon-Neutral Label | Blinded | This Wine Is Certified Organic | Blinded | This Wine Is Produced Following Traditional Methods | |
| Sweet *** | 43a 1 | 46a | 23b | 20b | 18b | 17b |
| Sour ns | 36 | 31 | 43 | 39 | 37 | 43 |
| Watery ns | 16 | 19 | 17 | 12 | 16 | 15 |
| Strong *** | 23a | 17a | 39b | 34b | 37b | 40b |
| Bitter *** | 29a | 15b | 45c | 36ac | 44c | 45c |
| Dry ns | 37 | 27 | 42 | 41 | 36 | 38 |
| Citrus * | 29a | 37b | 19c | 20bc | 26b | 27ab |
| Astringent ns | 21 | 13 | 20 | 19 | 26 | 25 |
| Crisp *** | 50a | 50a | 27b | 42a | 40a | 33ab |
| Apples ** | 35a | 34a | 27ab | 23b | 19b | 16b |
| Pungent *** | 11ab | 5a | 14b | 29c | 23abc | 19bc |
| Pear * | 19ab | 24b | 18ab | 22ab | 13ab | 8a |
| Strong Aftertaste *** | 16a | 21a | 35b | 43b | 44b | 49b |
| Earthy ** | 9a | 12ab | 23b | 16b | 8a | 16b |
| Floral ns | 11 | 13 | 11 | 9 | 10 | 2 |
| Berry ns | 8 | 9 | 9 | 5 | 1 | 4 |
| Smooth *** | 27a | 41b | 24a | 20a | 9c | 13c |
| Oak * | 5a | 9a | 12a | 10a | 10a | 18b |
| Wood *** | 4a | 4a | 14ab | 17ab | 19bc | 22c |
| Carbonated ** | 45a | 46a | 24b | 37a | 39a | 37a |
| Burnt ** | 0a | 3a | 9b | 10b | 10b | 10b |
| Vanilla ns | 5 | 4 | 2 | 1 | 2 | 4 |
| Peach ns | 6 | 6 | 6 | 4 | 3 | 1 |
| Mineral ns | 12 | 9 | 18 | 17 | 17 | 20 |
*** Indicates significant differences between samples according to Cochran’s Q test at p < 0.0001. ** Indicates significant differences between samples according to Cochran’s Q test at p < 0.01. * Indicates significant differences between samples according to Cochran’s Q test at p < 0.05. ns Indicates no significant differences between samples according to Cochran’s Q test (p < 0.05). 1 Post hoc multiple pairwise comparisons were performed using McNemar’s test with Bonferroni alpha adjustment. The different letters (a, b, c) denote significant significance differences within the attribute at p < 0.05.
Publisher’s Note: MDPI stays neutral with regard to jurisdictional claims in published maps and institutional affiliations. |
© 2020 by the authors. Licensee MDPI, Basel, Switzerland. This article is an open access article distributed under the terms and conditions of the Creative Commons Attribution (CC BY) license (http://creativecommons.org/licenses/by/4.0/).
Share and Cite
MDPI and ACS Style
Hayward, L.; Barton, A.; McSweeney, M.B. Investigating How the Disclosure of Production Methods Influences Consumers’ Sensory Perceptions of Sparkling Wines. Beverages 2020, 6, 66. https://doi.org/10.3390/beverages6040066
AMA Style
Hayward L, Barton A, McSweeney MB. Investigating How the Disclosure of Production Methods Influences Consumers’ Sensory Perceptions of Sparkling Wines. Beverages. 2020; 6(4):66. https://doi.org/10.3390/beverages6040066
Chicago/Turabian StyleHayward, Lydia, Alanah Barton, and Matthew B. McSweeney. 2020. "Investigating How the Disclosure of Production Methods Influences Consumers’ Sensory Perceptions of Sparkling Wines" Beverages 6, no. 4: 66. https://doi.org/10.3390/beverages6040066
Note that from the first issue of 2016, this journal uses article numbers instead of page numbers. See further details here.