Article

The Impact of Flexographic and Digital Printing of Fruit Drinks on Consumer Attention at the Point of Sale

The Sonoco Institute, Clemson University, 211 Fernow Street, Clemson, SC 29634, USA
*
Author to whom correspondence should be addressed.
Beverages 2015, 1(3), 149-158; https://doi.org/10.3390/beverages1030149
Submission received: 16 June 2015 / Revised: 17 July 2015 / Accepted: 21 July 2015 / Published: 24 July 2015
(This article belongs to the Special Issue Beverage Packaging)

Abstract

:
Package labels play a critical role in communicating product benefits to consumers. On a package, labels are used to provide useful information about the product as well branding for the company. Labels need to not only be eye catching to the consumer, but must also communicate information concerning what is being sold. This is possible through various printing technologies available in today’s market. With technology steadily advancing, companies need to determine an optimal print method for packaging that satisfies budgetary, environmental, demand and consumer requirements. Through the collection of quantitative data, consumer attention and purchase preference were evaluated. Two different printing methods (digital and flexographic) were tested on fruit drink labels. A total of 248 participants completed this study, which took place at Pack Expo 2014 in Chicago, Illinois. Three eye tracking metrics were evaluated using eye tracking technology to investigate if the different printing methods had an effect on the consumer when shopping. Statistical analysis yielded no significant difference for participant’s attention when shopping for fruit drinks with digital or flexographic labels. It was also concluded that the position on the shelf made no significant difference for either label type. This study illustrates that consumers cannot significantly determine a difference between the two printing methods tested.

1. Introduction

Labeling plays a crucial role in communicating product benefits to consumers. Labeling can be the primary source of advertisement, so it is important for companies to add information to the package that generates more revenue than cost [1]. Labeling is especially important due to the fact that there are so many choices for consumers to make; therefore, its intent is to assist consumers in differentiating the labeled products from similar competitive products [1]. By labeling a product, the company seeks to draw attention to their package, as well as provide important information to consumers that will aid in their purchasing decisions [1]. A label can also influence consumer perceptions about a certain product [2]. Companies are not only concerned with the branding aspect of labels, but also how to select the best printing technology for their labels in an evolving field. In the field of packaging, all major printing technologies are used, typically in a combination with other technologies [3]. If companies do not understand the printing process and which solutions are best for product, they can run the risk of wasting money and time on labels [4].
Printing methods evolved greatly during the last century from the wood block printing and printing press methods of the past. Because of the new technological advances, companies now have many options for printing their labels [4]. The major printing methods that exist in the field of printing labels are flexographic and digital. Choosing between the two methods can be a daunting task because of the advantages and disadvantages of both for a given printing job. Flexographic printing uses flexible printing plates made of plastic or rubber. This printing process involves transferring ink, one color at a time, to the surface of a plate to a substrate by passing it between a print plate and impression roller while applying pressure [4,5]. The image that receives the ink is raised above the area that does not. Unlike flexographic printing, digital printing does not require the use of plates but instead uses toner to deposit ink onto the material to be printed. As for the substrate, the toner does not permeate it, but as an alternative forms a thin layer on the surface using heat to adhere it [4].
Both flexographic and digital printing methods have advantages and disadvantages depending on a variety of different factors throughout the printing process. Any substrate can be used for flexographic printing which is important for substrates sensitive to heat and they are extremely durable [4]. Another advantage of this type of printing is using fast-drying inks to increase the speed of production. The main advantage of flexographic printing in terms of cost is that this method is applicable for large runs because no added work is needed between preparing and setting up the plates and taking the finished label off of the press [4]. Though there are many benefits, there are also some disadvantages, such as the cost of plate materials and imaging. Even though the plate-making process instrumented in flexographic printing allows many images to be printed with only one template, it is extremely costly because there has to be a plate customized for each color used. The cost of the image is another problem for this method because when the image is wrapped around a cylinder during the press it causes the image to be distorted or smear because of the “stamp principle” [4,6]. However, digital printing excels due to the fact that it does not require plates to be created, which results in less distortion of the image [4]. Digital printing can be costly in the initial capital investment and proofing stage, but once this is complete, printing can be completed on an as needed basis [7] and has an almost immediate design change-over period, as no plates are utilized. Digital printing has higher image quality and less cost than flexographic because digital images are printed in one image rather using several plates like flexographic [4,7]. Digital printing is more flexible than flexographic because it only involves the image rather than plates. Labels can be easily changed and updated at no added charge, which flexographic printing cannot do without extra cost [4]. Digital printing is very consistent because files can be stored on a hard drive and be reused over time to produce identical results, assuming the media, inks, and hardware/software have not changed. However, while having extreme benefits, digital printing does have disadvantages such as a high cost for large print jobs. If a company wants to print a large number of labels at a fast rate, flexographic printing is more affordable [4]. Where flexographic labels are durable in the outdoors, digitally printed labels are not. Additionally, digital printing also has the disadvantage of using cyan, yellow, magenta, and black, while flexographic can create more exact matched using the Pantone Color System [4]. Being able to understand how consumers view different print processes in the field today will provide valuable information in terms of choosing label printing technologies. Because labels appeal visually to the consumer at the point of sale, it is important to investigate how consumers perceive the difference between the two printing techniques. The objectives of this study were to (1) investigate the use of eye tracking to see if there was a significant difference between the two different printing methods (2) understand the potential reasons why or why not significance exists between the two labels.

2. Materials and Methods

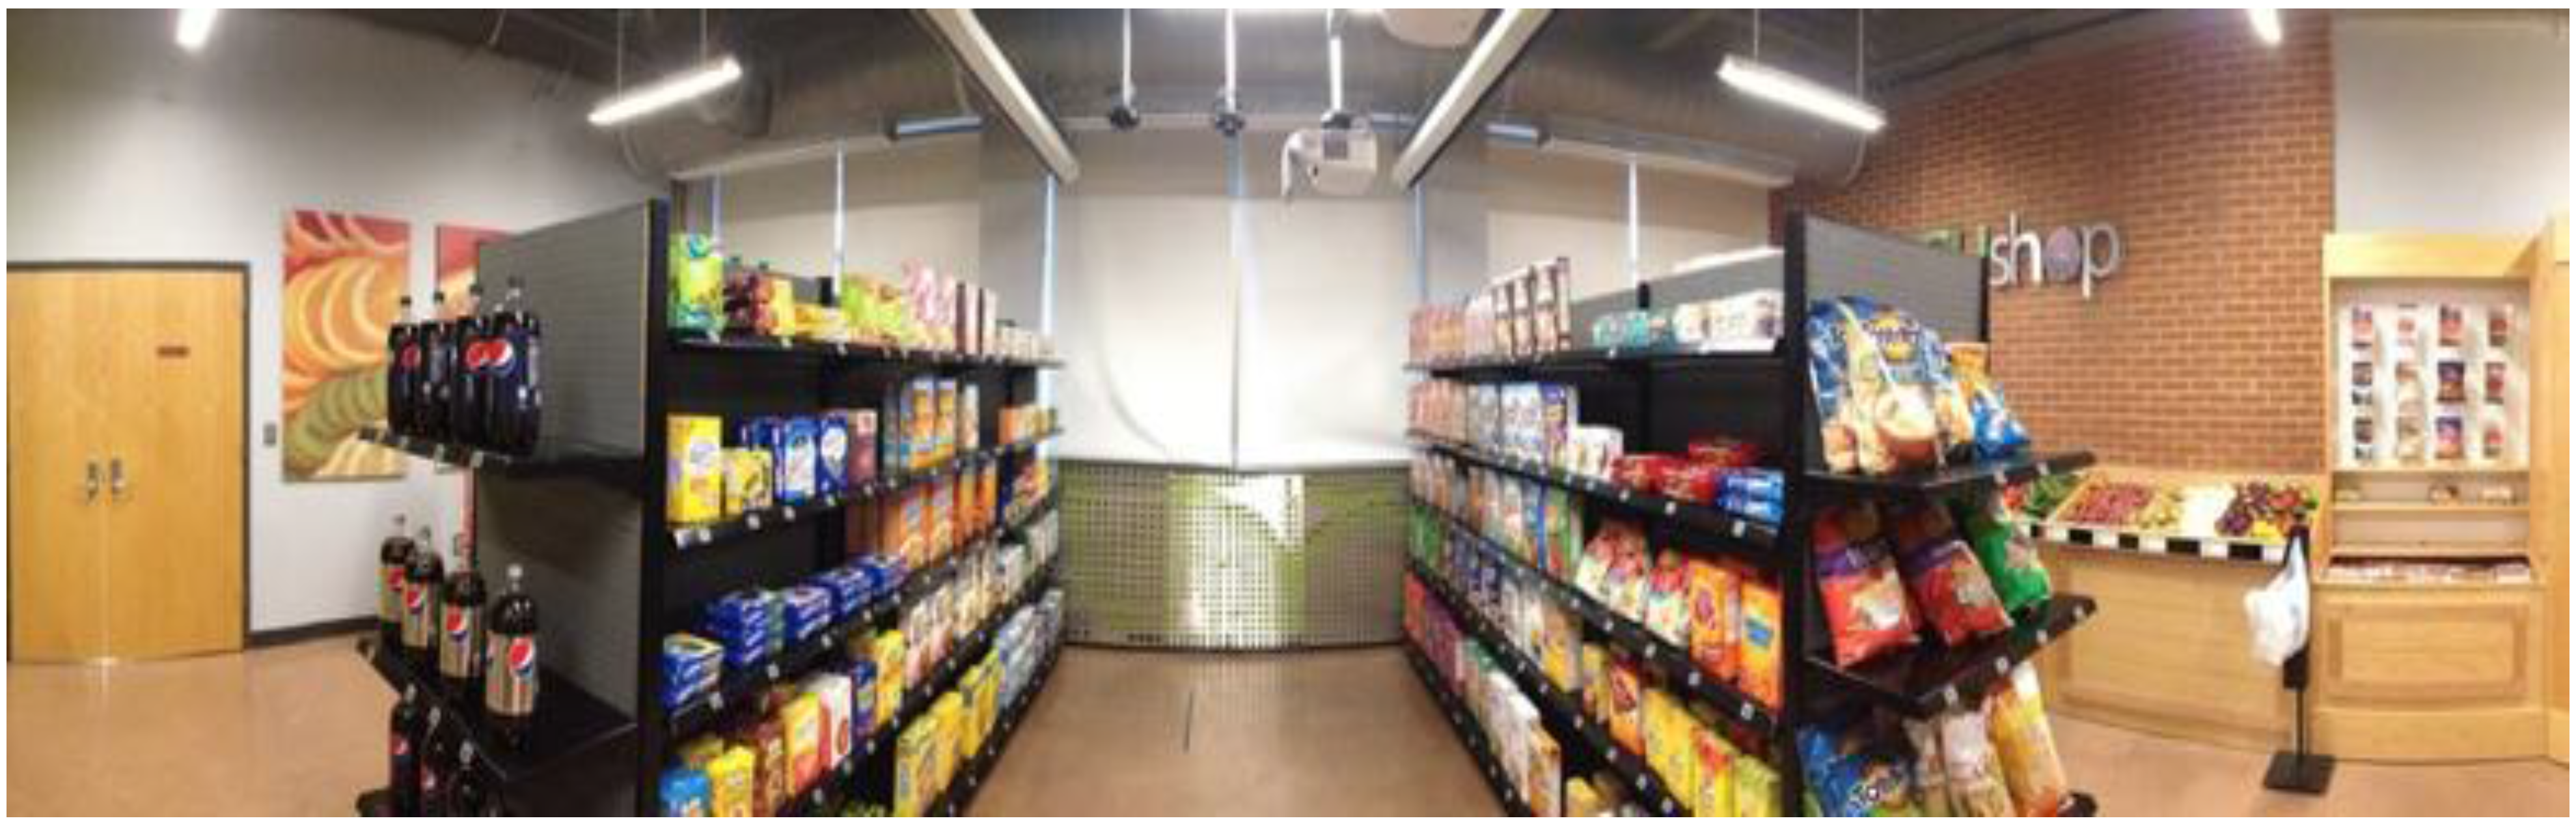
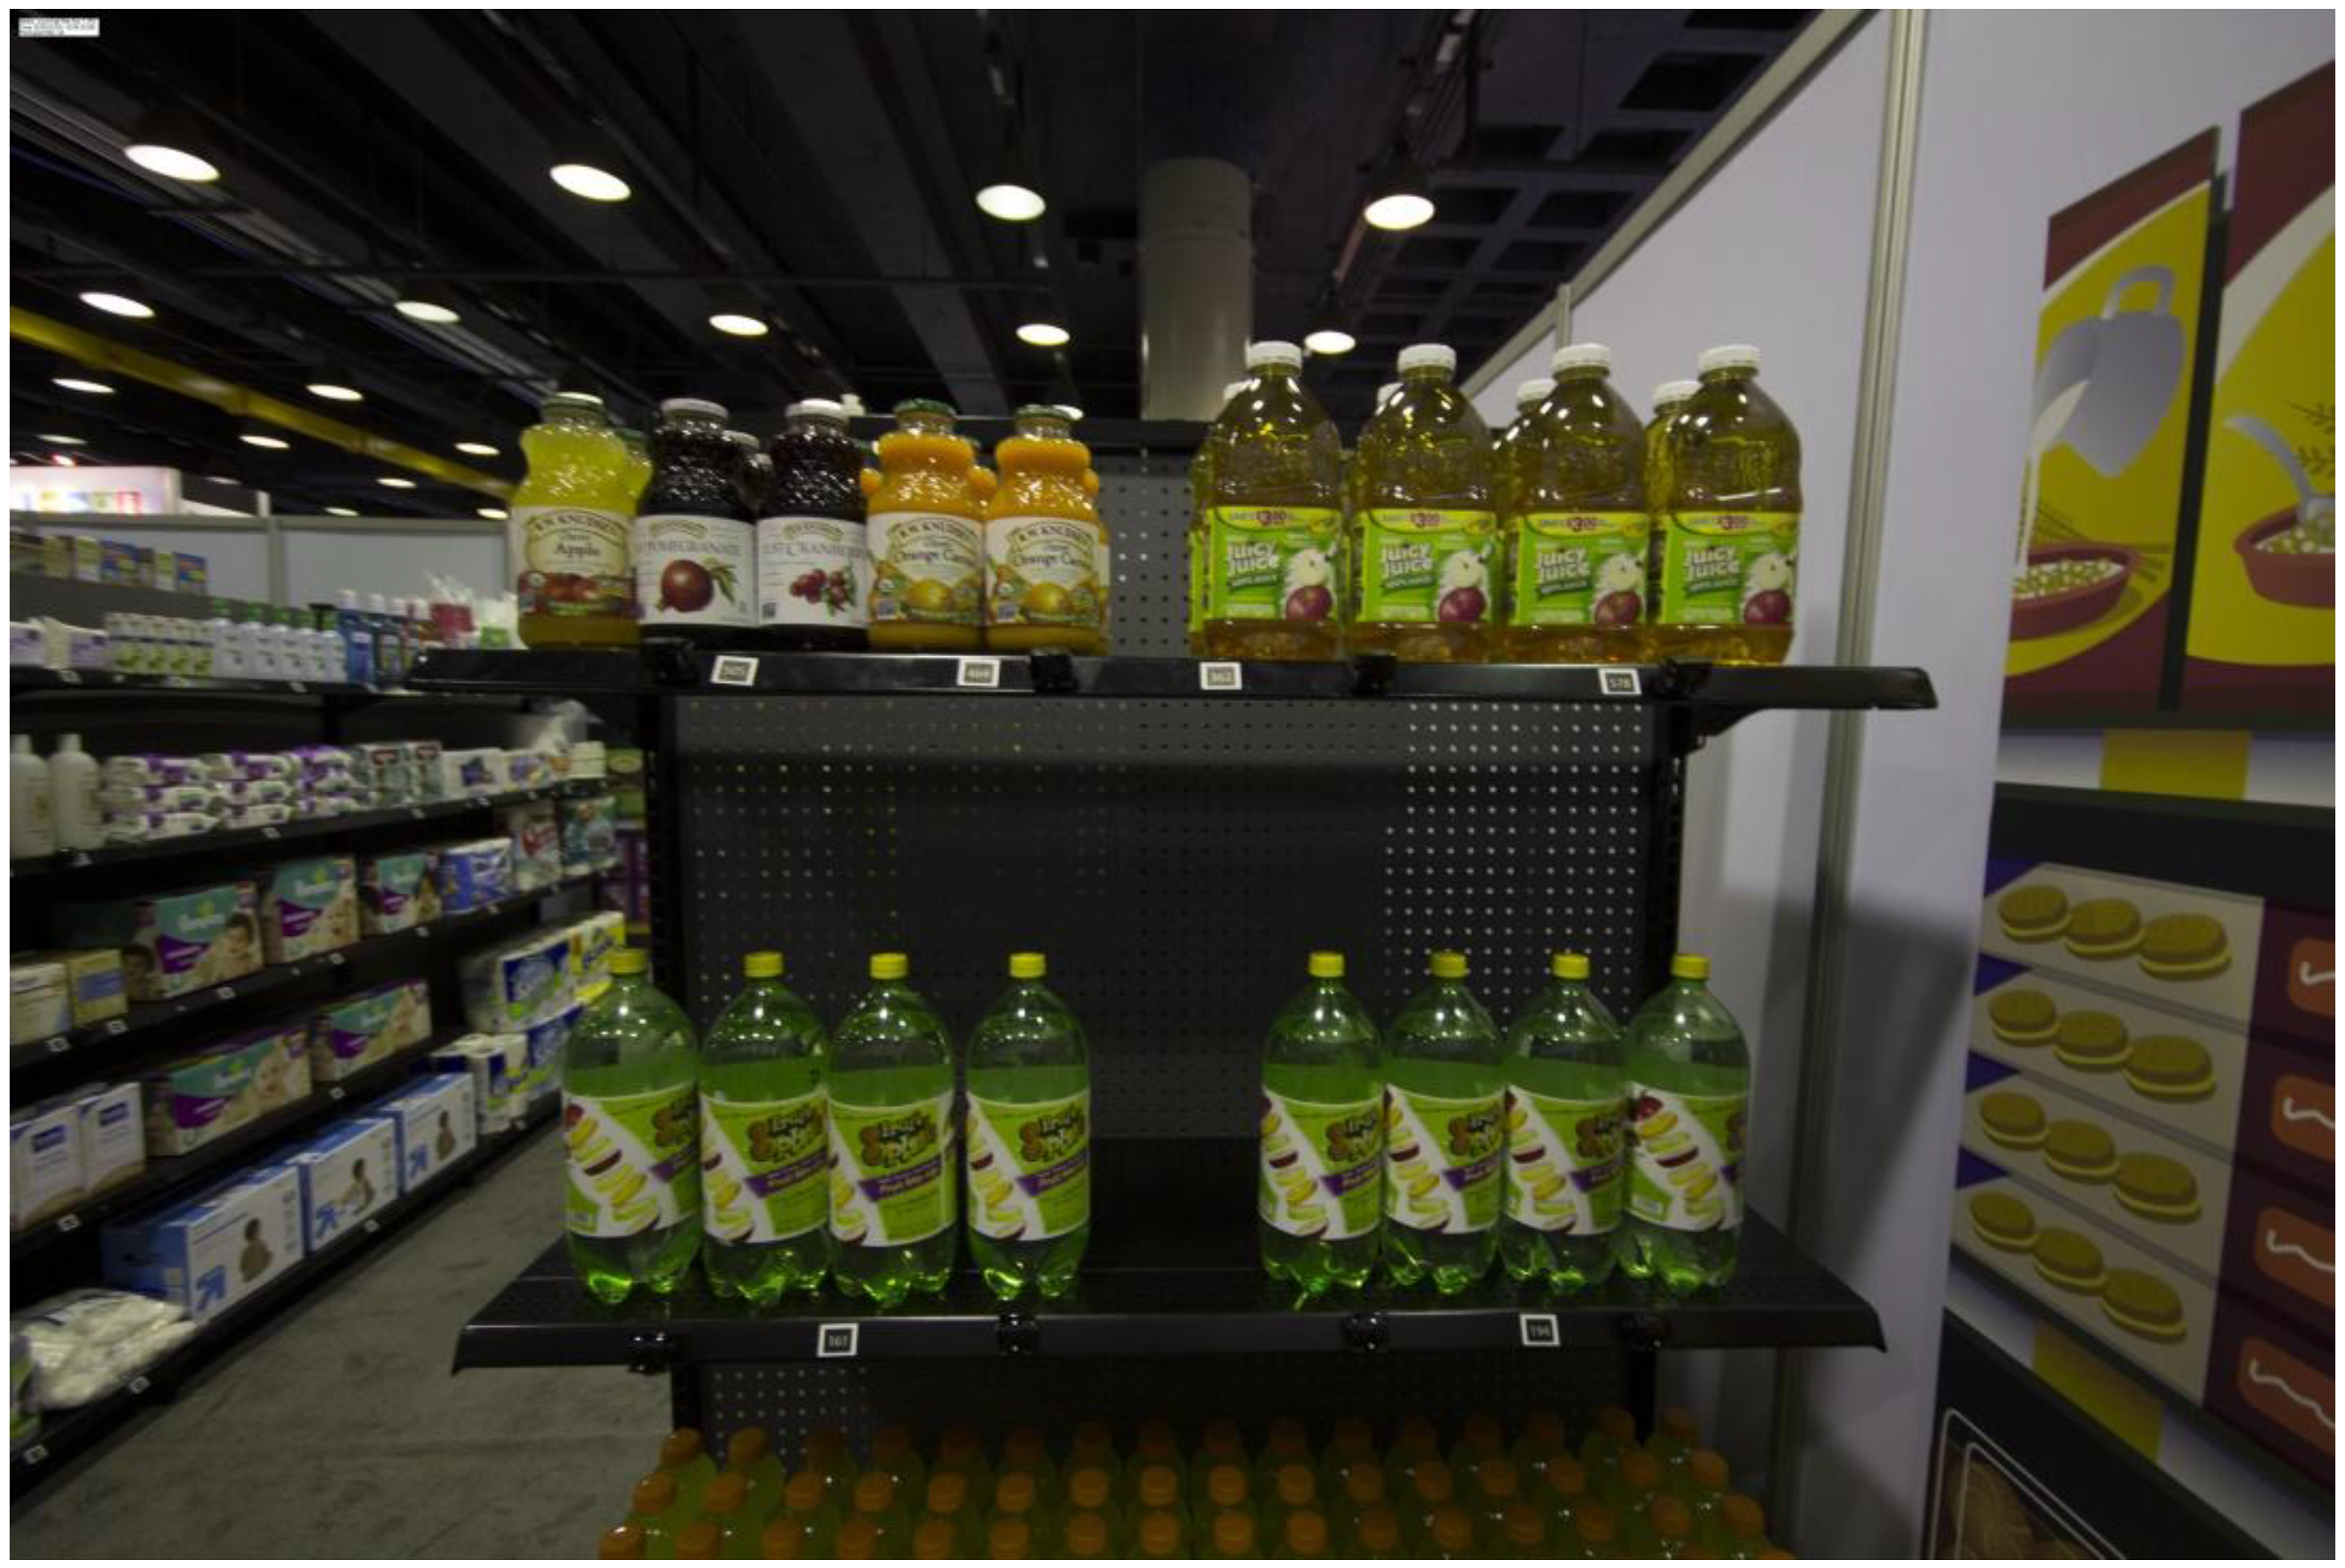
2.1. Location and Stimuli

The study took place in CUshop™ Consumer Experience Laboratory (Figure 1) relocated to Pack Expo in Chicago, Illinois. This study took place over a four day period during the exposition. CUshop™ is a realistic shopping environment featuring shopping aisles, a frozen food section, produce area and simulated open refrigeration areas. The digital and flexographic (flexo) fruit drinks were provided by a private label brand. Note: Since this study took place at an international packaging tradeshow it is possible that some participants are more knowledgeable about the many faceted areas of packaging, however a large portion of people attending the show are not educated in the various printing techniques discussed herein.
Figure 1. CUshop™.
Figure 1. CUshop™.
Beverages 01 00149 g001

2.2. Planogram

The digital and flexo fruit juices were arranged on an end cap in the modified CUshop™ facility. Four bottles of each type were placed on the second shelf of the display. In order to group product categories together, assorted fruit drinks were placed on the top shelf and sports drinks on the bottom shelf (Figure 2). The stimuli of interest varied shelf position per day to ensure that shelf placement was not a factor. On days one and three, the digital printed fruit drinks were on the left of the shelf and flexo printed were on the right. On days two and four, the shelf was reversed and flexo were on the left and the digital were on the right. For days one and three there was a total of 148 participants and days two and four a total of 100 participants.
Figure 2. Fruit drinks arranged on the shelf at the exposition.
Beverages 01 00149 g002

2.3. Eye Tracking Apparatus

Eye tracking of voluntary participants was completed using the Tobii Eye Tracking Glasses first generation. This setup includes mobile eye tracking glasses, IR markers, a recording assistant, and Tobii Studio eye tracking software. The eye tracking glasses are calibrated to the participant’s eyes and accurately track eye pupil movements. The recording assistant is hardwired to record tracking and visual data with a standard transferrable secure digital (SD) memory card. IR markers have a transmission range of 60–250 cm at angles between 90° and 150° and are positioned around the packages being tested [8]. Following completion of the study, eye tracking data is transferred to Tobii Studio eye tracking software for analysis.

2.4. Experimental Design

Digital and flexographic fruit drink stimuli were placed next to each other on the shelf and rotated position (left or right) per day.
Areas of Analysis (AOAs) and Areas of Interest (AOI) are mapped on each stimulus within the Tobii software. The location of the grid of IR markers on the store shelves determines the AOAs, which is the area where the eye tracking data is recorded for each participant [8]. The AOI is located inside the AOA and is specifically mapped for each fruit drink stimulus. Eye tracking data was compared for the AOIs for the digital and flexographic fruit drink and combined by days.
Once calibrated, the participant was given a shopping list and instructed to go into the store and select a product for each item on the list. Specifically, for this study, they were instructed to purchase “fruit drink” to clarify that the provider did not want their product to be advertised as a soda. The shopping list order was randomized to force participants to go through the entire store. Participants were instructed not to pick up any products but only to write down the number corresponding to the items on their checklist.

2.5. Procedure

The participants were enlisted based on a voluntary basis at the exposition. Prior to the study, each participant was given an “ID code” to ensure confidentiality and informed to shop for items indicated on a shopping list. The participant was then asked to place the glasses over his or her head in order to be calibrated.
Following the 9-point calibration, participants were handed a shopping list with the stimuli and other items listed on it and asked to shop for the items on the list. Boxes beside each item were listed, and participants were instructed to write down the corresponding number on the shelf of the item they chose. When participants were finished shopping, they exited CUShop™ and were guided to a debriefing area where they were asked demographic questions (age, biological sex, income, etc.) as well as questions specific to the fruit drink stimuli. These questions were asked to get a qualitative idea of how participants perceived the two labels.

2.6. Data Collection and Eye Tracking Metrics

AOAs and AOIs were pre-determined for the flexo and digital fruit drinks. AOI’s were used to determine three measurements of participant eye-movement: Time to First Fixation (TTFF), Total Fixation Duration (TFD), and Fixation Count (FC). TTFF is the time, in seconds, from when a product first enters a participant’s field of view until they fixate on it. The lower the number, the quicker the package caught the consumers’ attention. TFD, is the time, in seconds, spent on average by participants fixating on this item. The higher the number the more attention the consumer focuses on the package. FC is the total number of times a participant’s scan of the planogram crossed into a particular area of interest. This metric helps triangulate on how the consumer considers a certain item when visually navigating a planogram.
The survey questions were written so that readers could gain insights on the printing methods tested, as well as demographic information to gain knowledge on what participants took place in the study. The survey was created through SurveyMonkey.com and was exported to Excel after completion of the study.
Statistical analysis was run on the raw eye tracking data collected using Tobii Studio. Using SAS® Studio, a t-test was used to determine if the measured data was significantly different for the flexo and digital fruit drinks as well as position on the shelf.

3. Results and Discussion

3.1. Results

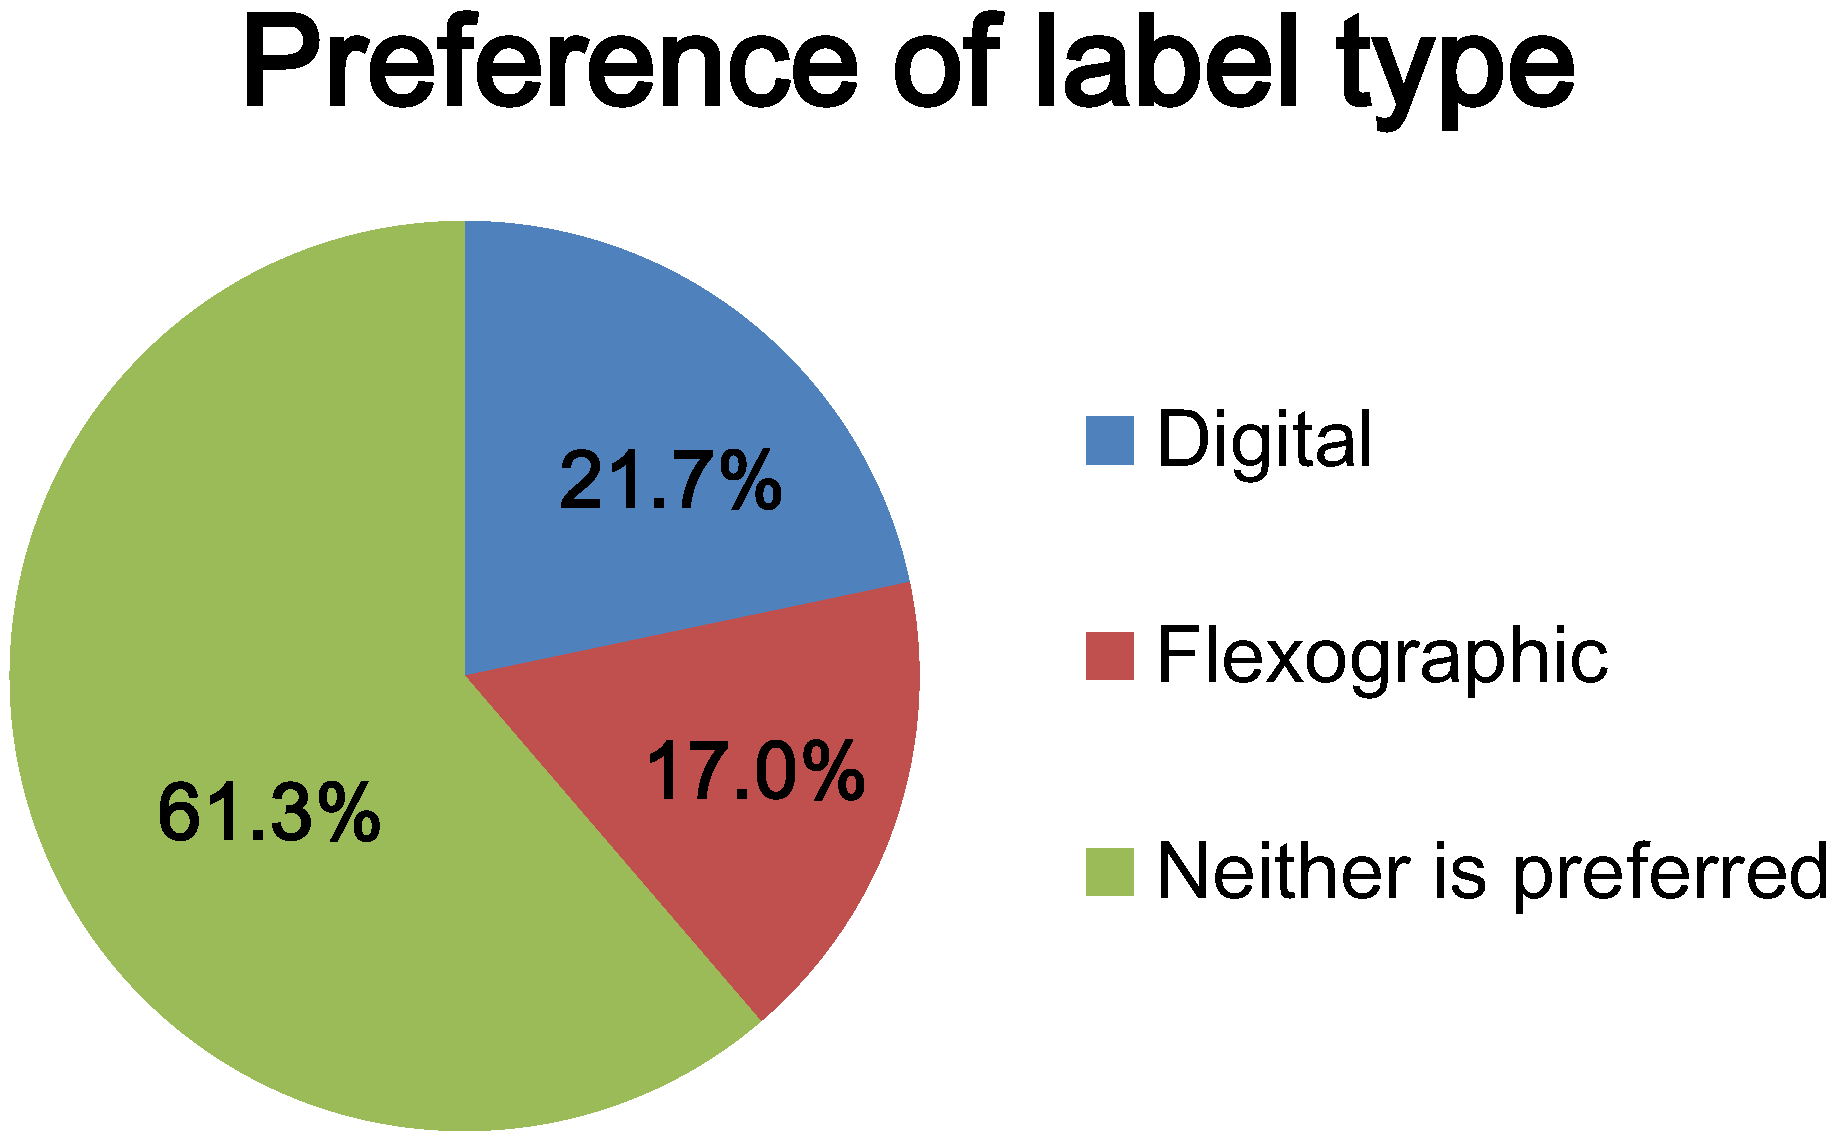
3.1.1. Survey Findings

Upon completion of the eye-tracking portion of the study, each participant was asked to complete a follow-up survey located outside of the shop at the booth after exiting CUShop™. Each participant was assigned a unique ID number for the duration of the study to ensure confidentiality. Two hundred and forty-eight participants (57% male, 43% female) took part in the study. Ages ranged from under 18 to 64 with about 53% being between 21 and 39. Participants were either married or single (split 50%) with 42% having children. With our participant pool consisting of people attending the trade show, the education level was predominately people that had a bachelors or graduate degree (70%) with a variety of income levels, which is representative of a tradeshow such as this rather than the overall population.
The experiment started with PackExpo attendees who volunteered to participate in the study. The post survey questions consisted of a question that asked participants if they preferred digital or flexo printing and were shown a picture of both to aid in their decision (Figure 3). They were also asked to briefly explain why they preferred or did not prefer either label.
Figure 3. Response to post survey question on label type.
Beverages 01 00149 g003
When asked to explain why they chose a certain label, the majority of the participants concluded that they did not see much of a difference, with responses such as, “They look the same,” “I do not see a difference,” “Could not spot any difference.”

3.1.2. Eye Tracking Results and Statistical Analysis

The raw eye tracking data was collected using the eye tracking glasses and analyzed using Tobii Studio, as well as SAS® Studio. This output was used to determine the mean, standard deviation, and standard error for participants TTFF, TFD, and FC for the fruit juice stimulus. The data was tested for normality using the Shapiro-Wilk test, and the data was determined to be non-normal. A t-test was conducted in SAS® because the Central Limit Theorem can apply since the sample size was larger than 30 participants. A t-test was run comparing the means of the digital vs. flexo printing to determine if there was a significant difference between the labels. Another t-test was run to determine if shelf the position made a difference on how the participants viewed the labels. In addition to these t-tests a non-parametric test, Mann Whitney U, was used to test the population means in order to cross check the t-test results. The results of non-significance were consistent for both the Mann Whitney U test and the t-test.
With p-values ranging from 0.344 to 0.765, there was no significant difference between printing methods or shelf position using α = 0.05 (Table 1).
Table 1. Overview of p-values.
StimuliTTFFTFDFC
Digital vs. Flexo0.3440.7300.381
Digital left vs. right0.2010.1260.765
Flexo left vs. right0.1320.6660.251
The raw values for digital and flexo printed fruit drinks are shown in Table 2 to further illustrate how similar the times and counts are for each product.
Table 2. Overview of eye tracking data.
StimuliTTFF (s)TFD (s)FC (counts)
Digitial1.660.854.64
Flexo1.460.834.03

3.2. Discussion

Both qualitative and quantitative data support that the majority of participants did not see any difference between the digital or flexographic labels. Shelf position was also tested to ensure to that left or right position on the shelf would make no difference in the study (p > 0.05). The subtle differences that do exist visibly amongst the two print technologies may have been difficult for the participants to observe in the short time the study was run and with products being on the shelves rather than in participants hands. Though we did not specifically encourage picking items up, there was no moderator in the shop to control this action from happening. The study completed here is studying the first moment of truth, which is the grabbing of that first moment of attention, while reading and touching a package is the second moment of truth. Packaging is an essential part of the first moment of truth during the point-of-sale because the visual elements of a package play a key role in communicating product benefits to the customer [9]. Because of this, the restriction of not being able to pick up products in this study should not alter the results. Even being able observe to labels for a longer time than the study permits, it is difficult to see the difference between the two labels, apart from the black print on the flexographic label being a very insignificant amount bolder and the digital label being more vibrant and consistent in color.
In the viewpoint of companies looking for the impact of the first moment of truth on printing methods, the non-significant results of this research may come as an advantage. Based on the fact that participants did not significantly look at either label first or longer, companies can base their print technology solutions on factors that are the most valuable to them which is typically budgetary, workflow and space requirements. These results could also potentially impact consumers, such that the money saved on being able to choose the cheapest printing technique by the company may lead to passing these savings on to the price point of food items in retail. Along with this idea, since these results show no significant difference between printing techniques, the method that makes each product look the most attractive to consumers can then be chosen. Studies have been completed using eye tracking to evaluate food labels—investigating what shoppers actually look at rather than what they say they look at when asked in a survey or focus group [10]. The use of eye tracking is becoming more popular in the field of nutrition as a way of objectively monitoring consumer attention of nutrition labels [11]. Another study on food labels investigated how consumers acquire information from food labels using eye tracking [12]. This study found that in order to evaluate their likeliness to purchase food with unknown labels, consumers directed their attention to specific areas where they searched for information such as brand, ingredients, nutritional information and the image on the label, regardless of the type of product and label design [12]. Similarly, a study on the effect of the wine label concluded that the picture on the label was looked at first and also for the longest duration and that larger font size performed better than small fonts [13]. For food/drinks labels, similar to different printing techniques for labels, viewing the information on the front of the package does not guarantee understanding the information or in fact using it to guide food selection, but the use of survey questions following the eye tracking portion can help gather these insights [11]. All of these studies indicate that consumers are spending a significant amount of attention on the label of the package, but the question arises if consumers are even aware of the printing techniques used for these labels. Overall, little research has been completed on consumer perception of print technologies within the package labeling process. In terms of price point of the two methods, research has been conducted to validate the most cost effective technique. A recent study comparing the manufacturing cost of printing labels by the conventional flexographic method to digital imaging was conducted [14]. This study concluded that with the increase in digital press speeds and decrease in costs, flexographic becomes more cost effective technology at 5000 linear feet of printed material [14]. Seeing these results, if cost was the only variable, companies may lend toward digital printing. Along with cost, digital printing has advantages to flexographic printing in terms of versioning. Companies are increasingly looking for the ability to have a choice of versions, shapes, and sizes for individual orders which digital printing can offer. Currently there lies a dilemma of choosing between two print technologies that both have their own unique advantages and disadvantages, but undoubtedly in the future there will be hybrids of these technologies which will combine the attributes of versatility, speed, and efficiency of flexographic with the greatly reduced substrate waste and zero plate cost benefits of digital [14]. Nonetheless, in the current market, choosing the type of label printing technology is dependent on the cost and quality standpoint, in which both methods have their advantages and disadvantages. Overall, eye tracking offers a useful way to investigate different printing techniques on beverage labels especially because attention measures based on memory have been reported to be poor indicators of what consumers actually intend to do, largely because their attention is not necessarily active and conscious [12].

4. Conclusions

Overall, package labels play a critical role in communicating product benefits to customers as well as provide branding for companies. Various printing technologies allow pertinent product information to be displayed to the consumers. With technology steadily advancing, companies need to determine an optimal print method for packaging that satisfies budgetary, environmental, demand and consumer requirements. Through the collection of quantitative data, consumer attention and purchase preference were evaluated for two different printing methods. Statistical analysis yielded no significant difference for participant’s attention when shopping for fruit drinks with digital or flexographic labels. It was also concluded that the position on the shelf made no significant difference for either label type. This study illustrates that consumers cannot significantly determine a difference between the two printing methods tested.

Author Contributions

Rupert Andrew Hurley: Designed study methodology, co-wrote manuscript;
Julie Rice: Executed study at PackExpo, wrote and edited manuscript;
David Cottrell: Executed study at PackExpo, edited manuscript;
Drew Felty: Designed study methodology, edited manuscript.

Conflicts of Interest

This study was possible provided by pool of donations from multiple companies to allow students to attend and complete a series of research projects at PackExpo 2014. It should be stated that a company who sells digital print technology did sponsor the study and provide the flexographic and digitally printed samples, but the authors consider the samples and methodology a fair representation of both processes.

References

  1. Golan, E.; Kuchler, F.; Mitchell, L.; Greene, C.; Jessup, A. Economics of food labeling. J. Consum. Policy 2001, 24, 117–184. [Google Scholar] [CrossRef]
  2. Rundh, B. The multi-faceted dimension of packaging. Br. Food J. 2005, 107, 670–684. [Google Scholar] [CrossRef]
  3. Kipphan, H. Handbook of Print Media: Technologies and Production Methods (Illustrated ed.); Springer: New York, NY, USA, 2001; pp. 976–979. [Google Scholar]
  4. White, S. Flexographic Printing vs. Digital Printing. Understanding the Variables that Affect the Selection of Label Printing Technology. Available online: http://www.labelvalue.com/documents/Flexographi-Printing-vs-Digital-Printing.pdf (accessed on 29 January 2015).
  5. Dunn, T. Flexible Packaging: Materials, Machinery, and Techniques; William Andrew Applied Science Publishers: New York, NY, USA, 2015; pp. 27–37. [Google Scholar]
  6. Johansson, K.; Lundberg, P.; Ryberg, R. Guide to Graphic Print Production, 3rd ed.; Wiley & Sons: Somerset, NJ, USA, 2011; pp. 325–326. [Google Scholar]
  7. Johnson, H. Mastering Digital Printing, 2nd ed.; Thompson Course Technology: Boston, MA, USA, 2005; pp. 19–20. [Google Scholar]
  8. Hurley, R.A.; Rice, C.J.; Conlon, G.; Tonkin, E.C.; O’Hara, L. The Impact of Simulated Kraft Substrates on Consumer Attention at the Point of Sale. J. Appl. Packag. Res. 2015, 7, 39–47. [Google Scholar] [CrossRef]
  9. Löfgren, M. Winning at the first and second moment of truth: An exploratory study. Manag. Serv. Qual. 2005, 15, 102–115. [Google Scholar] [CrossRef]
  10. Rawson, D.; Janes, I.; Jordan, K. Pilot Study to Investigate the Potential of Eye Tracking as a Technique for FSA Food Labelling Behaviour Research (Report for the FSA, 2008). Available online: http://www.food.gov.uk/sites/default/files/multimedia/pdfs/eyetracking.pdf (accessed on 10 May 2015.
  11. Graham, D.J.; Orquin, J.L.; Visschers, V.H.M. Eye tracking and nutrition label use: A review of literature and recommendations for label enchantment. Food Policy 2012, 37, 378–382. [Google Scholar] [CrossRef]
  12. Ares, G.; Gimeenez, A.; Bruzzone, F.; Vidal, L.; Antunez, L.; Maiche, A. Consumer Visual Proecessing of Food Labels: Results from an Eye Tracking Study. J. Sensory Sci. 2013, 28, 138–153. [Google Scholar] [CrossRef]
  13. INVINE. The Effect of the Wine Label. Available online: http://www.invine.com/2013/09/06/the-effect-of-the-wine-label/ (accessed on 24 July 2015).
  14. Valley Forge Tape & Label Co., Inc. Blog Page. Digital Label Printing vs. Flexographic Label Printing. Available online: http://vftl.com/blog/bid/235862/Digital-Label-Printing-vs-Flexographic-Label-Printing (accessed on 2 February 2015).

