Article

Construction and Experimental Validation of a Quantitative Kinetic Model of Nitric Oxide Stress in Enterohemorrhagic Escherichia coli O157:H7

Department of Chemical and Biological Engineering, Princeton University, Princeton, NJ 08544, USA
*
Author to whom correspondence should be addressed.
Bioengineering 2016, 3(1), 9; https://doi.org/10.3390/bioengineering3010009
Submission received: 21 November 2015 / Accepted: 1 February 2016 / Published: 6 February 2016
(This article belongs to the Special Issue Metabolic Engineering)

Abstract

:
Enterohemorrhagic Escherichia coli (EHEC) are responsible for large outbreaks of hemorrhagic colitis, which can progress to life-threatening hemolytic uremic syndrome (HUS) due to the release of Shiga-like toxins (Stx). The presence of a functional nitric oxide (NO·) reductase (NorV), which protects EHEC from NO· produced by immune cells, was previously found to correlate with high HUS incidence, and it was shown that NorV activity enabled prolonged EHEC survival and increased Stx production within macrophages. To enable quantitative study of EHEC NO· defenses and facilitate the development of NO·-potentiating therapeutics, we translated an existing kinetic model of the E. coli K-12 NO· response to an EHEC O157:H7 strain. To do this, we trained uncertain model parameters on measurements of [NO·] and [O2] in EHEC cultures, assessed parametric and prediction uncertainty with the use of a Markov chain Monte Carlo approach, and confirmed the predictive accuracy of the model with experimental data from genetic mutants lacking NorV or Hmp (NO· dioxygenase). Collectively, these results establish a methodology for the translation of quantitative models of NO· stress in model organisms to pathogenic sub-species, which is a critical step toward the application of these models for the study of infectious disease.

1. Introduction

Pathogenic Escherichia coli are responsible for a broad range of infections within humans depending on their pathotype, and these can generally be classified as enteric (diarrheagenic) or extraintestinal pathogenic E. coli (ExPEC) [1,2,3]. ExPEC can cause infections at most locations within the body (e.g., meningitis, pneumonia, sepsis, abdominal infection) [1], and the most common pathotype is uropathogenic E. coli (UPEC) [4], which are responsible for ~65%–75% of urinary tract infections (UTIs) [5]. Diarrheagenic E. coli are generally divided into six pathotypes; enterotoxigenic (ETEC), enteropathogenic (EPEC), enteroaggregative (EAEC), enteroinvasive (EIEC), diffusely adherent (DAEC), and enterohemorrhagic (EHEC). EHEC are potentially deadly, food-borne pathogens responsible for large outbreaks of hemorrhagic colitis (bloody diarrhea). These outbreaks often receive international attention, such as the 1996 outbreak in Japan that sickened over 8000 people [6], the 2006 spinach contamination in California affecting 205 individuals [7,8], and more recently the 2011 outbreak in Germany where ~4000 cases led to the highest incidence of hemolytic uremic syndrome (HUS) on record [9,10].
HUS can occur in up to 20%–25% of patients, and is the leading cause of death from EHEC [3,11,12]. The condition is caused by EHEC Shiga-like toxins (Stx) that are harbored on prophage and released during the phage lytic cycle in response to DNA damage [13]. When released, these toxins proceed to attack renal tissue where they inhibit translation through disruption of the 60S ribosomal subunit, leading to kidney failure [3,7,14,15,16]. Unfortunately, antibiotics are not recommended for treatment of EHEC infections for several reasons: (1) fluoroquinolones can stimulate prophage induction and Stx release; (2) β-lactams lyse EHEC to increase Stx exposure; and (3) destruction of the gut microbiome can enhance Stx absorption [3,11,17,18]. Furthermore, effective vaccines have yet to be developed, due to the challenges associated with a lack of human disease symptoms in EHEC-infected murine models, and Stx neutralizers have yet to show improved patient outcomes [3,11,19]. For these reasons, treatment of EHEC is largely restricted to supportive care [3], and the frequent outbreaks serve as important reminders of how helpless we are in our fight against these pathogens [11].
Kulasekara and colleagues conducted a genomic analysis of 100 different EHEC isolates, and found that the presence of a functional NO· reductase (NorV) correlated with an increased incidence of HUS [7]. EHEC strains possessing a functional NorV enzyme were associated with HUS incidences of up to 25%, whereas those with the inactive form of the enzyme (possessing a 204 nt in-frame deletion in the norV gene) exhibited fewer cases (up to a 10-fold reduction) of HUS [7,10]. Recent outbreaks have supported this association, such as the German outbreak in 2011, where the causative O104:H4 strain possessed a functional NorV [10]. The greater severity of infections caused by functional NorV-bearing EHEC isolates has been attributed to the protection NorV provides from the nitrosative stress exerted by immune cells, such as macrophages [20]. NorV is the main anaerobic NO· detoxification enzyme in E. coli [21,22,23,24], and NorV-proficient EHEC have been shown to exhibit reduced NO· levels, prolonged survival, and increased Stx production within macrophages compared to their NorV-deficient counterparts [20].
Under aerobic conditions, the major NO· detoxification system in E. coli is NO· dioxygenase (Hmp) [25,26,27]. Hmp has been identified as a virulence factor in many pathogens [28], including UPEC [29], Salmonella enterica serovar Typhimurium [30,31], Yersinia pestis [32], Staphylococcus aureus [33], and Vibrio cholerae [34]. Interestingly, a study by Vareille and colleagues found that NO· inhibits Stx production and release from EHEC under oxygenated conditions [35]. Likewise, Branchu and colleagues demonstrated that NO· inhibits the expression of many genes of the EHEC enterocyte effacement (LEE) pathogenicity island under aerobic conditions [36]. Since the vast majority of NO· in E. coli cultures is detoxified by Hmp under such conditions [23,25,27], it is tempting to postulate that EHEC can use Hmp to promote expression of its primary virulence factors under NO· stress in the presence of O2.
Since inhibitors of NorV or Hmp would have the potential to reduce kidney failure and death from EHEC, and humans do not possess a homologue to either protein (Section 2.10), they represent attractive targets for the development of therapies for EHEC infections. Furthermore, inhibitors specific to NO· detoxification enzymes should minimally impact the normal microbiome because NO· defenses are not essential functions for bacterial growth under normal conditions. Unfortunately, known chemical inhibitors of NO· reductases or dioxygenases (e.g., carbon monoxide or cyanide [37,38]) are toxic to humans, and have a greatly weakened effect on the flavodiiron active site used by the E. coli NorV [22,23]. Alternative targets in the NO· defense network of EHEC must therefore be identified; however, the broad reactivity of NO· and its reaction products give rise to a large, complex, and interconnected reaction network that includes biological effects ranging from iron-sulfur cluster destruction to inhibition of respiration and DNA damage [27,28,39,40,41]. The biological outcome of NO· exposure is dictated by a complex kinetic competition within this network, which necessitates the use of computational models for accurate interpretation, understanding, and analysis [27,28]. Such models can quantify the impact of different perturbations on the NO· response, and aid in identifying the underlying mechanisms [27,28,42,43]. Because previous models of NO· stress were developed for a non-pathogenic model organism (E. coli K-12), we sought to translate this approach and demonstrate its performance in the clinically-relevant pathogen, EHEC.
Here, we have constructed a quantitative kinetic model of the NO· stress response network in EHEC, which is composed of a system of differential mass balances that was translated from E. coli K-12 through a process involving literature and database examination, BLAST comparison of protein sequences, and relaxation of uncertain parameters. The model was trained on experimental measurements of [O2] and [NO·] from EHEC cultures and an MCMC algorithm was employed to populate an ensemble of viable models that could be used to assess parametric and prediction uncertainty. Given the low O2 tension typically associated with EHEC infection sites, experiments were performed under microaerobic (50 μM O2) and anaerobic (0 μM O2) conditions. The trained ensemble of models was able to quantitatively capture [NO·] dynamics in EHEC cultures treated with an NO·-releasing chemical, DPTA NONOate, under both O2 conditions. Furthermore, the ensemble was used to make forward predictions of [NO·] dynamics in cultures of EHEC mutants lacking either of the two major NO· detoxification enzymes, NorV and Hmp. The corresponding experiments were performed, and measurements exhibited excellent agreement with predictions. These results demonstrate that quantitative kinetic modeling of NO· stress can be extended to clinically-relevant strains under physiological O2 environments, which will facilitate deeper understanding of EHEC NO· defenses and could foster the development of alternative therapeutics for EHEC infections.

2. Materials and Methods

2.1. Chemicals and Growth Media

Cells were grown in Luria-Bertani (LB) Broth (BD Difco), or MOPS minimal media (Teknova) with 10 mM glucose. NO· was delivered to the cultures using DPTA NONOate ((Z)-1-[N-(3-aminopropyl)-N-(3-ammoniopropyl)amino]diazen-1-ium-1,2-diolate) (Cayman Chemical, Ann Arbor, MI, USA), which spontaneously dissociates with a half-life of ~2.5 h at 37 °C and pH 7.4 to release 2 equivalents of NO· per parent compound. For plasmid retention, all growth media contained 30 μg/mL kanamycin (Fisher Scientific) under oxygenated conditions, or 100 μg/mL kanamycin for anaerobic conditions (due to the reduced activity of kanamycin in the absence of respiration).

2.2. Bacterial Strains

Strains used in this study (Table 1) were derived from enterohemorrhagic E. coli O157:H7 TUV93-0 [44]. This strain natively possesses a 204 nt in-frame deletion within the norV gene that renders the protein inactive. To introduce a functional norV, TUV93-0 was transformed with a plasmid harboring the intact gene and its promoter (Section 2.3), yielding the TUV93-0 hmp+/norV+ strain. The norV-null strain used here, TUV hmp+/norV, refers to the native TUV93-0 transformed with an empty vector (pUA66 [45]), which was included to impart a similar metabolic burden to that in the norV+ strain. The TUV hmp/norV+ strain was generated by replacing hmp on the TUV93-0 chromosome with a kanR cassette using the lambda Red recombinase system [46], where the kanR cassette DNA was amplified from the purified genomic DNA of the Δhmp::kanR mutant in the Keio Collection [47] using primers 5′-TGAGATACATCAATTAAGATGCAAAA-3′ (forward) and 5′-AAGGGTTGCCGGATGTTT-3′ (reverse). The mutant was cured of the kanR marker using FLP recombinase encoded on the pCP20 plasmid [46], and confirmed via cPCR with two sets of primers: 5′-CCGAATCATTGTGCGATAACA-3′ with 5′-GCAAAATCGGTGACGGTAAA-3′ to check for the scar sequence, and 5′-TCCCTTTACTGGTGGAAACG-3′ with 5′-CACGCCCAGATCCACTAACT-3′ to confirm absence of hmp in the genome. The cured TUV Δhmp mutant was then transformed with the norV complementation plasmid to restore NorV functionality, yielding the TUV hmp/norV+ strain.
Table 1. E. coli strains used in the present study.
StrainGenotypeReference
TUV93-0EHEC O157:H7 EDL933 StxLeong, J.M. [44]
TUV hmp+/norV+TUV93-0 + pUA66-PnorV-norVThis work
TUV hmp+/norVTUV93-0 + pUA66This work
TUV hmp/norV+TUV93-0 Δhmp + pUA66-PnorV-norVThis work

2.3. Plasmid Construction

The norV complementation plasmid (pUA66-PnorV-norV) consisted of an SC101 origin of replication (low copy), a kanR resistance marker, and the norV gene with 188 nt of its 5′ UTR (PnorV), which was cloned from purified E. coli K-12 MG1655 genomic DNA. Only 188 nt of the 5′ UTR of norV was incorporated to avoid inclusion of the norR start codon, which begins 189 nt upstream of the norV coding sequence (on the complement DNA strand), and this 188 nt sequence is identical in E. coli K-12 and EHEC except for two single-nucleotide mutations. Briefly, the genomic DNA of an overnight culture of WT MG1655 grown in LB media was purified using the DNeasy Blood & Tissue Kit (Qiagen), following the manufacturer’s instructions for Gram-negative bacteria. The PnorV-norV DNA fragment was amplified from the purified genomic DNA using Phusion® High-Fidelity DNA Polymerase (New England Biolabs, Ipswich, MA, USA; NEB) with primers 5′-GCGCATCTCGAGTACGATCTTTGCCTCACTGTCAATTT-3′ (forward) and 5′-GCGCGGTCTAGATCATTTTGCCTCCGATG-3′ (reverse), which possessed XhoI and XbaI restriction enzyme (RE) cut sites, respectively. The PnorV-norV amplicon was gel-purified with the QIAquick Gel Extraction Kit (Qiagen), RE digested with XhoI and XbaI (NEB), and PCR-purified (Qiagen). Meanwhile, purified pUA66 plasmid (possessing the SC101 origin and kanR cassette) [45] was RE digested with XhoI and XbaI (NEB), PCR-purified, and treated with Antarctic Phosphatase (NEB) to prevent self-ligation of the linearized plasmid backbone. After Antarctic Phosphatase treatment, the plasmid backbone was PCR-purified. The PnorV-norV DNA fragment and linearized plasmid backbone were ligated using the Quick Ligation™ Kit (NEB), and transformed into XL1-Blue competent cells (Zymo Research, Irvine, CA, USA), which were immediately plated onto LB-agar plates containing 50 μg/mL kanamycin. Colonies were selected and grown overnight in LB with 30 μg/mL kanamycin, and the plasmid was purified (QIAprep Spin Miniprep Kit, Qiagen). The plasmid sequence was confirmed with PCR and sequencing of the PnorV-norV region of the plasmid (Genewiz).

2.4. Glovebox Setup and Operation

In order to perform measurements under microaerobic and anaerobic conditions, experiments were conducted in a Coy hypoxic chamber with an anaerobic upgrade. For microaerobic conditions, the atmosphere was maintained at 5.0% O2 v/v (corresponding to 50 μM dissolved O2 in MOPS minimal media at 37 °C), with 0.2% v/v CO2, and the balance N2. To achieve anaerobic conditions, the atmosphere contained 2% H2 to scavenge trace O2 via reduction to H2O on a palladium catalyst, as well as 0.2% CO2, and the balance N2.

2.5. Bioreactor Apparatus

A bioreactor was operated in the glovebox to facilitate NO· measurements in a culture exposed to environments with controlled O2 concentrations. The reactor consisted of a 50 mL conical tube with 10 mL of MOPS + 10 mM glucose media, open to the glovebox environment, and stirred constantly with a 0.5 inch magnetic stir bar. The conical tube was suspended in a magnetically stirred beaker of water maintained at 37 °C with a stirring hotplate.

2.6. NO· Treatment Assay

One mL of LB media with 10 mM glucose was inoculated with a small scrape of E. coli cells from a −80 °C frozen stock, and grown at 37 °C and 250 r.p.m. under aerobic conditions for 4 h. A new test tube of 1 mL fresh LB + 10 mM glucose was inoculated with 10 μL of the pregrowth, and placed in the glovebox to grow overnight (16 h) at 37 °C and 200 r.p.m. under O2 environments of 50 μM (microaerobic) or 0 μM (anaerobic). A 250 mL baffled shake flask containing 20 mL of fresh MOPS minimal media with 10 mM glucose, which had been equilibrated with the glovebox atmosphere overnight, was inoculated with the overnight culture to an OD600 of 0.01, and grown at 37 °C and 200 r.p.m. Upon reaching an OD600 of 0.2, the flask culture was used to inoculate the bioreactor (containing 10 mL of MOPS + 10 mM glucose) to an OD600 of 0.05, which was immediately treated with 50 μM DPTA NONOate. The concentration of NO· was monitored continuously for 1 h following treatment using an ISO-NOP electrode (World Precision Instruments).

2.7. Respiration (O2 Consumption) Assay

To train the respiratory module of the model, TUV hmp+/norV+ was grown identically as described for the NO· treatment assays (Section 2.6), except it was not treated with DPTA NONOate following inoculation into the bioreactor. Instead, dissolved [O2] in the culture was continuously monitored (1 read/sec) for up to 10 min post-inoculation, using a fiber-optic O2 sensor (FireStingO2 robust miniprobe; PyroScience).

2.8. Model Simulation

The kinetic model was constructed as described previously [27], and adapted for EHEC physiology using the process described in Section 3.1. Briefly, the model is composed of a set of ordinary differential equations (ODEs) describing the change in biochemical species concentrations over time, as a function of the associated reaction rates. Expressed in matrix form, the governing set of equations is written:
d C d t = S r
where C is a vector of biochemical species concentrations, S is the reaction stoichiometry matrix, and r is a vector of reaction rates. Reaction rates are a function of associated species concentrations and kinetic parameter values. The reactions and species were partitioned into intracellular and extracellular compartments to enable experimental parameterization and validation of model predictions [27,48], where NO· and O2 were assumed to diffuse rapidly across the membrane [49,50]. For further details on model compartmentalization, see [48]. Simulations were run in MATLAB (The MathWorks, Inc.) using the ode15s function to numerically integrate the system of ODEs, and solve for biochemical species concentrations as a function of time. The model is available for download on our research group website (https://www.princeton.edu/cbe/people/faculty/brynildsen/group/software/).

2.9. Parameter Optimization

Model parameters were optimized using a two-stage process. The first stage employed the MATLAB lsqcurvefit function, whereby parameter values were optimized such that the variance (σ2)-normalized sum of the squared residuals (SSR) between the measured (ymeas) and simulated (ysim) data (e.g., NO· or O2 concentrations) was minimized:
S S R = i = 1 n ( y i , m e a s y i , s i m ) 2 σ i , m e a s 2
The non-convex nature of the optimization problem yields local minima, which are dependent on the initial parameter values. To improve coverage of the solution space, least-squares minimizations were repeated 1000 times, each initiated with random parameter values drawn from a uniform distribution that spanned the permitted bounds.
The second stage of parameter optimization involved a Markov chain Monte Carlo (MCMC) method [51], whereby a random walk through parameter space was performed, starting from the best-fit (lowest SSR) parameter set obtained from the previous nonlinear least squares minimization. Relative quality of fit was quantified by the evidence ratio (ER), which was determined from the Akaike Information Criteria (AIC) corrected for small sample sizes [52,53], as described previously [48]. Briefly, the AIC was calculated for each parameter set using the following formula [54]:
AIC i = n ln ( SSR i n ) + 2 k + 2 k ( k + 1 ) n k 1
where n represents the number of data points and k is the number of fit parameters plus one (to account for the SSR estimation) [54]. The weight of evidence (w) of each parameter set in a collection of P parameter sets was calculated from the AIC values [54]:
w i = exp ( Δ i / 2 ) i = 1 P exp ( Δ i / 2 ) ,   Δ i = AIC i min ( AIC )
From the Akaike weights, the evidence ratios (ER) of each parameter set, which represents the likelihood of each parameter set relative to the best-fit parameter set, were calculated [55]:
ER i = w best w i
where wbest is the Akaike weight of the parameter set with the lowest AIC value (best fit). Parameter sets exhibiting an ER > 10 (i.e., less than 10% as likely as the best-fit parameter set) were discarded. If the MCMC process improved the AIC such that the ER of the initial parameter set was greater than 10, the walk was repeated, using the new best-fit parameter set as the new initial set.
In addition to identifying more optimal parameter sets, the MCMC method revealed information on the flexibility, or confidence of parameter values. Confidence intervals (CIs) for parameters were calculated as the range of parameter values among all parameter sets with an ER < 10. Parameters with relatively narrow CIs were more informed by the optimization than those with a relatively wide CI.

2.10. BLAST Comparison of Proteins

Similarities of amino acid sequences between E. coli K-12 MG1655 and E. coli O157:H7 EDL933 proteins were determined via BLAST on the BioCyc Database [56], where MG1655 amino acid sequences were queried in the EDL933 genome with an expectation value threshold of 10, no filtering of query sequence for low-complexity regions, and the default BLOSUM62 substitution matrix.
For the searches of a Hmp or NorV homologue in humans, a BLAST analysis was conducted on the NCBI Database, querying for the E. coli EDL933 Hmp or E. coli MG1655 NorV amino acid sequence (MG1655 was used for NorV since the sequence is mutated in EDL933) in the Homo sapiens genome (Annotation Release 107) using default algorithm parameters (expectation threshold of 10, BLOSUM62 matrix).

3. Results

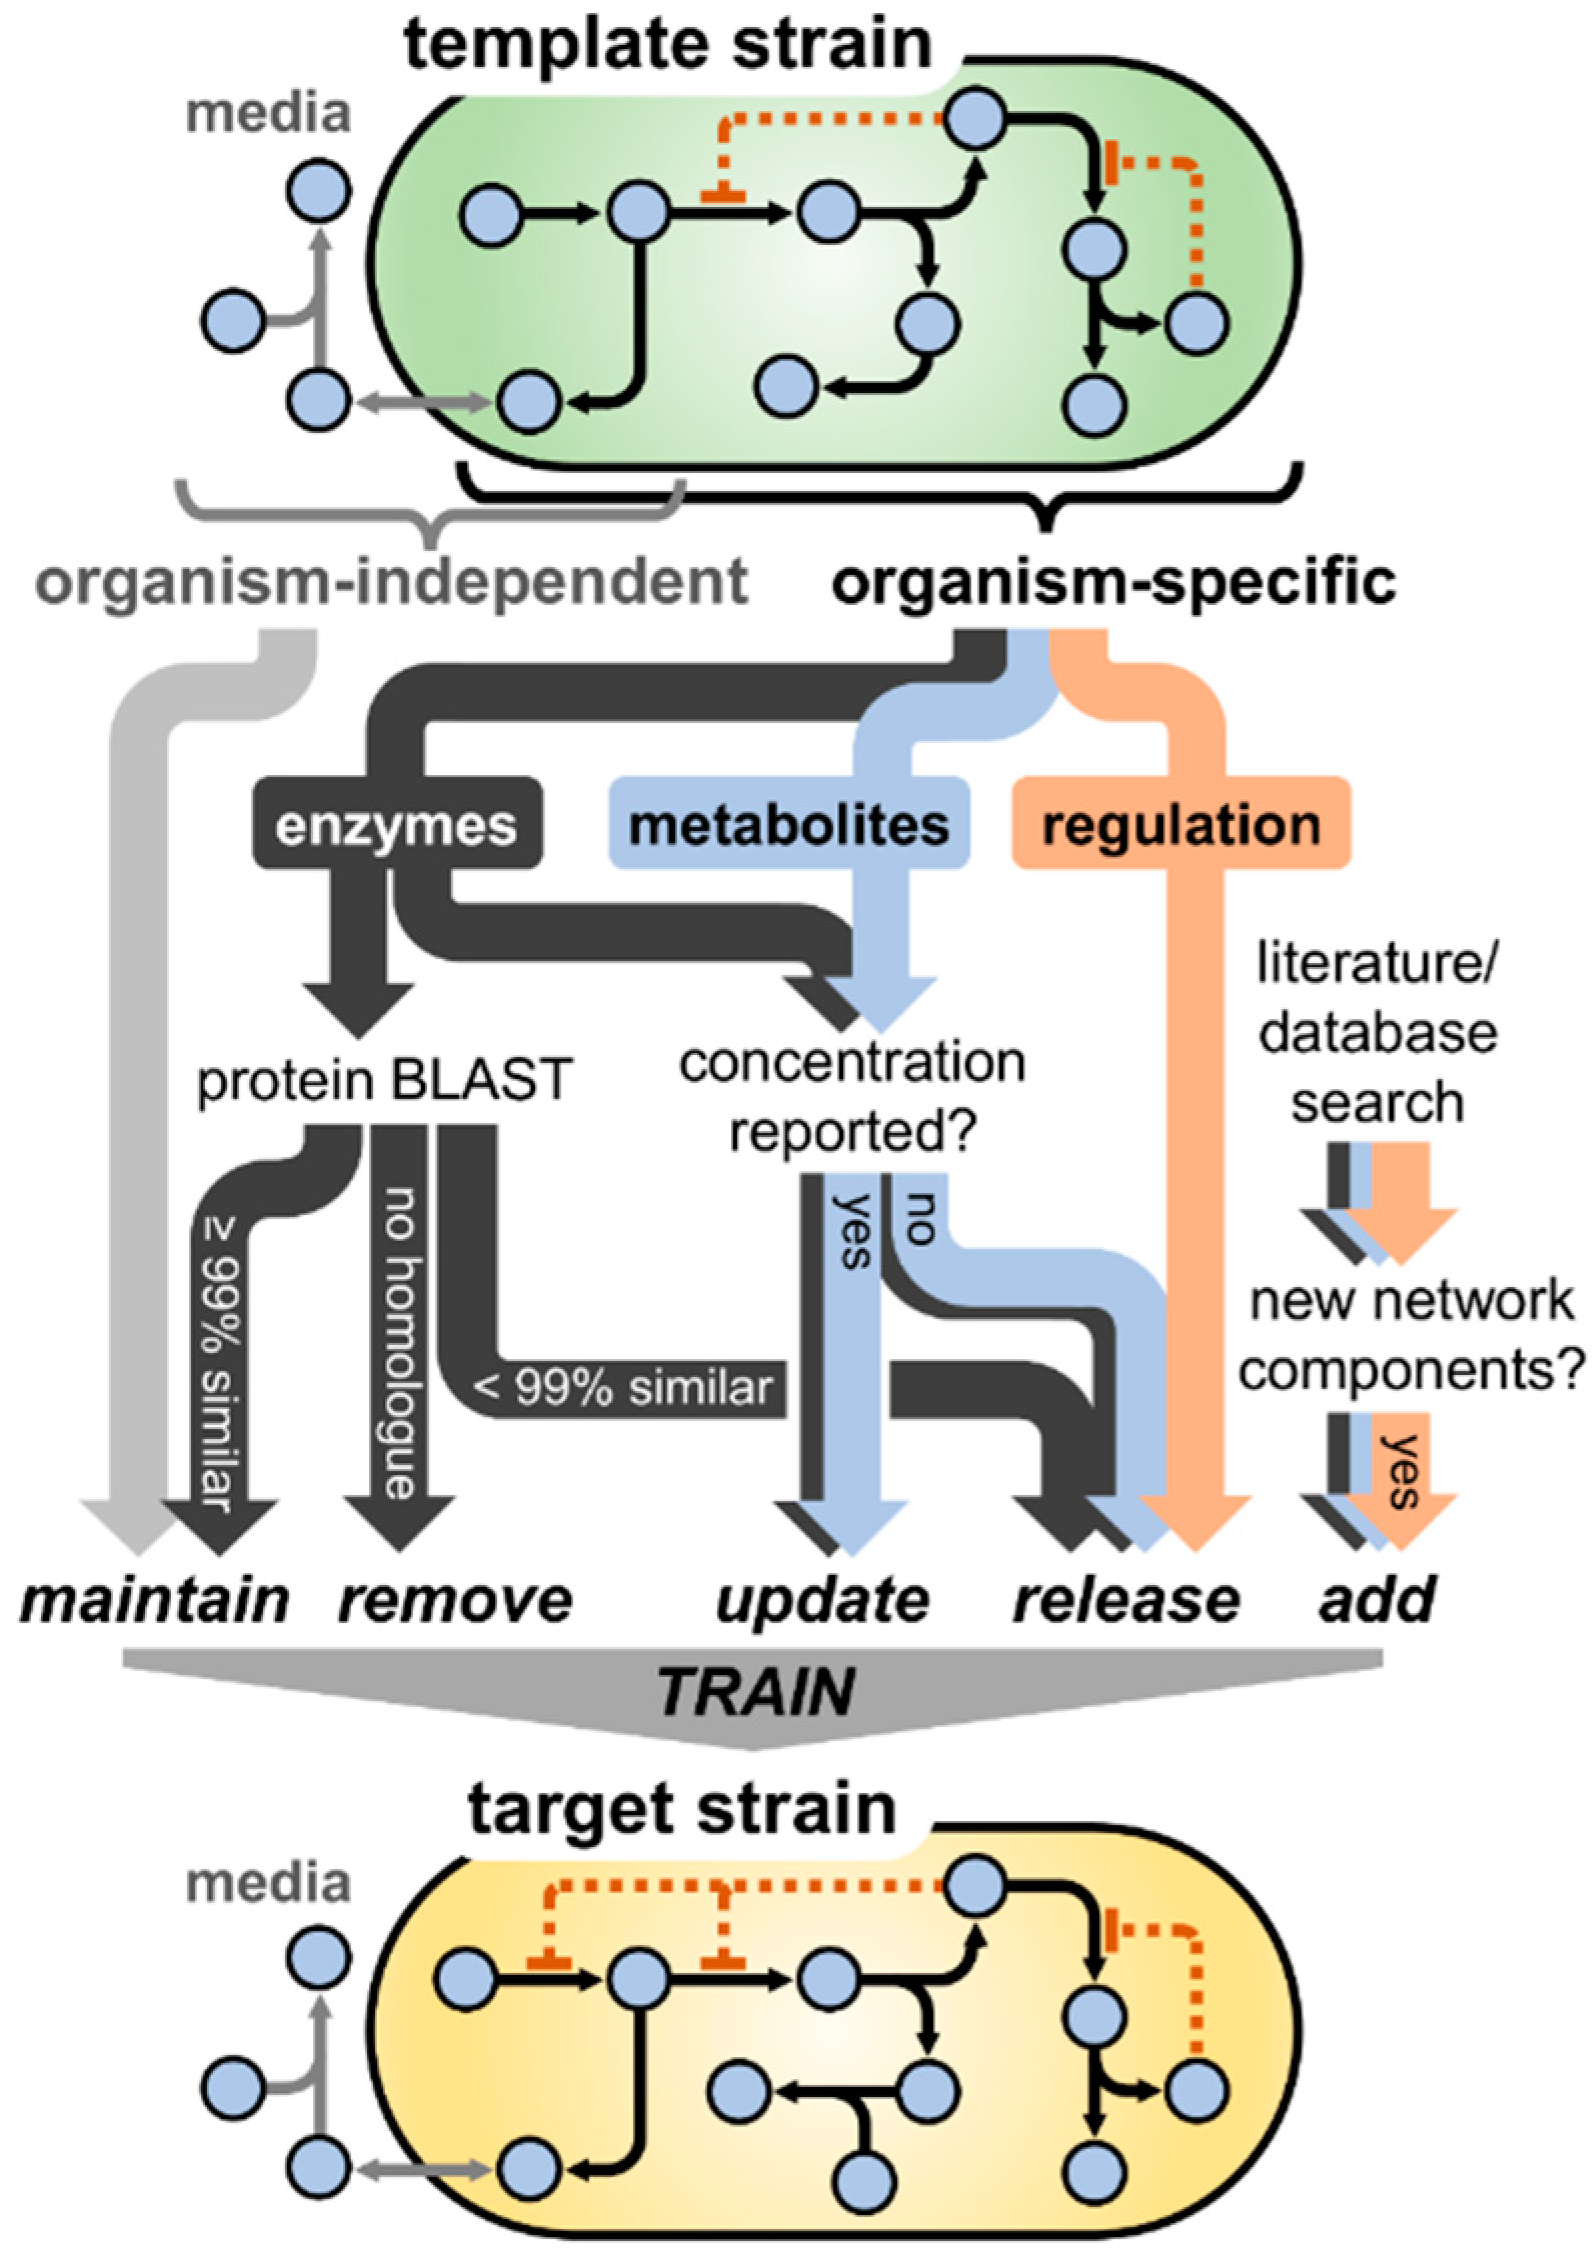
3.1. Model Translation from E. coli K-12 to Enterohemorrhagic E. coli O157:H7

To facilitate quantitative investigations of the EHEC NO· defense network, we constructed a kinetic model comprised of the relevant reactions and biomolecules involved in NO· stress. Beginning with a previously constructed model of the NO· response network of non-pathogenic E. coli (K-12 MG1655), the model was translated to represent EHEC physiology, accounting for potential and known differences in elements such as transcriptional regulation, metabolite concentrations, and enzyme kinetics. A schematic summarizing the model translation procedure is presented in Figure 1.
Sparse data existed in the literature on EHEC enzyme kinetics at the time of the present study, preventing the use of literature data to inform model parameters. We therefore performed a BLAST analysis to compare protein sequences between EDL933 (the parent of TUV93-0) and MG1655 for all enzymes in the model, with the assumption that enzymes with sufficiently similar amino acid sequences (≥99% match) would exhibit similar kinetics. Of the 20 enzymes (42 subunit proteins) present in the model, only 4 (5 subunits) exhibited amino acid sequences with less than 99% similarity between EDL933 and MG1655 (Table S1). These consisted of enzymes involved in DNA base excision repair (XthA and AlkA, 98.1% and 97.2% similar to that of MG1655, respectively), a subunit of NADH dehydrogenase I (NuoN, 87.2% similar), and NO· reductase NorVW (85.4% and 97.9% similarity for NorV and NorW, respectively). The difference in NorV for EDL933 has been noted previously, where this and some other EHEC strains possess a norV sequence with a 204 nt in-frame deletion that renders the protein inactive (commonly referred to as norVs) [7,20]. To enable analysis of both Hmp and NorV activity in the present study, a functional NorV was introduced into EHEC on a plasmid (Section 2.2 and Section 2.3).
Figure 1. Schematic of the process of translating the NO· stress model from one bacterial strain (“template strain”) to another (“target strain”). Beginning with the original model constructed for the template strain, model components were categorized as organism-independent (e.g., NO· exchange with the gas phase) or organism-dependent (e.g., NO· reductase activity). Although the extracellular (media) compartment contains a high frequency of organism-independent components, many are also present intracellularly (e.g., NO· autoxidation). Parameters governing organism-independent processes were maintained at the same value, whereas those dependent on the species were handled differently depending on whether they governed enzyme activity, metabolite/biomolecule concentration, or transcriptional regulation. A BLAST analysis was conducted for each enzyme in the model, where parameters associated with enzymes exhibiting ≥99% amino acid similarity between the template and target strain were maintained at their original value, <99% similarity were released (allowed to vary) for subsequent training, and enzymes with no homologue in the target strain were removed entirely. If metabolite or enzyme concentrations were reported in the literature for the target strain, their values were updated in the model; however, if the concentrations had not been measured previously, they were released to be estimated during the training process. Given the relative complexity and large number of factors influencing the dynamics of transcriptional regulation, parameters governing these processes were released during model training. Finally, any additional network components (enzymes, metabolites, regulatory interactions) found in the literature to be involved in the NO· stress network of the target organism that were not present in the original construction were added to the model. Upon finalizing the model structure, the unknown/released parameters were trained (optimized) on experimental measurements with the target organism (e.g., NO· detoxification and respiratory O2 consumption).
Bioengineering 03 00009 g001
Given the potential differences in metabolite concentrations and transcriptional regulation between the two E. coli strains, we relaxed all regulatory parameters and species concentrations, allowing them to vary within one order of magnitude of the MG1655 value when training on experimental measurements.

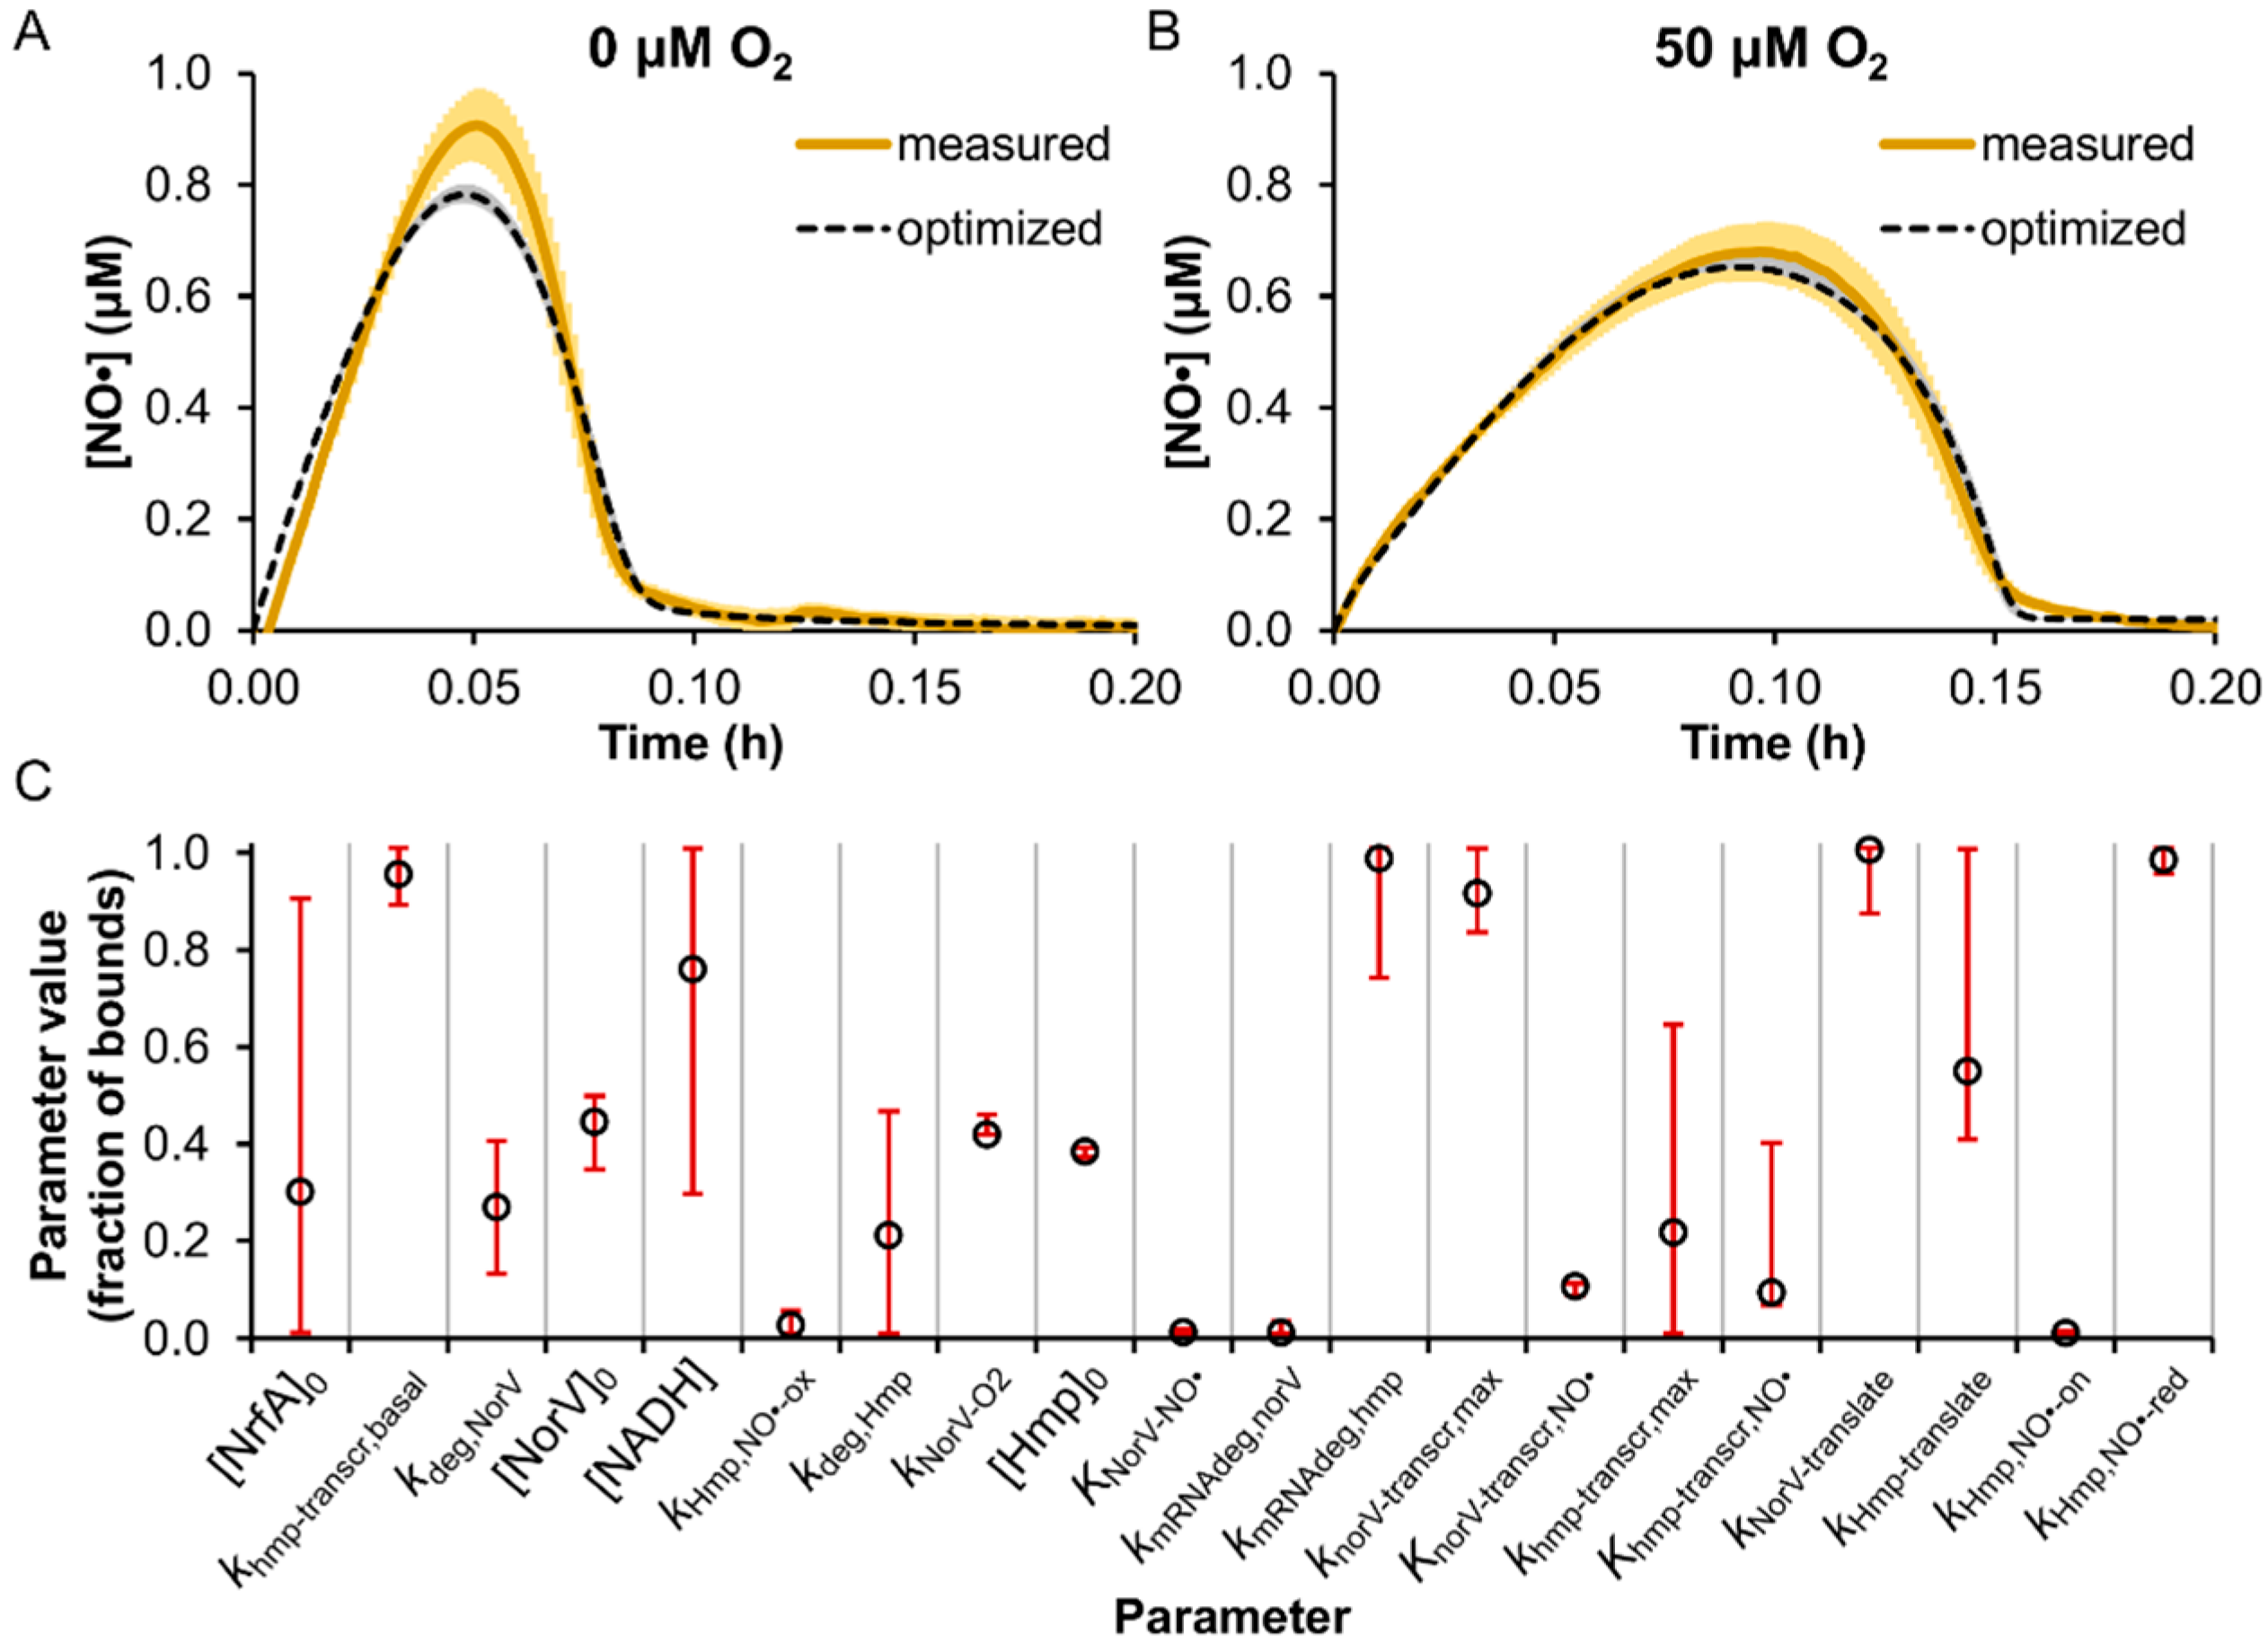
3.2. Model Parameter Training and Sensitivity Analysis

Extracellular parameters specific to the experimental apparatus (rate of DPTA NONOate dissociation, kNONOate, autoxidation rate of NO·, kNO·-O2, and the NO· volumetric mass transfer coefficient, kLaNO·) were trained on [NO·] measured in cell-free MOPS minimal media containing 10 mM glucose following treatment with 50 μM DPTA NONOate in an environment of 50 μM O2 (Figure S1 and Table S2). DPTA NONOate is an NO·-releasing chemical that dissociates with a half-life of approximately 2.5 h (at 37 °C, pH 7.4) to release two moles of NO· per mole of parent compound. Given the modest decrease in pH of anaerobically grown EHEC cultures (pH = 7.2 instead of 7.4), the DPTA release rate (kNONOate) was trained on cell-free MOPS media treated with 50 μM DPTA under anaerobic conditions, with the pH adjusted to 7.2 with HCl, while the other two extracellular parameters (kNO·-O2 and kLaNO·) were held constant. The volumetric mass transfer coefficient governing the exchange of dissolved O2 with the gas phase (kLaO2) was determined by measuring dissolved [O2] in cell-free media following degassing with N2. The data were plotted as ln([O2]sat—[O2]) vs. time, and a line was fit to the points, where the negative of the slope corresponded to the kLaO2 (1.25 × 10⁻³·s−1). After obtaining the extracellular parameter values, parameters governing the respiratory module (cytochrome ubiquinol oxidases and NADH reductases) were trained on O2 measurements in a culture of EHEC inoculated into the bioreactor to an OD600 of 0.05 (Figure S2 and Table S3).
Uncertain model parameters (68), defined as those not present in the literature or not sufficiently similar to MG1655, were trained on [NO·] measurements in TUV hmp+/norV+ cultures treated with 50 μM DPTA NONOate under microaerobic (50 μM O2) and anaerobic (0 μM O2) conditions (Table S4). The NO· concentration was monitored continuously (>1 read/sec) following DPTA treatment (Figure 2).
Figure 2. Model training on [NO·] measurements in enterohemorrhagic Escherichia coli (EHEC) cultures at 0 and 50 μM O2. TUV hmp+/norV+ were treated with 50 μM DPTA NONOate at an OD600 of 0.05 under conditions of (A) 0 μM O2 or (B) 50 μM O2, and the resulting [NO·] was measured (solid yellow line; mean of 3 independent experiments, with light yellow shading representing the SEM). Simulated [NO·] curves for each condition are shown (dashed black lines), and were obtained using the best-fit parameter set from the model training process, where gray shading represents the range of simulated [NO·] curves from the ensemble of viable parameter sets (ER < 10). (C) Parameter values (expressed as a fraction of the allowed bounds) obtained from the MCMC analysis are shown, where open circles are the best-fit parameter set (ER = 1), and error bars represent the viable range (min and max) that maintained an ER < 10. Descriptions of parameter names can be found in Table S4.
Bioengineering 03 00009 g002
A nonlinear least-squares minimization was performed to determine parameter values yielding the minimum sum of the squared residuals (SSR) between the simulated and measured [NO·] at 0 and 50 μM O2 (see Section 2). To perform an efficient MCMC search of the parameter space [51], a follow-up sensitivity analysis was executed to assess which parameters had an appreciable impact on [NO·] dynamics, whereby each of the parameters were individually varied among 100 evenly spaced values spanning their allowed range. Parameters whose variation resulted in more than a 5% increase in the SSR (Figure S3) were explored further using the MCMC approach (Figure 2C and Table S4) (see Section 2).
The parameters found to exert the greatest impact on the agreement between simulated and measured [NO·] curves (SSR) were primarily associated with Hmp and NorV, which was expected given that these enzymes are known to be the dominant E. coli NO· detoxification systems under oxygenated and anaerobic conditions, respectively [21,22,23,24,27,57,58,59]. Concentrations of NrfA and NADH were also found to impact the SSR, though to a lesser extent relative to Hmp- and NorV-related parameters, and the MCMC analysis revealed that their values were only mildly constrained.

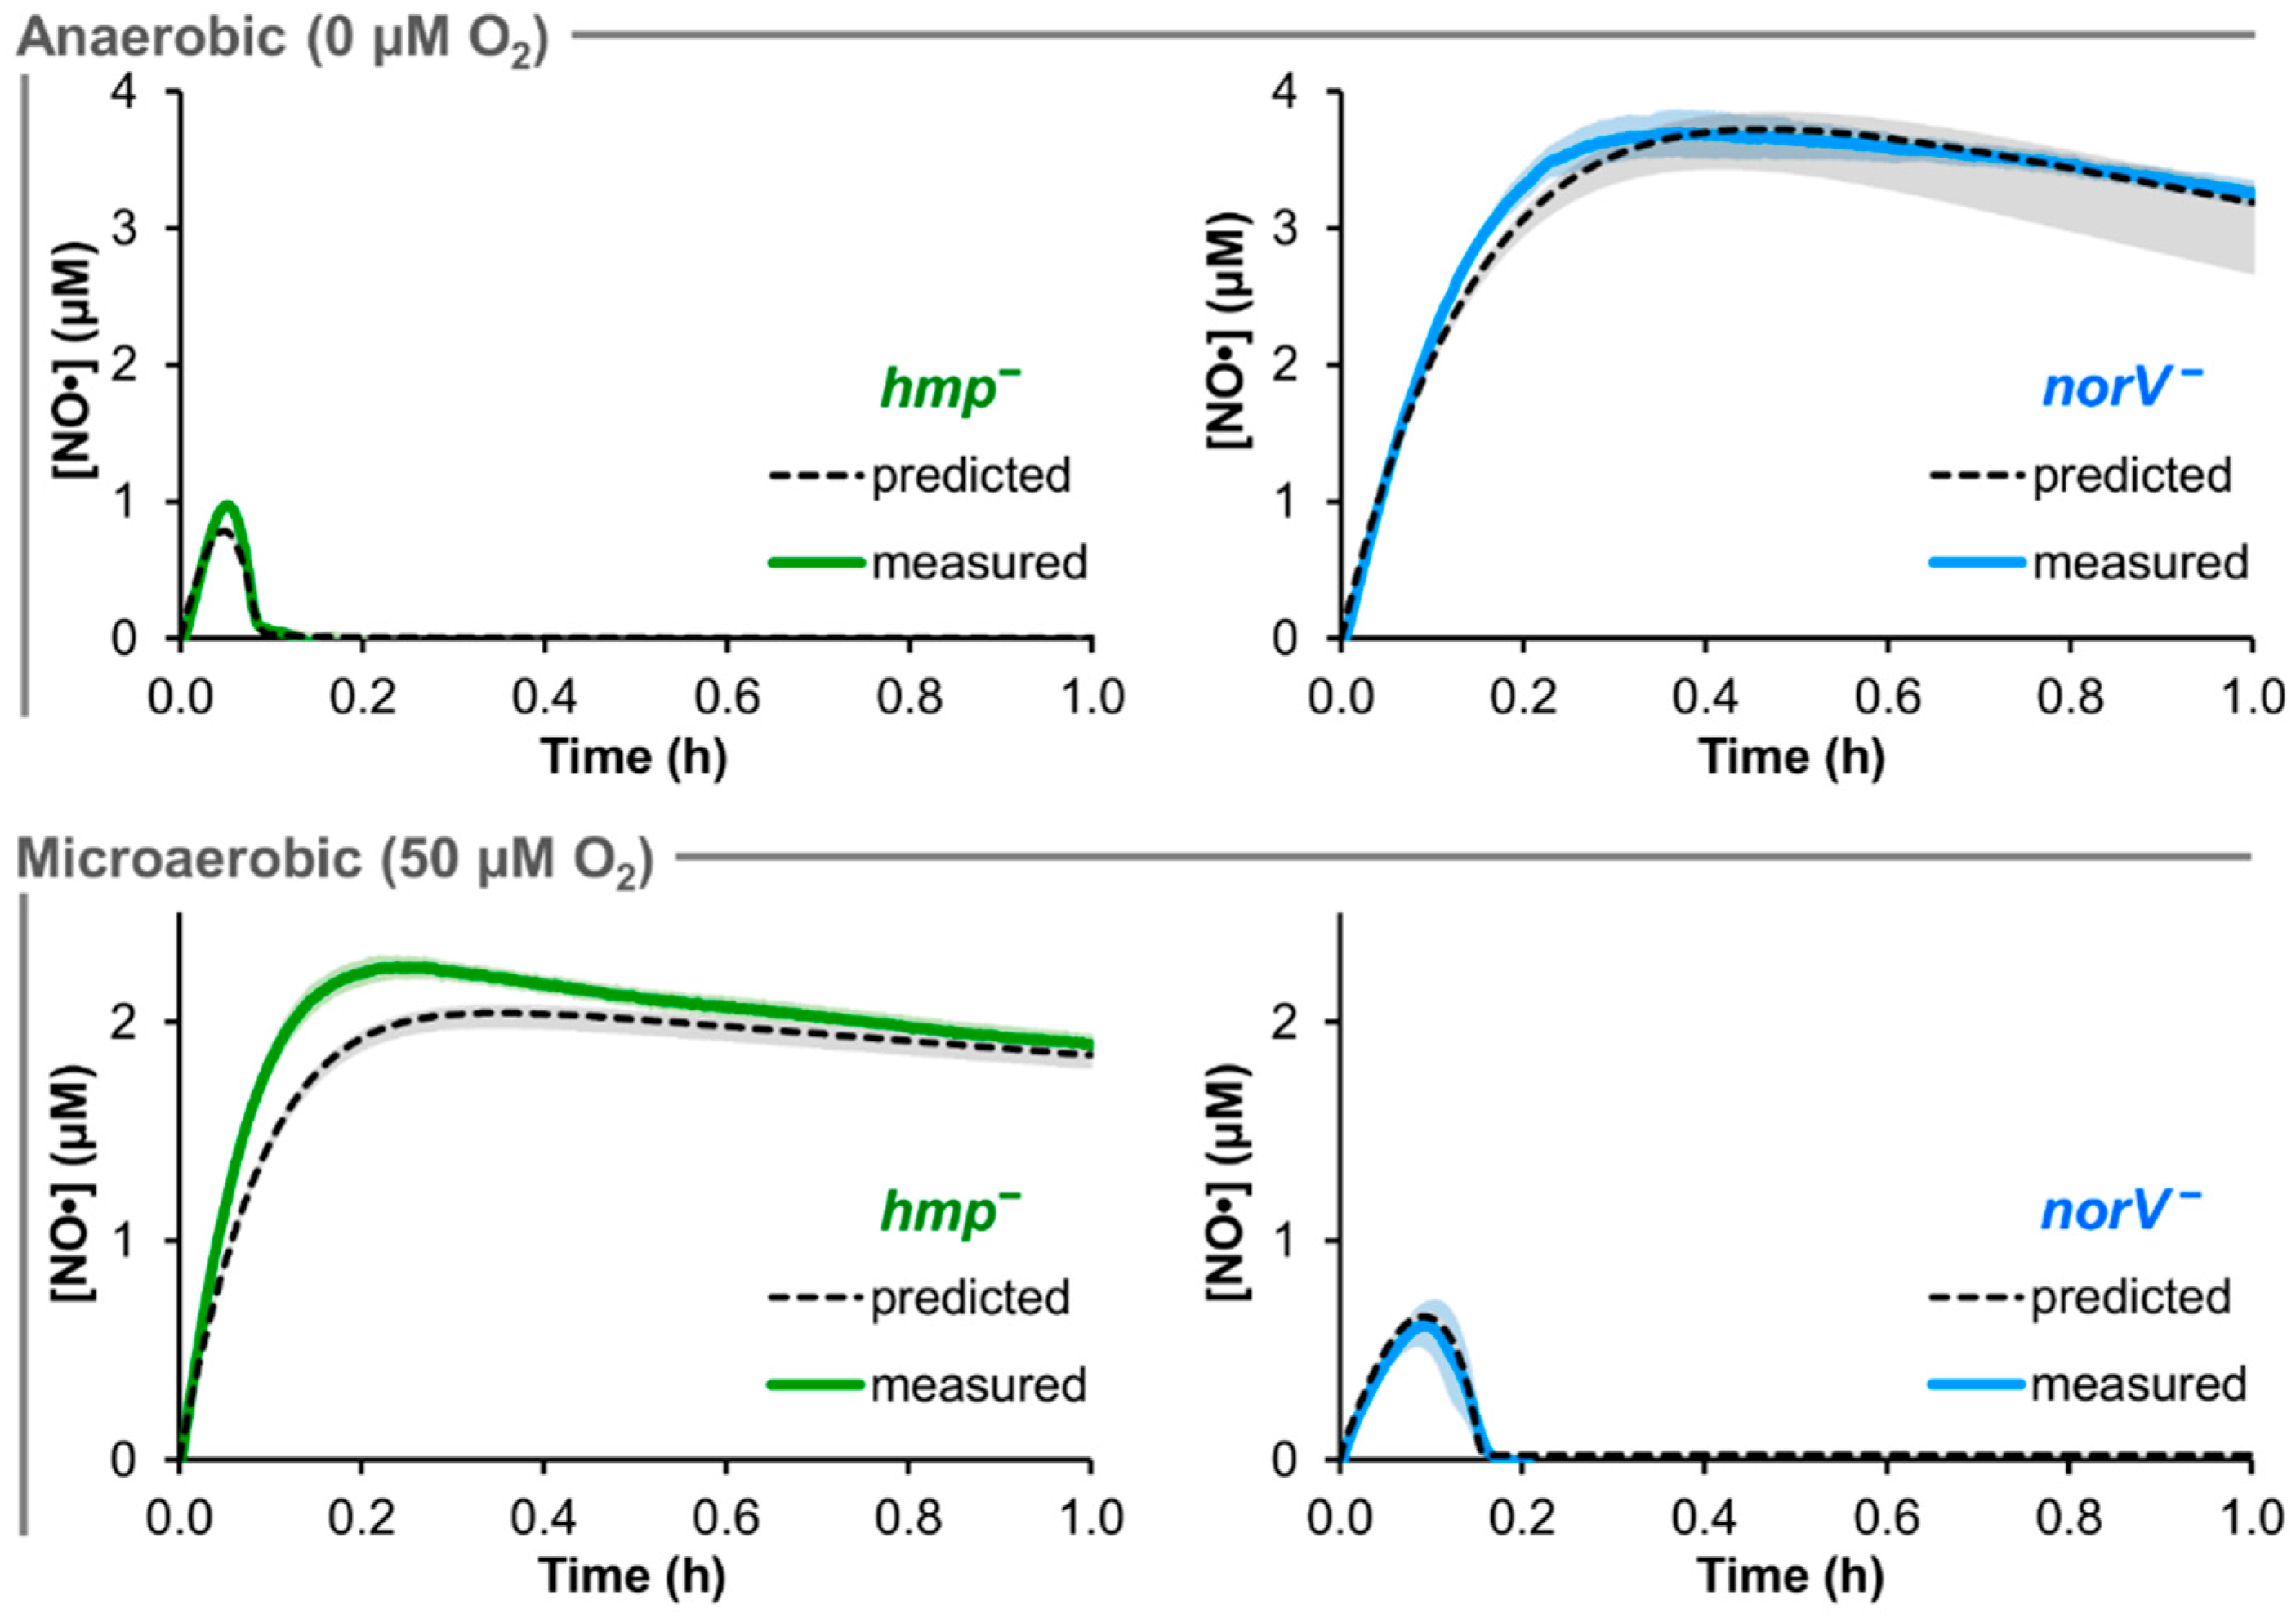
3.3. Prediction of EHEC NO· Detoxification Dynamics in the Absence of Hmp or NorV

The predictive accuracy of the trained EHEC model was assessed with genetic removal of the two major NO· detoxification enzymes, Hmp and NorV. The genes were deleted synthetically (in the model) by setting their concentration and transcription rate to zero. Using the ensemble of parameter sets that sufficiently captured the TUV hmp+/norV+ [NO·] curves (ER < 10), NO· treatment (50 μM DPTA NONOate) was simulated for cultures of TUV hmp/norV+ and hmp+/norV in environments of 0 and 50 μM O2 (Figure 3).
Figure 3. Comparison of predicted and measured [NO·] at 0 and 50 μM O2 for hmp and norV EHEC. 50 μM DPTA NONOate treatment was simulated for conditions of 0 and 50 μM O2 in cultures of TUV hmp/norV+ and hmp+/norV at an OD600 of 0.05, where the black dashed line was obtained using the best-fit parameter set, and gray shading represents prediction uncertainty (range of viable parameter sets with ER < 10). The corresponding experiments for each condition and mutant were performed, and are shown as solid green (hmp/norV+) or solid blue (hmp+/norV) curves (mean of 3 independent experiments, with light shading of the same color representing the SEM).
Bioengineering 03 00009 g003
Under anaerobic (0 μM O2) conditions, NO· consumption by the norV EHEC was predicted to be largely negligible, while the simulated hmp [NO·] was virtually identical to that of the hmp+/norV+ strain. Prediction uncertainty was relatively low for hmp at 0 μM O2 (<0.05 μM variation in simulated [NO·]), but was slightly heightened for norV (maximum variation of ~0.6 μM NO·). For the 50 μM O2 conditions, the predicted behavior for the two mutants was exchanged, where norV simulations now exhibited NO· clearance similar to that of TUV hmp+/norV+, while NO· detoxification was severely impaired in hmp cultures. Simulations exhibited little uncertainty in [NO·] for either mutant at 50 μM O2, with ≤0.1 μM variation in predicted [NO·].
Corresponding experimental NO· treatment assays were performed with TUV hmp/norV+ and hmp+/norV cultures at 0 and 50 μM O2. The resulting measured [NO·] curves were in excellent agreement with model predictions for both mutants under both O2 conditions (Figure 3). Experimental confirmation of the quantitative accuracy in predicted NO· dynamics for mutants lacking either of the two major NO· detoxification systems in EHEC demonstrated a successful translation of the NO· kinetic modeling approach to this medically-relevant pathogen.

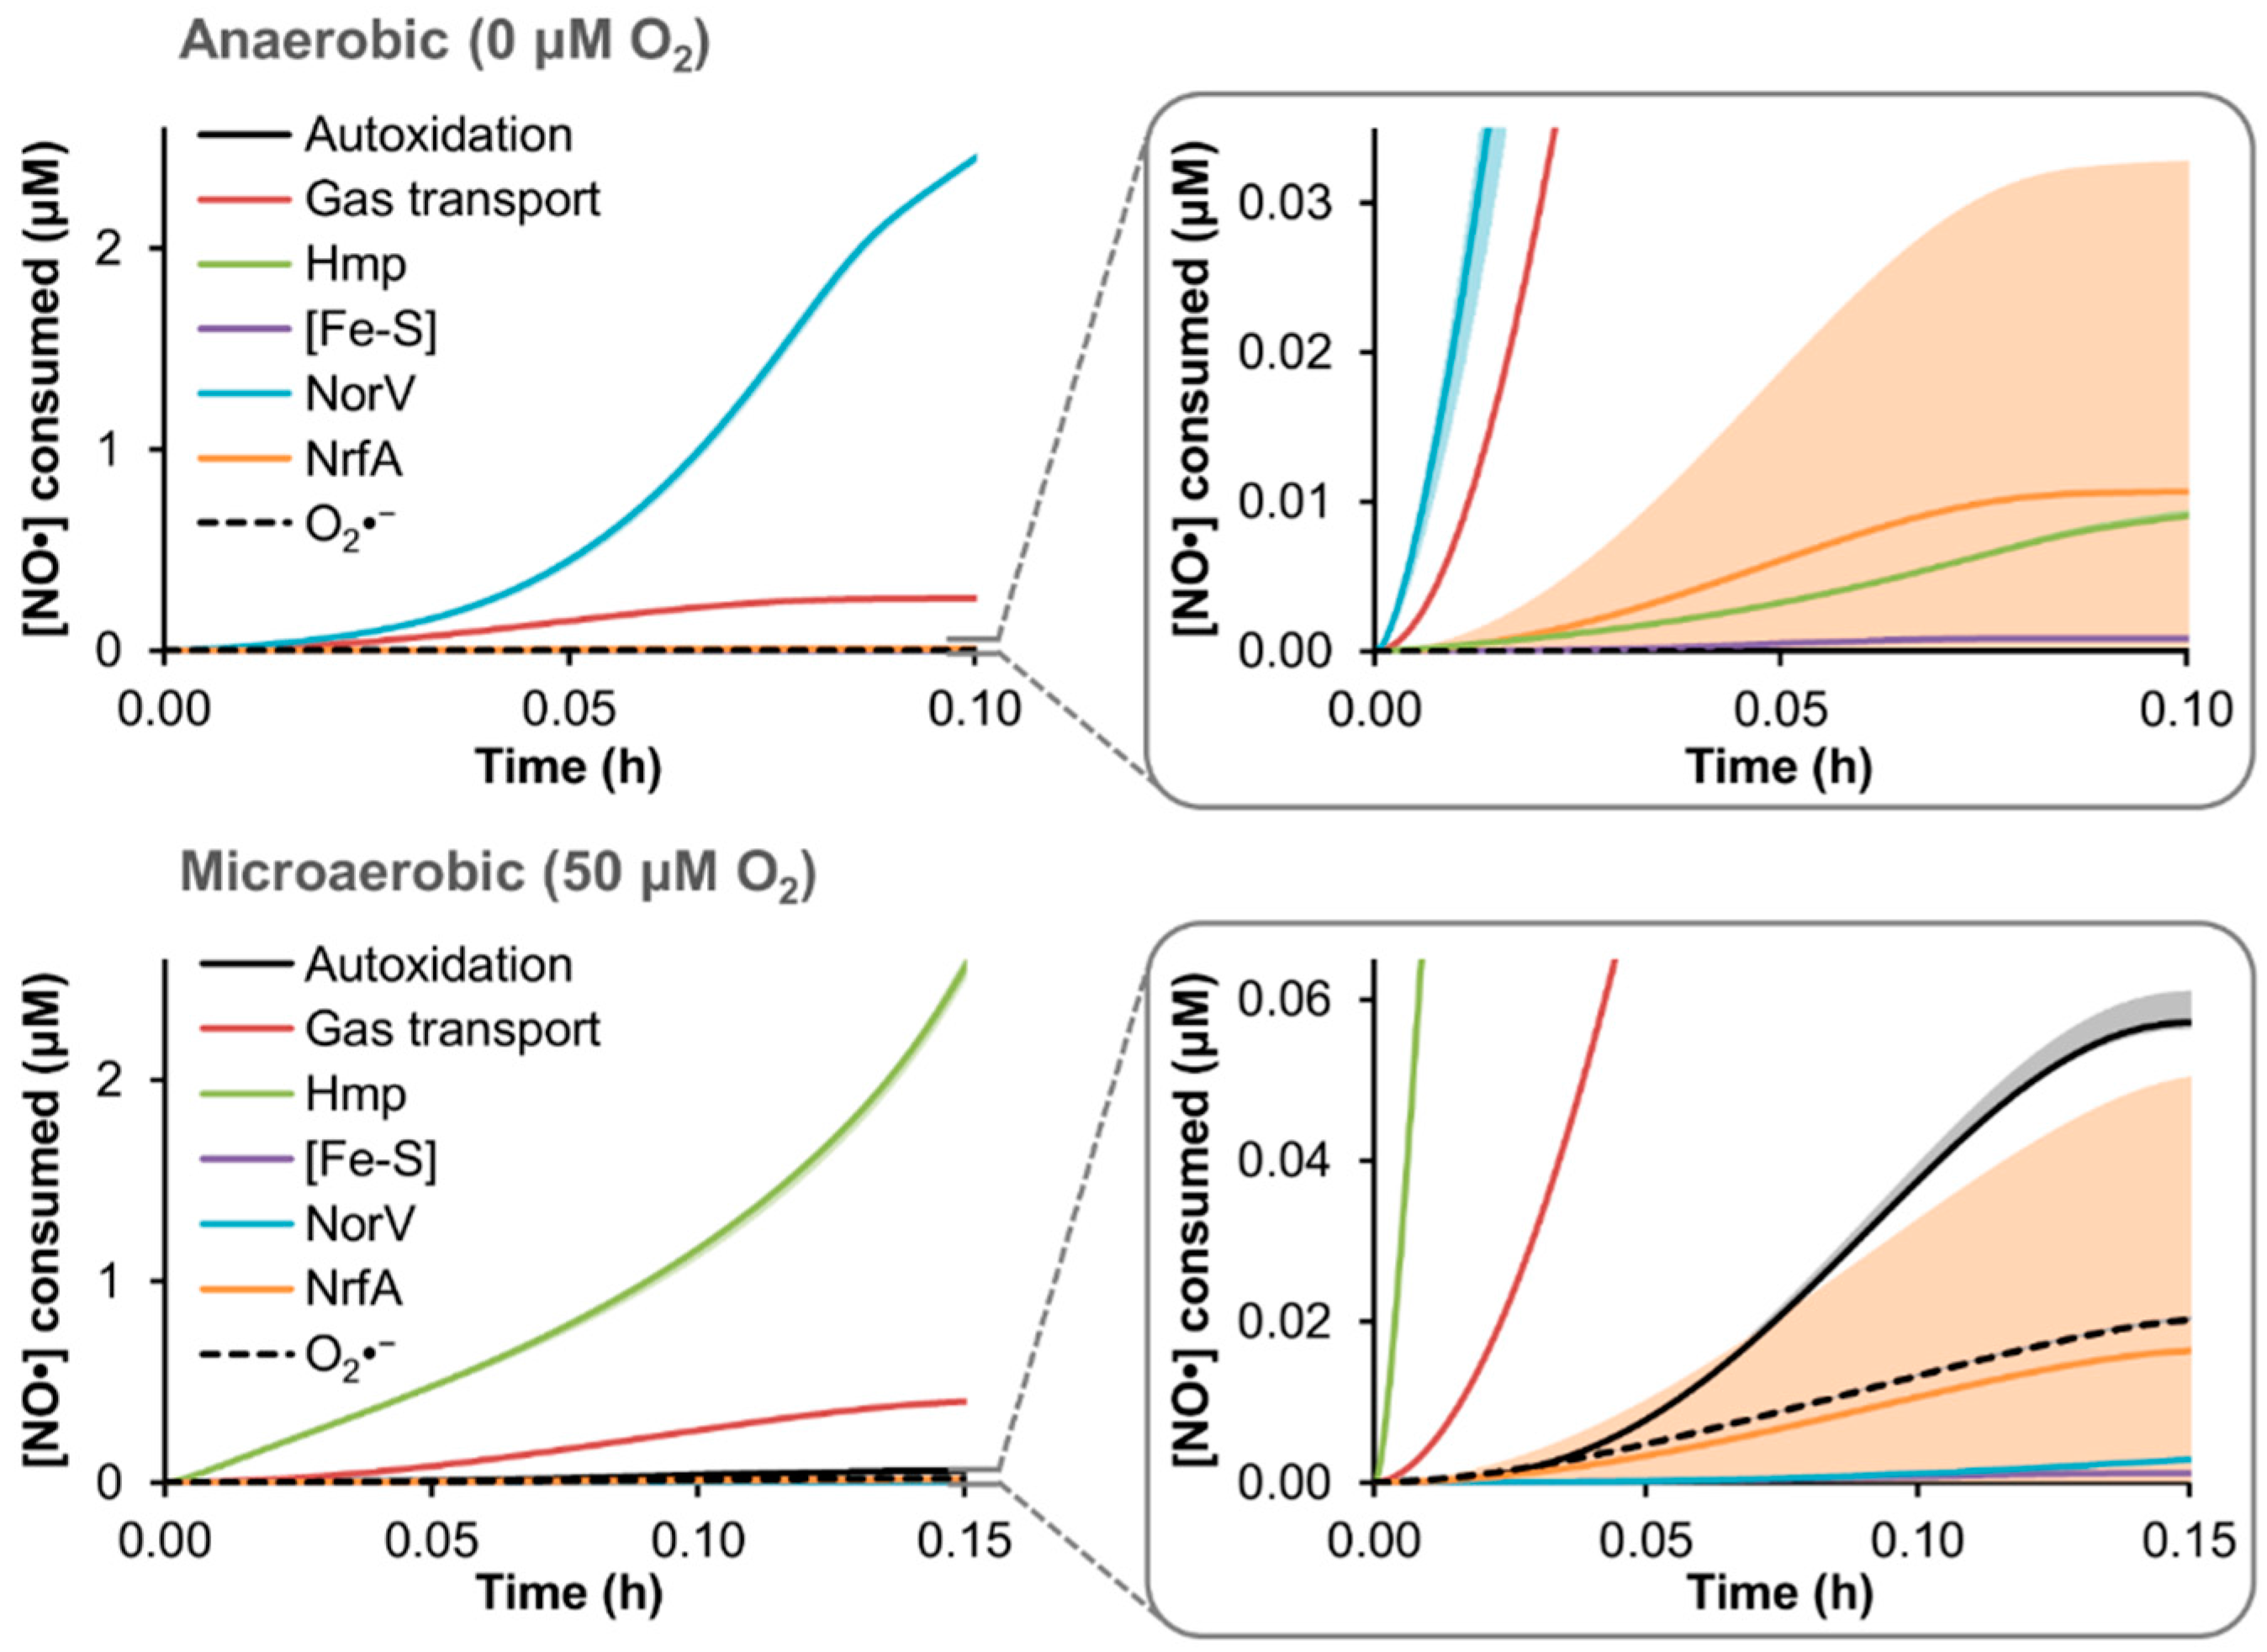
3.4. Predicted Distribution of NO· Consumption

Upon confirming that model simulations could quantitatively capture EHEC NO· detoxification dynamics under two different O2 regimes, and accurately predict the behavior of genetic mutants lacking either of the major NO· defense systems (TUV hmp/norV+ and hmp+/norV), we sought to use the model to quantify the distribution of NO· flux through the reaction network in TUV hmp+/norV+ cultures treated with 50 μM DPTA NONOate. DPTA treatment was simulated for conditions of 0 and 50 μM O2, and the resulting cumulative NO· consumption by each of the available pathways was quantified (Figure 4).
Figure 4. Simulated distribution of NO· consumption in an EHEC culture. The model was used to simulate treatment of a TUV hmp+/norV+ culture at an OD600 of 0.05 with 50 μM DPTA NONOate under conditions of 0 or 50 μM O2, and the resulting distribution of cumulative NO· consumption among the available pathways is shown, up to the approximate time when NO· was cleared (<0.1 μM NO·) from the culture. Lines are predictions obtained using the best-fit parameter set, while lighter shading of a similar color represent prediction uncertainty (range of viable parameter sets with ER < 10). “Autoxidation” is NO· autoxidation, “Gas transport” is loss of NO· to the gas phase, “Hmp” is Hmp-mediated NO· detoxification, “[Fe-S]” is nitrosylation of iron-sulfur clusters, “NorV” is NorV-mediated NO· detoxification, “NrfA” is NrfA-mediated detoxification, and “O2·” is reaction of NO· with superoxide.
Bioengineering 03 00009 g004
Consistent with NO· detoxification measured in TUV hmp and norV cultures, the dominant NO· consumption pathway at 0 and 50 μM O2 was predicted to be NorV and Hmp, respectively, accounting for over 80% of NO· detoxification up to the time NO· was cleared (<0.1 μM NO·). The majority of the remaining NO· flux for both conditions was loss to the gas phase (~10%–15% of NO· consumption), whereas all other pathways (autoxidation, iron-sulfur cluster ([Fe-S]) nitrosylation, NrfA detoxification, and reaction with superoxide (O2·)) did not exceed 2% of the cumulative NO· consumption. Although NO· autoxidation and reaction with O2· was absent under anaerobic conditions due to the lack of O2, their combined contribution was predicted to remain modest (<2.5% of the NO· flux) even at 50 μM O2. Nitrosylation of [Fe-S] had a largely negligible impact on NO· under either O2 condition, accounting for less than 0.1% of the NO· consumed.
From the simulation results, it was clear that the greatest level of relative uncertainty was regarding the participation of NrfA. Since one of the NrfA parameters (initial concentration) was identified as having an impact on the [NO·] curve during the model training procedure (Figure S3), and the MCMC analysis revealed a mild constraint of its value (Figure 2C), it was not surprising that its predicted contribution to NO· consumption would be highly variable among the ensemble of viable models. Further model training on nrfA mutant data could resolve the uncertainty; however, given its minimal contribution to NO· detoxification under either 0 or 50 μM O2 conditions (Figure 3), increased resolution of the contribution of NrfA under the conditions used here was not necessary.

4. Discussion

EHEC is a potentially life-threatening pathogen with an extremely low infectious dose (<50 bacteria [13,60,61]). Antibiotic treatments are not recommended due to their exacerbation of Stx-related damage, which can increase the risk for HUS development [3,11,17,18,62]. Although alternative treatment approaches are being explored, such as the development of vaccines or Stx-targeting strategies, they are hindered by a lack of animal models capable of accurately mimicking a human EHEC infection, and the possibility of toxins other than Stx contributing to HUS, respectively [63]. Furthermore, efforts to neutralize the toxins after they have been produced may not be quick enough to prevent damage, whereas inhibition of toxin production would halt damage at the source [11]. Given that EHEC harboring an active NorV exhibit increased Stx production within macrophages [20], therapeutics designed to target this NO· defense system are an attractive solution. Recent studies have shown that NO· stress can decrease Stx production [35], and EHEC lacking NO· detoxification machinery exhibit attenuated survival within macrophages [20]. Here, we have developed and experimentally validated a computational tool to enable quantitative investigation of the broad and complex NO· response network in EHEC.
We previously constructed a kinetic model of the bacterial NO· response of E. coli K-12 MG1655, which accounted for the complex biochemical reaction network associated with NO· stress, including iron-sulfur cluster damage, thiol nitrosation, DNA deamination, enzymatic detoxification, and reversible respiratory inhibition [27]. Model predictions were validated with experimental measurements of biochemical species concentrations (NO·, O2, NO2, and NO3), and novel network dynamics were revealed, such as the reduced utility of Hmp with increasing NO· delivery rate [27]. In addition, the model has been used to aid in characterizing the relationship between NO· payload, release rate, and cytotoxicity [42], as well as elucidating the mechanism underlying the enhanced NO· sensitivity of an E. coli mutant lacking the ClpP protease [43]. Furthermore, this approach was demonstrated to be an effective tool for studying the dynamics of a different broadly reactive metabolite, hydrogen peroxide (H2O2) [48].
Here, the NO· kinetic model was adapted to an E. coli O157:H7 strain, and trained on experimental data. The adapted model exhibited excellent agreement with [NO·] dynamics measured in EHEC cultures following treatment with the NO·-releasing compound, DPTA NONOate, under both microaerobic and anaerobic conditions (50 and 0 μM O2, respectively). Forward predictions of [NO·] in mutant EHEC cultures lacking the major aerobic (Hmp) or anaerobic (NorV) NO· detoxification enzyme at both 0 and 50 μM O2 were in excellent agreement with the corresponding experimental measurements, which demonstrated the accuracy and versatility of the translated model.
These results, which demonstrated that Hmp and NorV dominate NO· detoxification in EHEC in the presence and absence of O2, respectively, are consistent with previous studies of E. coli NO· detoxification [20,21,22,25,57,64]. The NO· dioxygenase function of Hmp requires O2 as a substrate, and is therefore inactive under anaerobic conditions [23,57]. Hmp has been demonstrated to harbor an additional, O2-indepedent NO· reductase activity, but the rate of this reaction is orders of magnitude slower than the dioxygenation reaction or NorV-mediated NO· reduction [64]. NorV, which is capable of reducing NO· under anaerobic conditions, possesses an O2-sensitive flavodiiron catalytic site that is rapidly inactivated upon exposure to oxygenated environments [23]. Although both hmp and norV genes are expressed in response to NO· exposure in the presence or absence of O2 [43,65,66], the substrate requirements and O2 sensitivity of their catalytic activity limits the function of these enzymes in each other’s respective O2 environments. However, the intermediate regime between 0 and 50 μM O2 is far less studied, and the quantitative contribution of Hmp and NorV under these conditions remains ill-defined.
We envision that the computational tool developed here will facilitate future quantitative investigations of the complex NO· stress network in EHEC. For example, mutations found to enhance the NO· sensitivity of EHEC could be interrogated for their underlying mechanism using a model-guided approach, as demonstrated for ΔclpP in E. coli K-12 [43]. Given the breadth and complexity of the NO· biochemical network, an NO·-sensitive phenotype could arise through an immense number of possible mechanisms. By using the model as a framework to interpret the perturbed dynamics of a pathogen’s NO· response, it could elucidate the specific network components and/or functions involved in the altered behavior, or at least reduce the amount of feasible mechanisms to an experimentally-tractable number. In addition, such a model-guided approach could be translated to the mechanistic investigation of chemical perturbations to the NO· stress network. High-throughput chemical screens could be performed to identify compounds that selectively impair EHEC NO· defenses, and the model could provide a quantitative framework to guide investigations of the compounds’ mechanisms of action. Further, the model could be expanded to incorporate processes governing Stx production, and reveal important relationships between NO· stress and EHEC’s primary virulence factors. Indeed, it has already been shown that NO· interferes with Stx production in EHEC [35], and therefore, a deeper understanding of how these two systems interact could reveal novel treatment strategies.

5. Conclusions

Since antibiotics are not recommended for treatment of EHEC infections due to their enhancement of Stx-related damage, alternative treatment approaches, such as those that target virulence factors, are needed. NO· detoxification is a newly identified virulence system for EHEC [7,20], and the computational tool developed in this work will enable quantitative understanding of NO· stress in EHEC to be gained. Such knowledge could lead to novel anti-infective modalities for the treatment of EHEC, which are sorely needed for this dangerous pathogen. Indeed, continued outbreaks of EHEC offer frequent reminders that our current therapeutic options are insufficient, and novel approaches, such as targeting its NO· defenses, are required to combat this potentially deadly pathogen.

Supplementary Materials

The following are available online at https://www.mdpi.com/2306-5354/3/1/9/s1, Figure S1: Training of extracellular model parameters. 50 μM DPTA NONOate was delivered to cell-free media (MOPS minimal media with 10 mM glucose) at 50 and 0 μM O2, and [NO·] was measured (solid red lines; mean of 3 independent experiments, with light red shading representing the SEM). For the 0 μM O2 condition, the media pH was adjusted to 7.2 (from 7.4) with HCl, to mimic the slightly acidified conditions measured in the bioreactor culture for anaerobic assays with EHEC. Model parameters specific to the experimental apparatus and media conditions (kNO·-O2, kLaNO·, and kNONOate) were optimized on the [NO·] curve measured at 50 μM O2 (dashed black line using the best-fit parameter set, with gray shading representing the range of viable parameter sets with ER < 10). Since a decrease in pH increases the rate of NONOate dissociation, the kNONOate parameter was released and trained on [NO·] measured in the pH-adjusted media at 0 μM O2. The simulation result using the trained kNONOate parameter is shown (dashed black line, obtained using the best-fit parameter value, with gray shading representing viable parameter values with ER < 10), Figure S2: Training of parameters associated with the respiratory module. TUV hmp+/norV+ in mid-exponential phase were delivered to the bioreactor to an OD600 of 0.05, and the O2 consumption was measured (solid purple line; mean of 3 independent experiments with light purple shading representing the SEM). Model parameters associated with the aerobic respiratory module (NADH dehydrogenases and cytochrome ubiquinol oxidases) were trained on the measured [O2]. The simulated [O2] generated by the trained model is shown (dashed black line was obtained using the best-fit parameter set, with gray shading representing the range of viable parameter sets with ER < 10), Figure S3: Impact of individual parameter variation on [NO·] distribution. A sensitivity analysis was performed on the 68 parameters trained on the [NO·] curves measured in TUV hmp+/norV+ cultures following treatment with 50 μM DPTA NONOate at 0 and 50 μM O2. Each parameter was individually varied within its permitted bounds, and the resulting increase in SSR was quantified (fold increase = SSR/SSR0). Shown is the maximum fold increase in SSR achieved for each parameter, showing only the 20 parameters exhibiting a maximum increase of ≥5% (1.05-fold), Table S1: BLAST analysis. Proteins with <99% amino acid (AA) similarity are in bold, Table S2: Training of extracellular model parameters. Parameter values were released and allowed to vary within the “Minimum” and “Maximum” bounds. Optimal (best-fit, yielding minimum SSR between measured and simulated [NO·]) parameter values are reported, along with their confidence interval (CI), defined as the range of the parameter among viable parameter sets with ER < 10, Table S3: Training of model parameters associated with the respiratory module. Parameter values were released and allowed to vary within the “Minimum” and “Maximum” bounds. Optimal (best-fit, yielding minimum SSR between measured and simulated [O2]) parameter values are reported, along with their confidence interval (CI), defined as the range of the parameter among viable parameter sets with ER < 10, Table S4: Training of organism-specific model parameters. Parameter values were released and allowed to vary within the “Minimum” and “Maximum” bounds. Optimal (best-fit, yielding minimum SSR between measured and simulated [NO·]) parameter values are reported, along with their confidence interval (CI), defined as the range of the parameter among viable parameter sets with ER < 10. Only the 20 parameters identified as having a substantial impact on the SSR (>5% increase) are shown.

Acknowledgments

We thank James B. Kaper for helpful discussions, and acknowledge the National BioResource Project (NIG, Japan) for distribution of the Keio collection. We thank John M. Leong for kindly providing the EHEC TUV93-0 strain, and Shayan Rakhit for his early contributions to the project. Computationally-expensive optimizations and simulations were performed using the Terascale Infrastructure for Groundbreaking Research in Science and Engineering (TIGRESS) high performance computer center at Princeton University, which is jointly supported by the Princeton Institute for Computational Science and Engineering (PICSciE) and the Princeton University Office of Information Technology’s Research Computing department. This work was supported by the National Science Foundation (CBET-1453325), and Princeton University (Forese Family Fund for Innovation, start-up funds).

Author Contributions

Jonathan L. Robinson and Mark P. Brynildsen conceived and designed the experiments, analyzed the data, and wrote the paper. Jonathan L. Robinson performed the experiments.

Conflicts of Interest

The authors declare no conflict of interest.

References

  1. Russo, T.A.; Johnson, J.R. Proposal for a new inclusive designation for extraintestinal pathogenic isolates of Escherichia coli: ExPEC. J. Infect. Dis. 2000, 181, 1753–1754. [Google Scholar] [CrossRef] [PubMed]
  2. Wiles, T.J.; Kulesus, R.R.; Mulvey, M.A. Origins and virulence mechanisms of uropathogenic Escherichia coli. Exp. Mol. Pathol. 2008, 85, 11–19. [Google Scholar] [CrossRef] [PubMed]
  3. Nataro, J.P.; Kaper, J.B. Diarrheagenic Escherichia coli. Clin. Microbiol. Rev. 1998, 11, 142–201. [Google Scholar] [PubMed]
  4. Kaper, J.B.; Nataro, J.P.; Mobley, H.L. Pathogenic Escherichia coli. Nat. Rev. Microbiol. 2004, 2, 123–140. [Google Scholar] [CrossRef] [PubMed]
  5. Flores-Mireles, A.L.; Walker, J.N.; Caparon, M.; Hultgren, S.J. Urinary tract infections: Epidemiology, mechanisms of infection and treatment options. Nat. Rev. Microbiol. 2015, 13, 269–284. [Google Scholar] [CrossRef] [PubMed]
  6. Michino, H.; Araki, K.; Minami, S.; Takaya, S.; Sakai, N.; Miyazaki, M.; Ono, A.; Yanagawa, H. Massive outbreak of Escherichia coli O157:H7 infection in schoolchildren in Sakai City, Japan, associated with consumption of white radish sprouts. Am. J. Epidemiol. 1999, 150, 787–796. [Google Scholar] [CrossRef] [PubMed]
  7. Kulasekara, B.R.; Jacobs, M.; Zhou, Y.; Wu, Z.N.; Sims, E.; Saenphimmachak, C.; Rohmer, L.; Ritchie, J.M.; Radey, M.; McKevitt, M.; et al. Analysis of the genome of the Escherichia coli O157:H7 2006 spinach-associated outbreak isolate indicates candidate genes that may enhance virulence. Infect. Immun. 2009, 77, 3713–3721. [Google Scholar] [CrossRef] [PubMed]
  8. Centers for Disease Control and Prevention. Ongoing multistate outbreak of Escherichia coli serotype O157:H7 infections associated with consumption of fresh spinach—United States, September 2006. MMWR Morb. Mortal. Wkly. Rep. 2006, 55, 1045–1046. [Google Scholar]
  9. Frank, C.; Werber, D.; Cramer, J.P.; Askar, M.; Faber, M.; an der Heiden, M.; Bernard, H.; Fruth, A.; Prager, R.; Spode, A.; et al. Epidemic profile of Shiga-toxin-producing Escherichia coli O104:H4 outbreak in Germany. N. Engl. J. Med. 2011, 365, 1771–1780. [Google Scholar] [CrossRef] [PubMed]
  10. Mellmann, A.; Harmsen, D.; Cummings, C.A.; Zentz, E.B.; Leopold, S.R.; Rico, A.; Prior, K.; Szczepanowski, R.; Ji, Y.M.; Zhang, W.L.; et al. Prospective genomic characterization of the German enterohemorrhagic Escherichia coli O104:H4 outbreak by rapid next generation sequencing technology. PLoS ONE 2011, 6, e22751. [Google Scholar] [CrossRef] [PubMed]
  11. Goldwater, P.N.; Bettelheim, K.A. Treatment of enterohemorrhagic Escherichia coli (EHEC) infection and hemolytic uremic syndrome (HUS). BMC Med. 2012, 10, 12. [Google Scholar] [CrossRef] [PubMed]
  12. Torres, A.G.; Zhou, X.; Kaper, J.B. Adherence of diarrheagenic Escherichia coli strains to epithelial cells. Infect. Immun. 2005, 73, 18–29. [Google Scholar] [CrossRef] [PubMed]
  13. Kaper, J.B.; Karmali, M.A. The continuing evolution of a bacterial pathogen. Proc. Natl. Acad. Sci. USA 2008, 105, 4535–4536. [Google Scholar] [CrossRef] [PubMed]
  14. Tarr, P.I.; Gordon, C.A.; Chandler, W.L. Shiga-toxin-producing Escherichia coli and haemolytic uraemic syndrome. Lancet 2005, 365, 1073–1086. [Google Scholar] [CrossRef]
  15. Obrig, T.G.; Moran, T.P.; Brown, J.E. The mode of action of Shiga toxin on peptide elongation of eukaryotic protein synthesis. Biochem. J. 1987, 244, 287–294. [Google Scholar] [CrossRef] [PubMed]
  16. Schuller, S.; Heuschkel, R.; Torrente, F.; Kaper, J.B.; Phillips, A.D. Shiga toxin binding in normal and inflamed human intestinal mucosa. Microbes Infect. 2007, 9, 35–39. [Google Scholar] [CrossRef] [PubMed]
  17. Zhang, X.P.; McDaniel, A.D.; Wolf, L.E.; Keusch, G.T.; Waldor, M.K.; Acheson, D.W.K. Quinolone antibiotics induce shiga toxin-encoding bacteriophages, toxin production, and death in mice. J. Infect. Dis. 2000, 181, 664–670. [Google Scholar] [CrossRef] [PubMed]
  18. Bielaszewska, M.; Idelevich, E.A.; Zhang, W.; Bauwens, A.; Schaumburg, F.; Mellmann, A.; Peters, G.; Karch, H. Effects of antibiotics on Shiga toxin 2 production and bacteriophage induction by epidemic Escherichia coli O104:H4 strain. Antimicrob. Agents Chemother. 2012, 56, 3277–3282. [Google Scholar] [CrossRef] [PubMed]
  19. Garcia-Angulo, V.A.; Kalita, A.; Torres, A.G. Advances in the development of enterohemorrhagic Escherichia coli vaccines using murine models of infection. Vaccine 2013, 31, 3229–3235. [Google Scholar] [CrossRef] [PubMed]
  20. Shimizu, T.; Tsutsuki, H.; Matsumoto, A.; Nakaya, H.; Noda, M. The nitric oxide reductase of enterohaemorrhagic Escherichia coli plays an important role for the survival within macrophages. Mol. Microbiol. 2012, 85, 492–512. [Google Scholar] [CrossRef] [PubMed]
  21. Gomes, C.M.; Giuffre, A.; Forte, E.; Vicente, J.B.; Saraiva, L.M.; Brunori, M.; Teixeira, M. A novel type of nitric-oxide reductase. Escherichia coli flavorubredoxin. J. Biol. Chem. 2002, 277, 25273–25276. [Google Scholar] [PubMed]
  22. Gardner, A.M.; Helmick, R.A.; Gardner, P.R. Flavorubredoxin, an inducible catalyst for nitric oxide reduction and detoxification in Escherichia coli. J. Biol. Chem. 2002, 277, 8172–8177. [Google Scholar] [CrossRef] [PubMed]
  23. Gardner, A.M.; Gardner, P.R. Flavohemoglobin detoxifies nitric oxide in aerobic, but not anaerobic, Escherichia coli—Evidence for a novel inducible anaerobic nitric oxide-scavenging activity. J. Biol. Chem. 2002, 277, 8166–8171. [Google Scholar] [CrossRef] [PubMed]
  24. Vine, C.E.; Cole, J.A. Nitrosative stress in Escherichia coli: Reduction of nitric oxide. Biochem. Soc. Trans. 2011, 39, 213–215. [Google Scholar] [CrossRef] [PubMed]
  25. Gardner, P.R.; Gardner, A.M.; Martin, L.A.; Salzman, A.L. Nitric oxide dioxygenase: An enzymic function for flavohemoglobin. Proc. Natl. Acad. Sci. USA 1998, 95, 10378–10383. [Google Scholar] [CrossRef] [PubMed]
  26. Hausladen, A.; Gow, A.J.; Stamler, J.S. Nitrosative stress: Metabolic pathway involving the flavohemoglobin. Proc. Natl. Acad. Sci. USA 1998, 95, 14100–14105. [Google Scholar] [CrossRef] [PubMed]
  27. Robinson, J.L.; Brynildsen, M.P. A kinetic platform to determine the fate of nitric oxide in Escherichia coli. PLoS Comput. Biol. 2013, 9, e1003049. [Google Scholar] [CrossRef] [PubMed]
  28. Robinson, J.L.; Adolfsen, K.J.; Brynildsen, M.P. Deciphering nitric oxide stress in bacteria with quantitative modeling. Curr. Opin. Microbiol. 2014, 19, 16–24. [Google Scholar] [CrossRef] [PubMed]
  29. Svensson, L.; Poljakovic, M.; Save, S.; Gilberthorpe, N.; Schon, T.; Strid, S.; Corker, H.; Poole, R.K.; Persson, K. Role of flavohemoglobin in combating nitrosative stress in uropathogenic Escherichia coli—Implications for urinary tract infection. Microb. Pathog. 2010, 49, 59–66. [Google Scholar] [CrossRef] [PubMed]
  30. Bang, I.S.; Liu, L.; Vazquez-Torres, A.; Crouch, M.L.; Stamler, J.S.; Fang, F.C. Maintenance of nitric oxide and redox homeostasis by the Salmonella flavohemoglobin hmp. J. Biol. Chem. 2006, 281, 28039–28047. [Google Scholar] [CrossRef] [PubMed]
  31. Stevanin, T.M.; Poole, R.K.; Demoncheaux, E.A.G.; Read, R.C. Flavohemoglobin Hmp protects Salmonella enterica serovar typhimurium from nitric oxide-related killing by human macrophages. Infect. Immun. 2002, 70, 4399–4405. [Google Scholar] [CrossRef] [PubMed]
  32. Sebbane, F.; Lemaitre, N.; Sturdevant, D.E.; Rebeil, R.; Virtaneva, K.; Porcella, S.F.; Hinnebusch, B.J. Adaptive response of Yersinia pestis to extracellular effectors of innate immunity during bubonic plague. Proc. Natl. Acad. Sci. USA 2006, 103, 11766–11771. [Google Scholar] [CrossRef] [PubMed]
  33. Richardson, A.R.; Dunman, P.M.; Fang, F.C. The nitrosative stress response of Staphylococcus aureus is required for resistance to innate immunity. Mol. Microbiol. 2006, 61, 927–939. [Google Scholar] [CrossRef] [PubMed]
  34. Stern, A.M.; Hay, A.J.; Liu, Z.; Desland, F.A.; Zhang, J.; Zhong, Z.T.; Zhu, J. The NorR regulon is critical for Vibrio cholerae resistance to nitric oxide and sustained colonization of the intestines. mBio 2012, 3, e00013-12. [Google Scholar] [CrossRef] [PubMed]
  35. Vareille, M.; de Sablet, T.; Hindre, T.; Martin, C.; Gobert, A.P. Nitric oxide inhibits Shiga-toxin synthesis by enterohemorrhagic Escherichia coli. Proc. Natl. Acad. Sci. USA 2007, 104, 10199–10204. [Google Scholar] [CrossRef] [PubMed]
  36. Branchu, P.; Matrat, S.; Vareille, M.; Garrivier, A.; Durand, A.; Crepin, S.; Harel, J.; Jubelin, G.; Gobert, A.P. NsrR, GadE, and GadX interplay in repressing expression of the Escherichia coli O157: H7 LEE pathogenicity island in response to nitric oxide. PLoS Pathog. 2014, 10, e1003874. [Google Scholar] [CrossRef] [PubMed]
  37. Schomburg, I.; Chang, A.; Placzek, S.; Sohngen, C.; Rother, M.; Lang, M.; Munaretto, C.; Ulas, S.; Stelzer, M.; Grote, A.; et al. BRENDA in 2013: Integrated reactions, kinetic data, enzyme function data, improved disease classification: New options and contents in BRENDA. Nucleic Acids Res. 2013, 41, D764–D772. [Google Scholar] [CrossRef] [PubMed]
  38. Gardner, P.R.; Gardner, A.M.; Martin, L.A.; Dou, Y.; Li, T.; Olson, J.S.; Zhu, H.; Riggs, A.F. Nitric-oxide dioxygenase activity and function of flavohemoglobins. sensitivity to nitric oxide and carbon monoxide inhibition. J. Biol. Chem. 2000, 275, 31581–31587. [Google Scholar] [CrossRef] [PubMed]
  39. Bowman, L.A.; McLean, S.; Poole, R.K.; Fukuto, J.M. The diversity of microbial responses to nitric oxide and agents of nitrosative stress close cousins but not identical twins. Adv. Microb. Physiol. 2011, 59, 135–219. [Google Scholar] [PubMed]
  40. Lancaster, J.R., Jr. Nitroxidative, nitrosative, and nitrative stress: Kinetic predictions of reactive nitrogen species chemistry under biological conditions. Chem. Res. Toxicol. 2006, 19, 1160–1174. [Google Scholar] [CrossRef] [PubMed]
  41. Lim, C.H.; Dedon, P.C.; Deen, W.M. Kinetic analysis of intracellular concentrations of reactive nitrogen species. Chem. Res. Toxicol. 2008, 21, 2134–2147. [Google Scholar] [CrossRef] [PubMed]
  42. Robinson, J.L.; Brynildsen, M.P. Model-driven identification of dosing regimens that maximize the antimicrobial activity of nitric oxide. Metab. Eng. Commun. 2014, 1, 12–18. [Google Scholar] [CrossRef]
  43. Robinson, J.L.; Brynildsen, M.P. An ensemble-guided approach Identifies ClpP as a major regulator of transcript levels in nitric oxide-stressed Escherichia coli. Metab. Eng. 2015, 31, 22–34. [Google Scholar] [CrossRef] [PubMed]
  44. Campellone, K.G.; Giese, A.; Tipper, D.J.; Leong, J.M. A tyrosine-phosphorylated 12-amino-acid sequence of enteropathogenic Escherichia coli Tir binds the host adaptor protein Nck and is required for Nck localization to actin pedestals. Mol. Microbiol. 2002, 43, 1227–1241. [Google Scholar] [CrossRef] [PubMed]
  45. Zaslaver, A.; Bren, A.; Ronen, M.; Itzkovitz, S.; Kikoin, I.; Shavit, S.; Liebermeister, W.; Surette, M.G.; Alon, U. A comprehensive library of fluorescent transcriptional reporters for Escherichia coli. Nat. Methods 2006, 3, 623–628. [Google Scholar] [CrossRef] [PubMed]
  46. Datsenko, K.A.; Wanner, B.L. One-step inactivation of chromosomal genes in Escherichia coli K-12 using PCR products. Proc. Natl. Acad. Sci. USA 2000, 97, 6640–6645. [Google Scholar] [CrossRef] [PubMed]
  47. Baba, T.; Ara, T.; Hasegawa, M.; Takai, Y.; Okumura, Y.; Baba, M.; Datsenko, K.A.; Tomita, M.; Wanner, B.L.; Mori, H. Construction of Escherichia coli K-12 in-frame, single-gene knockout mutants: The Keio collection. Mol. Syst. Biol. 2006, 2. [Google Scholar] [CrossRef] [PubMed]
  48. Adolfsen, K.J.; Brynildsen, M.P. A kinetic platform to determine the fate of hydrogen peroxide in Escherichia coli. PLoS Comput. Biol. 2015, 11, e1004562. [Google Scholar] [CrossRef] [PubMed]
  49. Denicola, A.; Souza, J.M.; Radi, R.; Lissi, E. Nitric oxide diffusion in membranes determined by fluorescence quenching. Arch. Biochem. Biophys. 1996, 328, 208–212. [Google Scholar] [CrossRef] [PubMed]
  50. Kelm, M. Nitric oxide metabolism and breakdown. Biochim. Biophys. Acta 1999, 1411, 273–289. [Google Scholar] [CrossRef]
  51. Zamora-Sillero, E.; Hafner, M.; Ibig, A.; Stelling, J.; Wagner, A. Efficient characterization of high-dimensional parameter spaces for systems biology. BMC Syst. Biol. 2011, 5, 142. [Google Scholar] [CrossRef] [PubMed] [Green Version]
  52. Akaike, H. Information theory and extension of the maximum likelihood principle. In Proceedings of the 2nd International Symposium on Information Theory, Tsahkadsor, Armenia, 2–8 September 1971; Petrov, B.N., Csaki, F., Eds.; Akadémiai Kiadó: Budapest, Hungary, 1973; pp. 267–281. [Google Scholar]
  53. Hurvich, C.M.; Tsai, C.L. Regression and time-series model selection in small samples. Biometrika 1989, 76, 297–307. [Google Scholar] [CrossRef]
  54. Turkheimer, F.E.; Hinz, R.; Cunningham, V.J. On the undecidability among kinetic models: From model selection to model averaging. J. Cereb. Blood Flow Metab. 2003, 23, 490–498. [Google Scholar] [CrossRef] [PubMed]
  55. Burnham, K.P.; Anderson, D.R. Model Selection and Multimodel Inference: A Practical Information-Theoretic Approach, 2nd ed.; Springer: New York, NY, USA, 2002. [Google Scholar]
  56. Caspi, R.; Billington, R.; Ferrer, L.; Foerster, H.; Fulcher, C.A.; Keseler, I.M.; Kothari, A.; Krummenacker, M.; Latendresse, M.; Mueller, L.A.; et al. The MetaCyc database of metabolic pathways and enzymes and the BioCyc collection of pathway/genome databases. Nucleic Acids Res. 2015, 36, D623–D631. [Google Scholar] [CrossRef] [PubMed]
  57. Hausladen, A.; Gow, A.; Stamler, J.S. Flavohemoglobin denitrosylase catalyzes the reaction of a nitroxyl equivalent with molecular oxygen. Proc. Natl. Acad. Sci. USA 2001, 98, 10108–10112. [Google Scholar] [CrossRef] [PubMed]
  58. Mills, C.E.; Sedelnikova, S.; Soballe, B.; Hughes, M.N.; Poole, R.K. Escherichia coli flavohaemoglobin (Hmp) with equistoichiometric FAD and haem contents has a low affinity for dioxygen in the absence or presence of nitric oxide. Biochem. J. 2001, 353, 207–213. [Google Scholar] [CrossRef] [PubMed]
  59. Stevanin, T.M.; Ioannidis, N.; Mills, C.E.; Kim, S.O.; Hughes, M.N.; Poole, R.K. Flavohemoglobin Hmp affords inducible protection for Escherichia coli respiration, catalyzed by cytochromes bo’ or bd, from nitric oxide. J. Biol. Chem. 2000, 275, 35868–35875. [Google Scholar] [CrossRef] [PubMed]
  60. Tilden, J.; Young, W.; McNamara, A.M.; Custer, C.; Boesel, B.; LambertFair, M.; Majkowski, J.; Vugia, D.; Werner, S.B.; Hollingsworth, J.; et al. A new route of transmission for Escherichia coli: Infection from dry fermented salami. Am. J. Public Health 1996, 86, 1142–1145. [Google Scholar] [CrossRef] [PubMed]
  61. Tuttle, J.; Gomez, T.; Doyle, M.P.; Wells, J.G.; Zhao, T.; Tauxe, R.V.; Griffin, P.M. Lessons from a large outbreak of Escherichia coli O157:H7 infections: Insights into the infectious dose and method of widespread contamination of hamburger patties. Epidemiol. Infect. 1999, 122, 185–192. [Google Scholar] [CrossRef] [PubMed]
  62. Wong, C.S.; Jelacic, S.; Habeeb, R.L.; Watkins, S.L.; Tarr, P.I. The risk of the hemolytic-uremic syndrome after antibiotic treatment of Escherichia coli O157:H7 infections. N. Engl. J. Med. 2000, 342, 1930–1936. [Google Scholar] [CrossRef] [PubMed]
  63. Orth, D.; Grif, K.; Zimmerhackl, L.B.; Wurzner, R. Prevention and treatment of enterohemorrhagic Escherichia coli infections in humans. Expert Rev. Anti Infect Ther. 2008, 6, 101–108. [Google Scholar] [CrossRef] [PubMed]
  64. Gardner, A.M.; Martin, L.A.; Gardner, P.R.; Dou, Y.; Olson, J.S. Steady-state and transient kinetics of Escherichia coli nitric-oxide dioxygenase (flavohemoglobin). The B10 tyrosine hydroxyl is essential for dioxygen binding and catalysis. J. Biol. Chem. 2000, 275, 12581–12589. [Google Scholar] [CrossRef] [PubMed]
  65. Hyduke, D.R.; Jarboe, L.R.; Tran, L.M.; Chou, K.J.; Liao, J.C. Integrated network analysis identifies nitric oxide response networks and dihydroxyacid dehydratase as a crucial target in Escherichia coli. Proc. Natl. Acad. Sci. USA 2007, 104, 8484–8489. [Google Scholar] [CrossRef] [PubMed]
  66. Pullan, S.T.; Gidley, M.D.; Jones, R.A.; Barrett, J.; Stevanin, T.A.; Read, R.C.; Green, J.; Poole, R.K. Nitric oxide in chemostat-cultured Escherichia coli is sensed by Fnr and other global regulators: Unaltered methionine biosynthesis indicates lack of S nitrosation. J. Bacteriol. 2007, 189, 1845–1855. [Google Scholar] [CrossRef] [PubMed]

