
Self-Supervised Contrastive Learning to Predict the Progression of Alzheimer’s Disease with 3D Amyloid-PET
 , ,
, ,
Abstract
:1. Introduction
2. Materials and Methods
2.1. Data
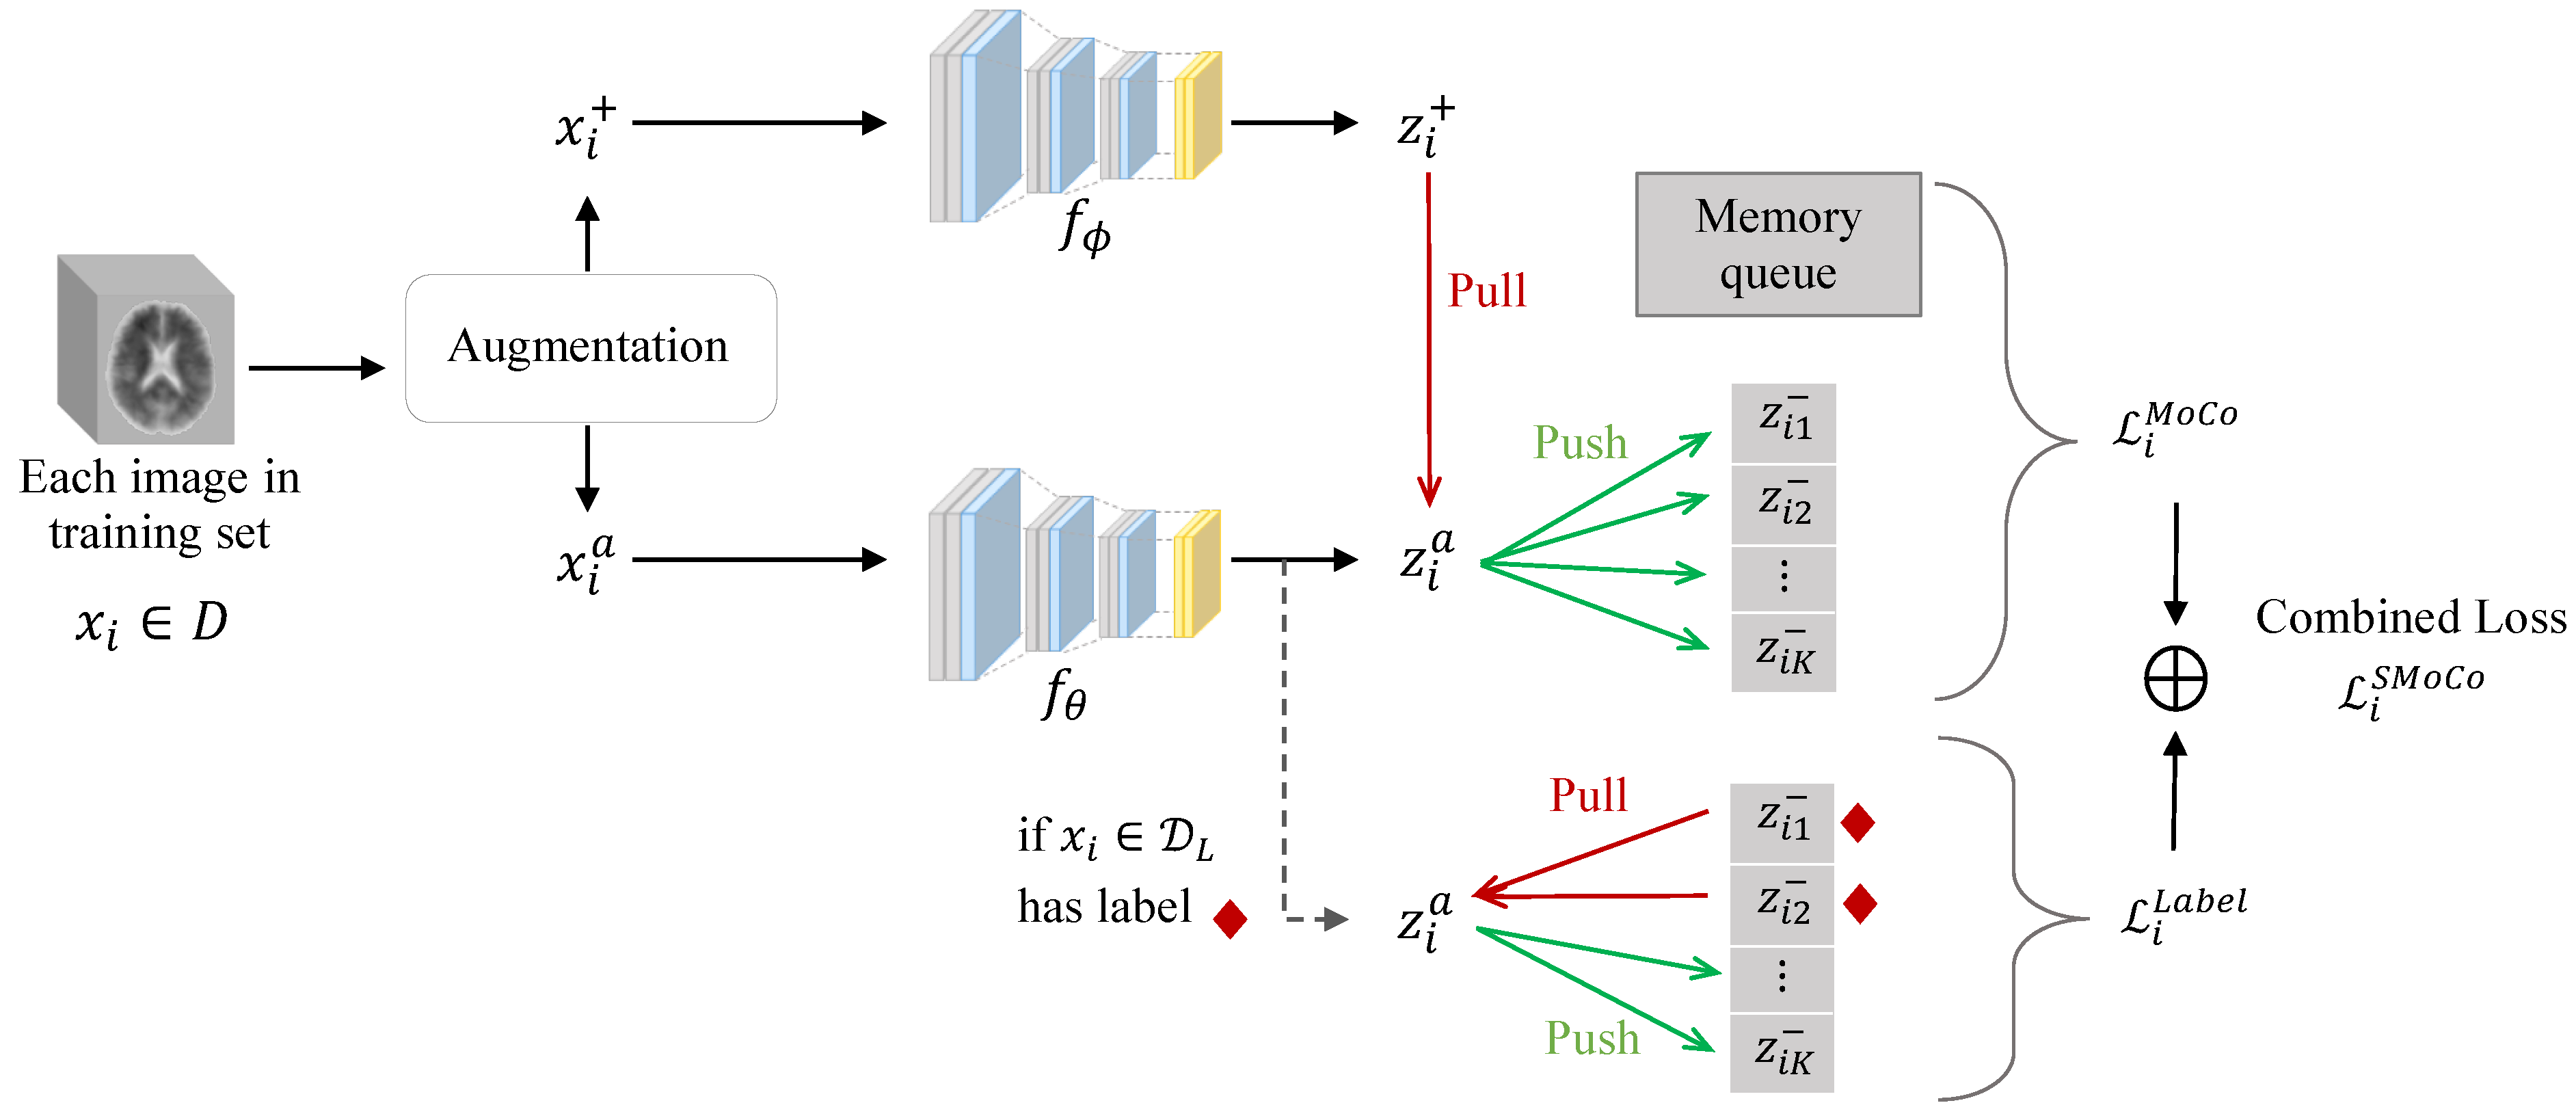
2.2. Proposed SMoCo
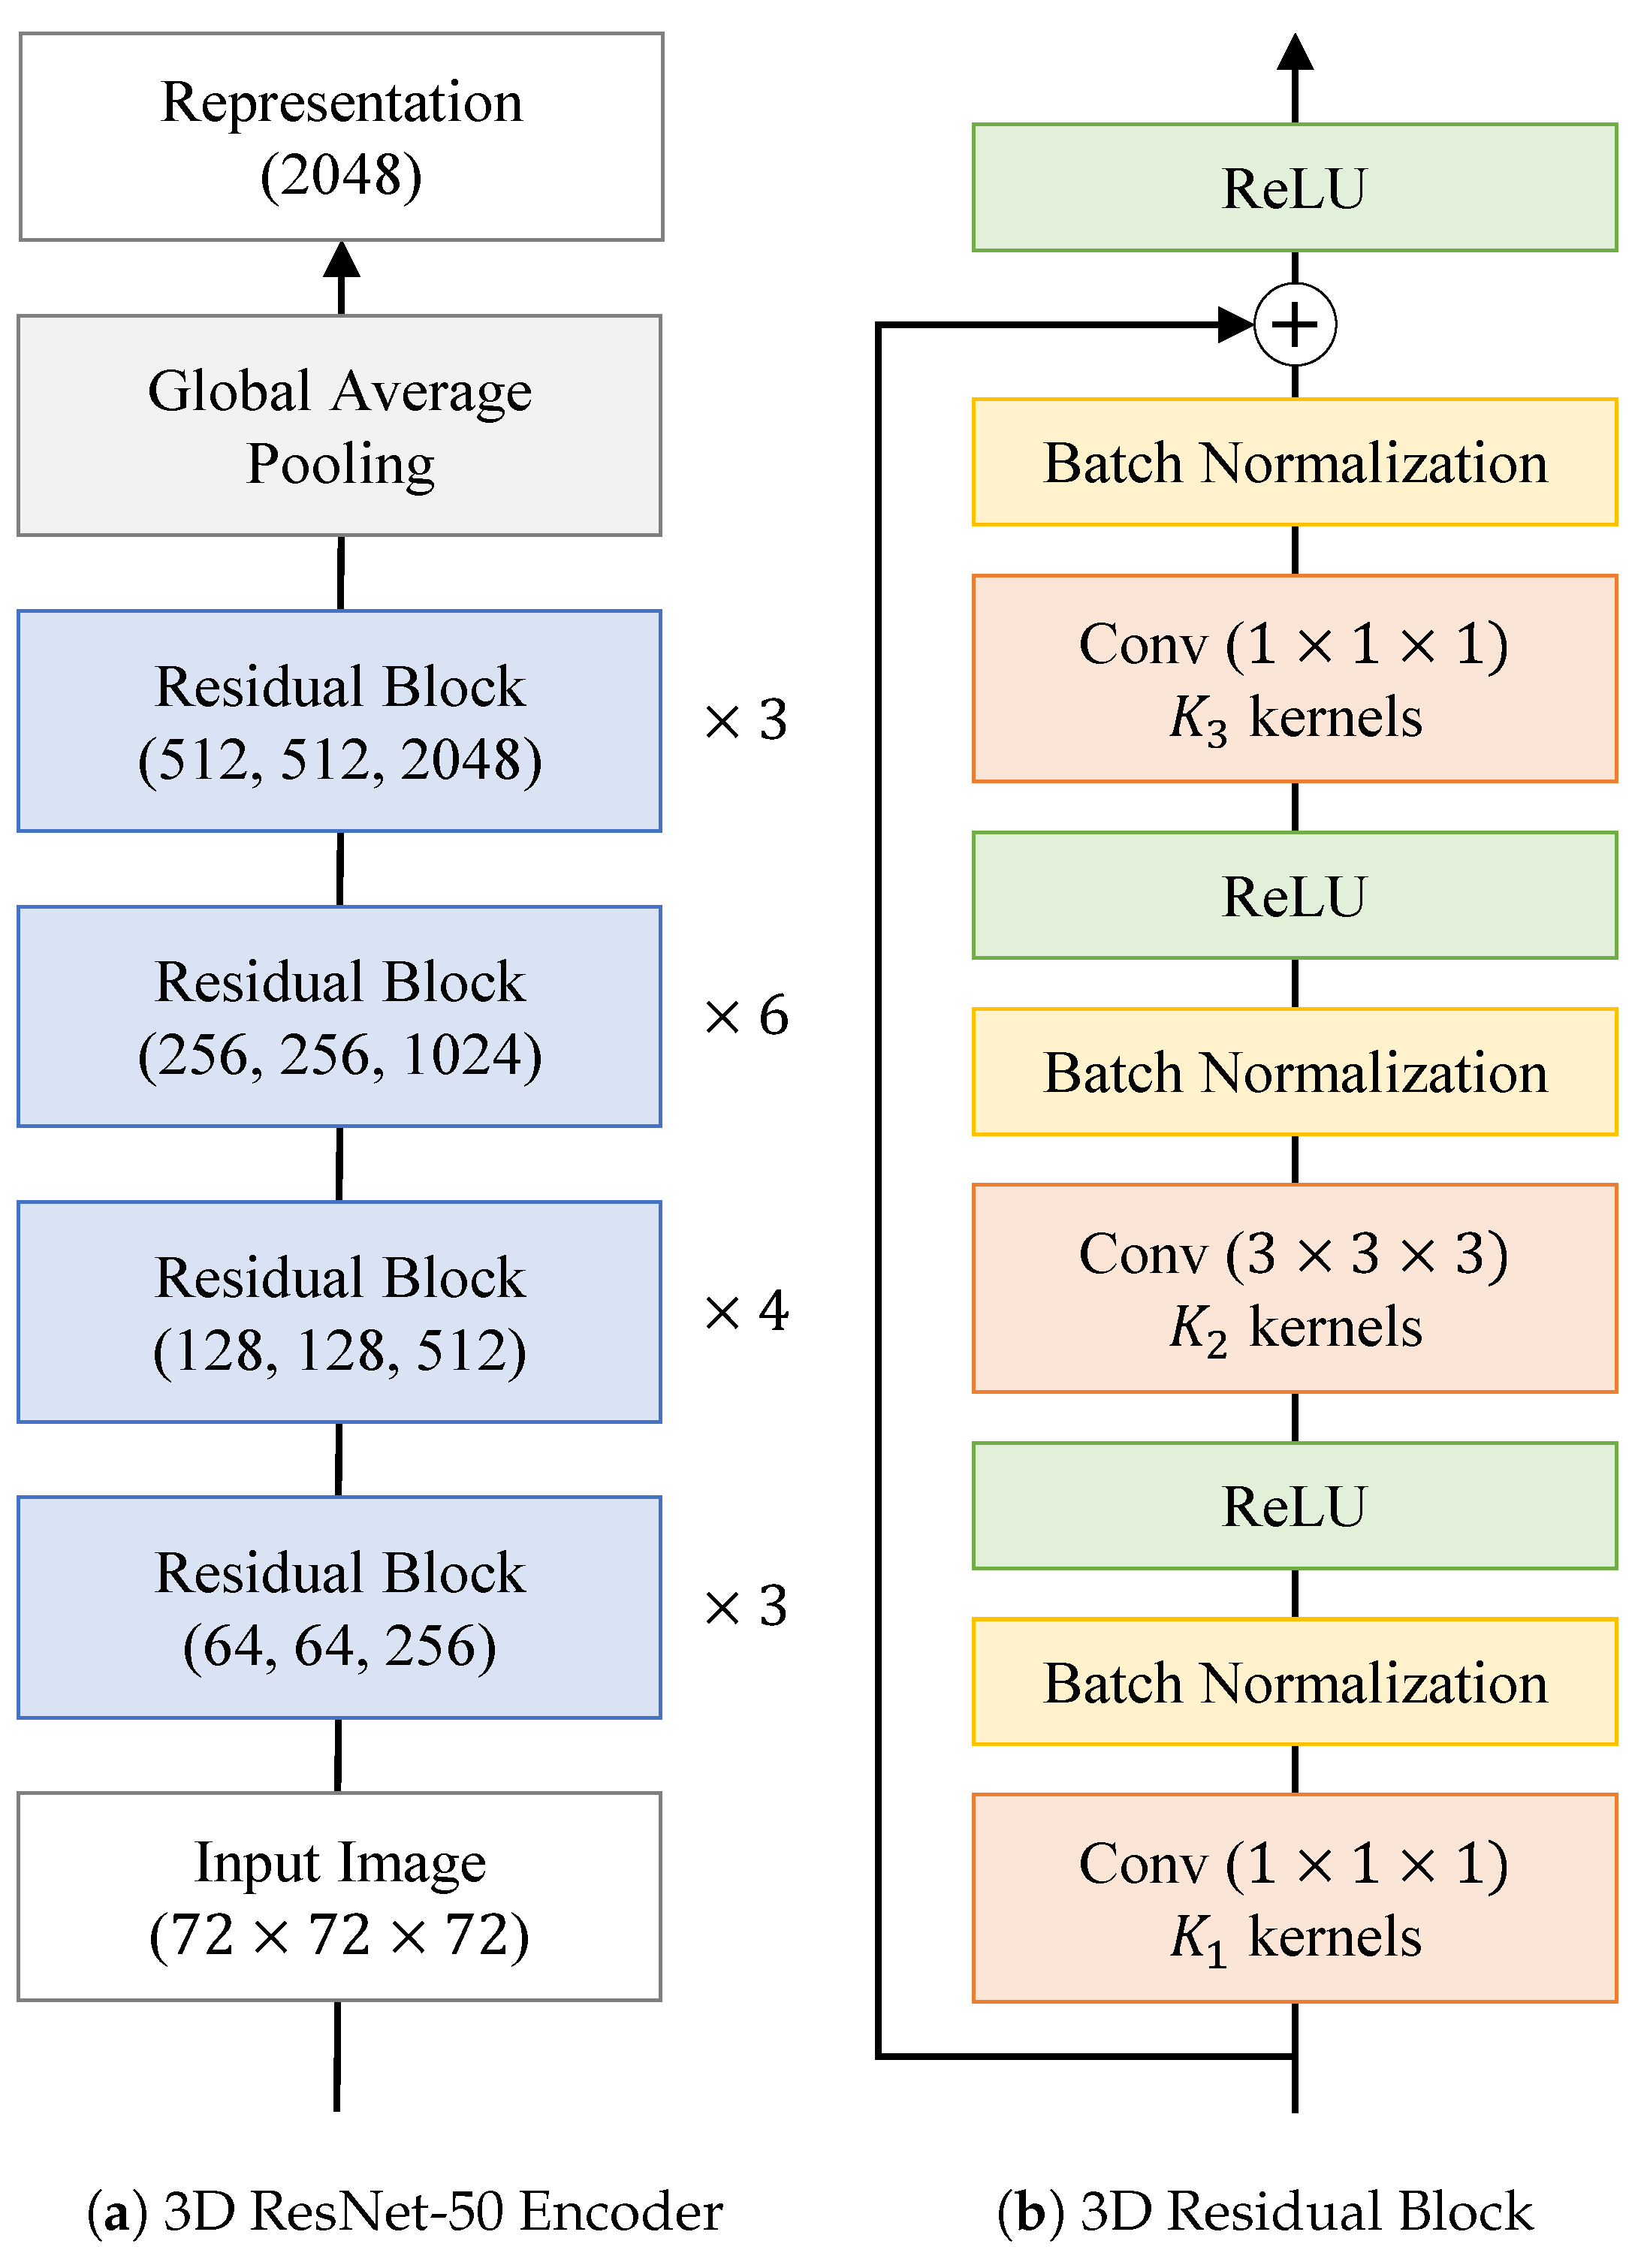
2.3. SMoCo Implementation Details and Fine-Tuning
3. Results
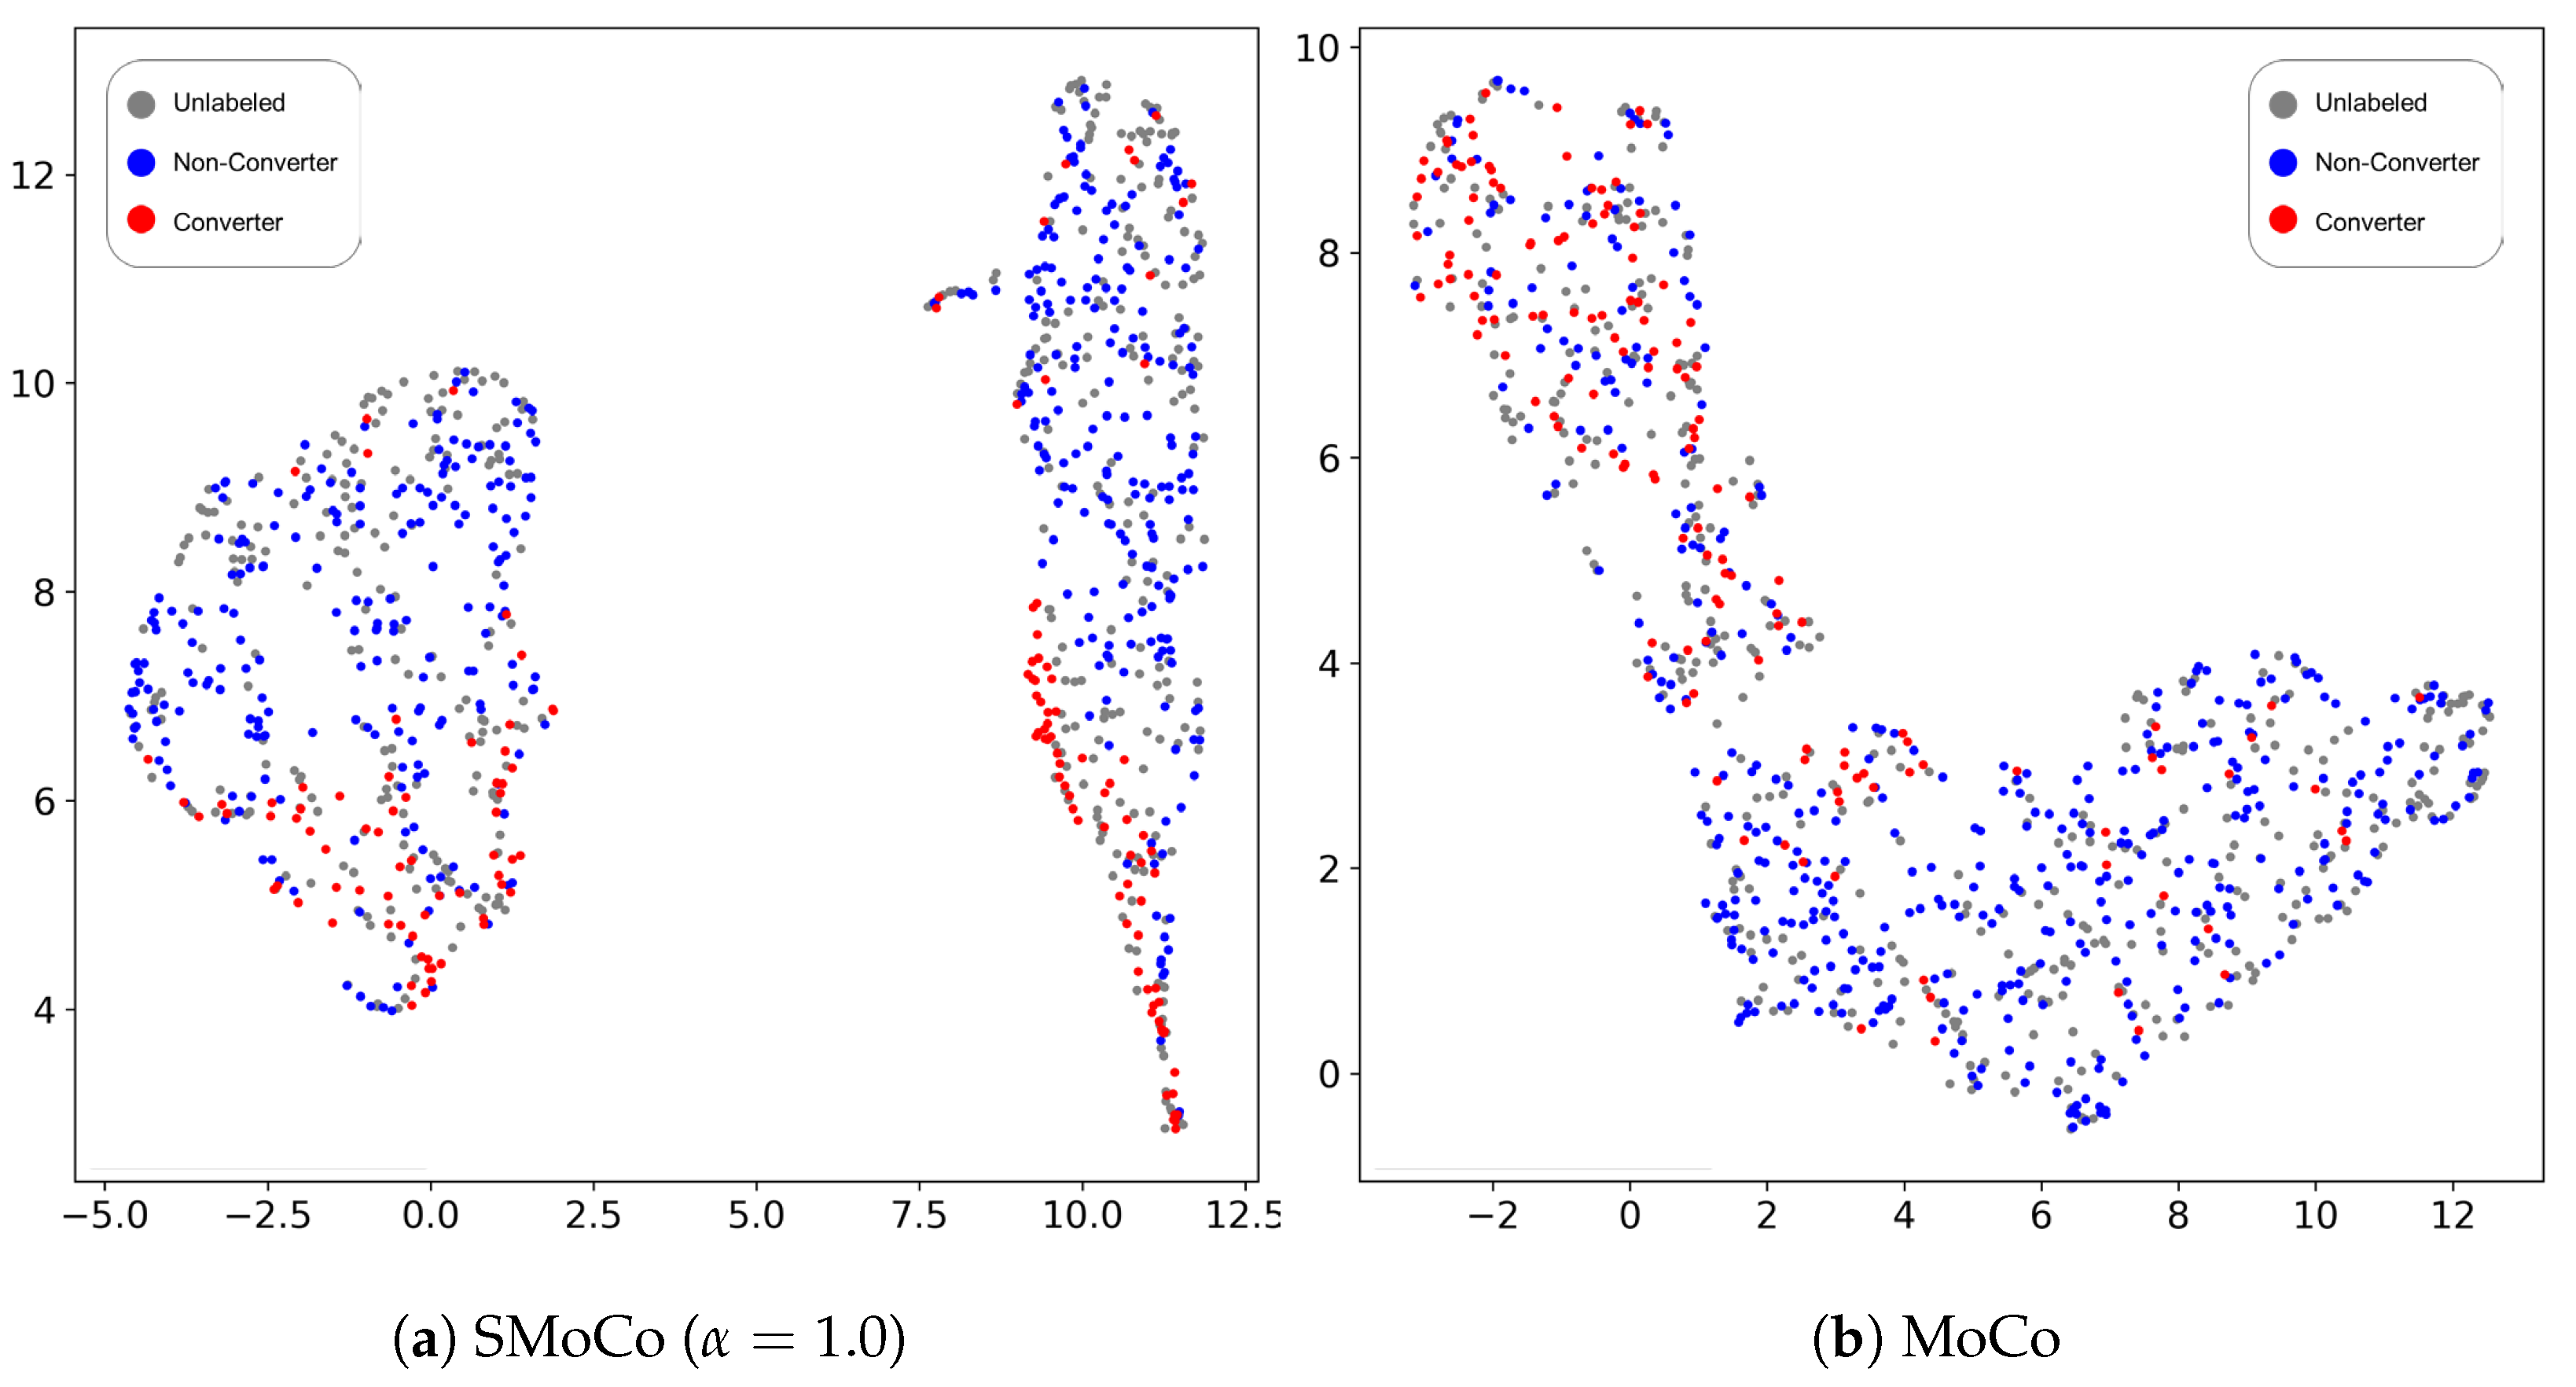
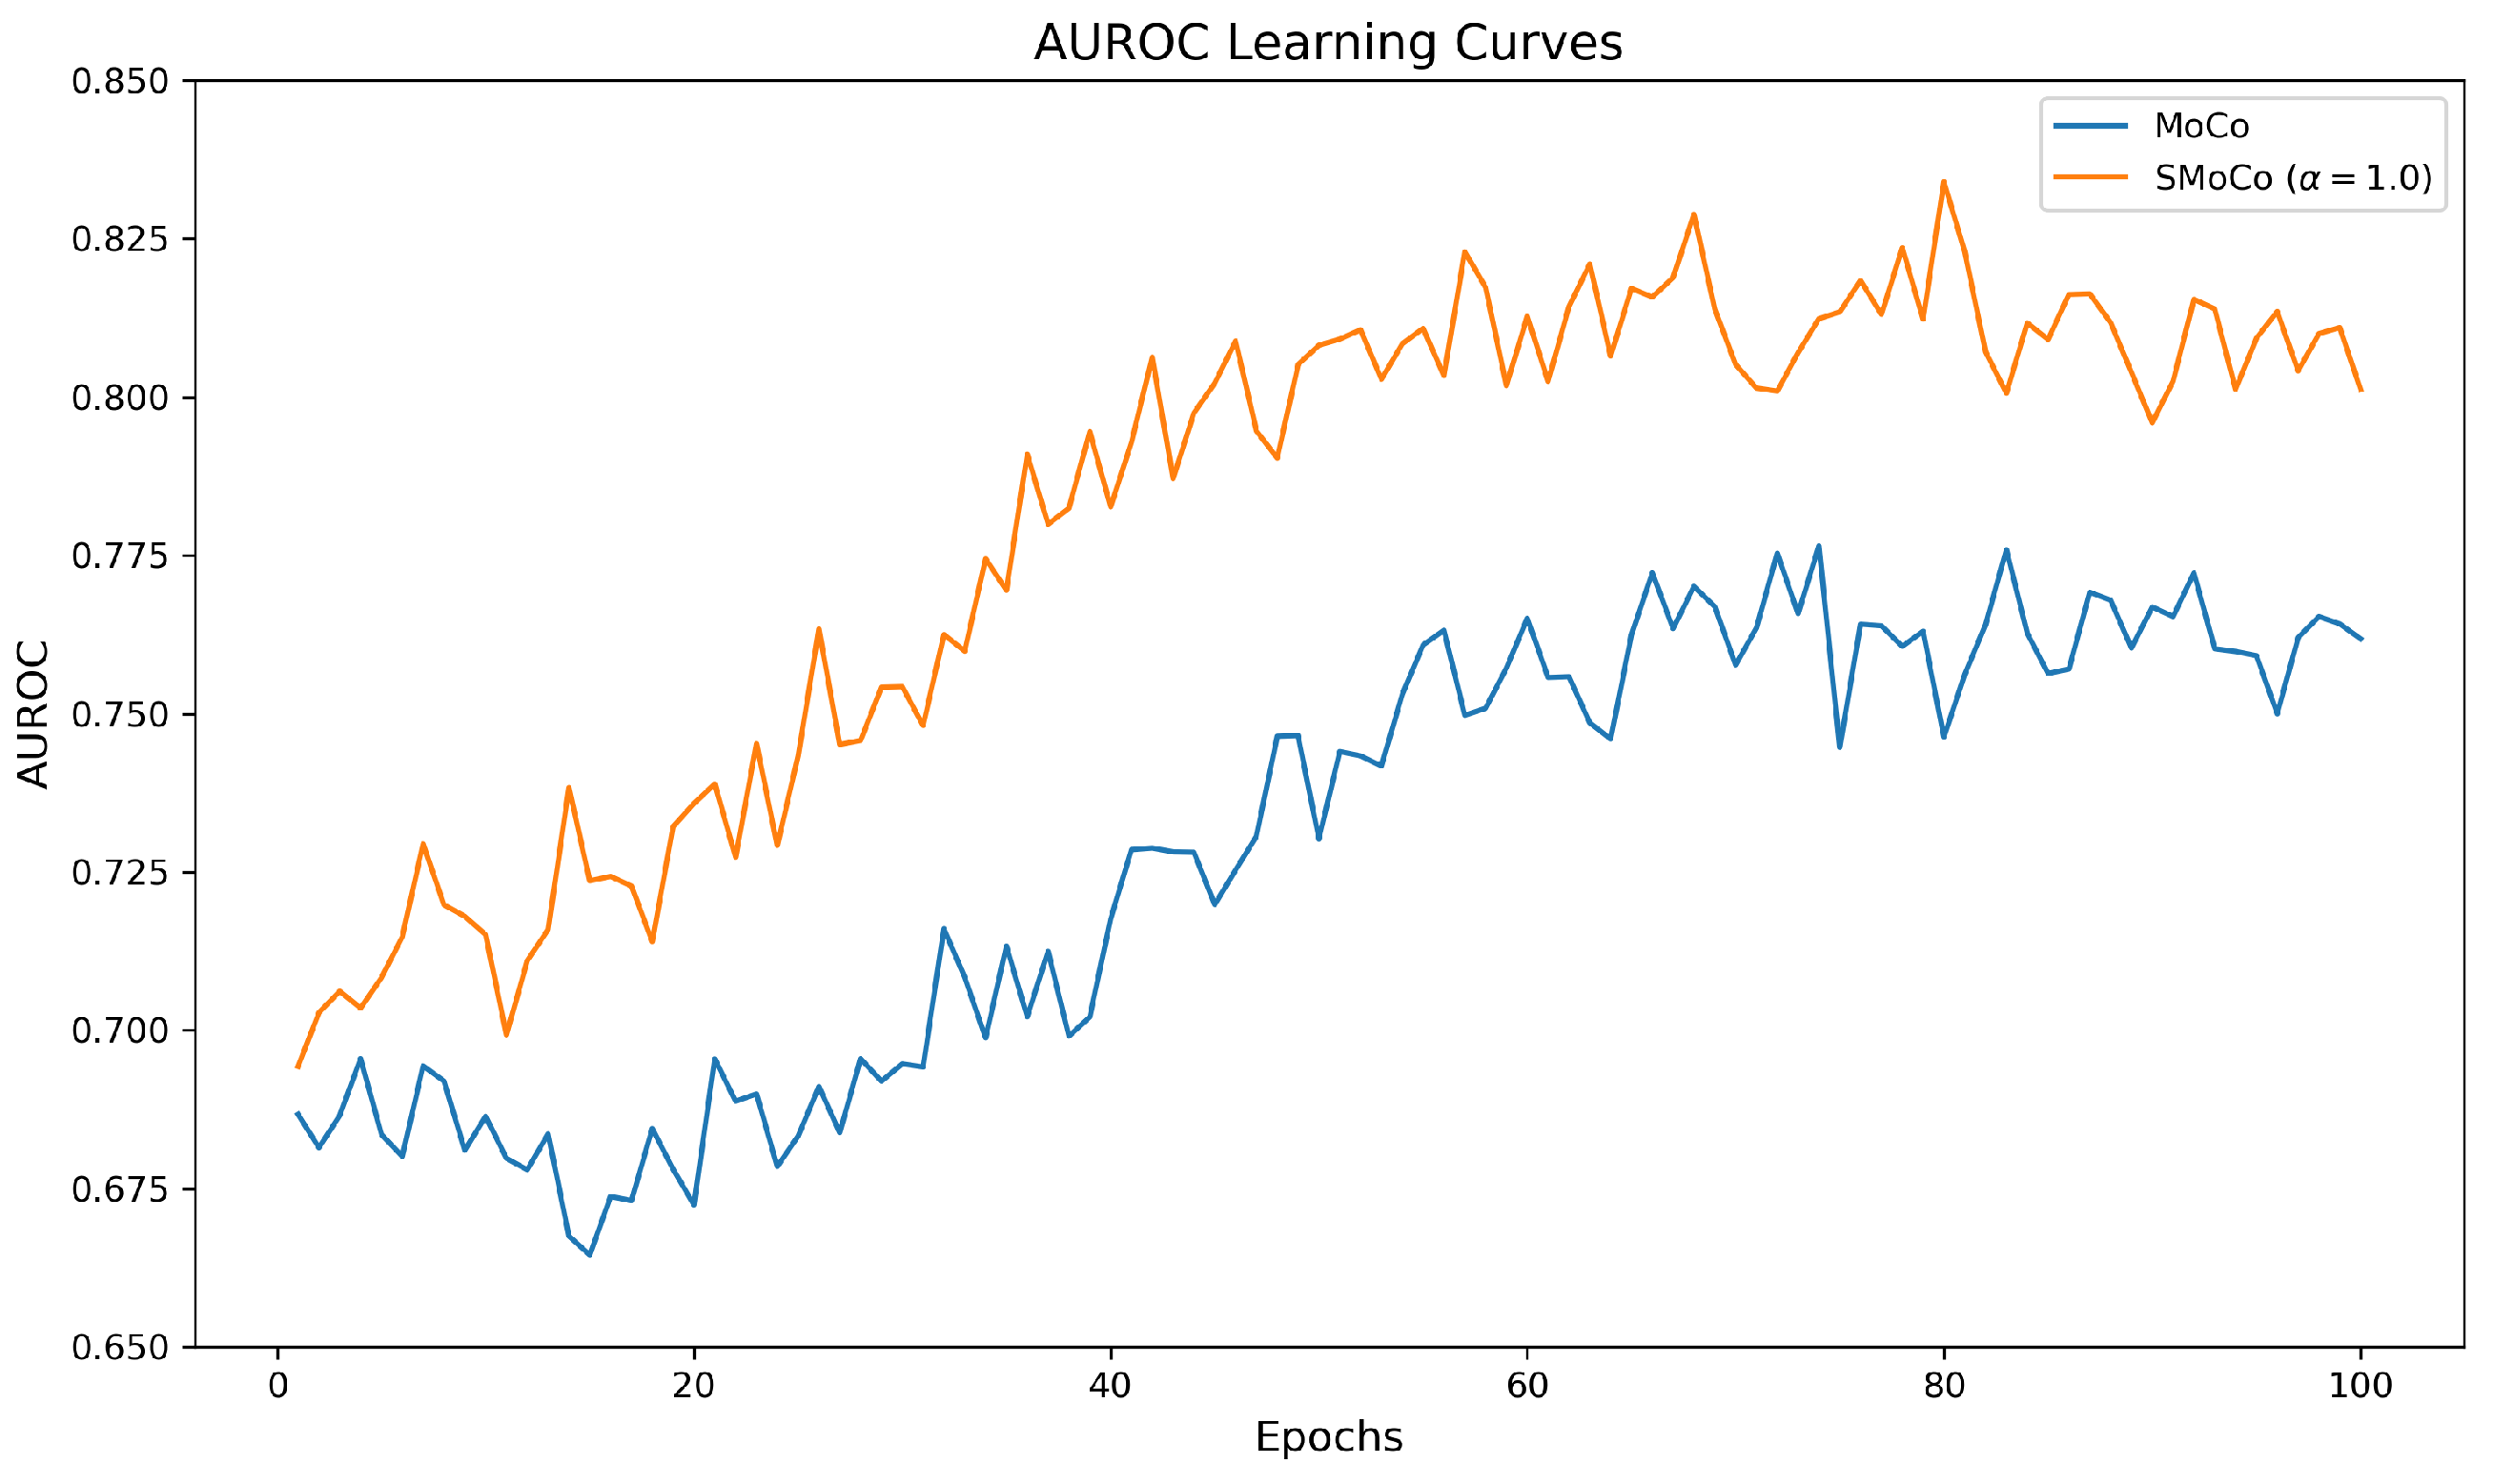
3.1. Representation Quality Evaluation for Pre-Training Step
3.2. Classification Performance and Comparison
4. Discussion
5. Conclusions
Author Contributions
Funding
Institutional Review Board Statement
Informed Consent Statement
Data Availability Statement
Conflicts of Interest
Abbreviations
| AD | Alzheimer’s disease |
| ADNI | Alzheimer’s Disease Neuroimaging Initiative |
| AIBL | Australian Imaging Biomarkers and Lifestyle Study of Ageing |
| AUROC | Area under the receiver operating characteristic |
| k-NN | k-nearest neighbor |
| MCI | Mild cognitive impairment |
| MoCo | Momentum contrast |
| MRI | Magnetic resonance imaging |
| PET | Positron emission tomography |
| SSL | Self-supervised learning |
| UMAP | Uniform manifold approximation and projection |
References
- Alzheimer’s Association. 2023 Alzheimer’s disease facts and figures. Alzheimer’s Dement. J. Alzheimer’s Assoc. 2023, 19, 1598–1695. [Google Scholar] [CrossRef]
- Canady, V.A. FDA approves new treatment for Alzheimer’s disease. Ment. Health Wkly. 2023, 33, 6–7. [Google Scholar]
- Sims, J.R.; Zimmer, J.A.; Evans, C.D.; Lu, M.; Ardayfio, P.; Sparks, J.; Wessels, A.M.; Shcherbinin, S.; Wang, H.; Nery, E.S.M.; et al. Donanemab in early symptomatic Alzheimer disease: The TRAILBLAZER-ALZ 2 randomized clinical trial. JAMA 2023, 330, 512–527. [Google Scholar]
- Cummings, J.; Lee, G.; Ritter, A.; Sabbagh, M.; Zhong, K. Alzheimer’s disease drug development pipeline: 2020. Alzheimer’s Dement. Transl. Res. Clin. Interv. 2020, 6, e12050. [Google Scholar]
- Battineni, G.; Chintalapudi, N.; Hossain, M.A.; Losco, G.; Ruocco, C.; Sagaro, G.G.; Traini, E.; Nittari, G.; Amenta, F. Artificial intelligence models in the diagnosis of adult-onset dementia disorders: A review. Bioengineering 2022, 9, 370. [Google Scholar]
- Illakiya, T.; Ramamurthy, K.; Siddharth, M.; Mishra, R.; Udainiya, A. AHANet: Adaptive Hybrid Attention Network for Alzheimer’s Disease Classification Using Brain Magnetic Resonance Imaging. Bioengineering 2023, 10, 714. [Google Scholar]
- Katabathula, S.; Wang, Q.; Xu, R. Predict Alzheimer’s disease using hippocampus MRI data: A lightweight 3D deep convolutional network model with visual and global shape representations. Alzheimer’s Res. Ther. 2021, 13, 1–9. [Google Scholar]
- Lu, D.; Popuri, K.; Ding, G.W.; Balachandar, R.; Beg, M.F. Multimodal and multiscale deep neural networks for the early diagnosis of Alzheimer’s disease using structural MR and FDG-PET images. Sci. Rep. 2018, 8, 5697. [Google Scholar]
- Zhang, D.; Wang, Y.; Zhou, L.; Yuan, H.; Shen, D.; Alzheimer’s Disease Neuroimaging Initiative. Multimodal classification of Alzheimer’s disease and mild cognitive impairment. Neuroimage 2011, 55, 856–867. [Google Scholar]
- Ritchie, K.; Lovestone, S. The dementias. Lancet 2002, 360, 1759–1766. [Google Scholar]
- Lu, P.; Hu, L.; Zhang, N.; Liang, H.; Tian, T.; Lu, L. A two-stage model for predicting mild cognitive impairment to Alzheimer’s disease conversion. Front. Aging Neurosci. 2022, 14, 826622. [Google Scholar] [CrossRef]
- Yan, Y.; Somer, E.; Grau, V. Classification of amyloid PET images using novel features for early diagnosis of Alzheimer’s disease and mild cognitive impairment conversion. Nucl. Med. Commun. 2019, 40, 242–248. [Google Scholar] [CrossRef]
- Caron, M.; Touvron, H.; Misra, I.; Jégou, H.; Mairal, J.; Bojanowski, P.; Joulin, A. Emerging properties in self-supervised vision transformers. In Proceedings of the IEEE/CVF International Conference on Computer Vision 2021, Montreal, BC, Canada, 11–17 October 2021; pp. 9650–9660. [Google Scholar]
- Ciga, O.; Xu, T.; Martel, A.L. Self supervised contrastive learning for digital histopathology. Mach. Learn. Appl. 2022, 7, 100198. [Google Scholar] [CrossRef]
- Luo, C.; Yang, X.; Yuille, A. Self-supervised pillar motion learning for autonomous driving. In Proceedings of the IEEE/CVF Conference on Computer Vision and Pattern Recognition 2021, Nashville, TN, USA, 19–25 June 2021; pp. 3183–3192. [Google Scholar]
- Chowdhury, A.; Rosenthal, J.; Waring, J.; Umeton, R. Applying self-supervised learning to medicine: Review of the state of the art and medical implementations. Informatics 2021, 8, 59. [Google Scholar] [CrossRef]
- Xing, X.; Liang, G.; Wang, C.; Jacobs, N.; Lin, A.L. Self-Supervised Learning Application on COVID-19 Chest X-ray Image Classification Using Masked AutoEncoder. Bioengineering 2023, 10, 901. [Google Scholar] [CrossRef]
- Hatamizadeh, A.; Tang, Y.; Nath, V.; Yang, D.; Myronenko, A.; Landman, B.; Roth, H.R.; Xu, D. Unetr: Transformers for 3d medical image segmentation. In Proceedings of the IEEE/CVF Winter Conference on Applications of Computer Vision 2022, Waikoloa, HI, USA, 3–8 January 2022; pp. 574–584. [Google Scholar]
- Tang, Y.; Yang, D.; Li, W.; Roth, H.R.; Landman, B.; Xu, D.; Nath, V.; Hatamizadeh, A. Self-supervised pre-training of swin transformers for 3d medical image analysis. In Proceedings of the IEEE/CVF Conference on Computer Vision and Pattern Recognition 2022, New Orleans, LA, USA, 18–24 June 2022; pp. 20730–20740. [Google Scholar]
- Fedorov, A.; Wu, L.; Sylvain, T.; Luck, M.; DeRamus, T.P.; Bleklov, D.; Plis, S.M.; Calhoun, V.D. On self-supervised multimodal representation learning: An application to Alzheimer’s disease. In Proceedings of the 2021 IEEE 18th International Symposium on Biomedical Imaging (ISBI), Nice, France, 13–16 April 2021; pp. 1548–1552. [Google Scholar]
- Gaser, C.; Dahnke, R.; Thompson, P.M.; Kurth, F.; Luders, E.; Initiative, A.D.N. CAT—A computational anatomy toolbox for the analysis of structural MRI data. bioRxiv 2022. [Google Scholar] [CrossRef]
- Ashburner, J.; Barnes, G.; Chen, C.C.; Daunizeau, J.; Flandin, G.; Friston, K.; Kiebel, S.; Kilner, J.; Litvak, V.; Moran, R.; et al. SPM12 Manual; Wellcome Trust Centre for Neuroimaging: London, UK, 2014; Volume 2464. [Google Scholar]
- Chen, X.; Fan, H.; Girshick, R.; He, K. Improved baselines with momentum contrastive learning. arXiv 2020, arXiv:2003.04297. [Google Scholar]
- He, K.; Fan, H.; Wu, Y.; Xie, S.; Girshick, R. Momentum contrast for unsupervised visual representation learning. In Proceedings of the IEEE/CVF Conference on Computer Vision and Pattern Recognition 2020, Seattle, WA, USA, 14–19 June 2020; pp. 9729–9738. [Google Scholar]
- Caron, M.; Misra, I.; Mairal, J.; Goyal, P.; Bojanowski, P.; Joulin, A. Unsupervised learning of visual features by contrasting cluster assignments. Adv. Neural Inf. Process. Syst. 2020, 33, 9912–9924. [Google Scholar]
- He, K.; Zhang, X.; Ren, S.; Sun, J. Deep residual learning for image recognition. In Proceedings of the IEEE Conference on Computer Vision and Pattern Recognition 2016, Las Vegas, NV, USA, 27–30 June 2016; pp. 770–778. [Google Scholar]
- Loshchilov, I.; Hutter, F. Decoupled weight decay regularization. arXiv 2017, arXiv:1711.05101. [Google Scholar]
- Paszke, A.; Gross, S.; Massa, F.; Lerer, A.; Bradbury, J.; Chanan, G.; Killeen, T.; Lin, Z.; Gimelshein, N.; Antiga, L.; et al. Pytorch: An imperative style, high-performance deep learning library. Adv. Neural Inf. Process. Syst. 2019, 32. [Google Scholar]
- Pedregosa, F.; Varoquaux, G.; Gramfort, A.; Michel, V.; Thirion, B.; Grisel, O.; Blondel, M.; Prettenhofer, P.; Weiss, R.; Dubourg, V.; et al. Scikit-learn: Machine learning in Python. J. Mach. Learn. Res. 2011, 12, 2825–2830. [Google Scholar]
- Wu, Z.; Xiong, Y.; Yu, S.X.; Lin, D. Unsupervised feature learning via non-parametric instance discrimination. In Proceedings of the IEEE Conference on Computer Vision and Pattern Recognition 2018, Salt Lake City, UT, USA, 18–22 June 2018; pp. 3733–3742. [Google Scholar]
- Lee, D.H. Pseudo-label: The simple and efficient semi-supervised learning method for deep neural networks. In Proceedings of the Workshop on Challenges in Representation Learning, ICML, Atlanta, GA, USA, 16–21 June 2013; Volume 3, p. 896. [Google Scholar]
- Miyato, T.; Maeda, S.i.; Koyama, M.; Ishii, S. Virtual adversarial training: A regularization method for supervised and semi-supervised learning. IEEE Trans. Pattern Anal. Mach. Intell. 2018, 41, 1979–1993. [Google Scholar] [CrossRef]
- Athiwaratkun, B.; Finzi, M.; Izmailov, P.; Wilson, A.G. There are many consistent explanations of unlabeled data: Why you should average. arXiv 2018, arXiv:1806.05594. [Google Scholar]
- Purushwalkam, S.; Gupta, A. Demystifying contrastive self-supervised learning: Invariances, augmentations and dataset biases. Adv. Neural Inf. Process. Syst. 2020, 33, 3407–3418. [Google Scholar]
- Breiman, L. Random forests. Mach. Learn. 2001, 45, 5–32. [Google Scholar] [CrossRef]
- Hajian-Tilaki, K. Receiver operating characteristic (ROC) curve analysis for medical diagnostic test evaluation. Casp. J. Intern. Med. 2013, 4, 627. [Google Scholar]
- Seyfioğlu, M.S.; Liu, Z.; Kamath, P.; Gangolli, S.; Wang, S.; Grabowski, T.; Shapiro, L. Brain-Aware Replacements for Supervised Contrastive Learning in Detection of Alzheimer’s Disease. In Proceedings of the International Conference on Medical Image Computing and Computer-Assisted Intervention 2022, Singapore, 18–22 September 2022; pp. 461–470. [Google Scholar]
- Jiang, H.; Miao, C. Pre-Training 3D Convolutional Neural Networks for Prodromal Alzheimer’s Disease Classification. In Proceedings of the 2022 International Joint Conference on Neural Networks (IJCNN), Padua, Italy, 18–23 July 2022; pp. 1–8. [Google Scholar]
- Xu, L.; Wu, X.; Li, R.; Chen, K.; Long, Z.; Zhang, J.; Guo, X.; Yao, L.; Alzheimer’s Disease Neuroimaging Initiative. Prediction of progressive mild cognitive impairment by multi-modal neuroimaging biomarkers. J. Alzheimer’s Dis. 2016, 51, 1045–1056. [Google Scholar] [CrossRef] [PubMed]
- Liu, X.; Chen, K.; Weidman, D.; Wu, T.; Lure, F.; Li, J.; Initiative, A.D.N. A novel transfer learning model for predictive analytics using incomplete multimodality data. IISE Trans. 2021, 53, 1010–1022. [Google Scholar] [CrossRef] [PubMed]
- Li, J.; Zhou, P.; Xiong, C.; Hoi, S.C. Prototypical contrastive learning of unsupervised representations. arXiv 2020, arXiv:2005.04966. [Google Scholar]
- Hatamizadeh, A.; Nath, V.; Tang, Y.; Yang, D.; Roth, H.R.; Xu, D. Swin unetr: Swin transformers for semantic segmentation of brain tumors in mri images. In Proceedings of the International MICCAI Brainlesion Workshop 2021, Virtual Event, 27 September 2021; pp. 272–284. [Google Scholar]
- Chen, S.; Ma, K.; Zheng, Y. Med3d: Transfer learning for 3d medical image analysis. arXiv 2019, arXiv:1904.00625. [Google Scholar]
- Ellis, K.A.; Bush, A.I.; Darby, D.; De Fazio, D.; Foster, J.; Hudson, P.; Lautenschlager, N.T.; Lenzo, N.; Martins, R.N.; Maruff, P.; et al. The Australian Imaging, Biomarkers and Lifestyle (AIBL) study of aging: Methodology and baseline characteristics of 1112 individuals recruited for a longitudinal study of Alzheimer’s disease. Int. Psychogeriatr. 2009, 21, 672–687. [Google Scholar] [CrossRef] [PubMed]


| Gender | Age | Education Years | Mini-Mental State Examination | |
|---|---|---|---|---|
| Converter | 42.41% | 75.34 (7.51) | 15.82 (2.81) | 26.97 (2.01) |
| Non-Converter | 42.12% | 72.45 (7.59) | 16.32 (2.73) | 28.33 (1.62) |
| Unlabeled | 39.73% | 75.79 (8.16) | 16.06 (2.63) | 27.82 (2.12) |
| Model | MoCo | SMoCo | |||||
|---|---|---|---|---|---|---|---|
| 0 | 0.25 | 0.5 | 1 | 2 | 3 | 5 | |
| AUROC | 76.37 (3.60) | 79.24 (3.32) | 80.35 (2.94) | 81.07 (3.02) | 80.63 (3.71) | 79.41 (3.40) | 78.96 (3.55) |
| Category | Model | AUROC | Accuracy | Sensitivity | Specificity |
|---|---|---|---|---|---|
| Supervised | Supervised Classification | 81.53 (3.81) | 77.68 (4.01) | 73.20 (4.22) | 78.89 (3.65) |
| Semi-Supervised | Pseudo-Labeling | 81.89 (3.93) | 77.97 (3.53) | 73.22 (3.68) | 79.18 (3.97) |
| Virtual Adversarial Training | 82.03 (3.36) | 78.13 (3.99) | 73.43 (2.98) | 78.03 (3.50) | |
| Stochastic Weight Averaging | 82.27 (3.88) | 78.19 (3.45) | 73.65 (3.39) | 78.08 (4.10) | |
| Self-Supervised | MoCo and Fine-Tuning | 83.01 (3.59) | 78.37 (3.13) | 74.23 (2.89) | 78.39 (3.77) |
| SMoCo and Random Forest | 84.86 (3.31) | 79.10 (3.09) | 74.96 (3.58) | 80.03 (3.12) | |
| SMoCo and Fine-Tuning | 85.17 (2.87) | 81.09 (3.38) | 77.39 (2.97) | 82.17 (3.26) |
Disclaimer/Publisher’s Note: The statements, opinions and data contained in all publications are solely those of the individual author(s) and contributor(s) and not of MDPI and/or the editor(s). MDPI and/or the editor(s) disclaim responsibility for any injury to people or property resulting from any ideas, methods, instructions or products referred to in the content. |
© 2023 by the authors. Licensee MDPI, Basel, Switzerland. This article is an open access article distributed under the terms and conditions of the Creative Commons Attribution (CC BY) license (https://creativecommons.org/licenses/by/4.0/).
Share and Cite
Kwak, M.G.; Su, Y.; Chen, K.; Weidman, D.; Wu, T.; Lure, F.; Li, J.; for the Alzheimer’s Disease Neuroimaging Initiative. Self-Supervised Contrastive Learning to Predict the Progression of Alzheimer’s Disease with 3D Amyloid-PET. Bioengineering 2023, 10, 1141. https://doi.org/10.3390/bioengineering10101141
Kwak MG, Su Y, Chen K, Weidman D, Wu T, Lure F, Li J, for the Alzheimer’s Disease Neuroimaging Initiative. Self-Supervised Contrastive Learning to Predict the Progression of Alzheimer’s Disease with 3D Amyloid-PET. Bioengineering. 2023; 10(10):1141. https://doi.org/10.3390/bioengineering10101141
Chicago/Turabian StyleKwak, Min Gu, Yi Su, Kewei Chen, David Weidman, Teresa Wu, Fleming Lure, Jing Li, and for the Alzheimer’s Disease Neuroimaging Initiative. 2023. "Self-Supervised Contrastive Learning to Predict the Progression of Alzheimer’s Disease with 3D Amyloid-PET" Bioengineering 10, no. 10: 1141. https://doi.org/10.3390/bioengineering10101141