Flood Hazard Analysis of Proposed Regulator on Shatt Al-Arab River


1
Civil Engineering Department, Engineering College, Basrah University, Basrah 61004, Iraq
2
Water Resources Directorate in Basrah Province, Basrah 61001, Iraq
*
Author to whom correspondence should be addressed.
Hydrology 2019, 6(3), 80; https://doi.org/10.3390/hydrology6030080
Submission received: 1 July 2019
/
Revised: 29 August 2019
/
Accepted: 30 August 2019
/
Published: 3 September 2019
Abstract
:Recently, the Shatt Al-Arab River has suffered from increased salinization of its water due to the reduction of freshwater from its tributaries, mainly from the Tigris River, which has resulted in long-distance salinity intrusion. Therefore, there is a need to establish a regulator in the Abu-Flus district to prevent salt intrusion. The aim of the study is to investigate the effect of a proposed regulator on the Shatt Al-Arab River with simulations using the Hydrologic Engineering Center’s River Analysis System (HEC-RAS) model. The upstream boundary conditions were the daily discharges of Tigris River and the downstream boundary conditions were the hourly water stages of the Shatt Al-Arab River. The river model was operated by using the daily discharges recorded in 2014 for calibration and verification of the model. Then, a program operated with a suggested regulator and a flood wave assumed a 200 m3/s peak flow for a duration of 27 days. The flooding occurrence period of the flood wave was investigated under the effect of three study cases of regulator gates, which were fully open (case B1), tide gate (case B2), and fully closed (case B3). The results showed that flooding inundation occurred only in two cases (B2 and B3). These results will encourage the construction of the regulator considering certain precautions.
1. Introduction
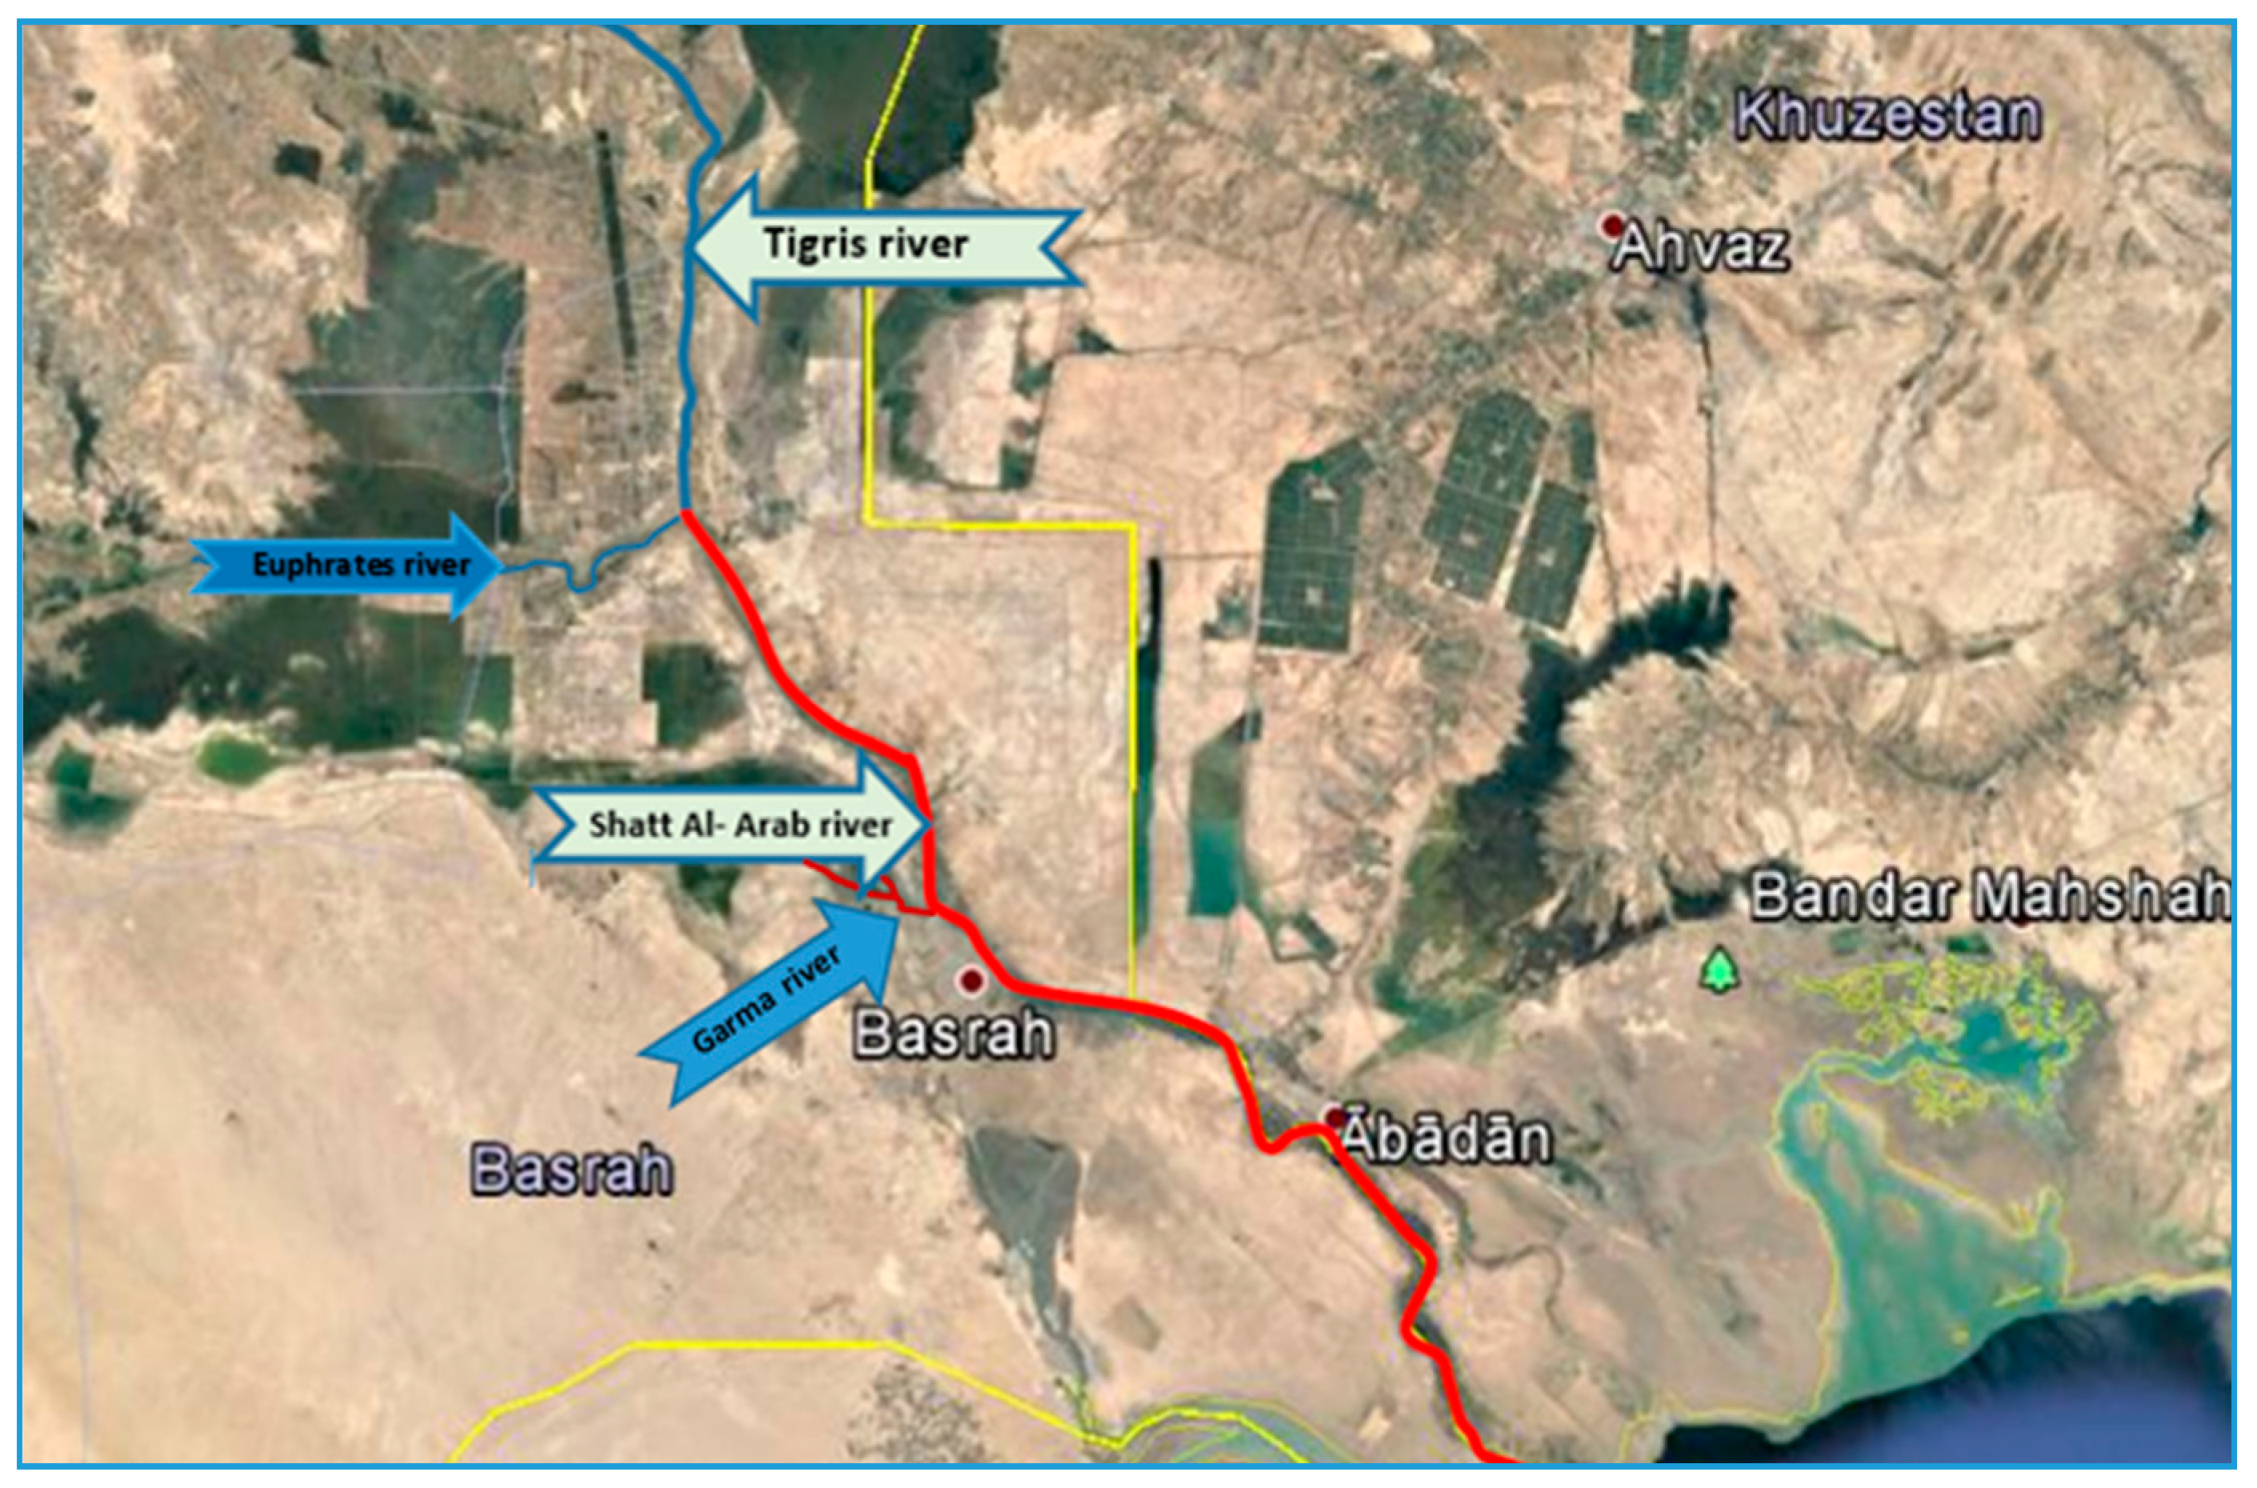
The Shatt Al-Arab River is located in southern Iraq. It is formed from the confluence of the Euphrates and Tigris Rivers at the Al-Qurna district, north of Basrah Province (31°00′17″N and 47°26′29″E). Then, it flows to the south of Basrah Province towards the Arabian Gulf [1], (see Figure 1). Recently, the hydrological system of the river has been influenced mainly by the discharge of the Tigris River and the tides from the Arabian Gulf [2]. The Shatt Al-Arab River has a length of about 200 km, the width varies in the range of 250 m to nearly 2 km, and the depth ranges from 8 to 17 m [3]. The tides in the Arabian Gulf are mostly semidiurnal, and their impact is felt up to the city of Al-Qurna in the north of the Basrah governorate [4].
The salinity of the water in the Shatt Al-Arab River has increased dramatically in recent years, especially in the summer season. The main reason for this is the reduction of incoming freshwater from the Tigris River (less than 50 m3/s), which has led to the intrusion of saltwater during high tide from the Arabian Gulf to the upstream of the Shatt Al-Arab River, reaching up to the Qurna district [5]. The Water Resources Directorate in Basrah indicated that the total dissolved solids (TDS) value of the water of the Shatt Al-Arab River exceeded 15,000 ppm at the Basrah center in July 2018. The Basrah governorate was adversely influenced by the high salinity of the water in the Shatt Al-Arab River, which is the main source for irrigation and water supply. Specialists have suggested constructing a regulator on the Shatt Al-Arab River to avoid the intrusion of seawater in order to solve this issue. The suggested location for this regulator is near to the Abu-Flus port. However, there are two contradictory views regarding the decision to establish a regulator on the Shatt Al-Arab River. Some have supported the establishment of a regulator because they believe that the regulator is necessary for stopping the intrusion of saltwater from the Arabian Gulf for a long distance towards the upstream of the Shatt Al-Arab River. Others, however, are against constructing a regulator on the river because they believe that this regulator will significantly raise the water levels in the Shatt Al-Arab River, which may expose Basrah to flood risks. This study attempted to solve the dispute between these two groups through a flood simulation.
Floods are among the most destructive water-related hazards and are responsible for losses of human lives, infrastructure damage, and economic losses [6]. Flood inundation modeling and mapping and associated flood risk assessment should be applied using suitable and efficient tools. The HEC-RAS model, a computer program developed by the US Department of Defense, Army Corps of Engineers (USACE), is a world-famous tool and has been used by many researchers to simulate floods.
Some researchers have used 1D HEC-RAS models to represent flooding [7,8,9,10,11,12,13,14], while others have used 2D HEC-RAS models [15,16,17,18,19,20,21]. The only previous study on the effect of regulator construction on the Shatt Al-Arab River was carried out by Hamdan [14] in 2016 using 1D HEC-RAS. The author assumed six cases of discharge upstream of the Shatt Al-Arab River and three cases of regulators gates. Hamdan found that the regulators would raise the river water level by 1 and 3 m in cases of open and closed gates, respectively.
However, the selection of a 1D modeling approach can be misguided, leading to erroneous outcomes when applied in areas with composite river topography. Thus, under composite flow conditions, further investigation is needed in the selection of the modeling approach. In such cases, the use of a 2D modeling approach is generally suggested since it provides more accurate or realistic results. These models are able to simulate floodplain inundation and river hydraulics, as has been demonstrated in many studies [22]. Therefore, the main objective here was to apply a hybrid model (1D/2D) using the HEC-RAS software version 5.0.3 to assess the impact of flooding in the Shatt Al-Arab River on Basrah due to the construction of a regulator near Abu-Flus port.
2. Materials and Methods
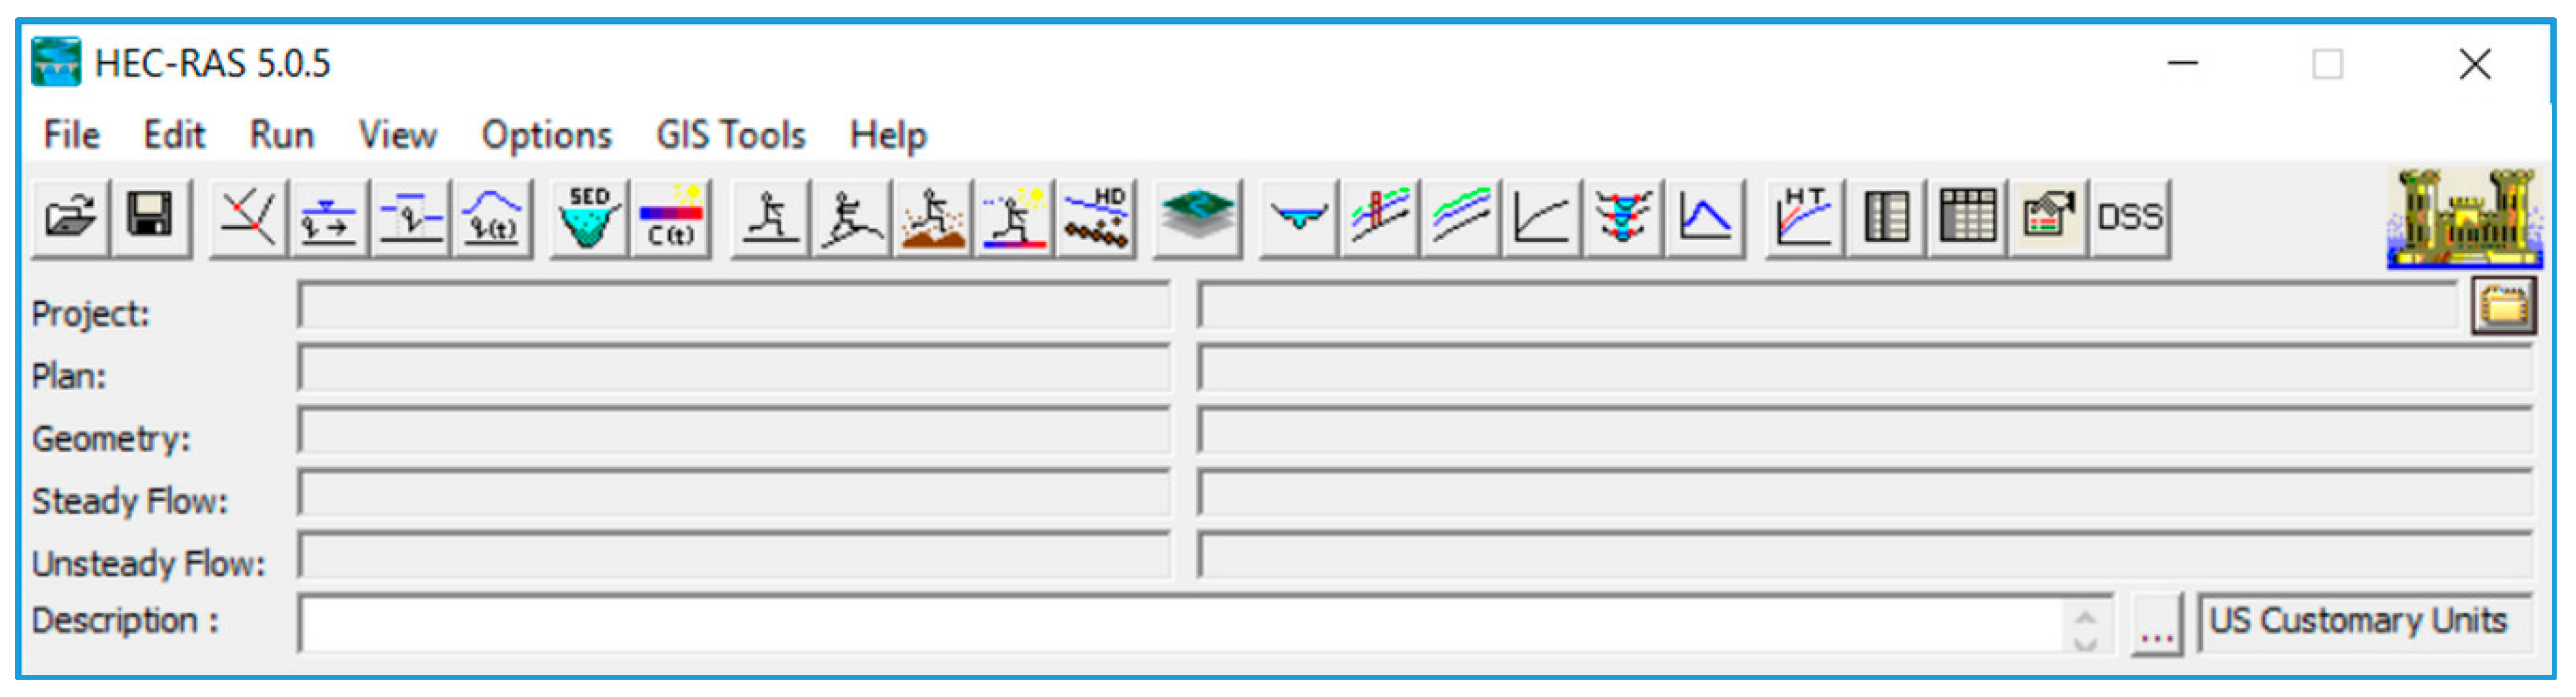
2.1. HEC-RAS Model
The HEC-RAS model can simulate the hydraulics of water flow through natural rivers [23]. The main objective of the HEC-RAS program is to compute water-surface elevations and velocities at all locations of interest. This model is based on an implicit finite volume scheme to solve the continuity and momentum equations that govern the hydrodynamics of river flow. The finite volume is a numerical solution that is a robust method extensively used in computational fluid dynamics [24].
Figure 2 shows the main menu of the HEC-RAS version 5.0.3.
2.2. Hydraulic Model
The flow in rivers is described by shallow water equations in which the vertical velocity component is assumed to be zero and the variables can be integrated vertically [8]. The shallow water equations are written in the following form:
Continuity Equation:
Momentum Equations:
where x and y are the horizontal Cartesian coordinates, h is the water depth, u and v are the depth-averaged flow velocities in the x and y directions, Z is the water surface elevation (m), g is the gravitational acceleration (m/s2), ρ is the density of water (kg/m3), τxx and τyy are the depth-averaged turbulent stresses (N/m2), and Fx and Fy are the Coriolis forces (N). The turbulent stresses τij were calculated with the classical k-ε turbulence model, which employs eddy viscosity:
where
where k is the turbulent kinetic energy (m2/s2), is the dissipation rate (m2/s3), and νt is the eddy viscosity (m2/s).
2.3. River System Schematic
The river system schematic consisted of four river reaches which had been drawn in the model on the map of the study area, as shown in Figure 1. These reaches included 91.8 km of the Shatt Al-Arab River from the Al-Qurna confluence to Abu-Flus harbor, 27.5 km of the Euphrates River from the Al-Madina dam to the Al-Qurna confluence, 88.8 km of the Tigris River from the Qal’at Saleh regulator to the Al-Qurna confluence, and 2.5 km of the Garmat Ali River from the Garma bridge to the confluence with the Shatt Al-Arab River at the Al-Najibiya subdistrict. Therefore, the total length of the river reaches in the study area was 210.387 km.
2.4. Cross Sections
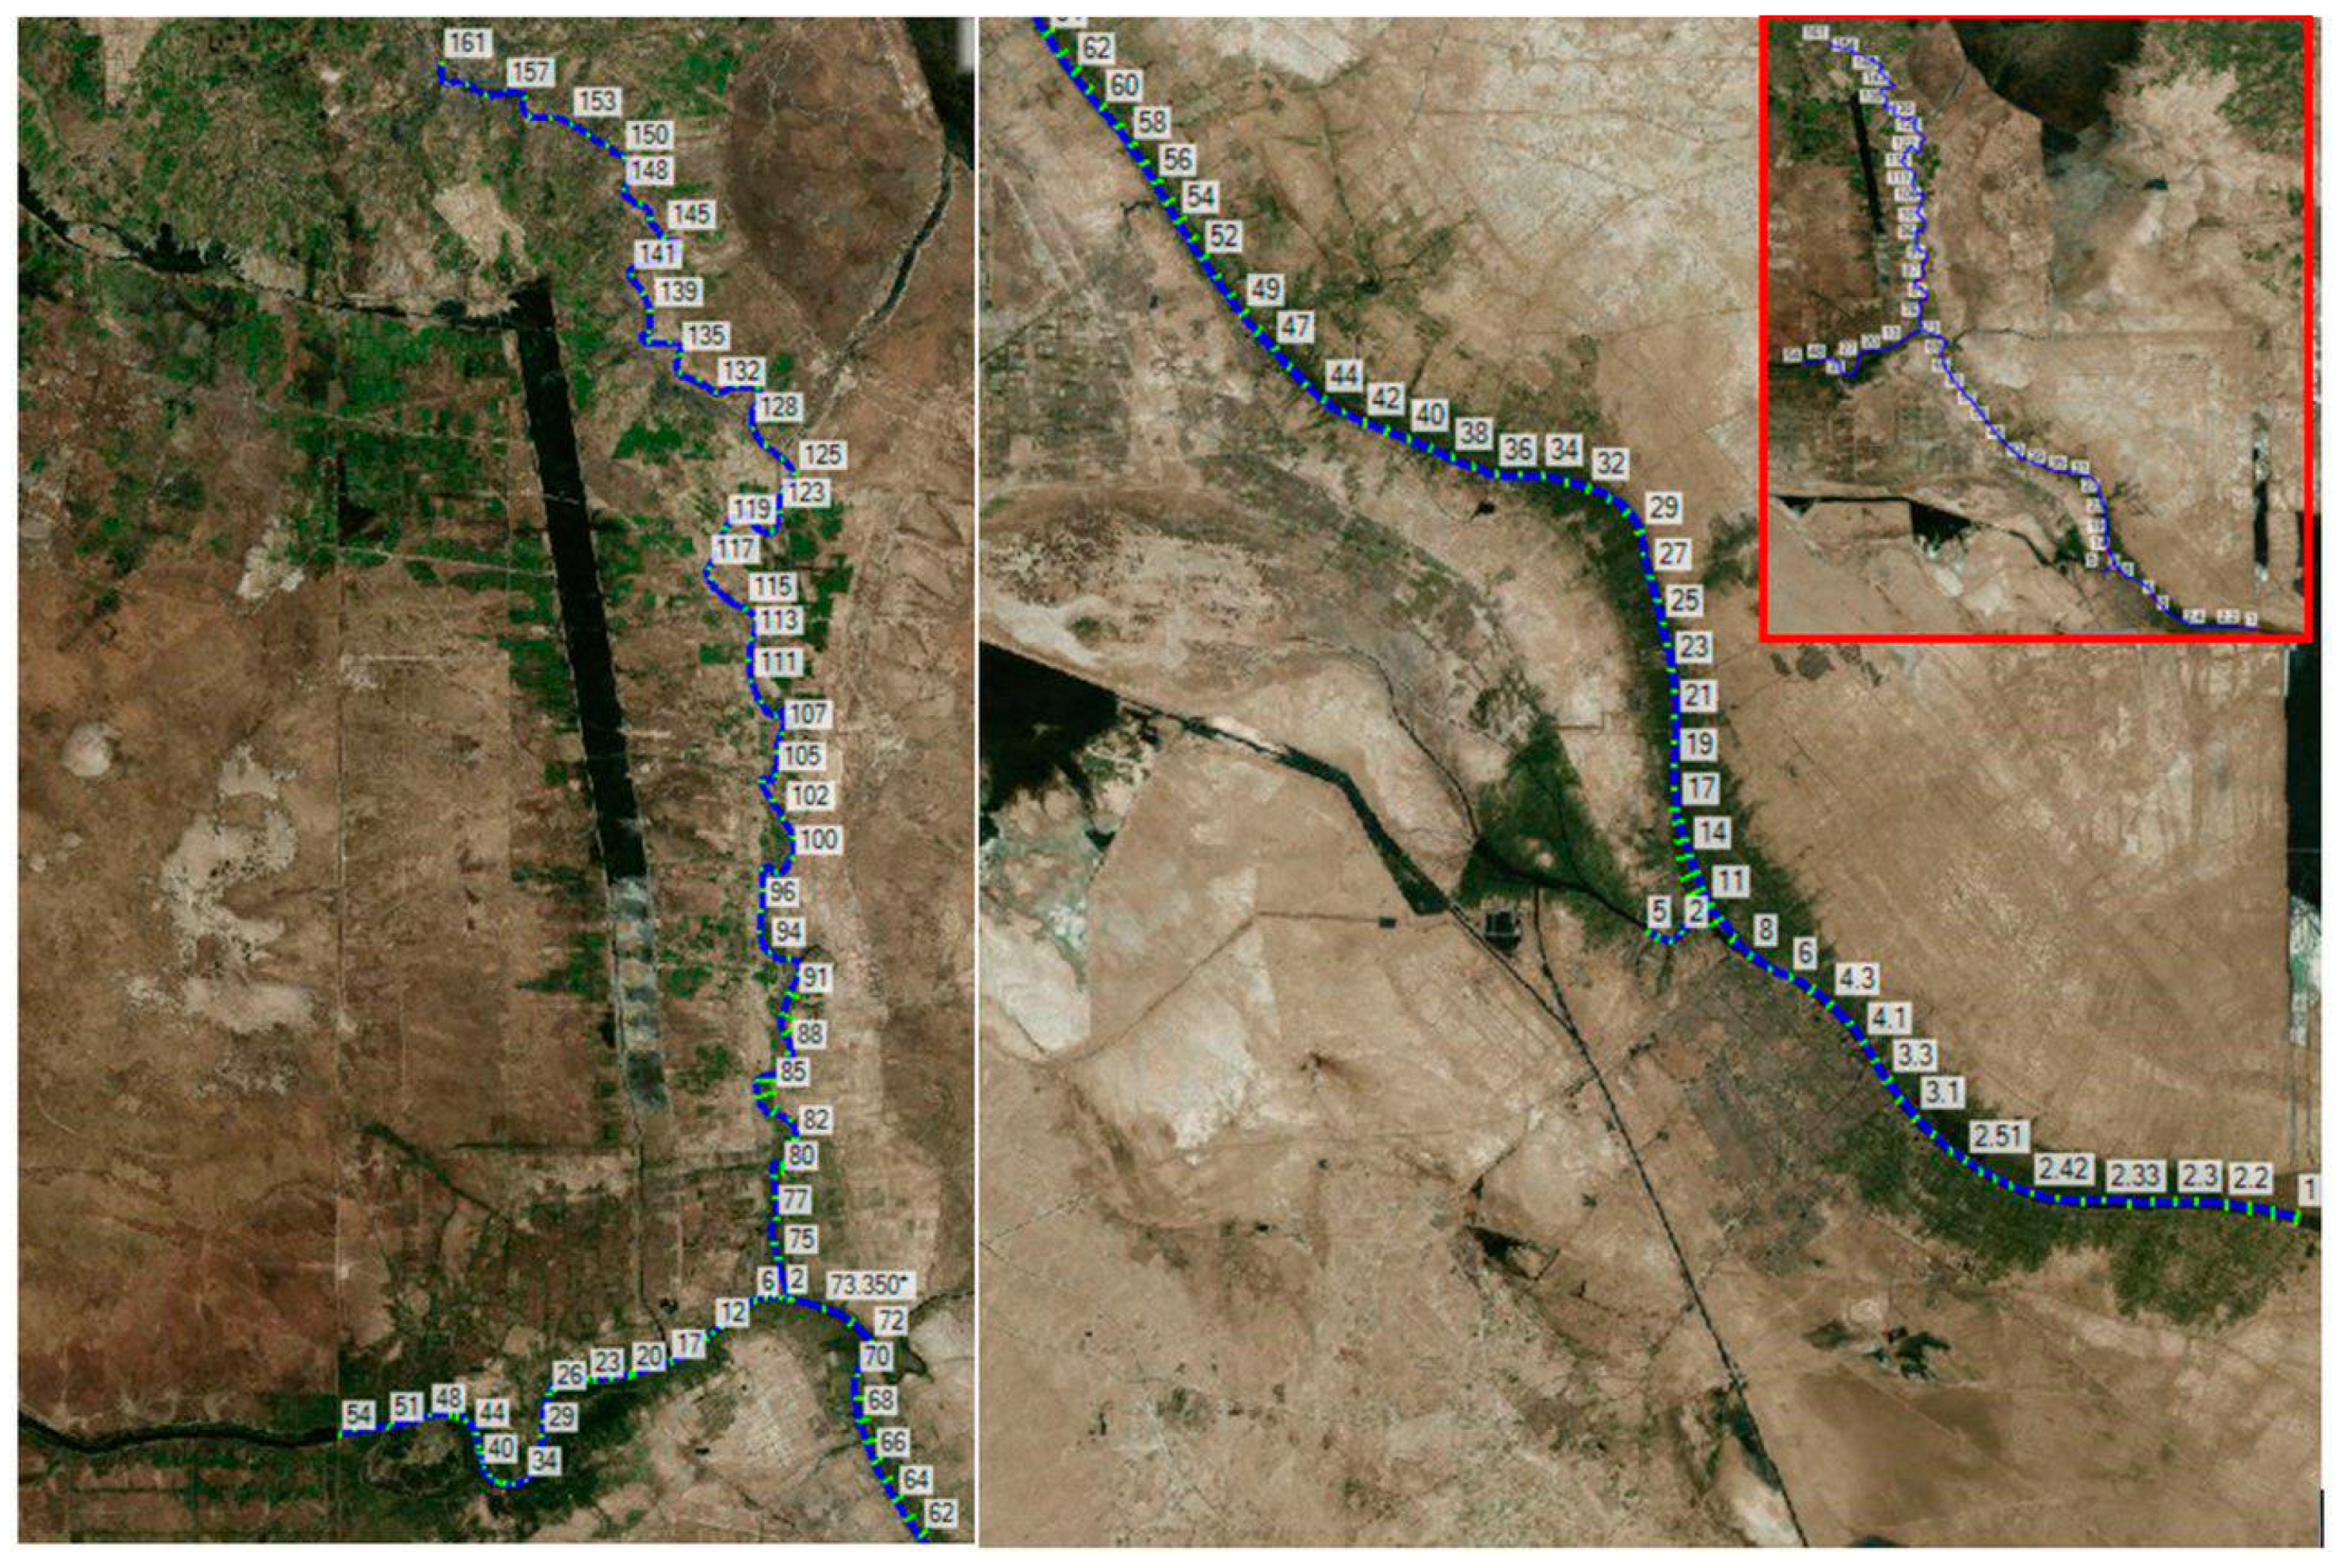
The cross sections of the Shatt Al-Arab River and its tributaries (Tigris, Euphrates, and Garmat Ali) were obtained from field measurements taken during the period from December 2016 to February 2017. The field measurements were carried out by means of the River-Surveyor M9 system by SonTek. The numbers of cross sections used to represent the geometry of the study area were 88, 54, 6, and 95, distributed along the reaches of the Tigris, Euphrates, Garmat Ali, and Shatt Al-Arab Rivers, respectively, as shown in Figure 3. The data used to describe the cross sections included the river station/cross-section number, lateral and elevation coordinates for each terrain point (station and elevation columns), Manning’s coefficients, reach lengths between adjacent cross sections, left and right bank stations, and channel contraction and expansion coefficients. These data are typically obtained by field surveys. Figure 4 shows the details of cross-section number 1 as an example.
2.5. Boundary Conditions
Boundary conditions were introduced upstream and downstream of the Shatt Al-Arab River, as shown below.
2.5.1. Upstream Boundary Condition
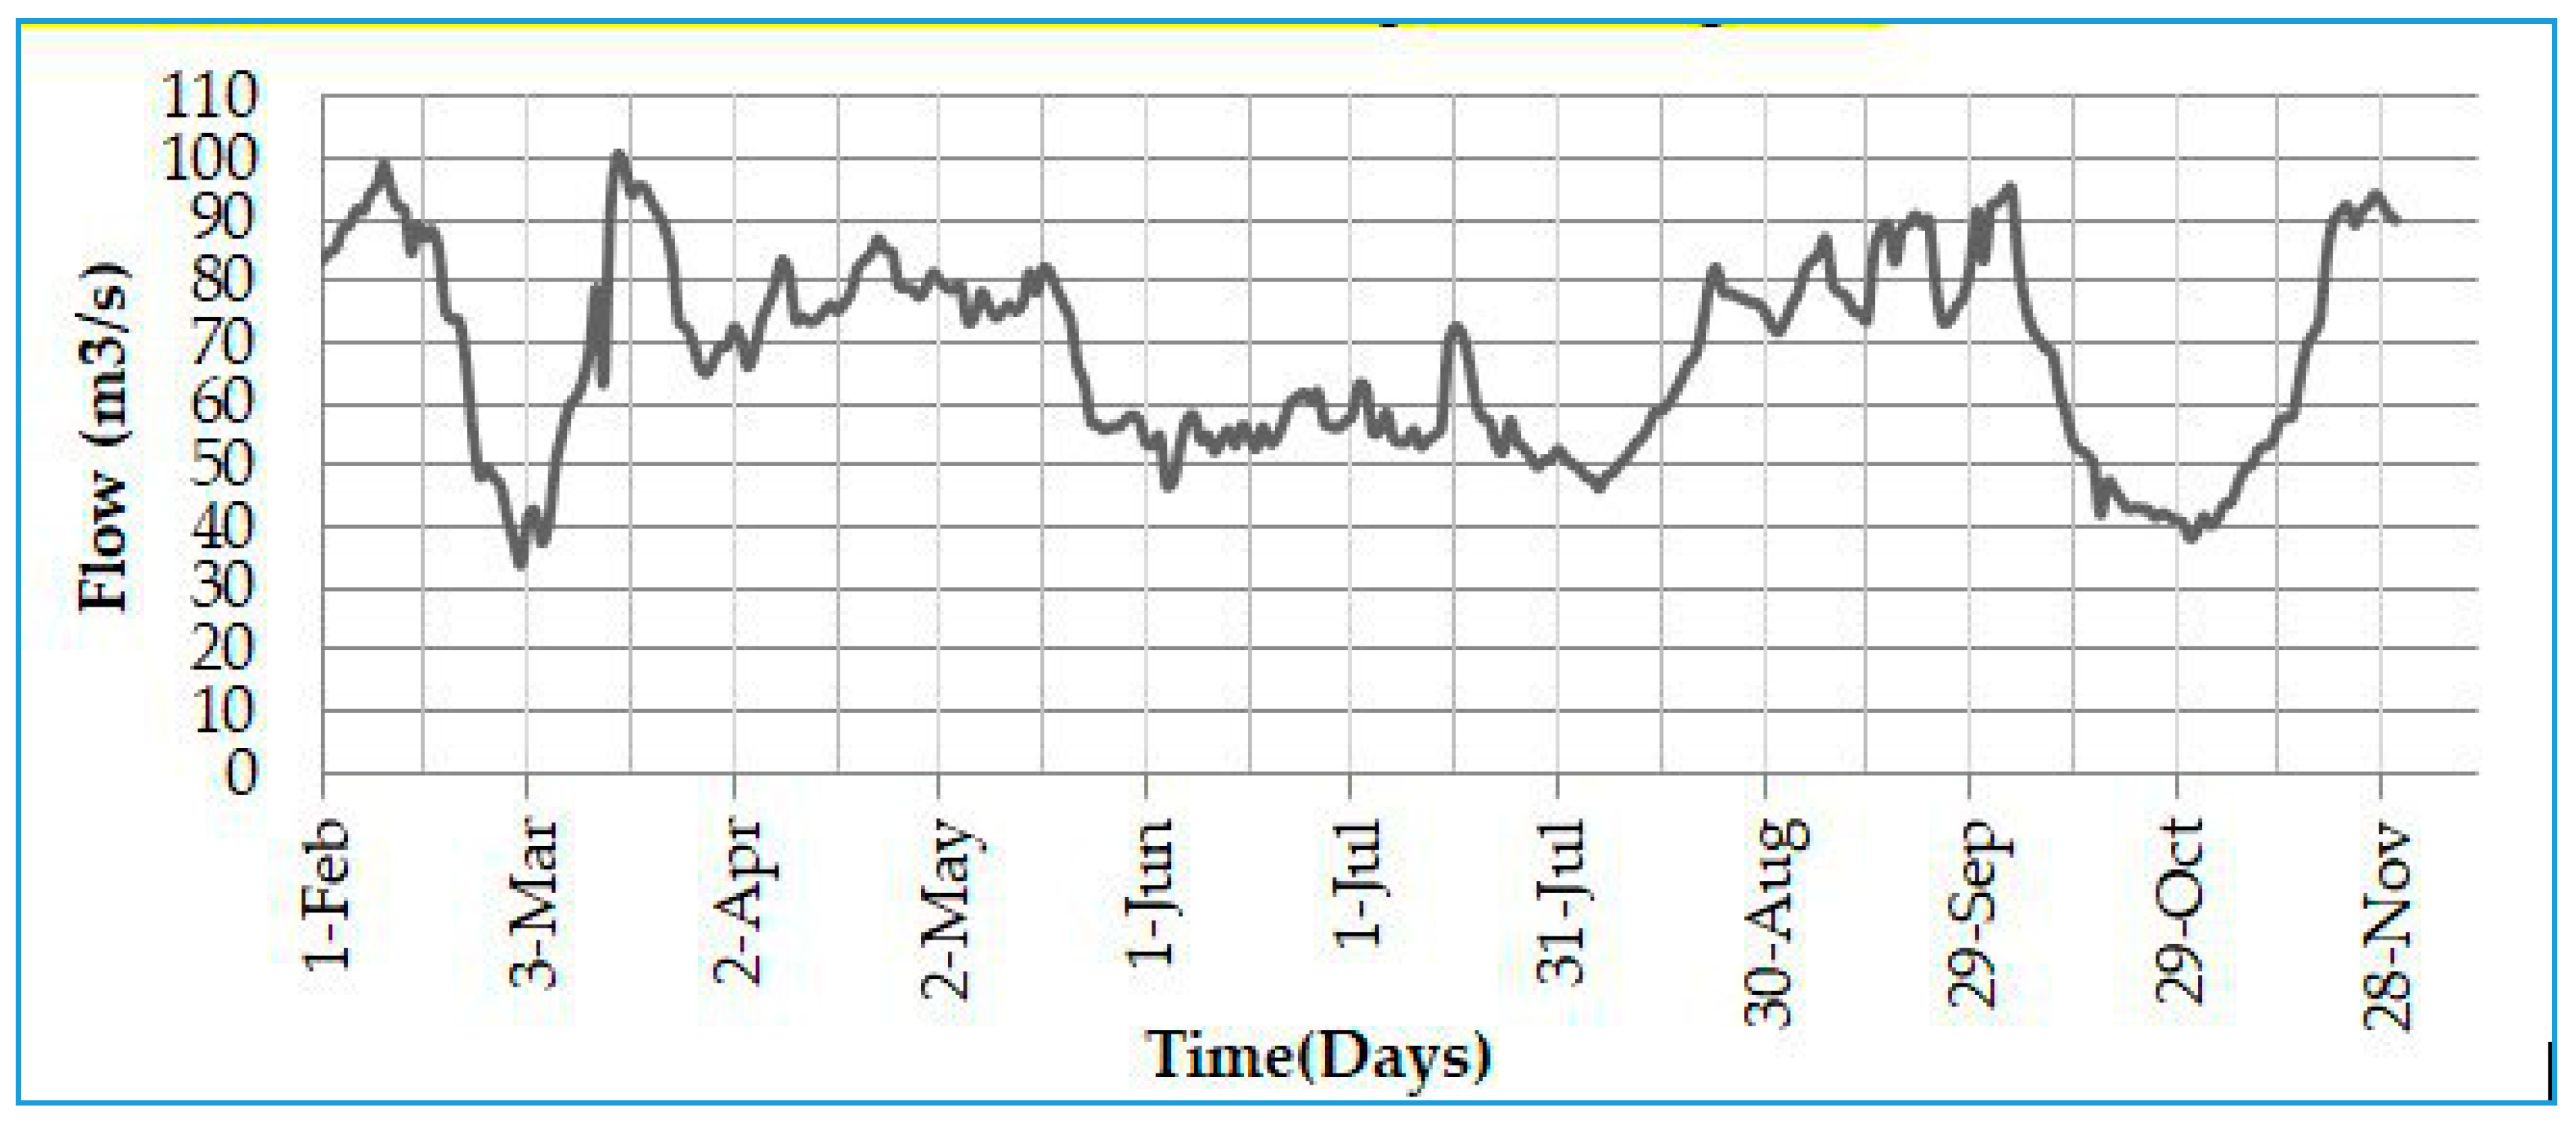
In the past, the sources of freshwater into the Shatt Al-Arab River came from the Tigris, Euphrates, and Karun Rivers. Presently, dams have been established on both the Euphrates and the Karun Rivers to prevent water flow into the Shatt Al-Arab. Therefore, the Tigris River became the only source of freshwater into the Shatt Al-Arab River. In this study, the upstream boundary condition was the daily flow discharges from the Tigris River behind the Qal’at Saleh regulator at cross-section 161 during the period from 1 February to 30 November 2014, as depicted in Figure 5.
2.5.2. Downstream Boundary Condition
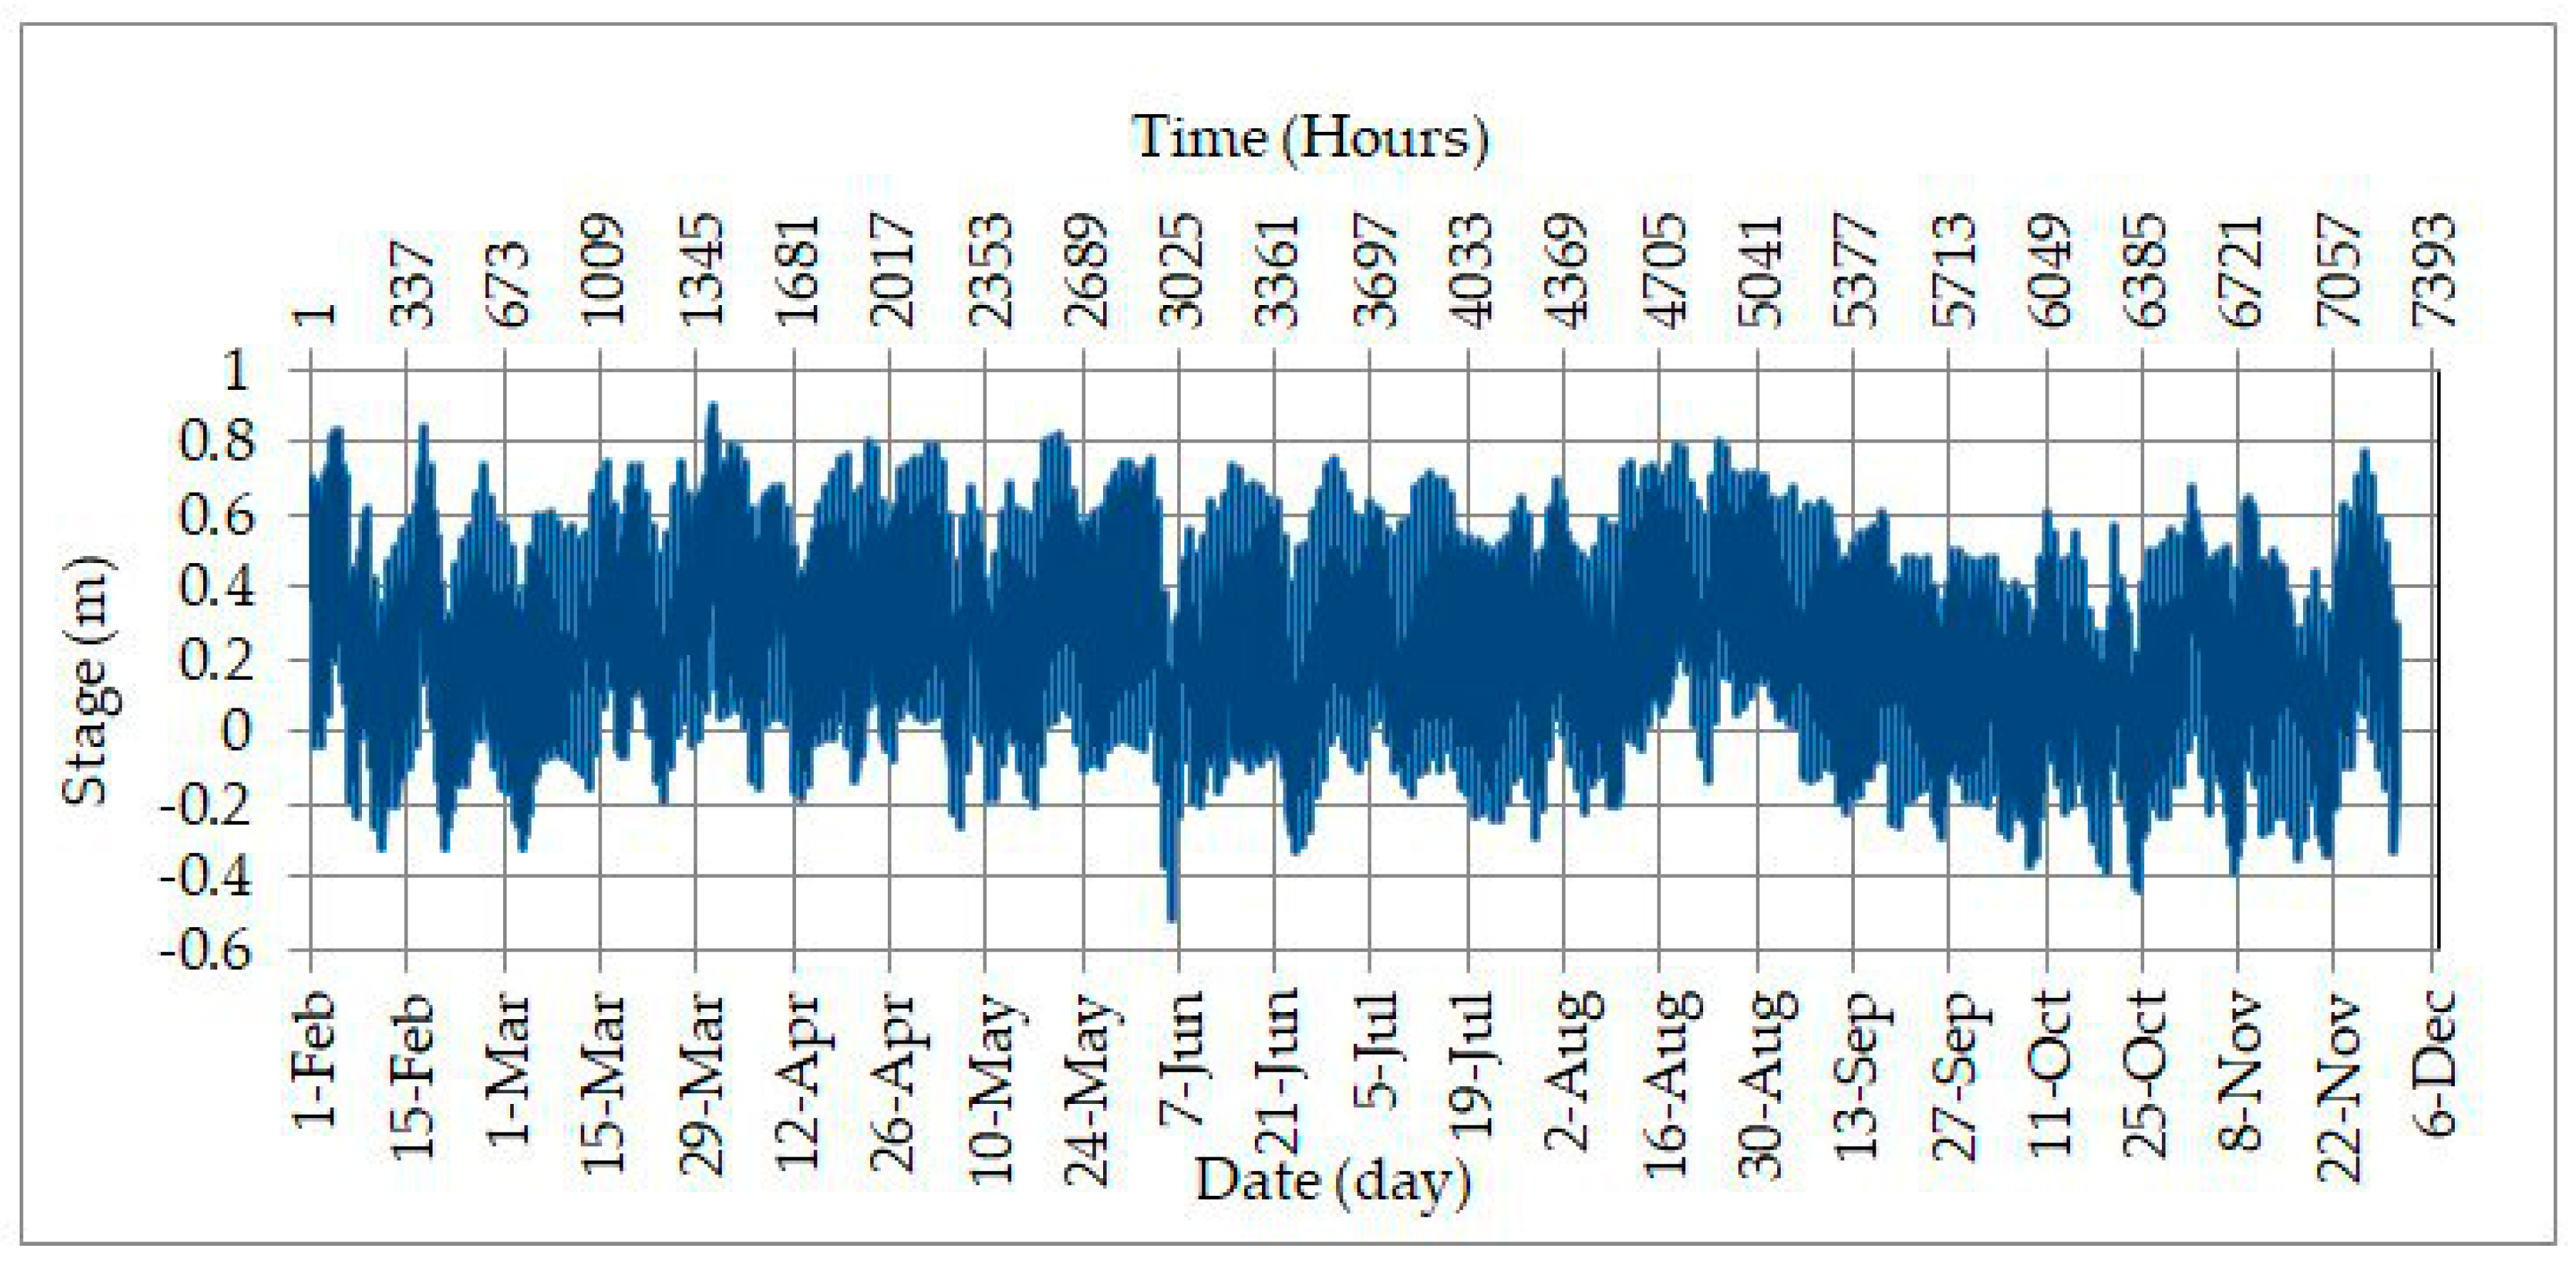
The downstream boundary condition for the study area was considered as the tidal records in the Shatt Al-Arab River near Abu-Flus harbor. The values of the tide (stage) in the Shatt Al-Arab River were taken from a tide recording station during the period from 1 February to 30 November 2014, as shown in Figure 6. Hence, the downstream boundary condition was the hourly water stages at cross-section 1, which is near the Abu-Flus subdistrict.
2.6. Model Calibration and Validation
Model calibration determines the right values of the model parameters by an iterative process of changing the values of the model parameters and comparing the model results with the real system to improve the model until the accuracy is judged to be acceptable. Manning’s roughness coefficient (n) was considered as a calibration parameter for the hydraulic models. n values are used to describe the resistance to flow due to channel roughness caused by sand or gravel bed, bank vegetation, and other obstructions [26]. In this study, the initial Manning’s roughness (n) values for all the reaches ranged from 0.020 to 0.033 for the main channel and 0.03 to 0.06 for the banks. Then, these initial values were modified during the calibration process until there was a good simulation between the simulated and measured stage levels at the sections of the Shatt Al-Arab River (sections 3.2 and 55) for the period from February to July 2014. Thereafter, the verification of the model was carried out on the same sections (sections 3.2 and 55) for measurements of water levels during the period from August to November 2014.
2.7. Two Dimensional Flood Flow
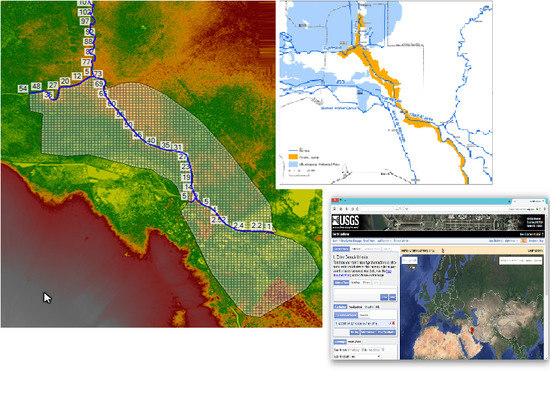
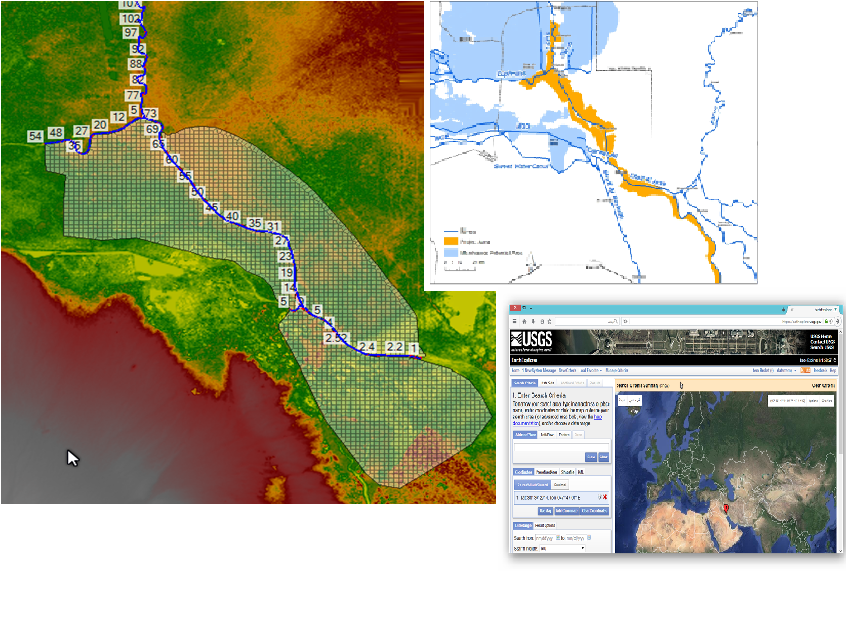
2.7.1. Digital Elevation Model (DEM)
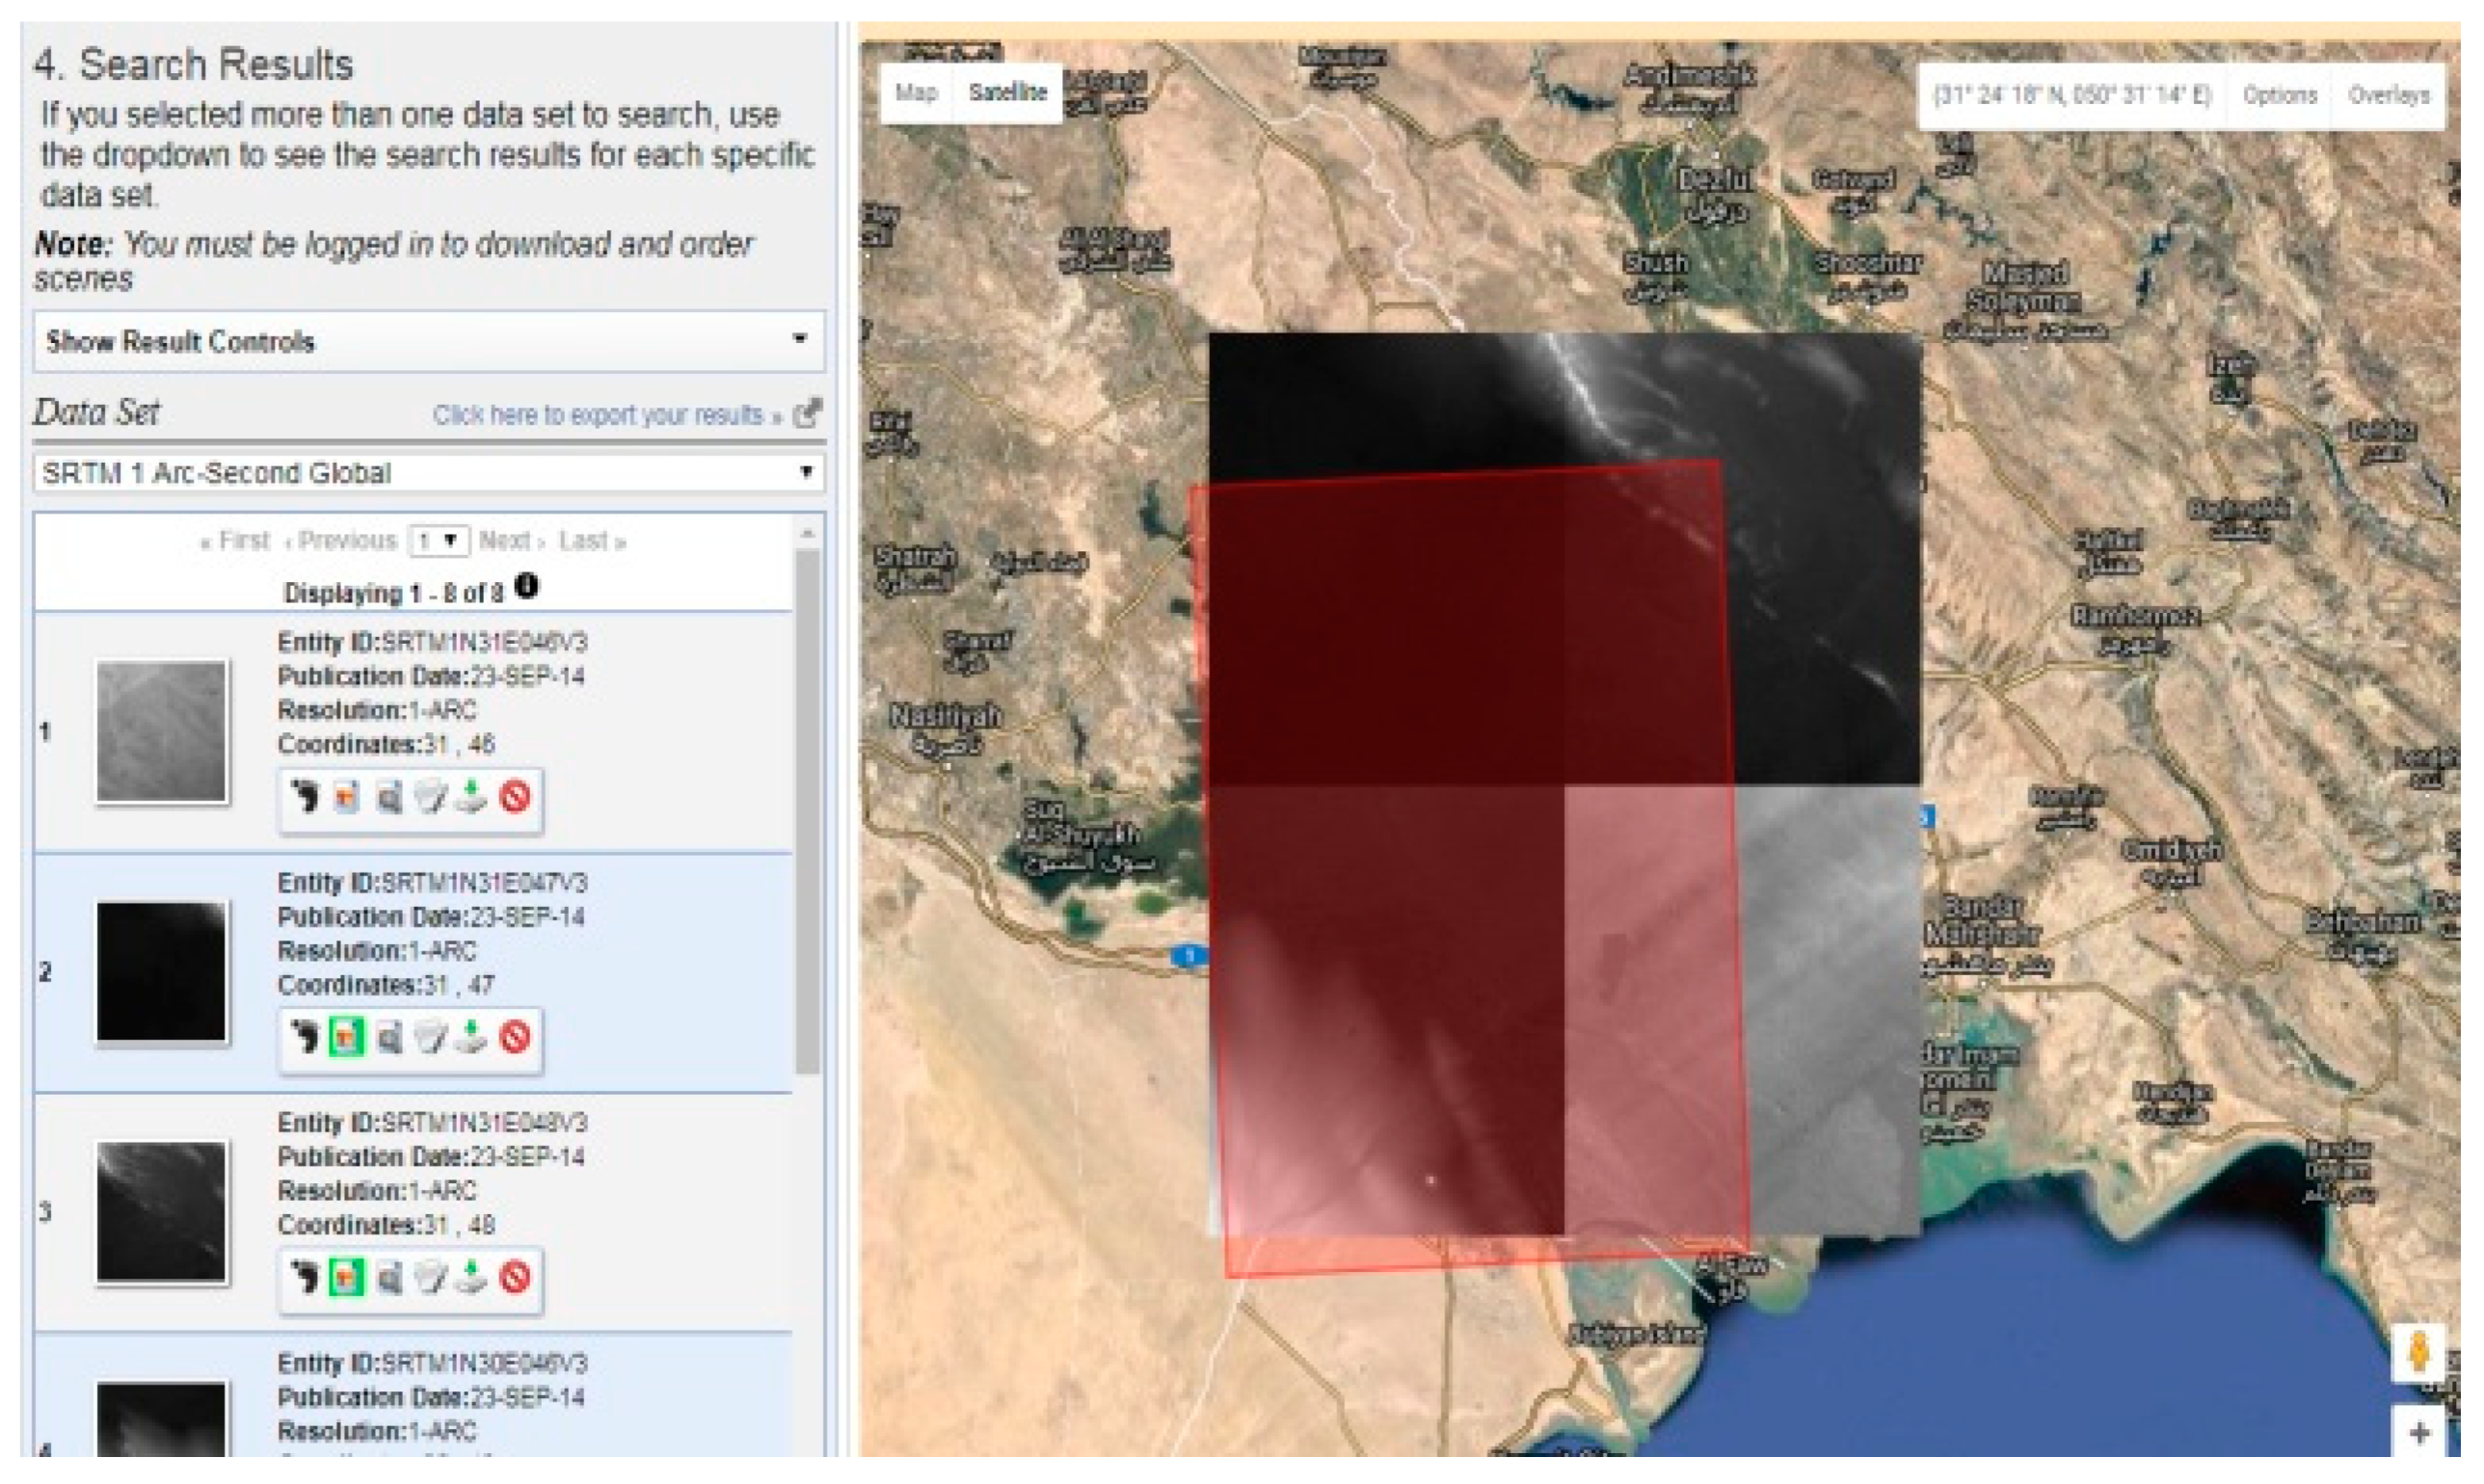
A DEM is a three-dimensional computer graphic representation of the ground surface topography, which is called a terrain‘s surface. A DEM can be represented in geographic information systems (GIS) as a raster (a square grid). DEMs are generally built using remote sensing techniques, but they may also be built from land surveying. In this study, Space Shuttle Radar Topography Mission (SRTM) was one source of DEM, which was downloaded from the United States Geological Survey (USGS) website (earthexplorer.usgs.gov), as shown in Figure 7. Four files of SRTM with a resolution 30 were downloaded from the USGS website to represent the DEM of the study area. These files were converted to raster formats and combined with the different rasters into a single one (mosaic to new raster) by ArcGIS software. Also, the resolution of the new raster was improved from 30 to 10 m. Then, the new raster was imported to RAS Mapper in the HEC-RAS model to create the terrain model of the study area.
2.7.2. Polygon of Two Dimensional Flow
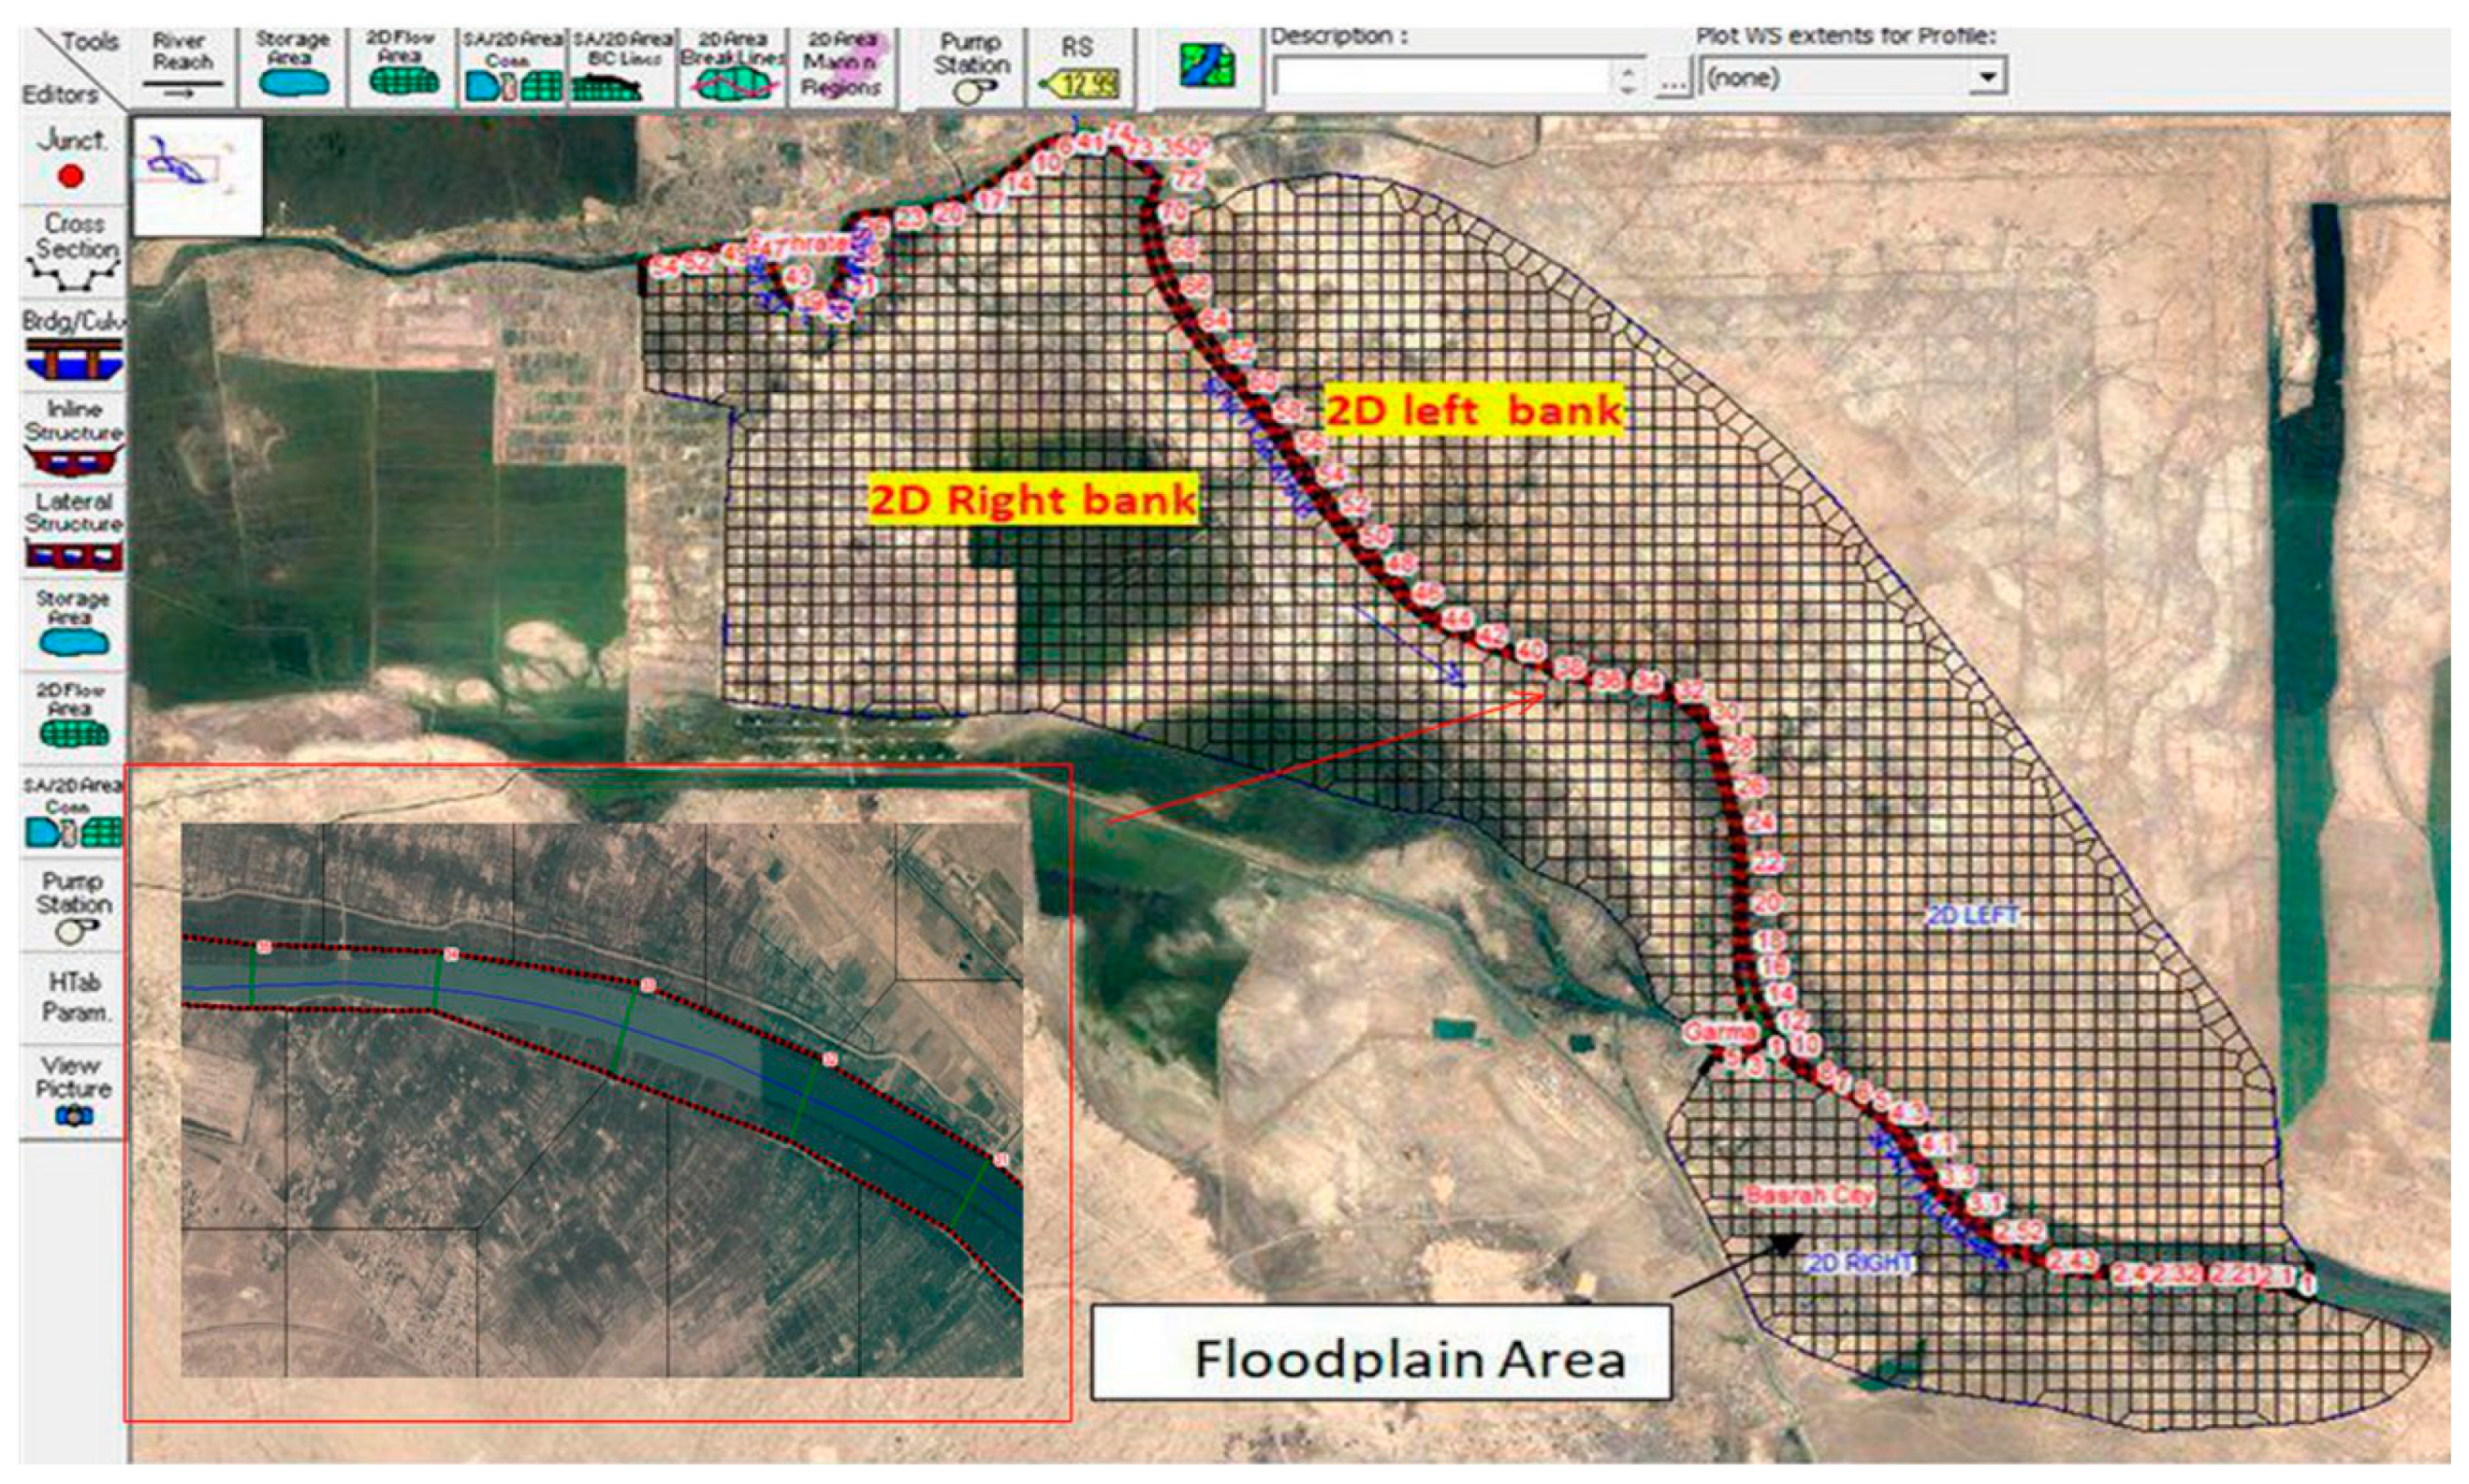
In this study, the two-dimensional(2D) flow area was added by creating a 2D flow area polygon for both the left and right banks of the Shatt Al-Arab River, as shown in Figure 8. Then, two polygon areas were developed to create 2D computational meshes by selecting a nominal grid size. In this study, the grid size was specified to be 1000 × 1000 m2 and the total number of cells was 1060 cells.
2.7.3. Land Cover Area
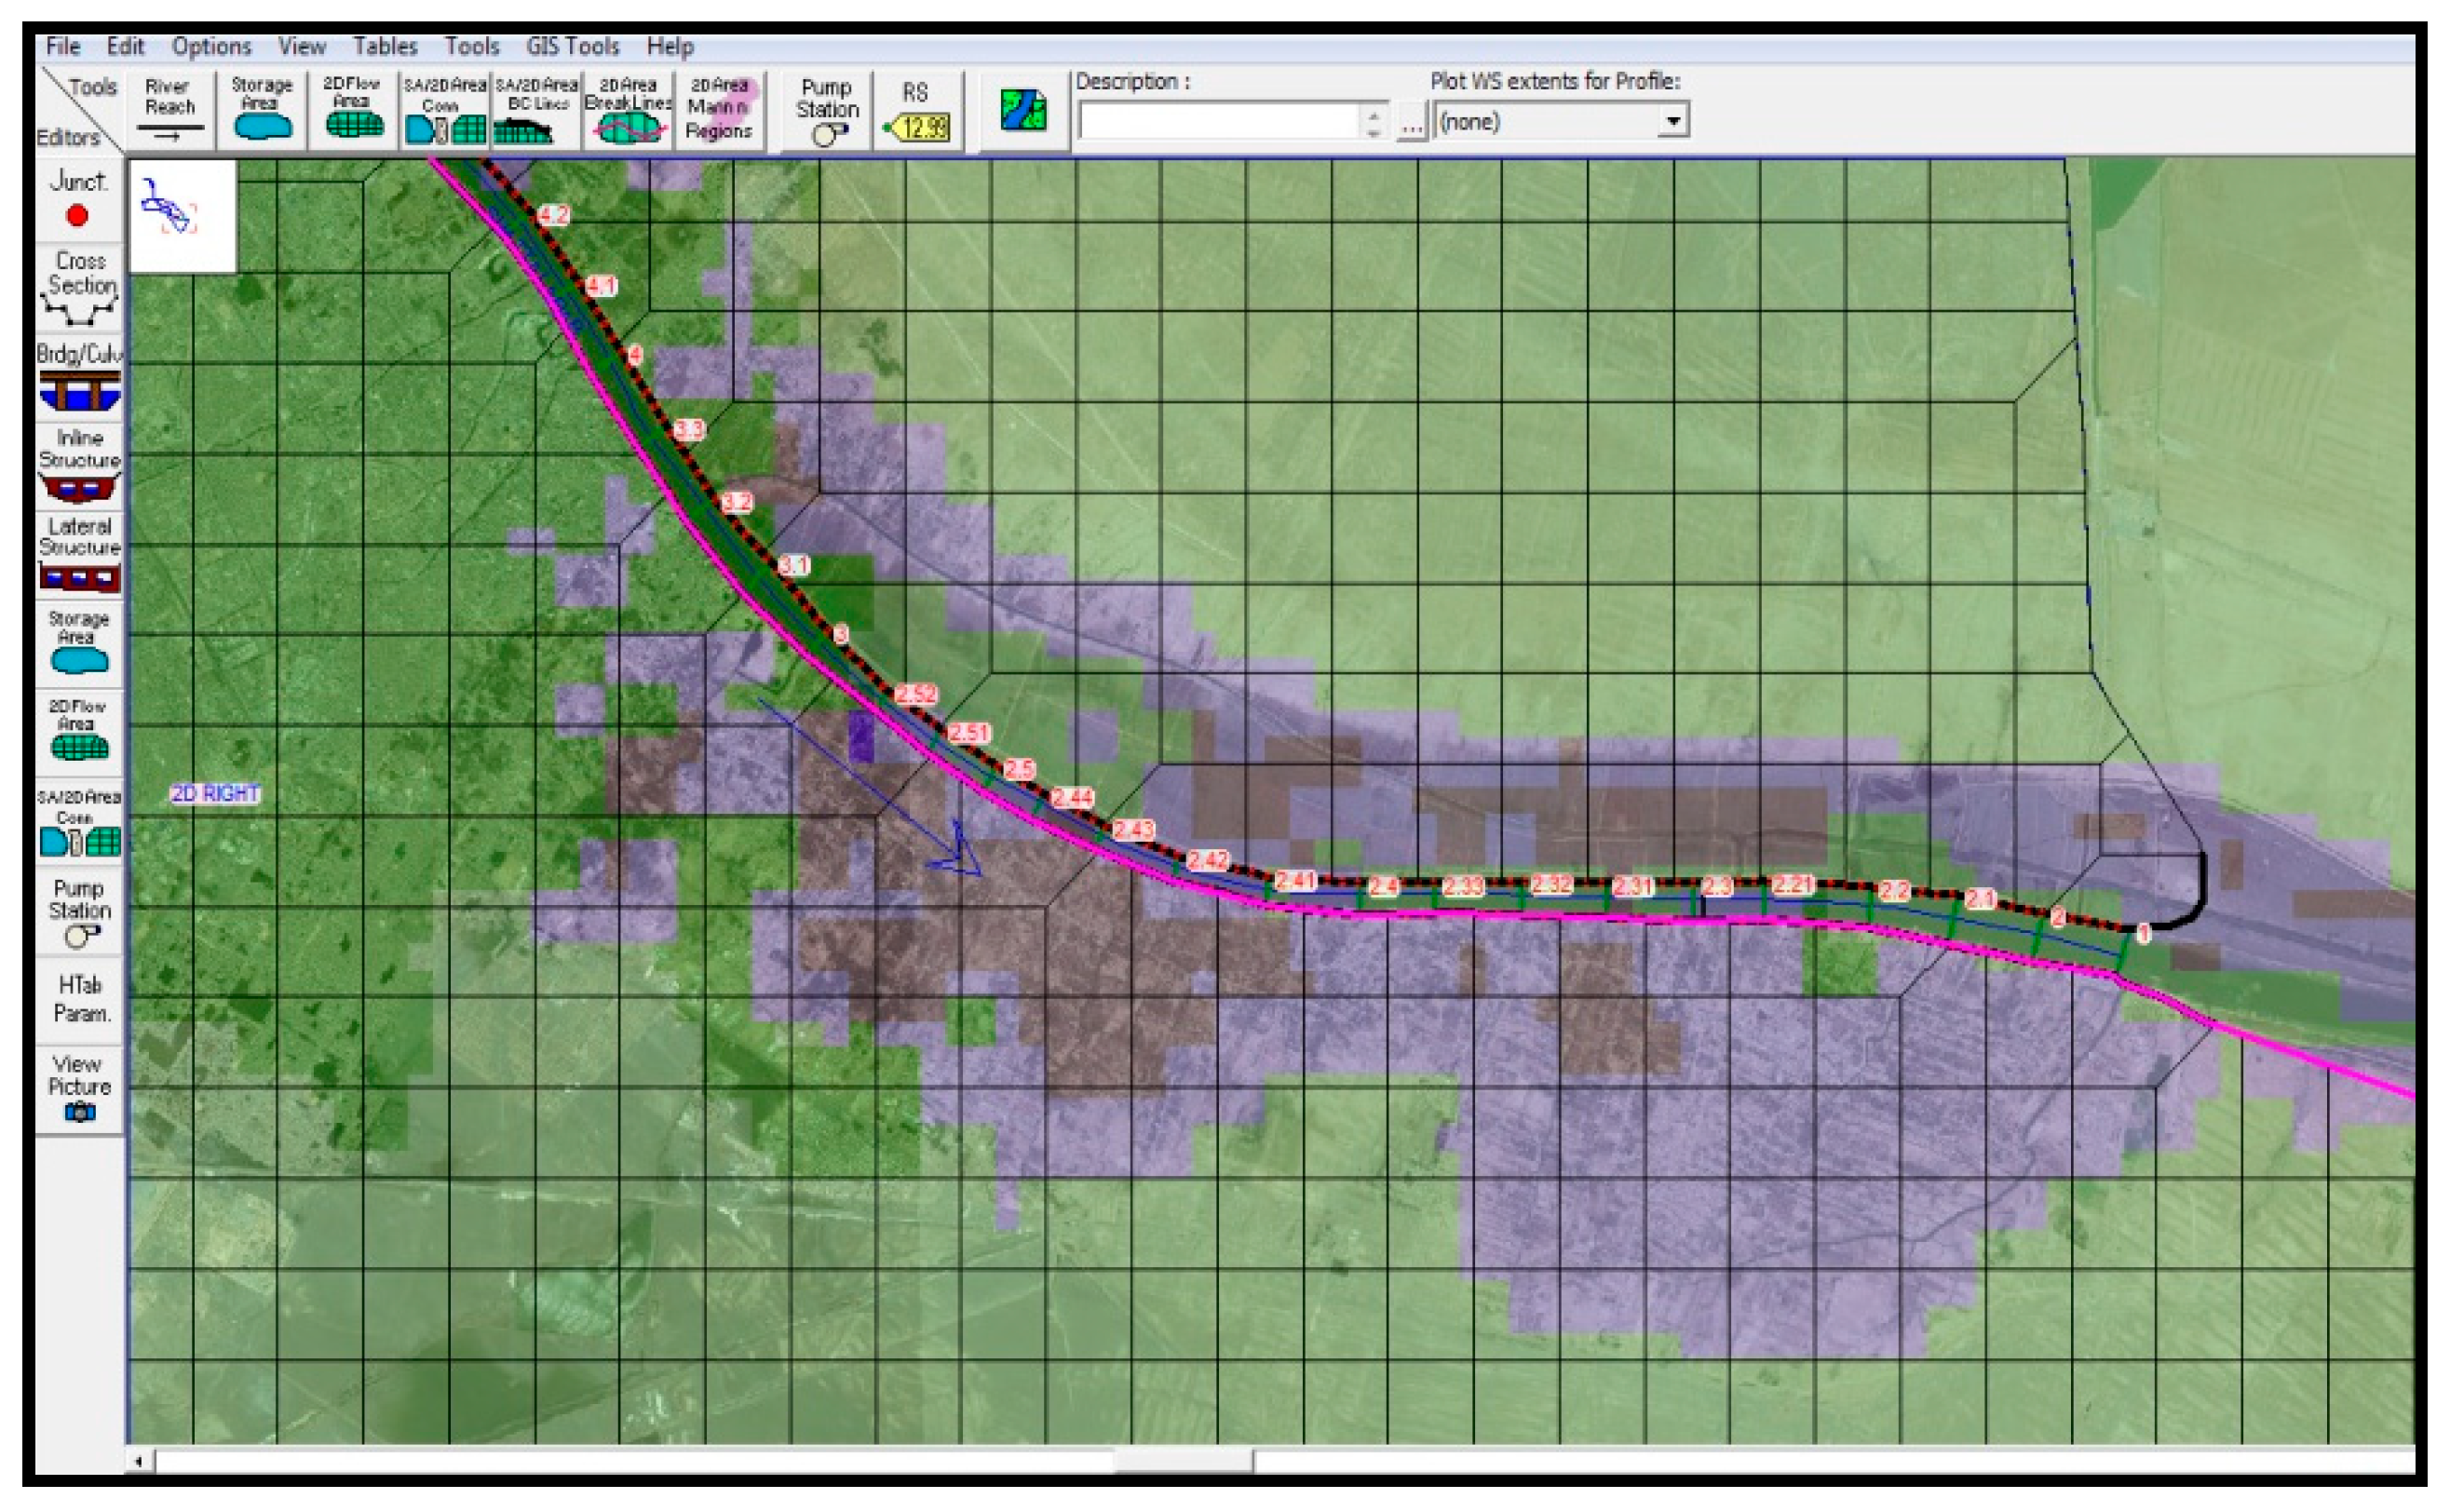
Land cover is the physical material on the earth’s surface and includes asphalt, grass, water, trees, and so forth. Land cover maps were realized using remote sensing technologies. For the floodplain area, the land cover was obtained from the USGS website for the whole study area, as shown in Figure 9. Building a land classification dataset was necessary to specify the values of the Manning’s coefficients (n) of the surface flow over the flooded land. For the overland areas, the (n) values in RAS Mapper were extracted from the available satellite imagery and the detailed land cover map. The n values for each land use type were assigned within the ranges given in Table 1.
2.7.4. Combined 1D/2D Modeling
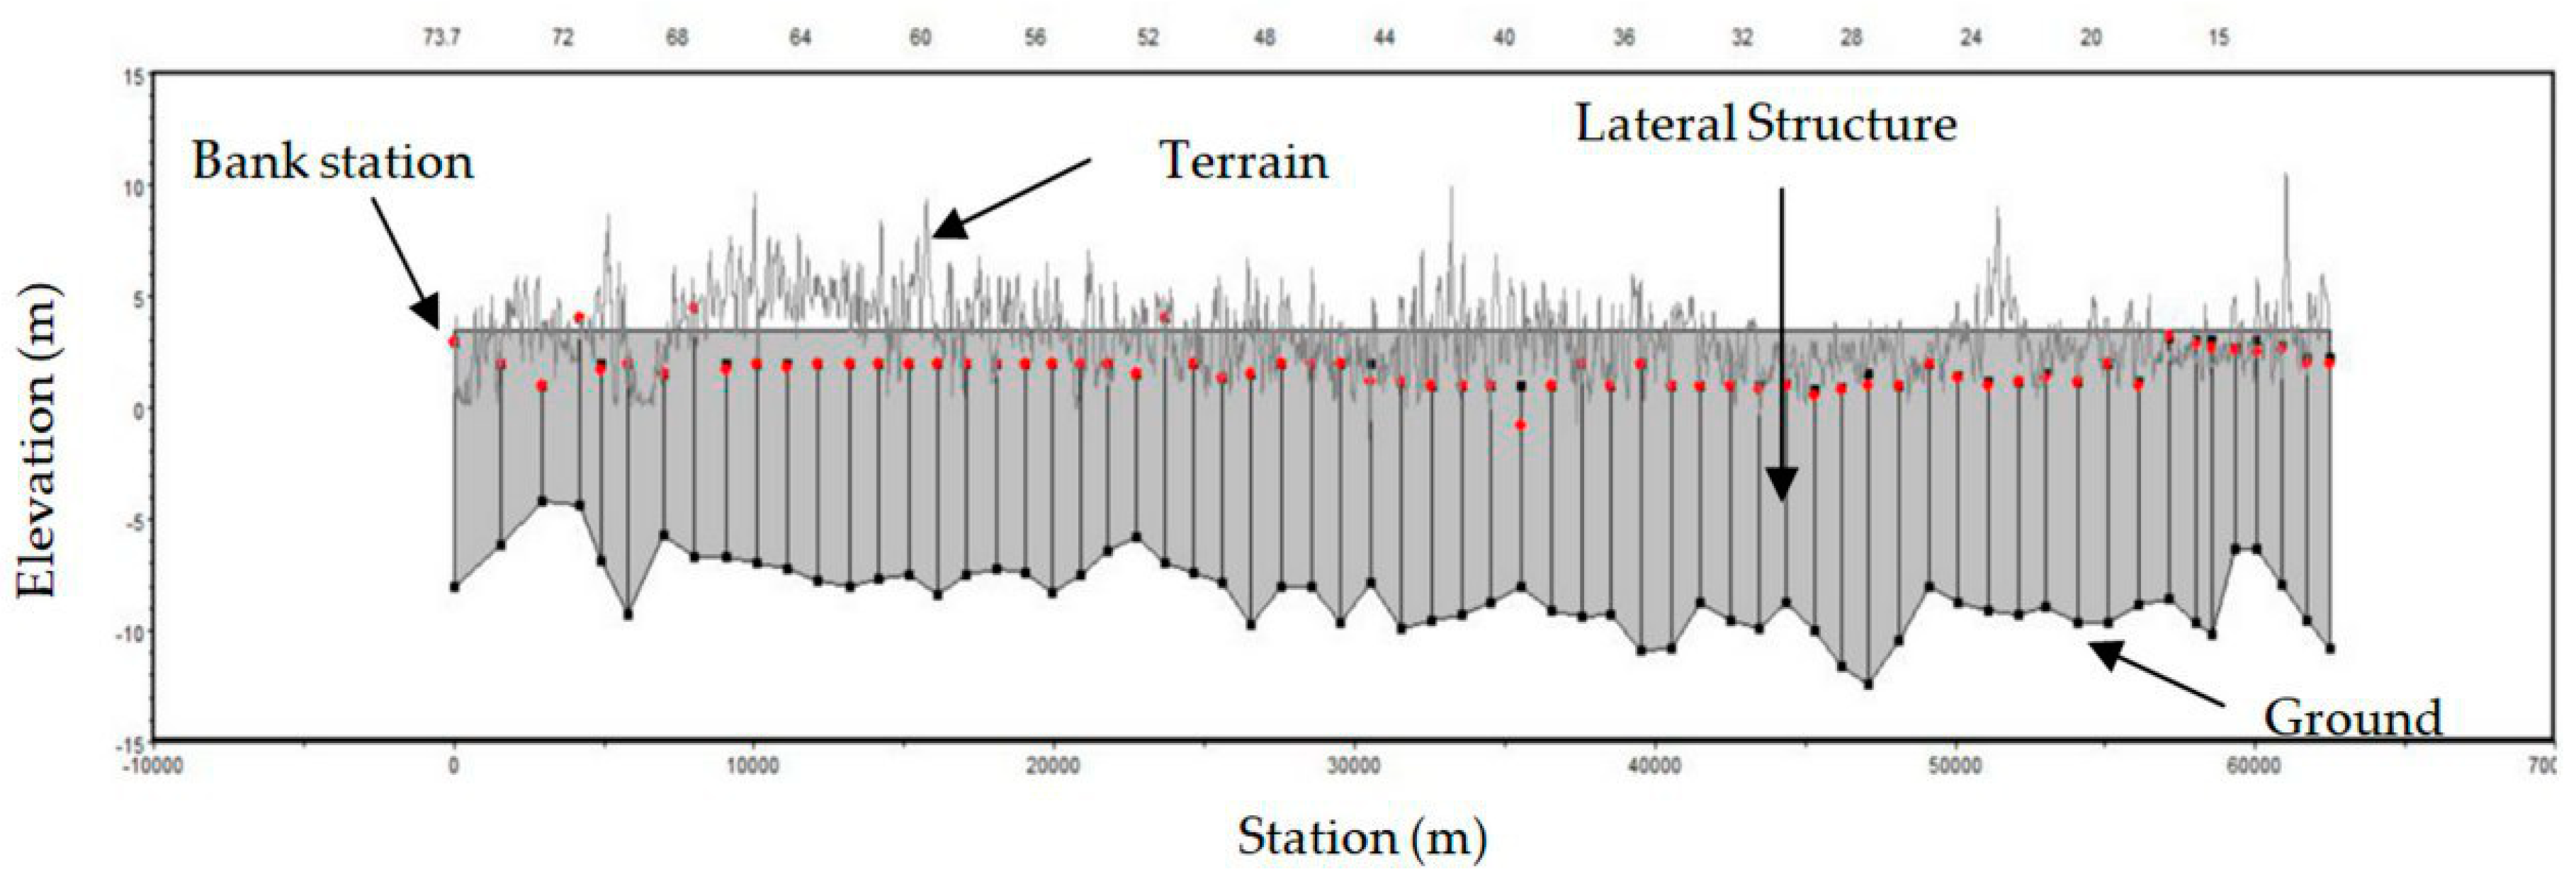
A HEC-RAS model has the ability to perform 1D, 2D, and combined 1D/2D unsteady flow simulations. Here, in HEC-RAS, lateral structures were used to connect the river 1D with the area behind a levee that was modeled in 2D [28]. The flow over the levee (lateral structure) was computed with head water from the 1D river and tail water from the 2D flow area to which it was connected. The lateral structure can represent a levee or floodwall, a flow diversion structure, or the natural terrain. In this study, the lateral structure editor in HEC-RAS was used to model the flow being transferred between the 1D river reaches and adjacent the 2D floodplain areas, as shown in Figure 10.
2.8. Inline Structure
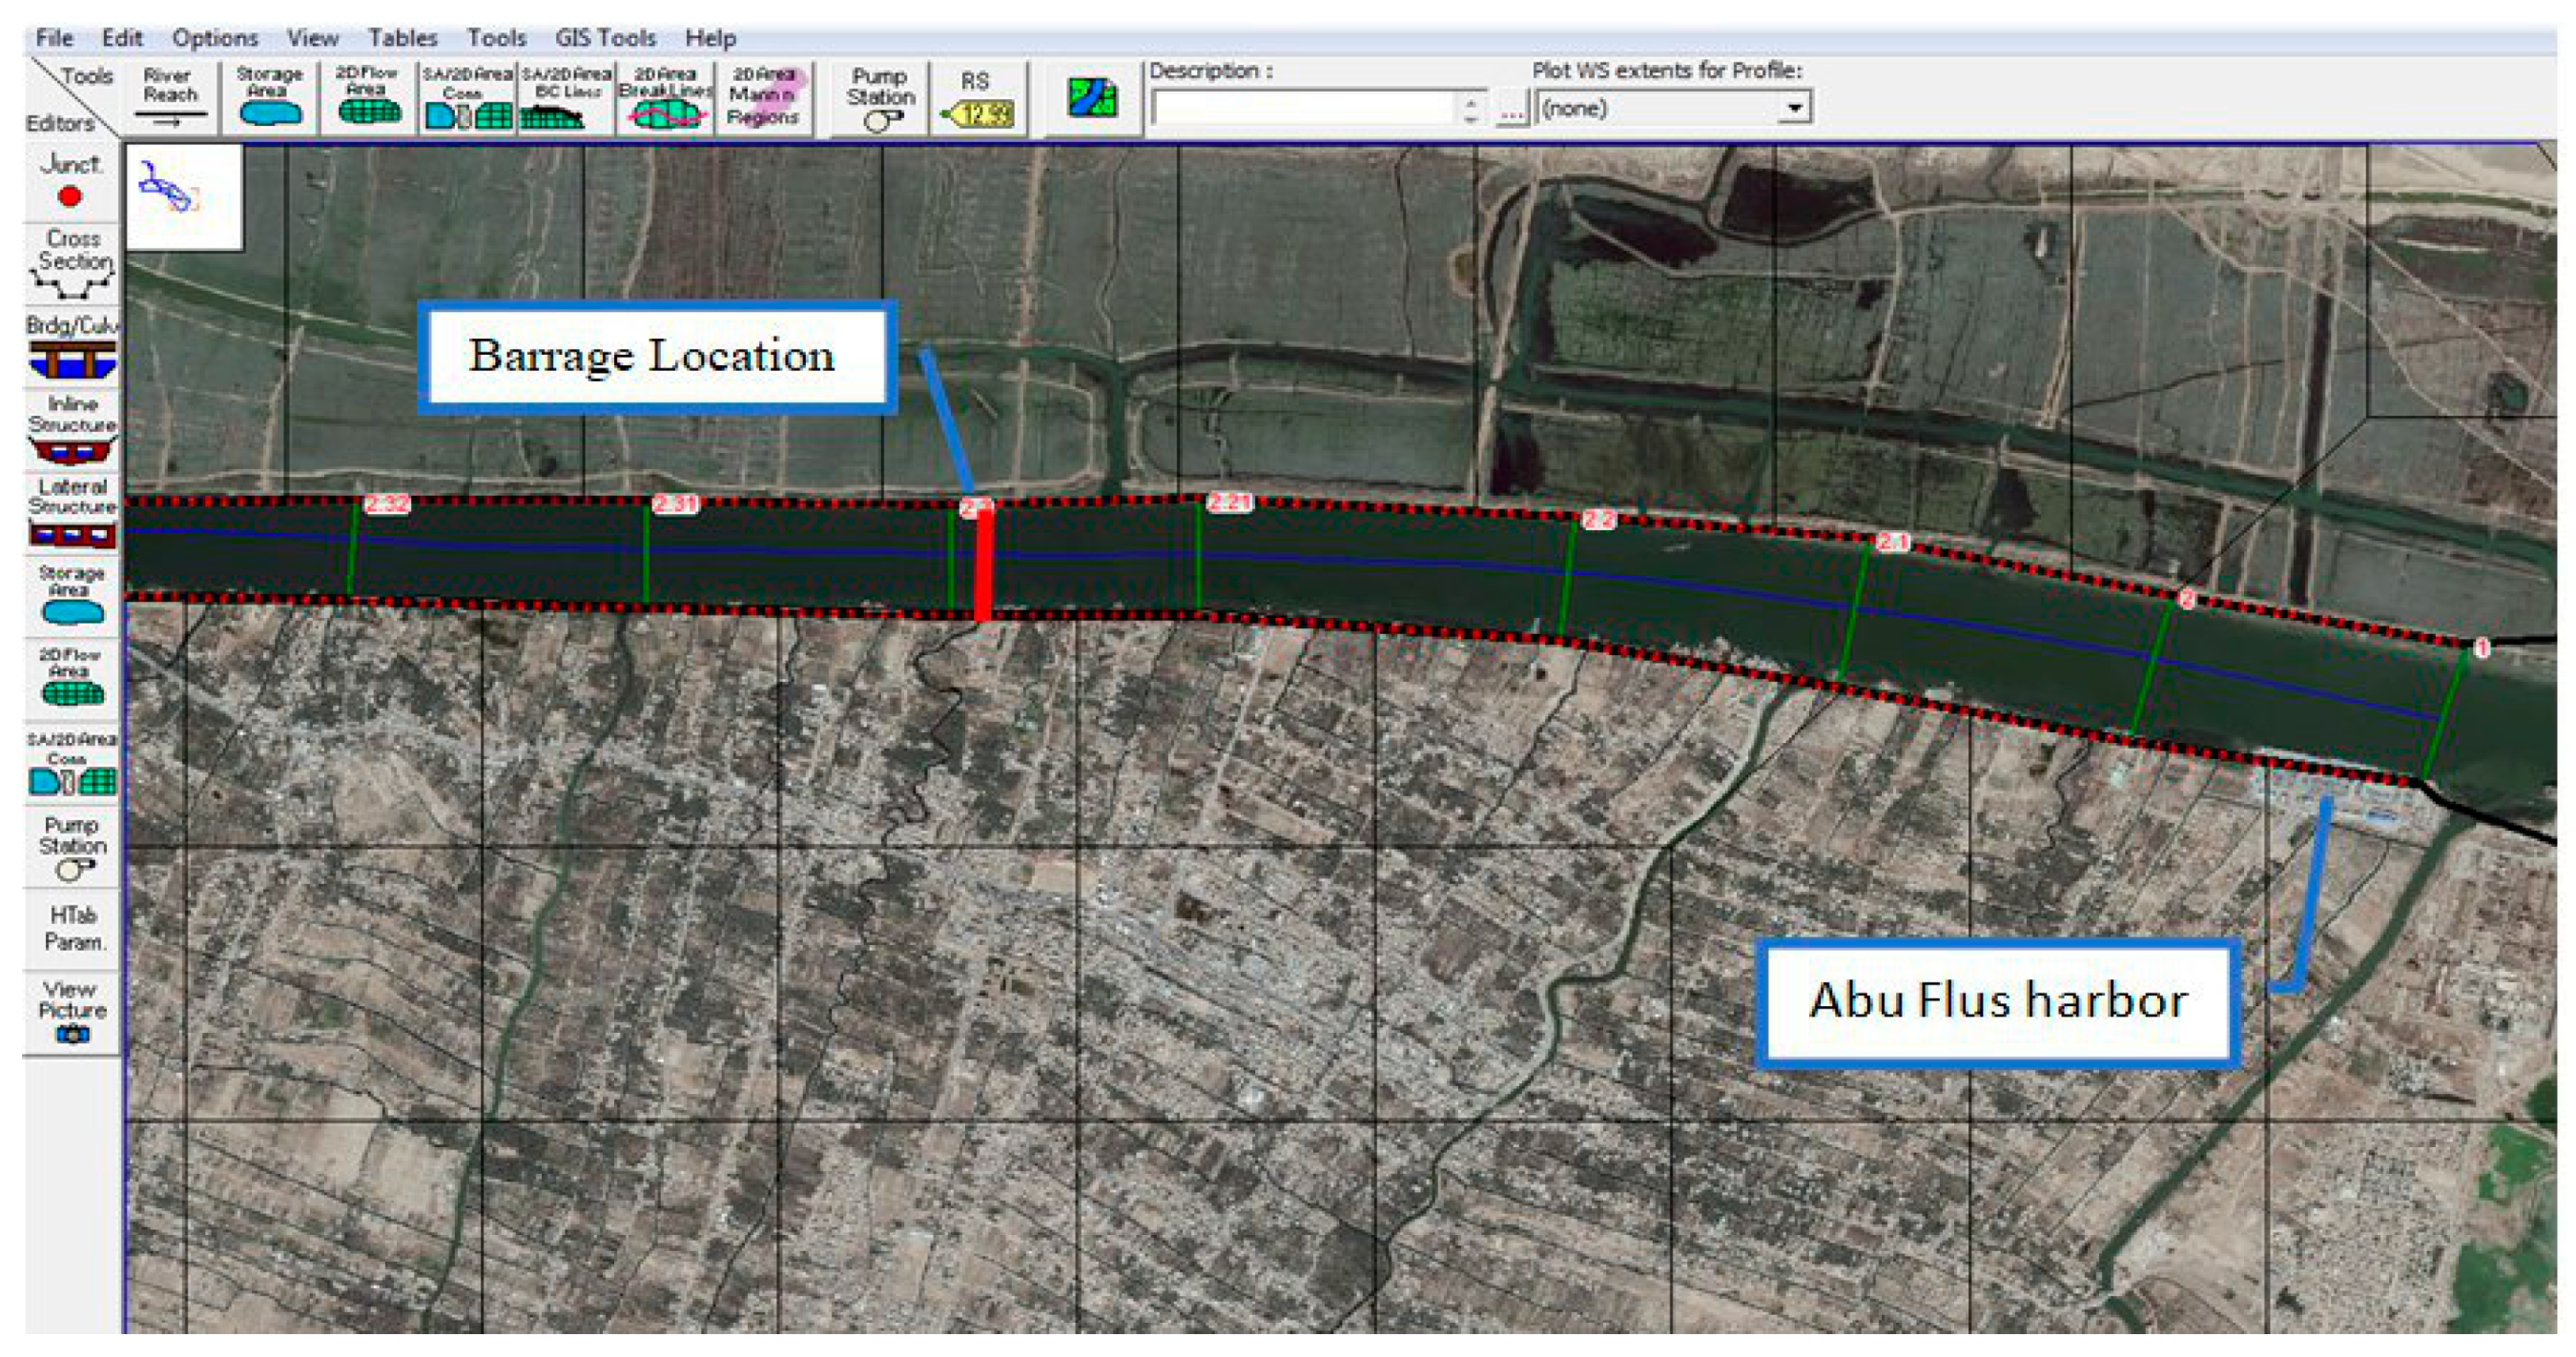
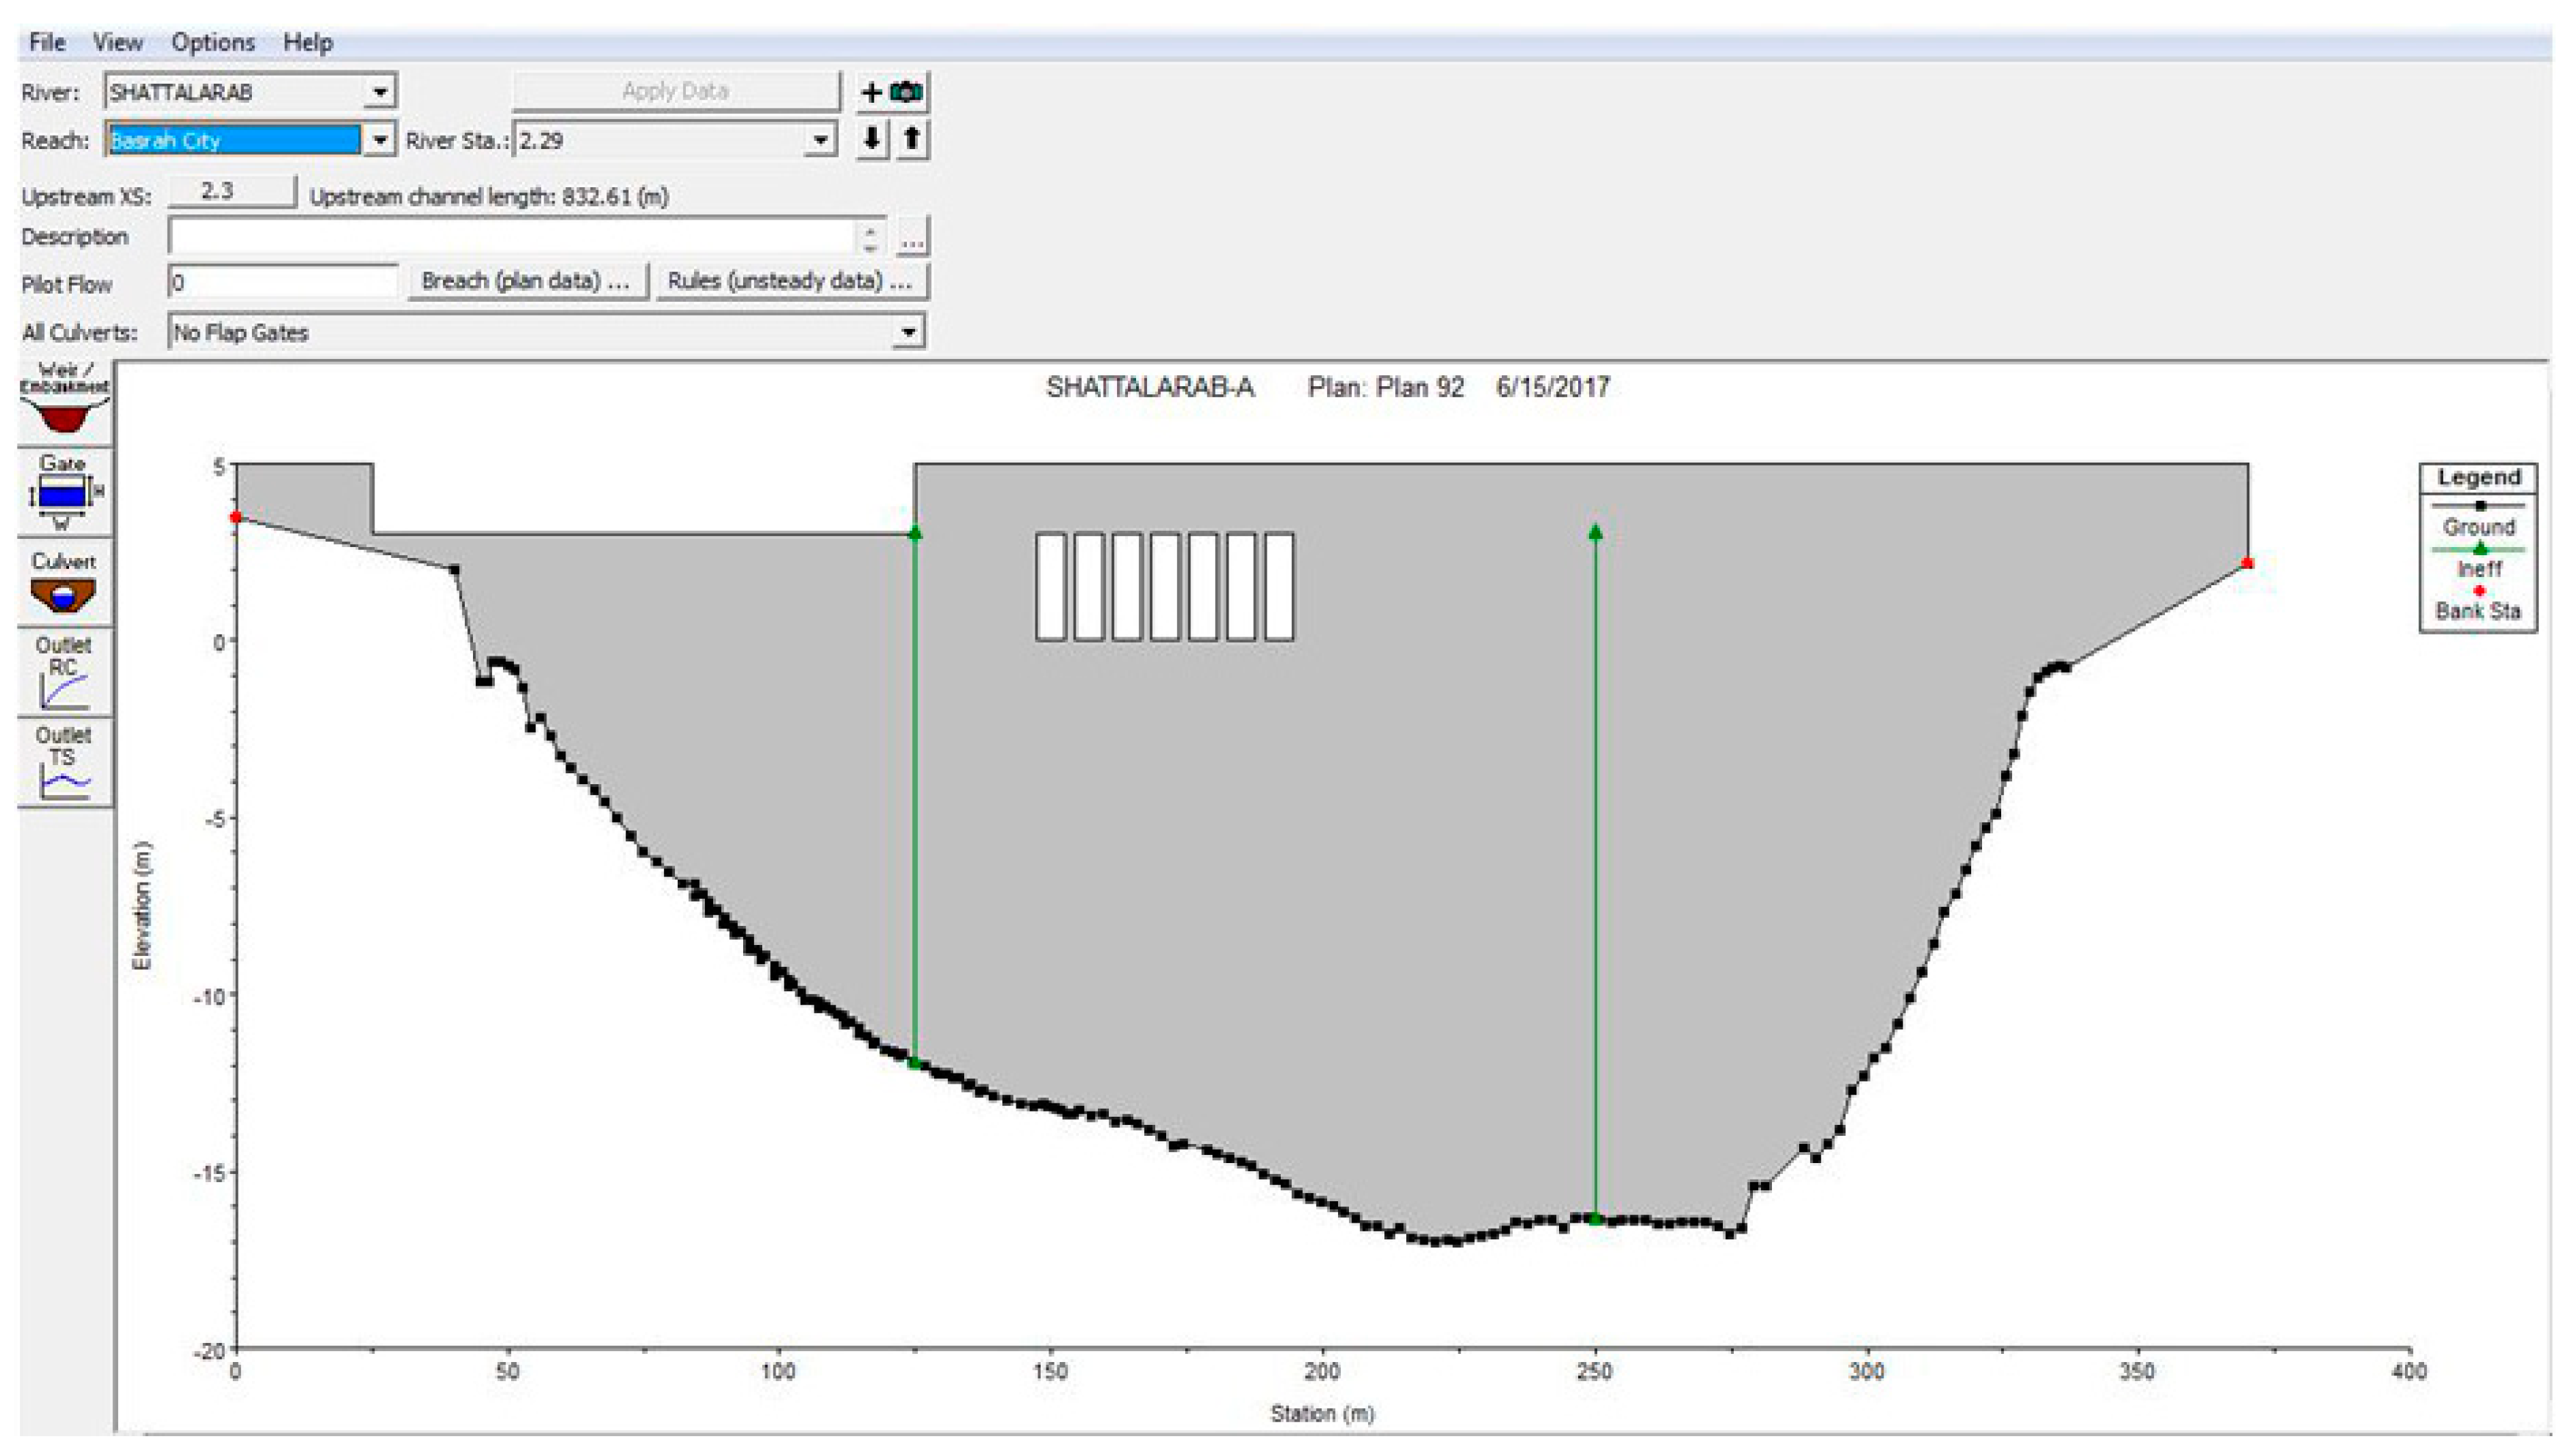
An inline structure can be used to model inline gated spillways, overflow weirs, drop structures, dams, and regulators. In this study, the inline structure was used to model the suggested regulator. The suggested location of the regulator was near the Abu-Flus region at cross-section number 2.29, as shown in Figure 11. The regulator was designed for a discharge of 200 m3/s peak flow. The suggested regulator had a total length of 375 m. The regulator had an uncontrolled spillway of 100 × 2 m at a 3 m crest level on the left side of the regulator as well as seven sluice gates of 3 × 5 m at a zero crest level, as depicted in Figure 12.
2.9. Discharge Probability Analysis
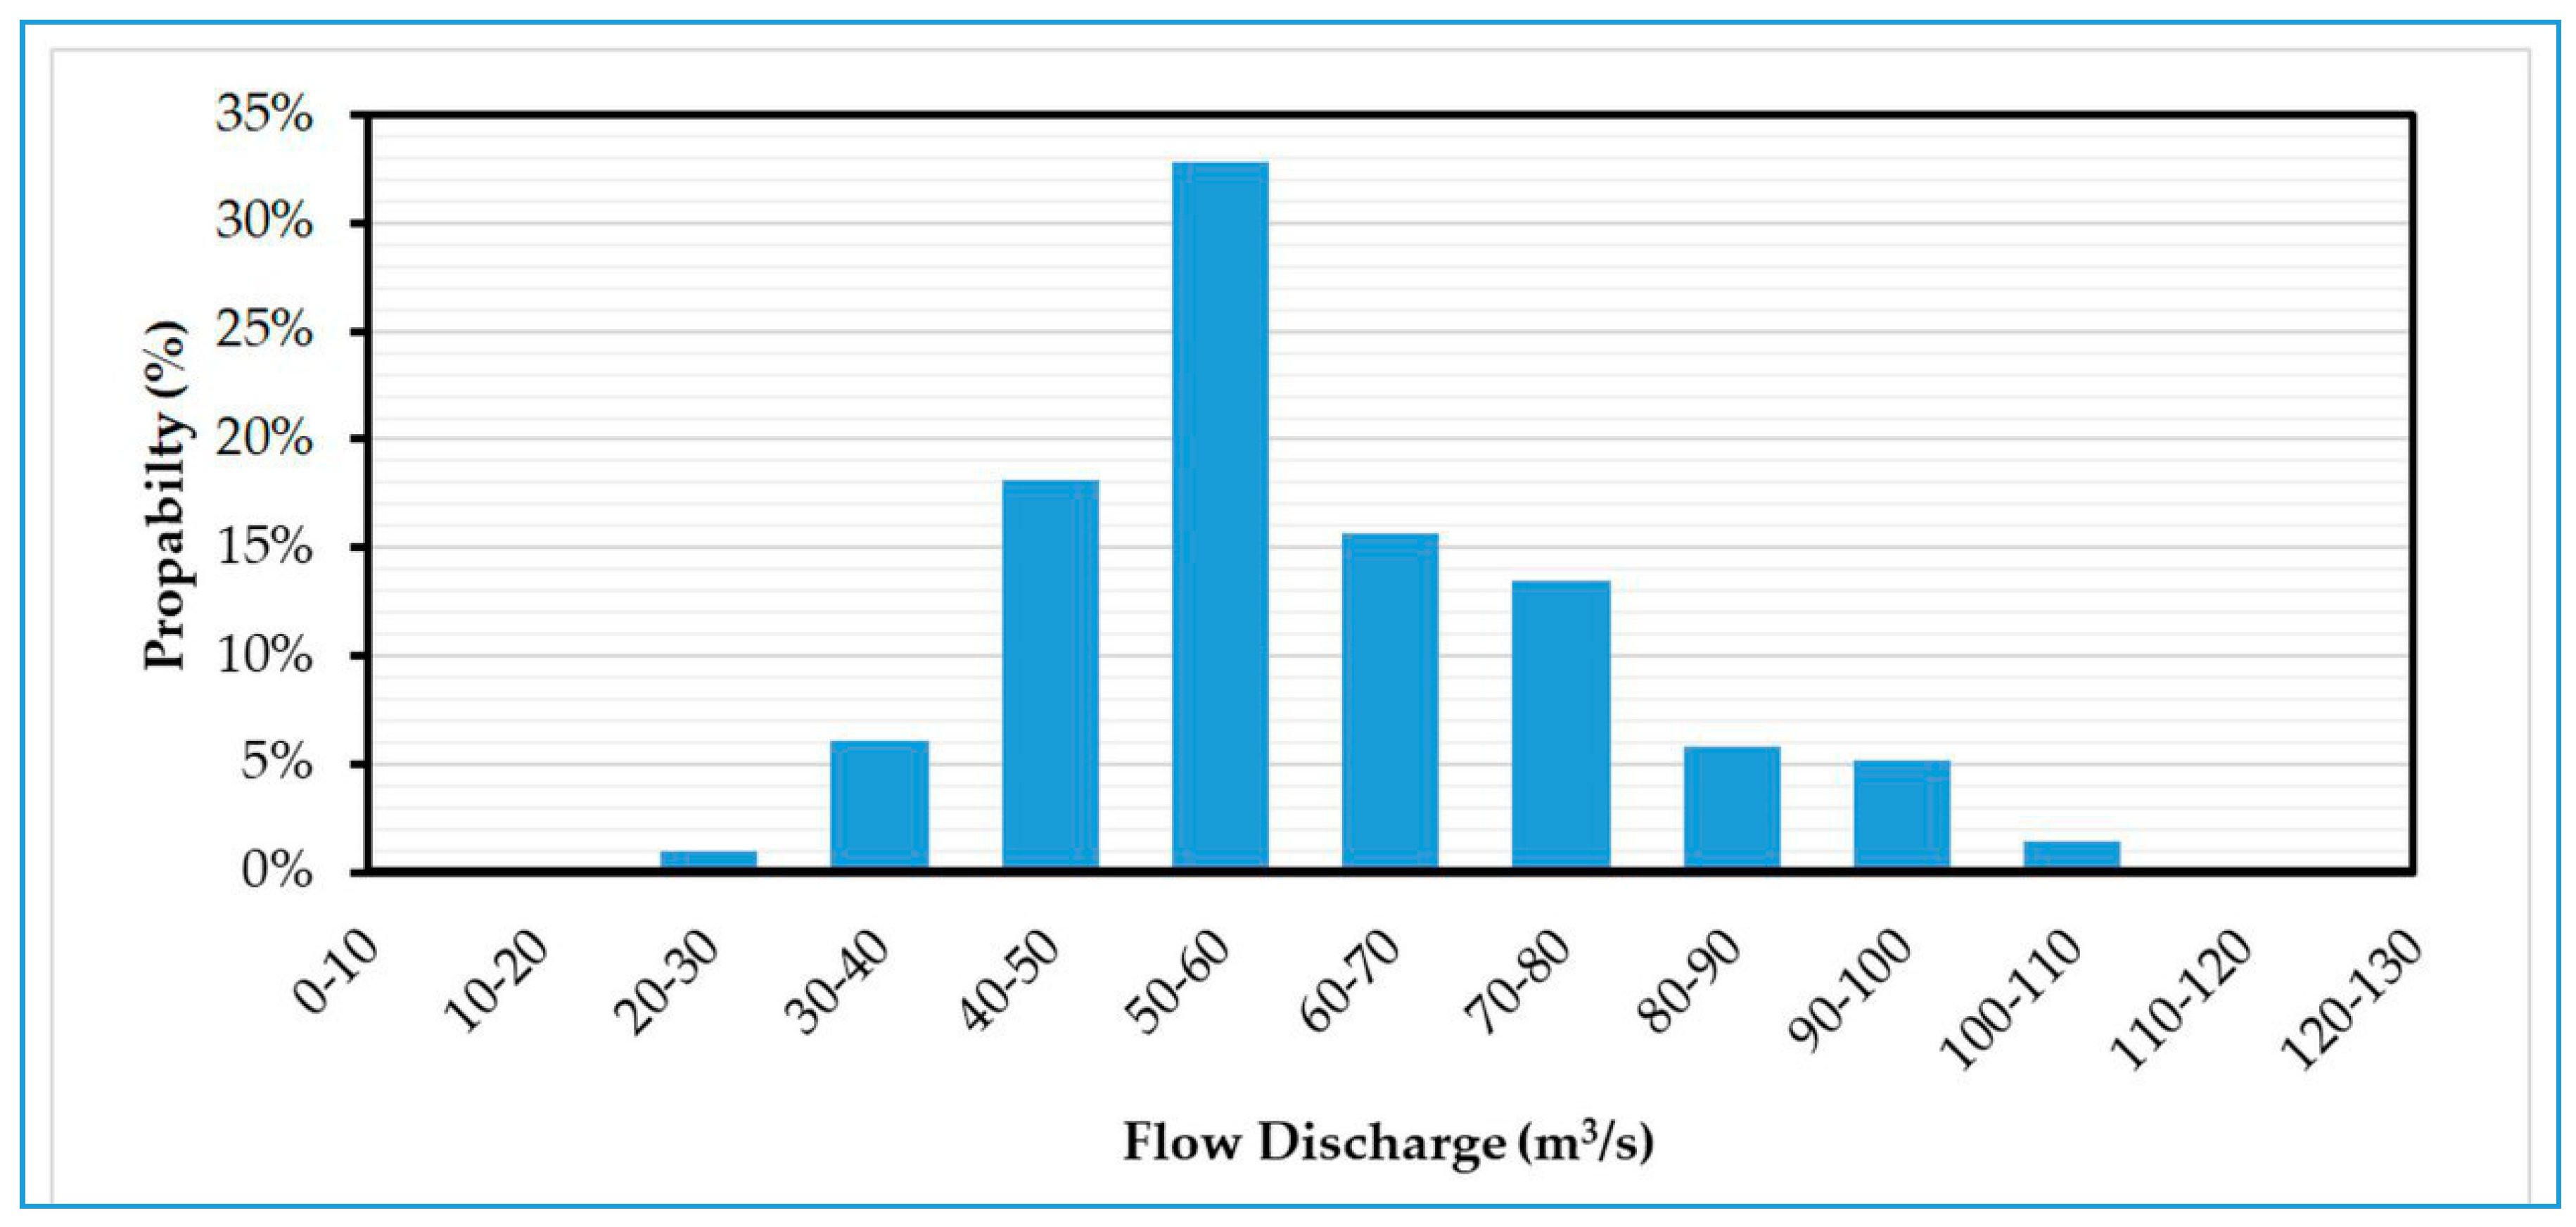
The maximum discharge of the Shatt Al-Arab River needed to be determined in order to achieve the main objective of this study, which was to calculate the largest rise in the water levels in the Shatt Al-Arab River. The maximum discharge was determined on the basis of the discharge records at the Qal’at Saleh discharge station, which is located downstream of the regulator and was considered to be the beginning of the river before entering Basrah for a period of 10 years (2009–2018) [25]. These discharge records were statistically analyzed and the probability of recurrence for each category of the discharge value was determined, as shown in Figure 13. Based on this, it was found that the most likely discharge was with discharge values specified between 50 and 60 m3/s. The minimum discharge was the specified discharge value between 10 and 20 m3/s, with a probability of recurrence of 0.2%, while the maximum discharge within the specified discharge value was between 110 and 120 m3/s, with a probability of recurrence not exceeding 0.2%. On the other hand, Qal’at Saleh regulator was constructed at the entrance of the river to limit the incoming discharge from the Tigris River into the Shatt Al-Arab River by a maximum design value not exceeding 150 m3/s. Moreover, a discharge was added not exceeding 50 m3/s coming from direct rainfall on the river basin or some small tributaries. Therefore, the maximum discharge possible entering the Shatt Al-Arab River did not exceed 200 m3/s.
3. Results
3.1. Model Calibration and Verification
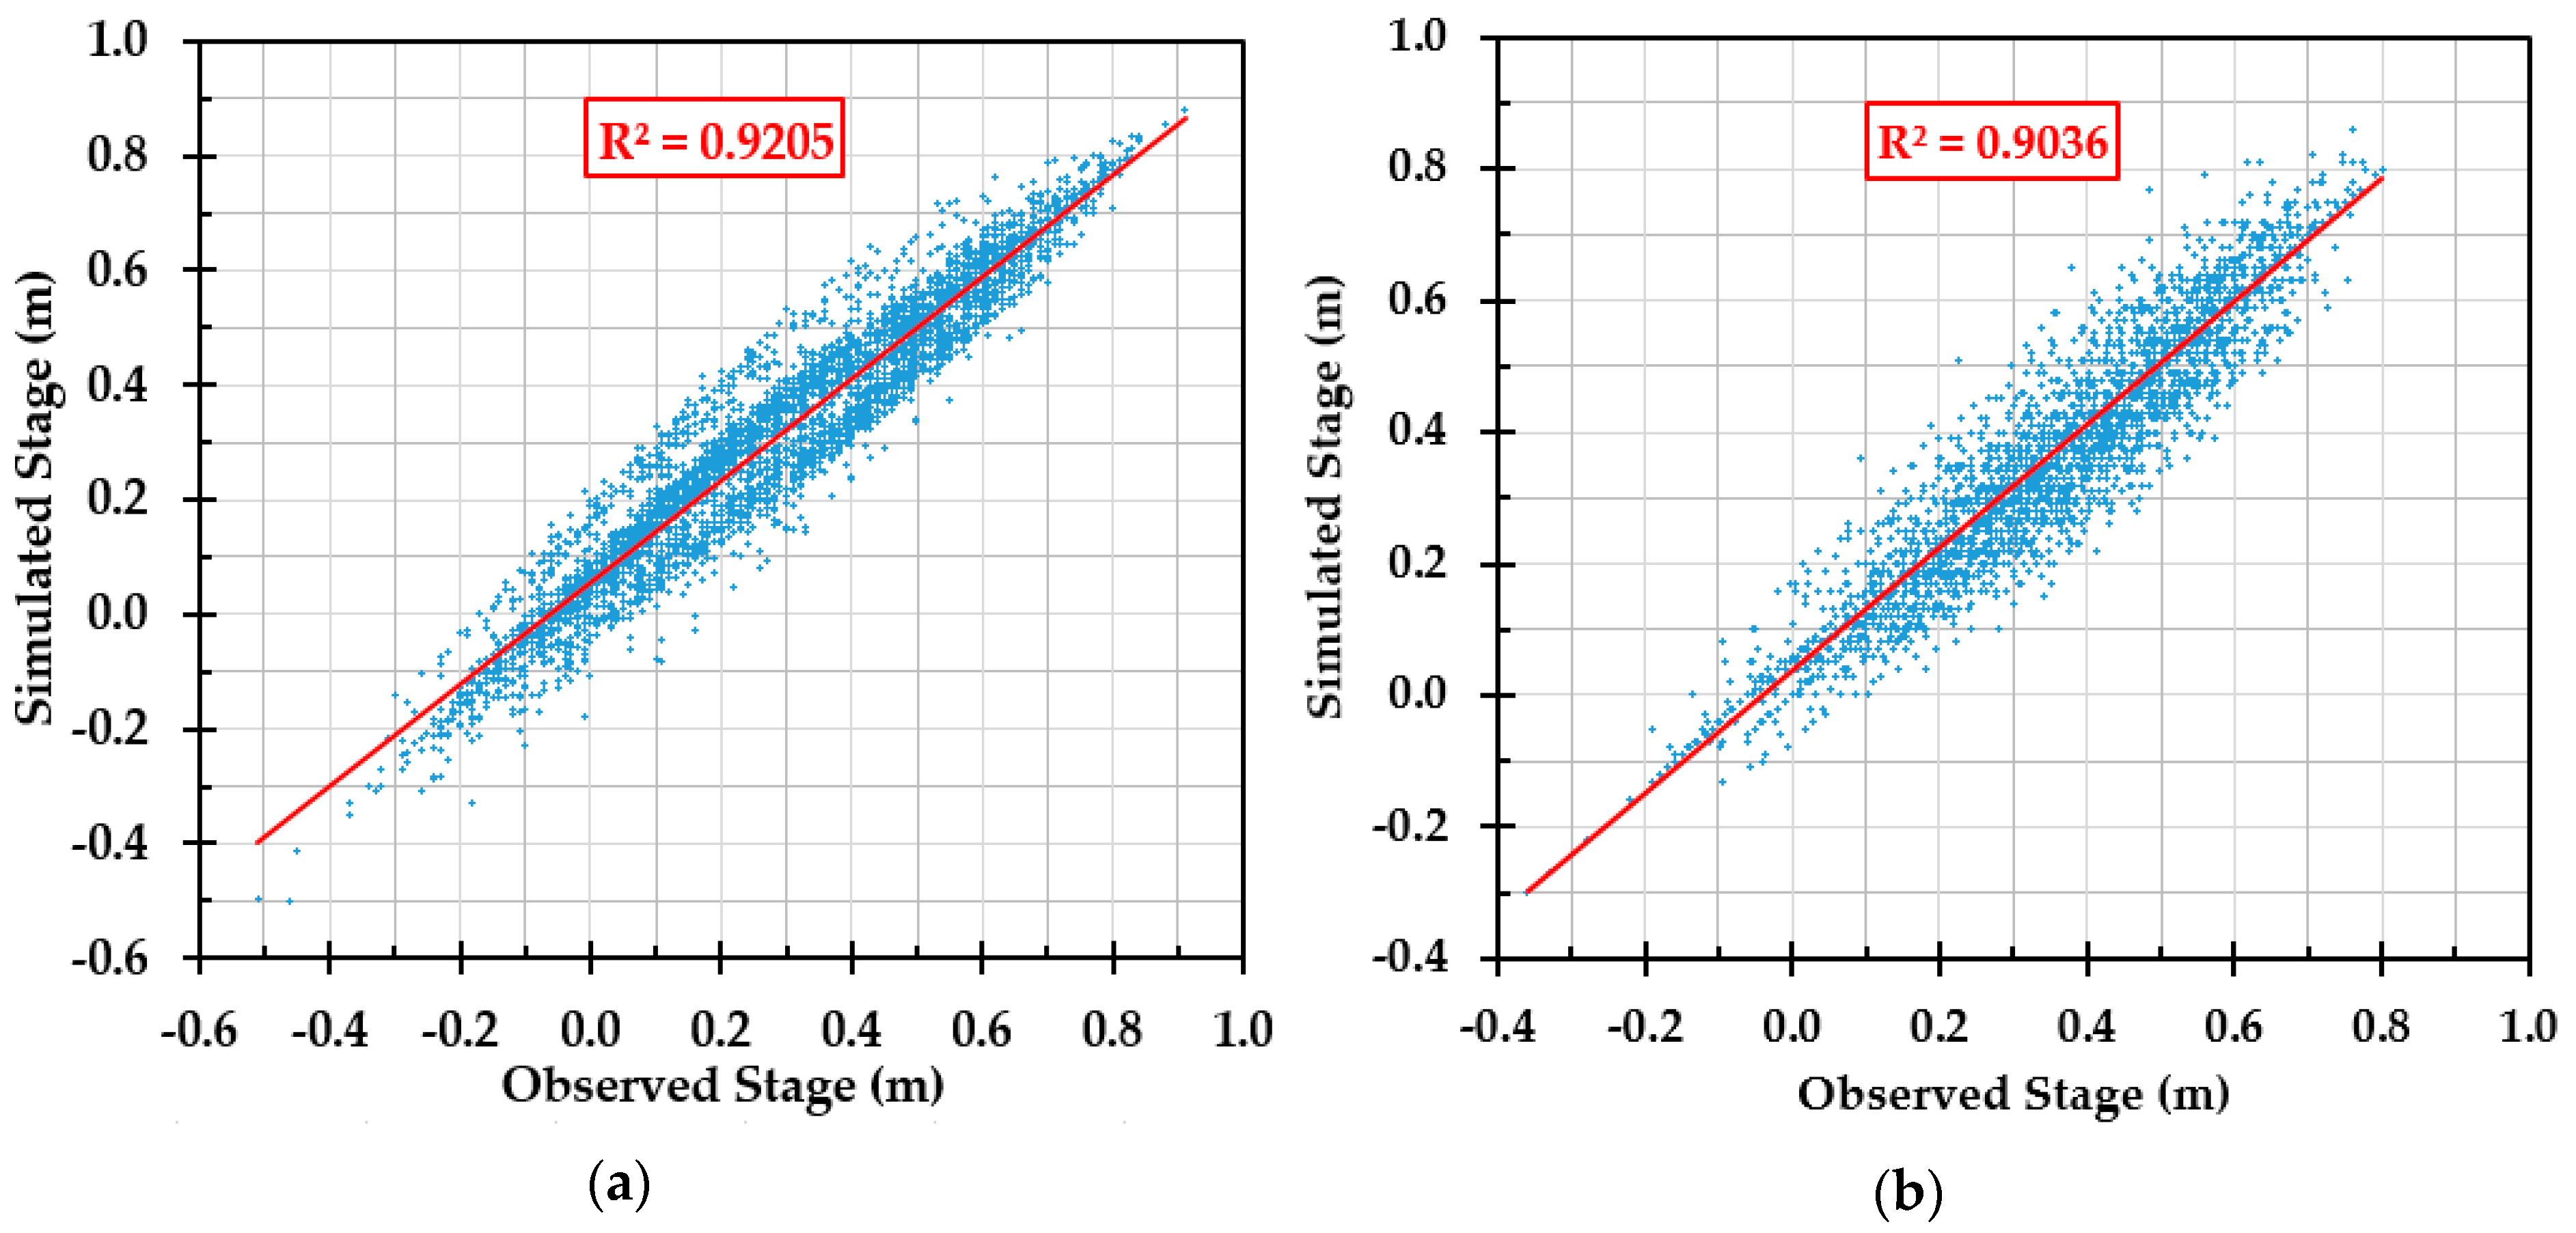
Initially, the model was used to simulate the one-dimensional river flow in the Shatt Al-Arab River in the real state of the river without a regulator. Therefore, the model was calibrated and verified based on the discharge and water stage for 2014. In this study, Manning’s coefficient (n) was considered as a model parameter to perform the calibration process of the model. Therefore, a wide range of Manning’s values for both the main rivers and their banks were investigated to calibrate the model under unsteady flow conditions. These Manning’s values (n) ranged from 0.020 to 0.033 for the main channel of the Tigris, Euphrates, Garmat Ali, and Shatt Al-Arab Rivers, whereas the Manning’s values (n) for the banks of all reaches were taken to be 0.06. For each iteration of the model calibration, set Manning’s values (n) were selected (within the limits mentioned above) for all river reaches. Then, the model was run and the results (simulated stages) were compared to the measured stages of the Shatt Al-Arab River in sections 3.2 and 55 for six months from 1 February to 31 July 2014. The correlation coefficient (R2) was used to judge the accuracy of the agreement between the simulated and measured stages. In the final iteration of the calibration process, we obtained excellent agreement between the simulated and measured stages at sections 3.2 and 55, where the correlation coefficients (R2) were 0.921 and 0.904, as shown in Figure 14a,b, respectively. The final Manning’s values (n) of the main channels for the Tigris, Euphrates, Shatt Al-Arab, and Garmat Ali Rivers were 0.028, 0.029, 0.033, and 0.033, respectively, whereas the Manning’s values (n) of the banks for the river reaches were 0.06.
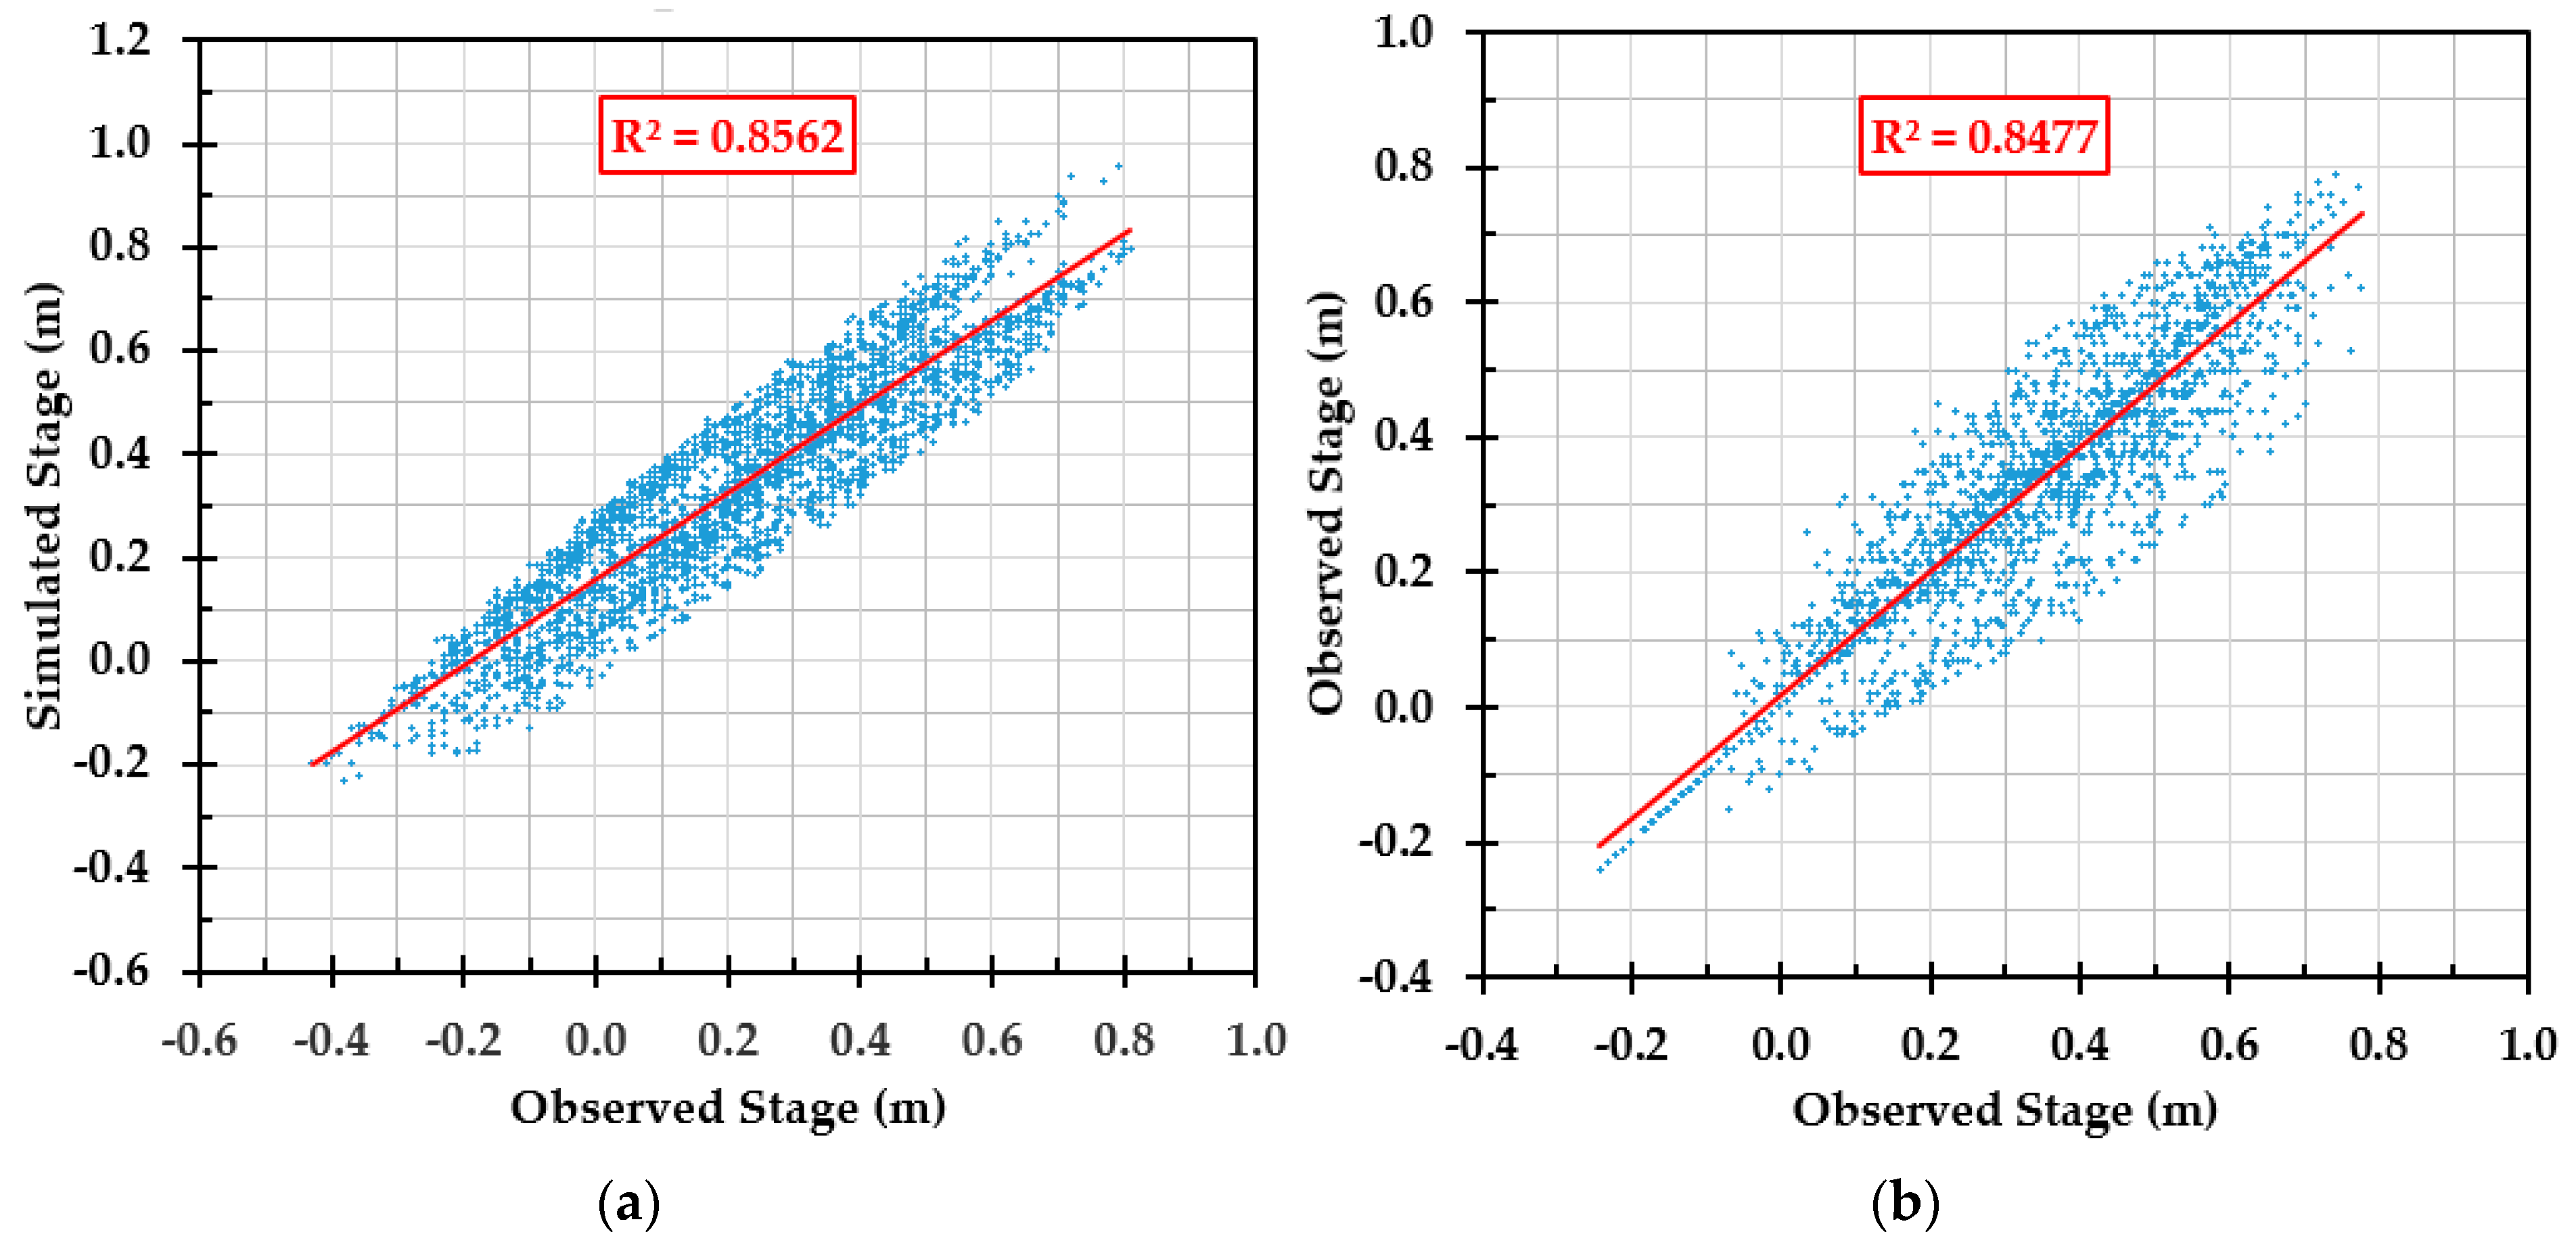
Model verification was done to ensure that the model and its implementation were correct under the unsteady condition. Therefore, the model was run for other periods (1 August to 30 November 2014) using the final Manning’s values (n) from the calibration process. Then, the results of the model, which was simulated in stages, were compared to the measured stages of the Shatt Al-Arab River at sections 3.2 and 55 during the period from August to November 2014. The results of the verification process showed very good agreement between the simulated and measured stages at sections 3.2 and 55, where the correlation coefficients (R2) were 0.856 and 0.848, as shown in Figure 15a,b, respectively.
3.2. Stage Hydrograph of Flood Wave
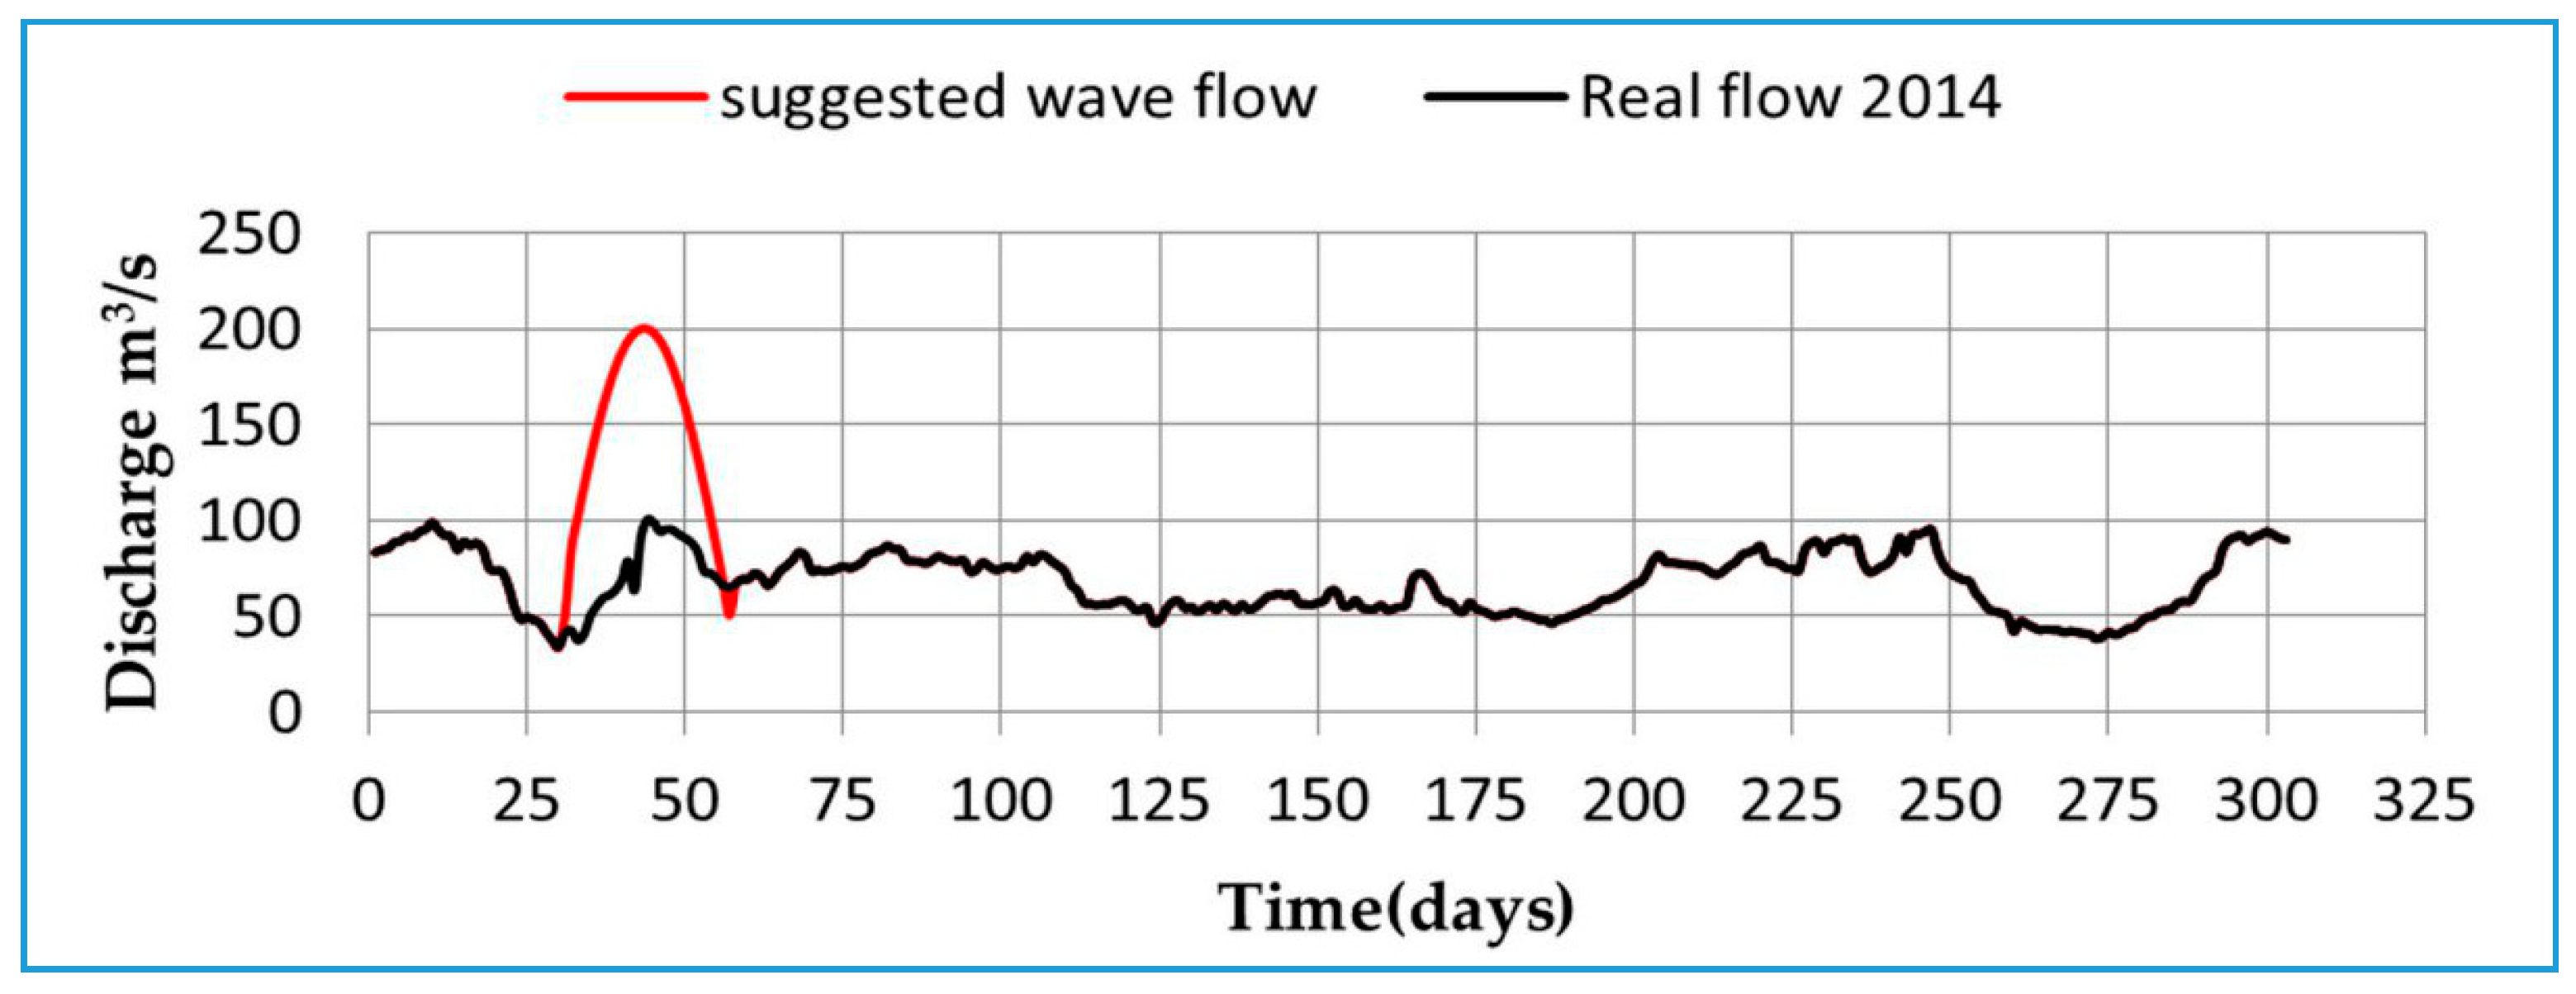
After completing the calibration and verification of the model, the program was operated using a hydrograph with a peak discharge 200 m3/s for the purpose of studying the flood risk on the study area. The same hydrograph for the study year 2014 was used except the peak discharge was changed from 100 to 200 m3/s during the same flood period of 27 days from 3 to 29 March (as shown in Figure 16).
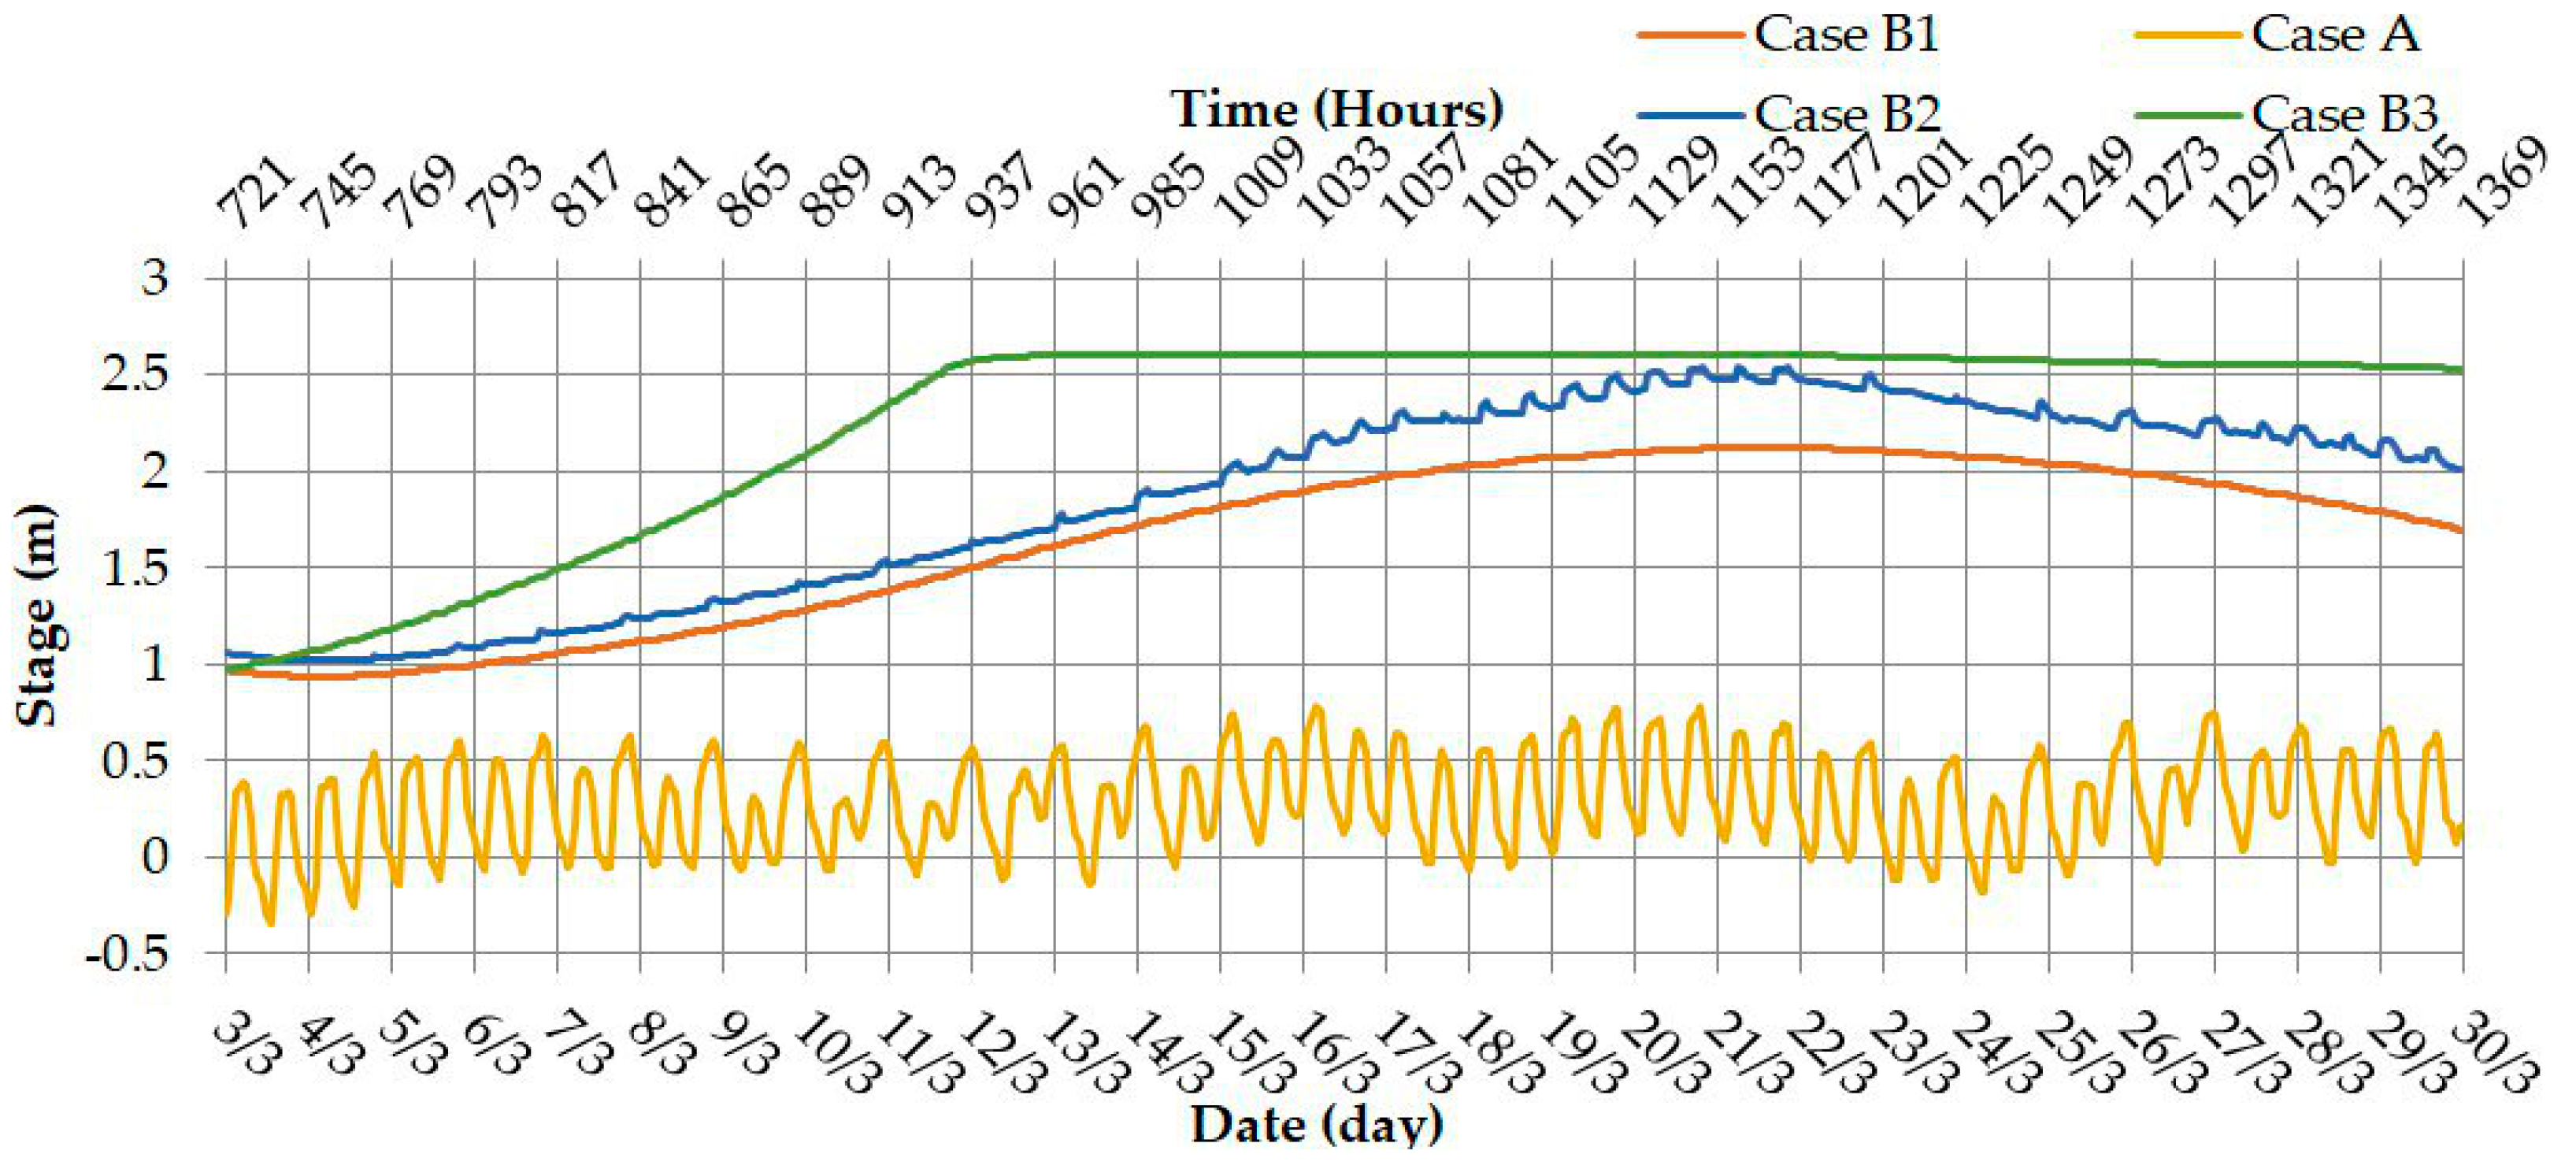
Two flow conditions were studied. The first flow case was Shatt Al-Arab River without a regulator, which represented the current situation. The second flow case was Shatt Al-Arab River with a regulator near the Abu-Flus district, which represented the future proposed situation. In the second flow case with the regulator, three cases of gate operations were studied: fully open, fully closed, and automatic operation. The automatically operated gates were opened in the case of an ebb tide and closed in the case of a flood tide. The study cases adopted in this paper are summarized as follows:
- Case A: Shatt Al-Arab River without regulator
- Case B: Shatt Al-Arab River with regulator
- Case B1: Fully open gates
- Case B2: Tidal gates (closed gates during flood tide or open gates during ebb tide)
- Case B3: Fully close gates.
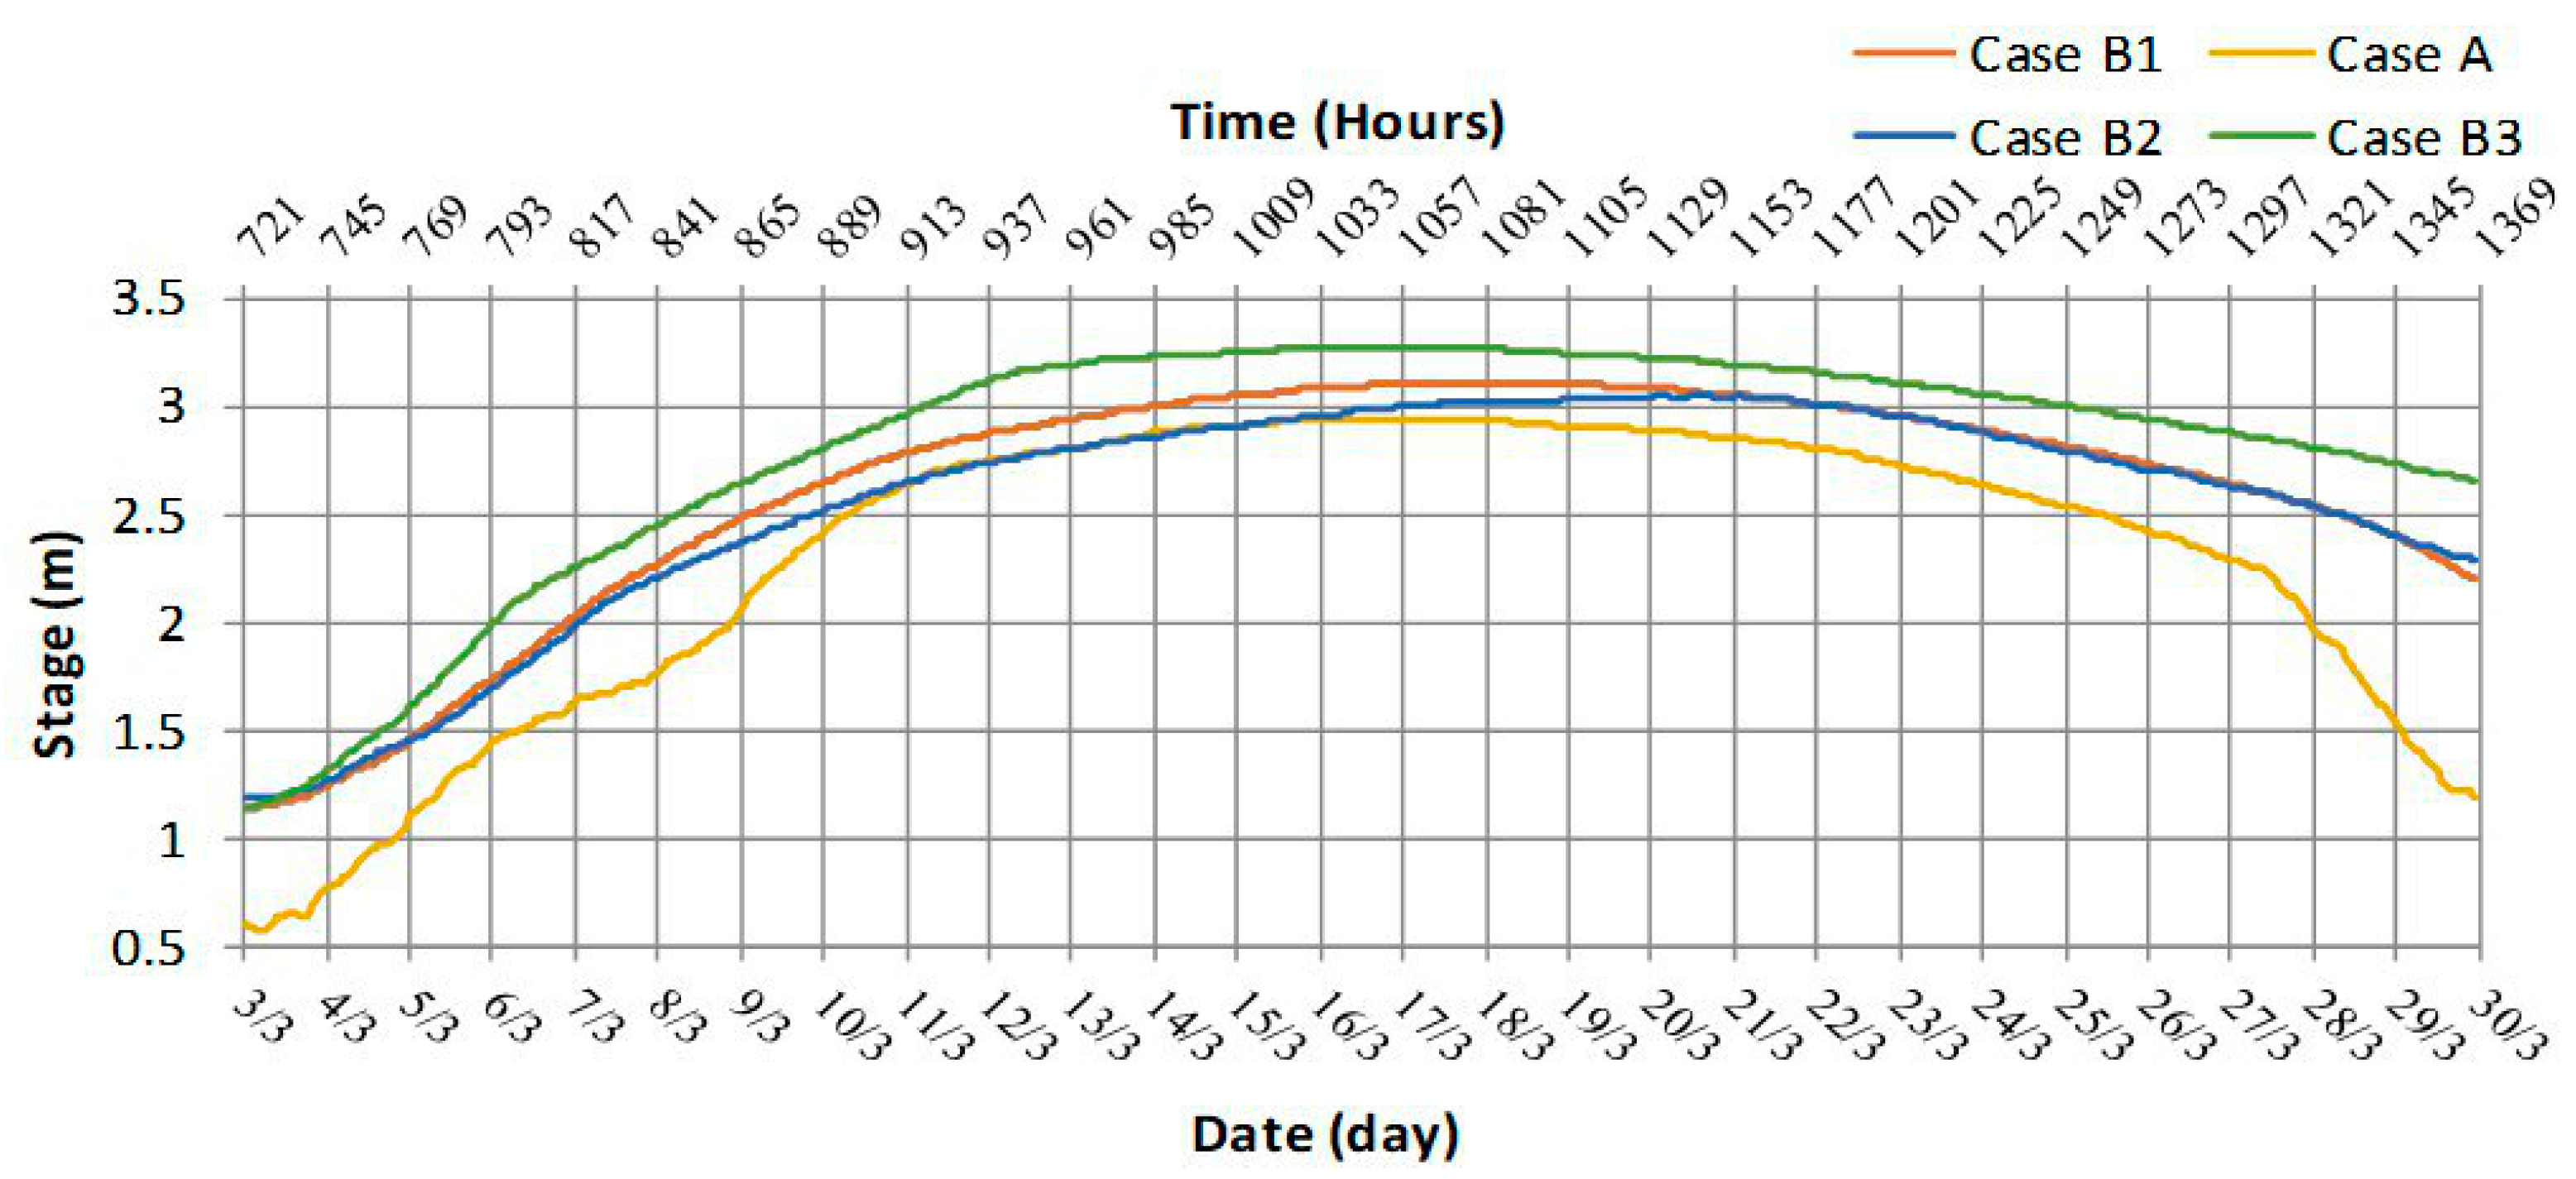
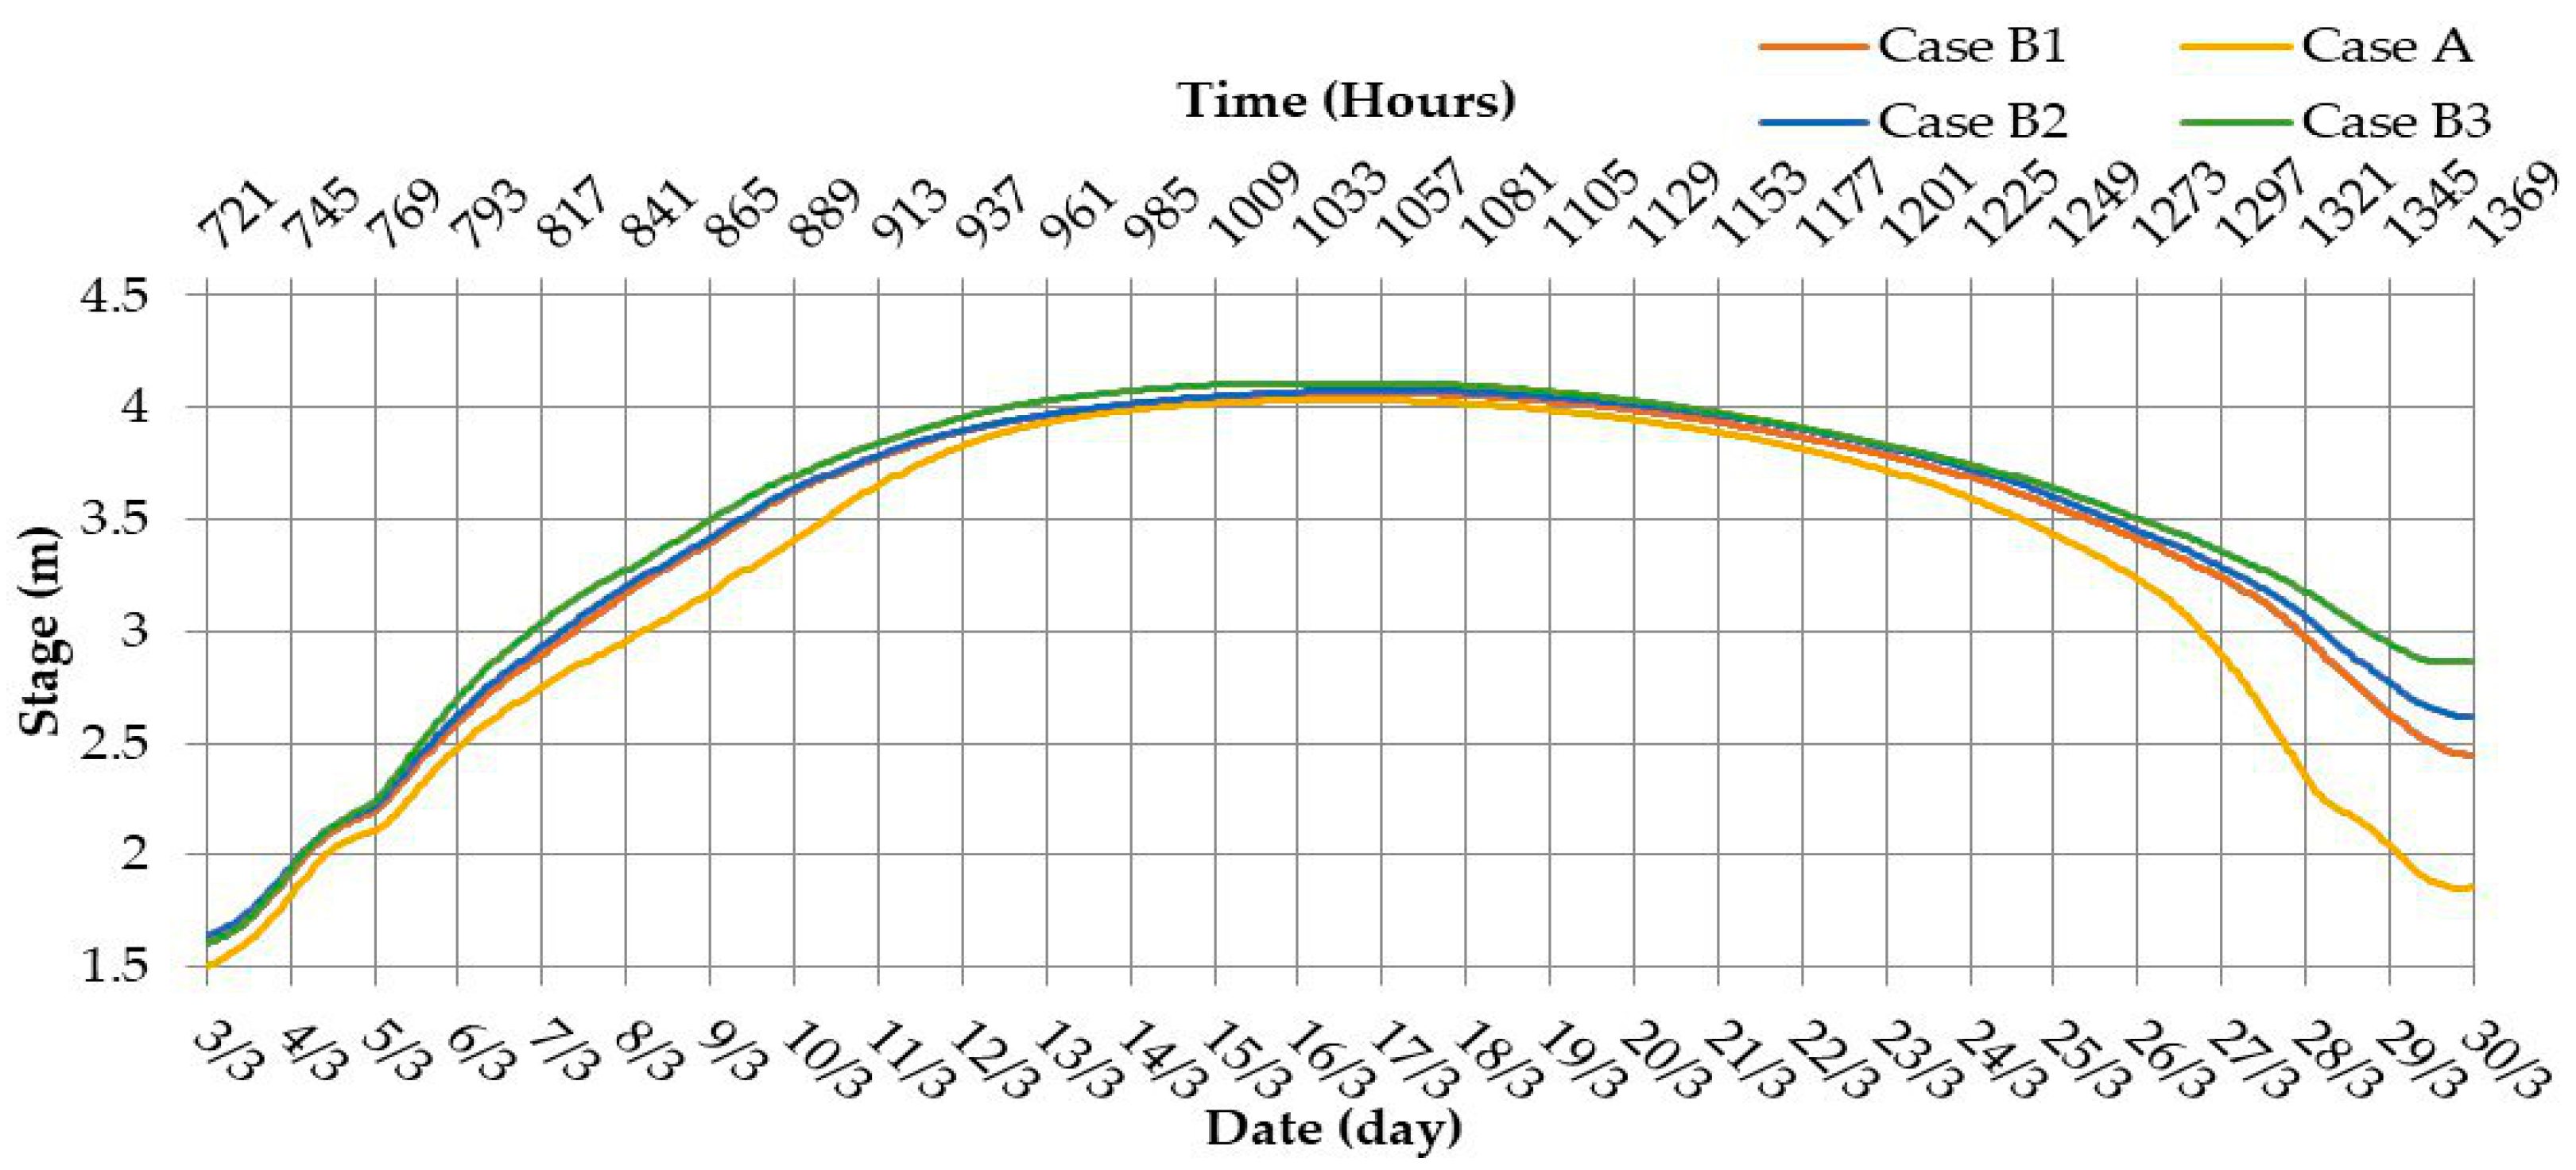
In order to illustrate the flood differences among the study cases (shown above), the stages of the Shatt Al-Arab river were depicted in four selected sections: section numbers 2.4, 65, 92, and 115 along the river, as shown in Figure 3. The distance from the Abu-Flus regulator to the cross sections 2.4, 65, 90, and 115 were 9.17, 81.27, 114.47, and 137.26 m, respectively. The results of the water stages for the above cases are shown in Figure 17, Figure 18, Figure 19 and Figure 20, respectively.
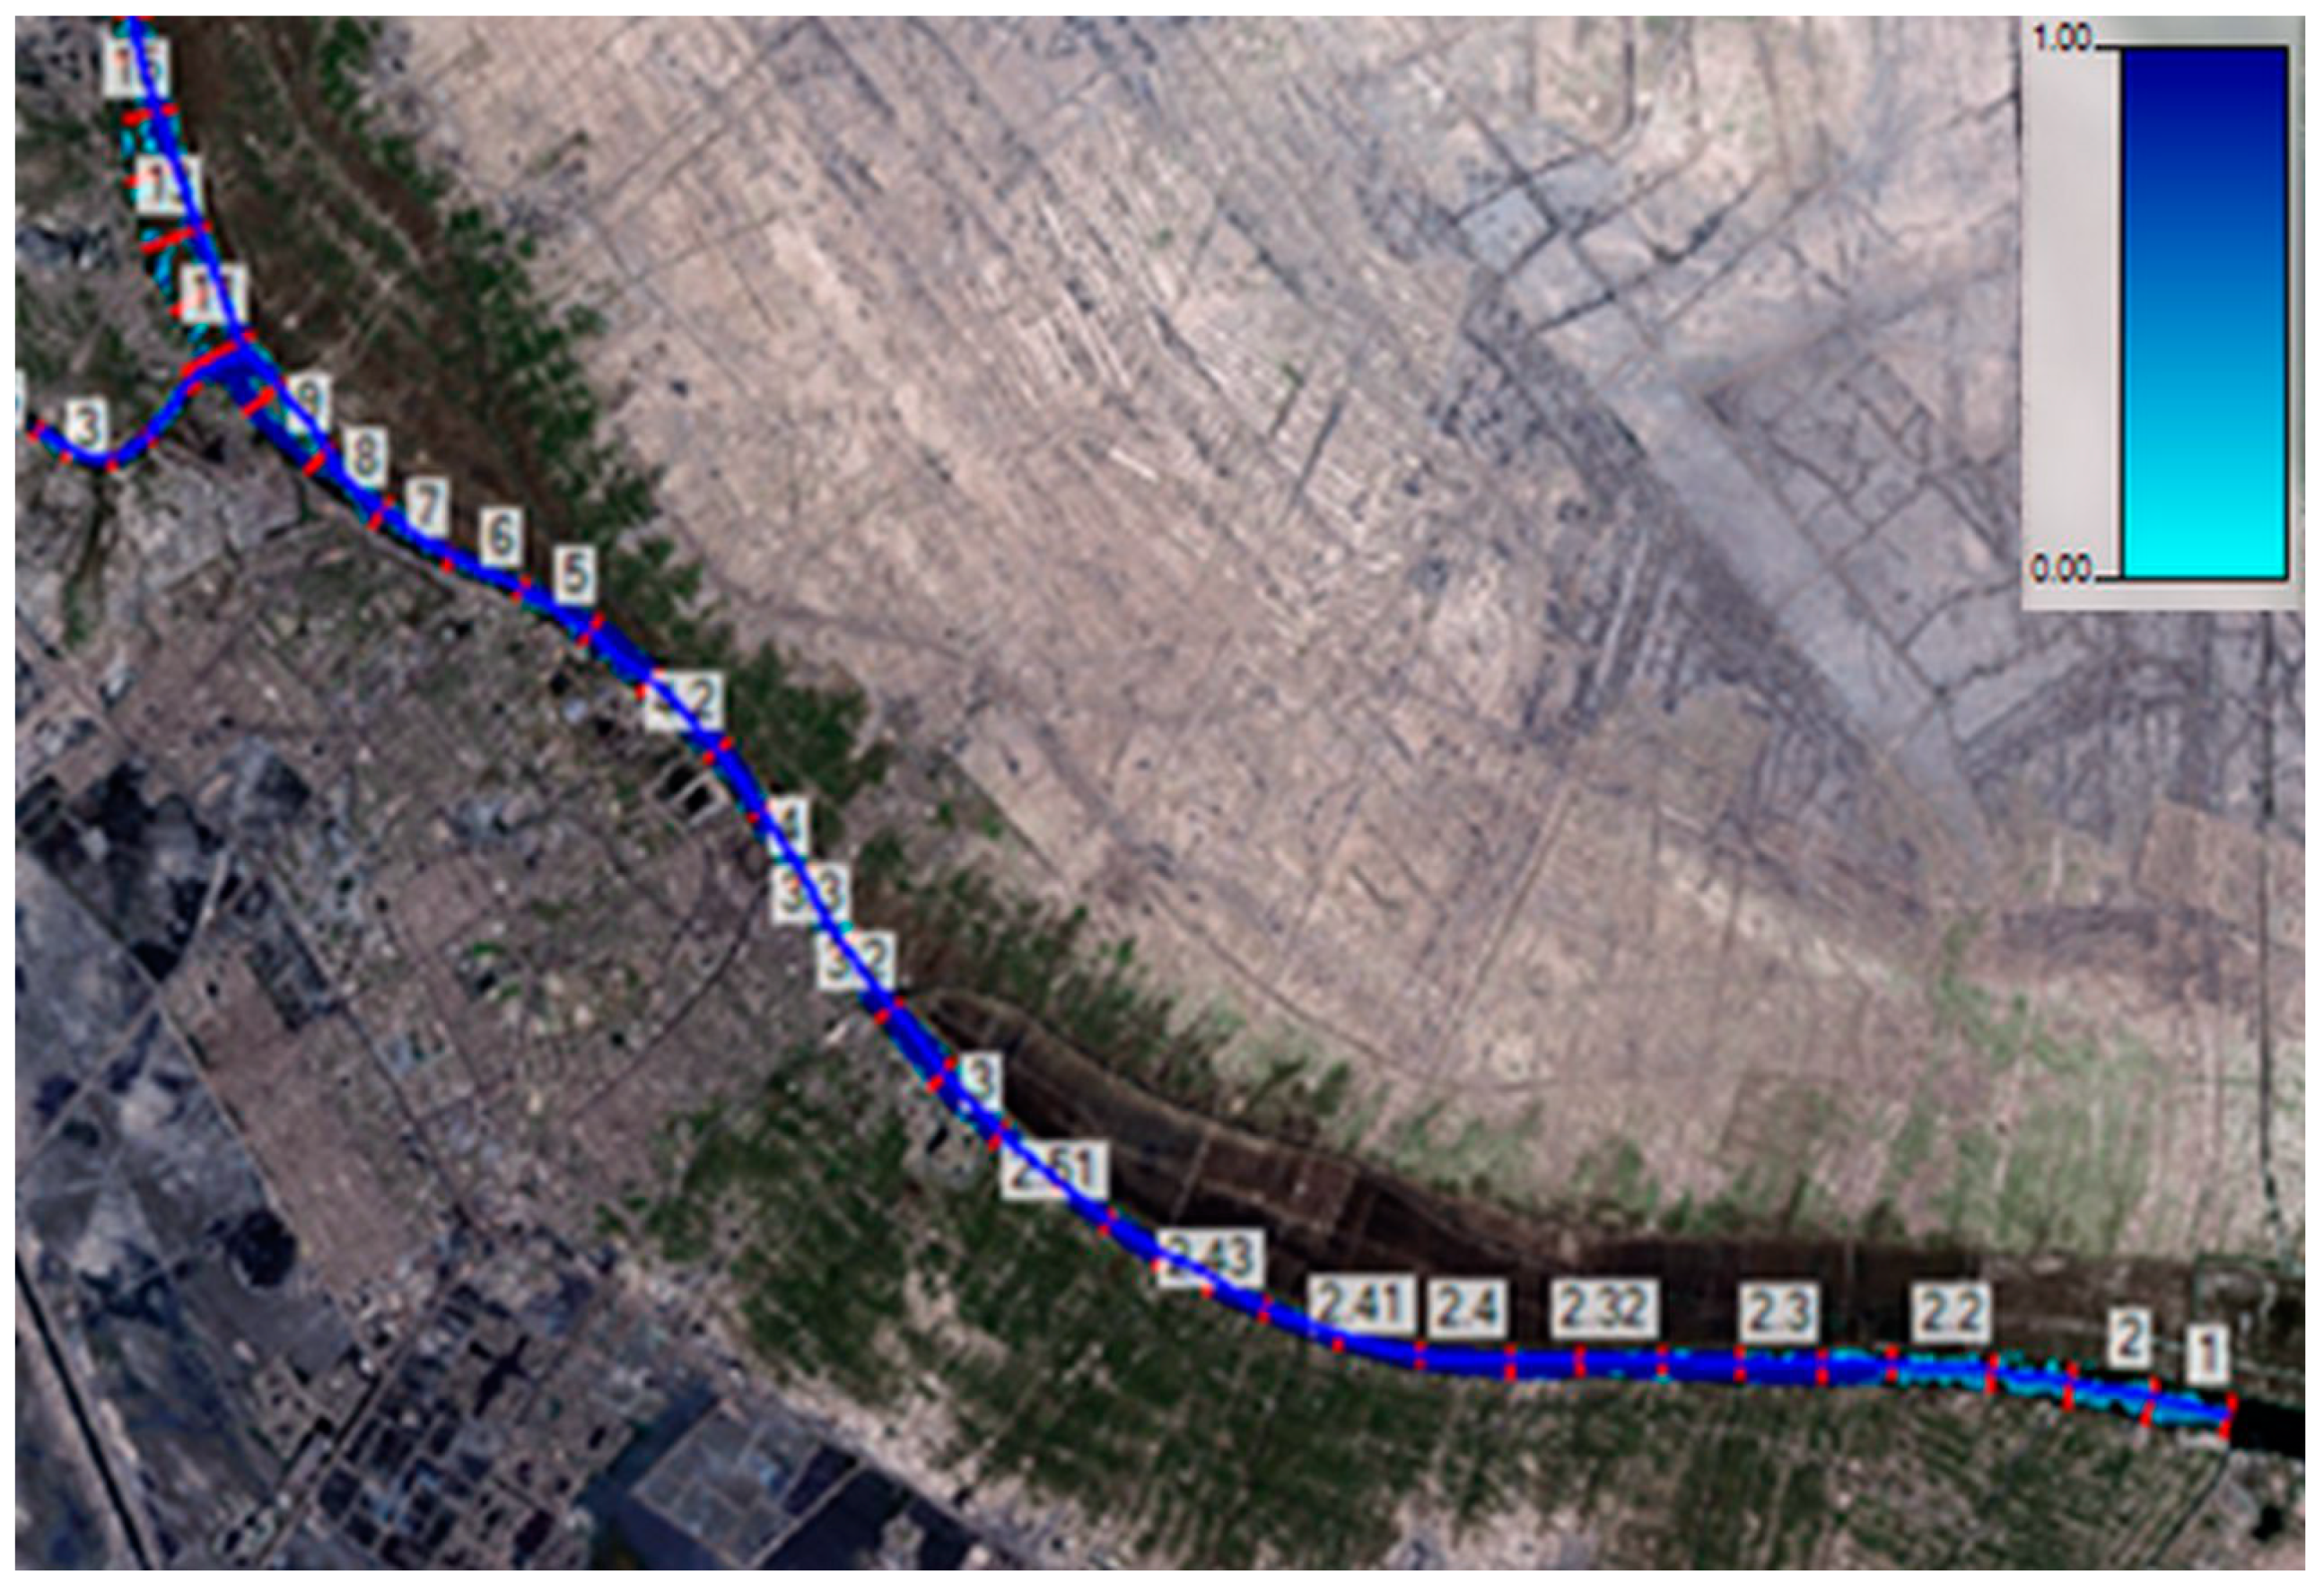
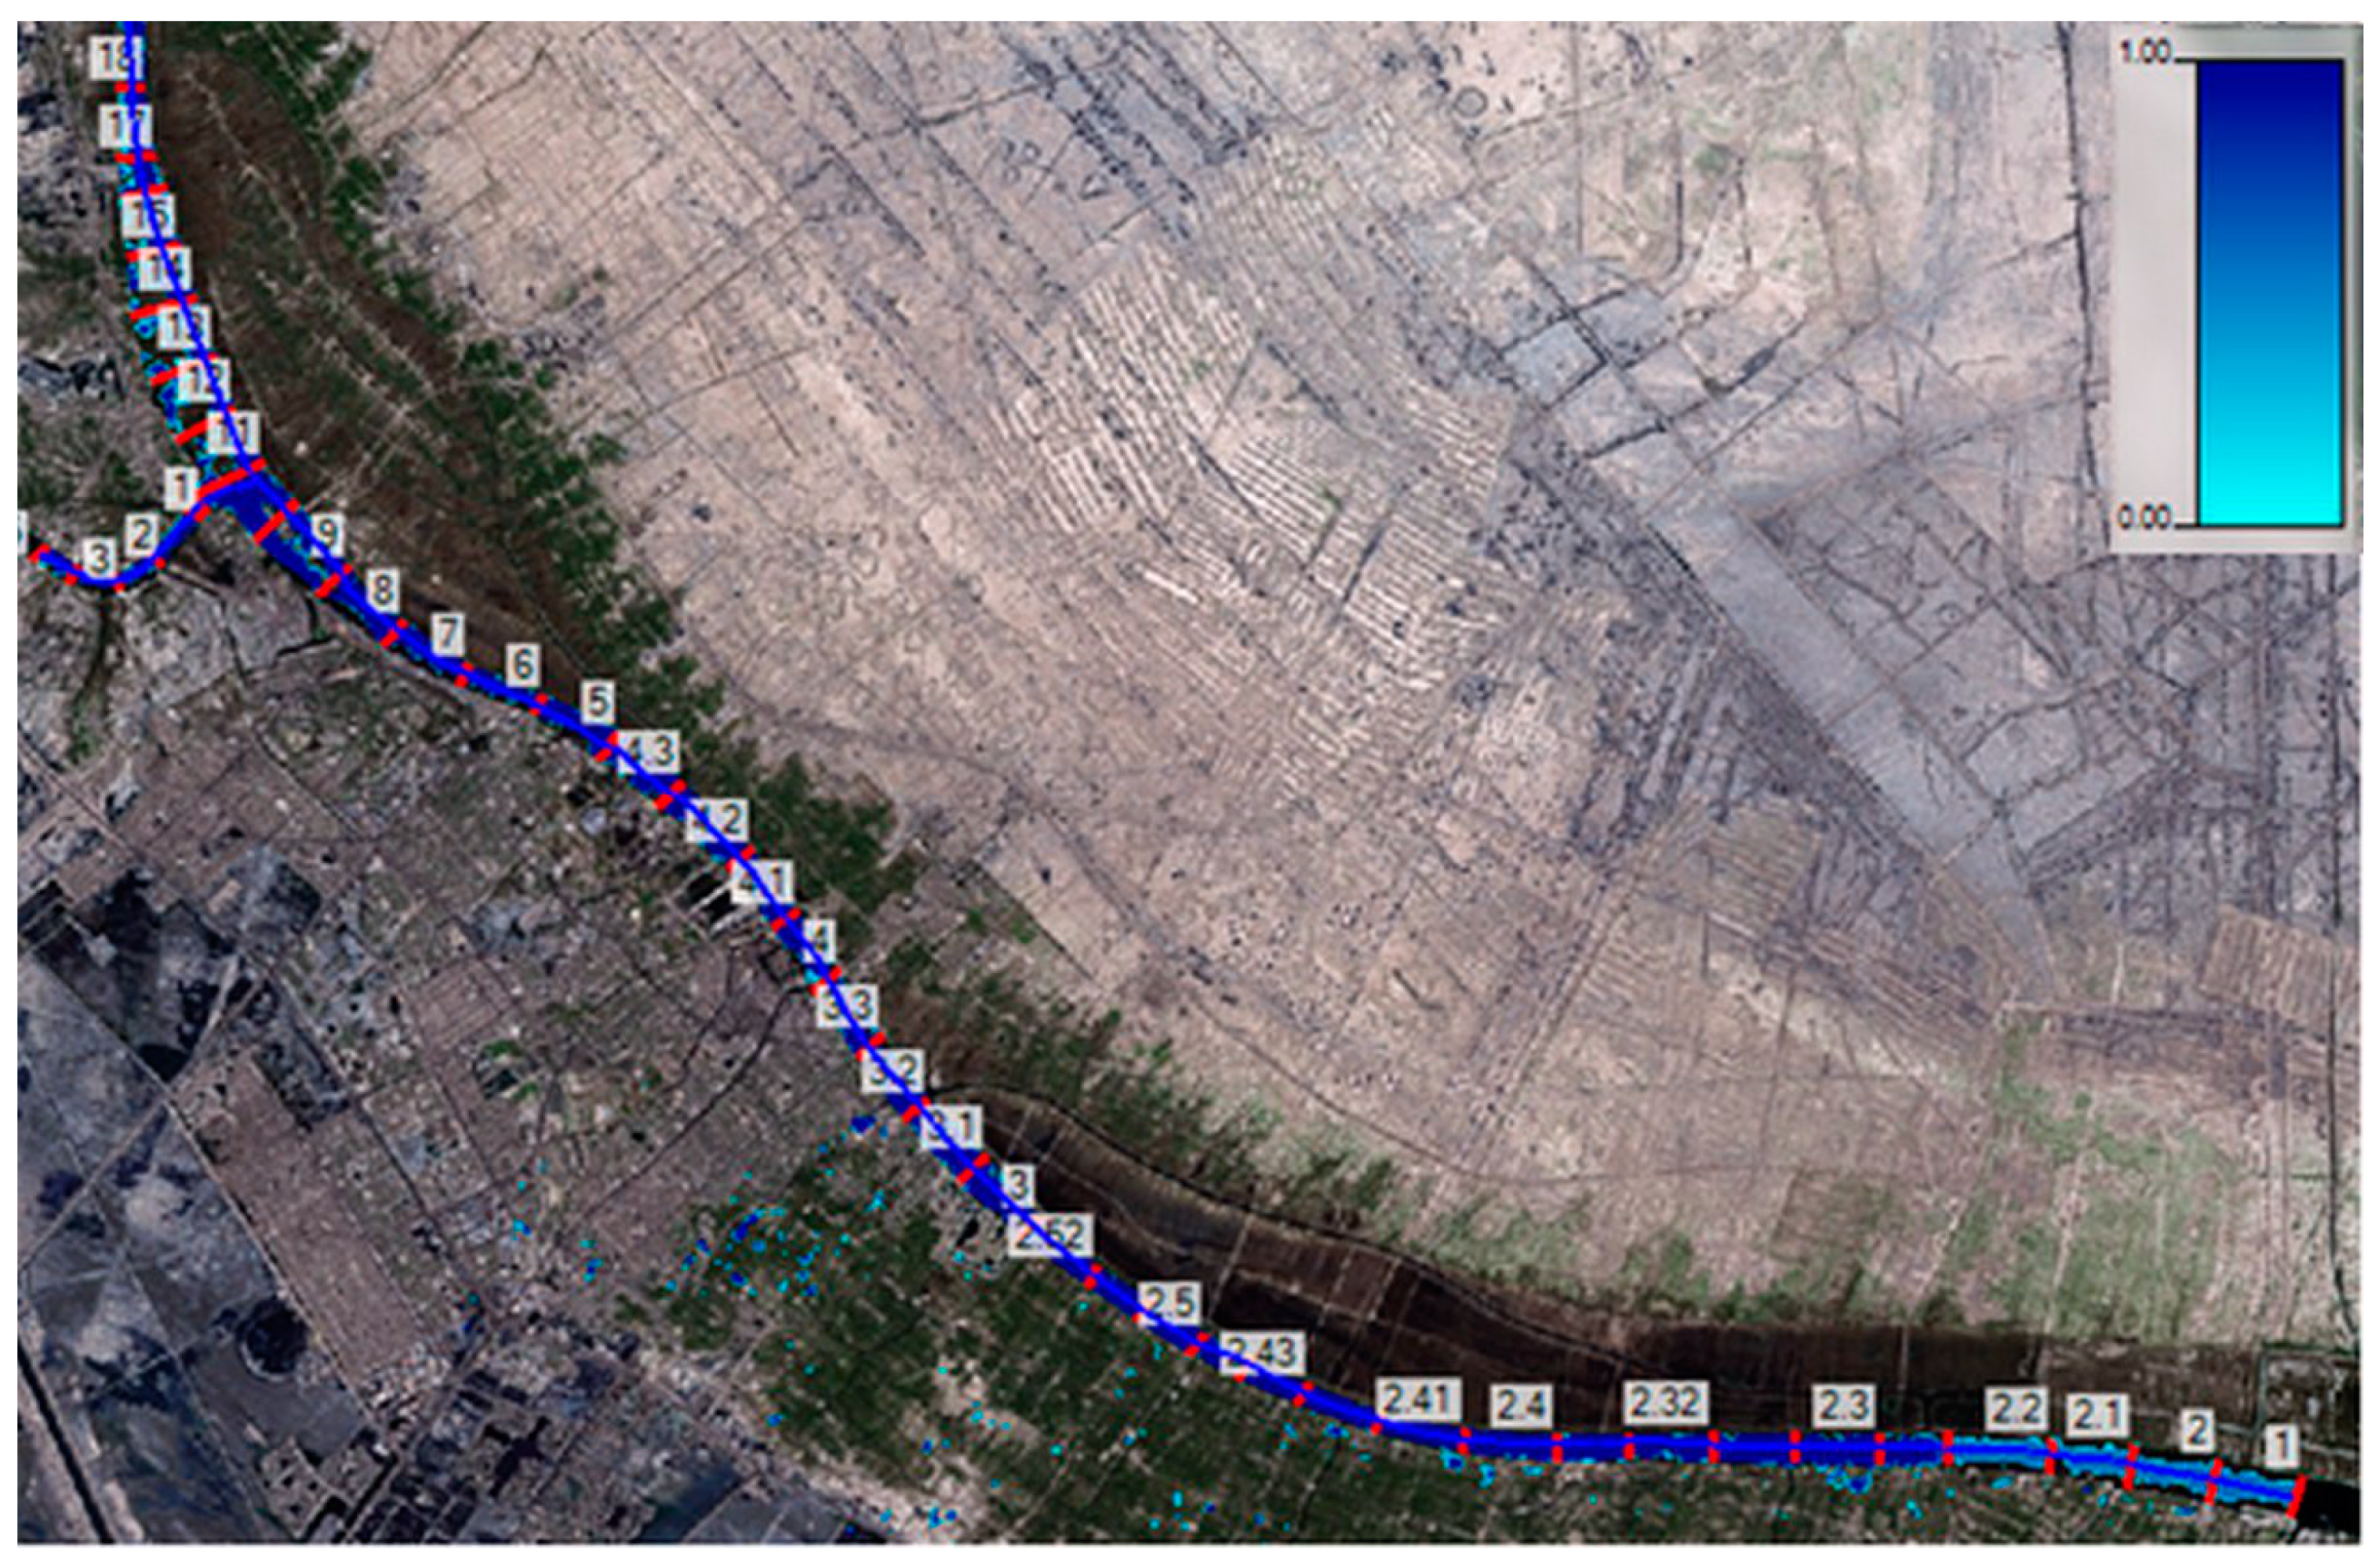
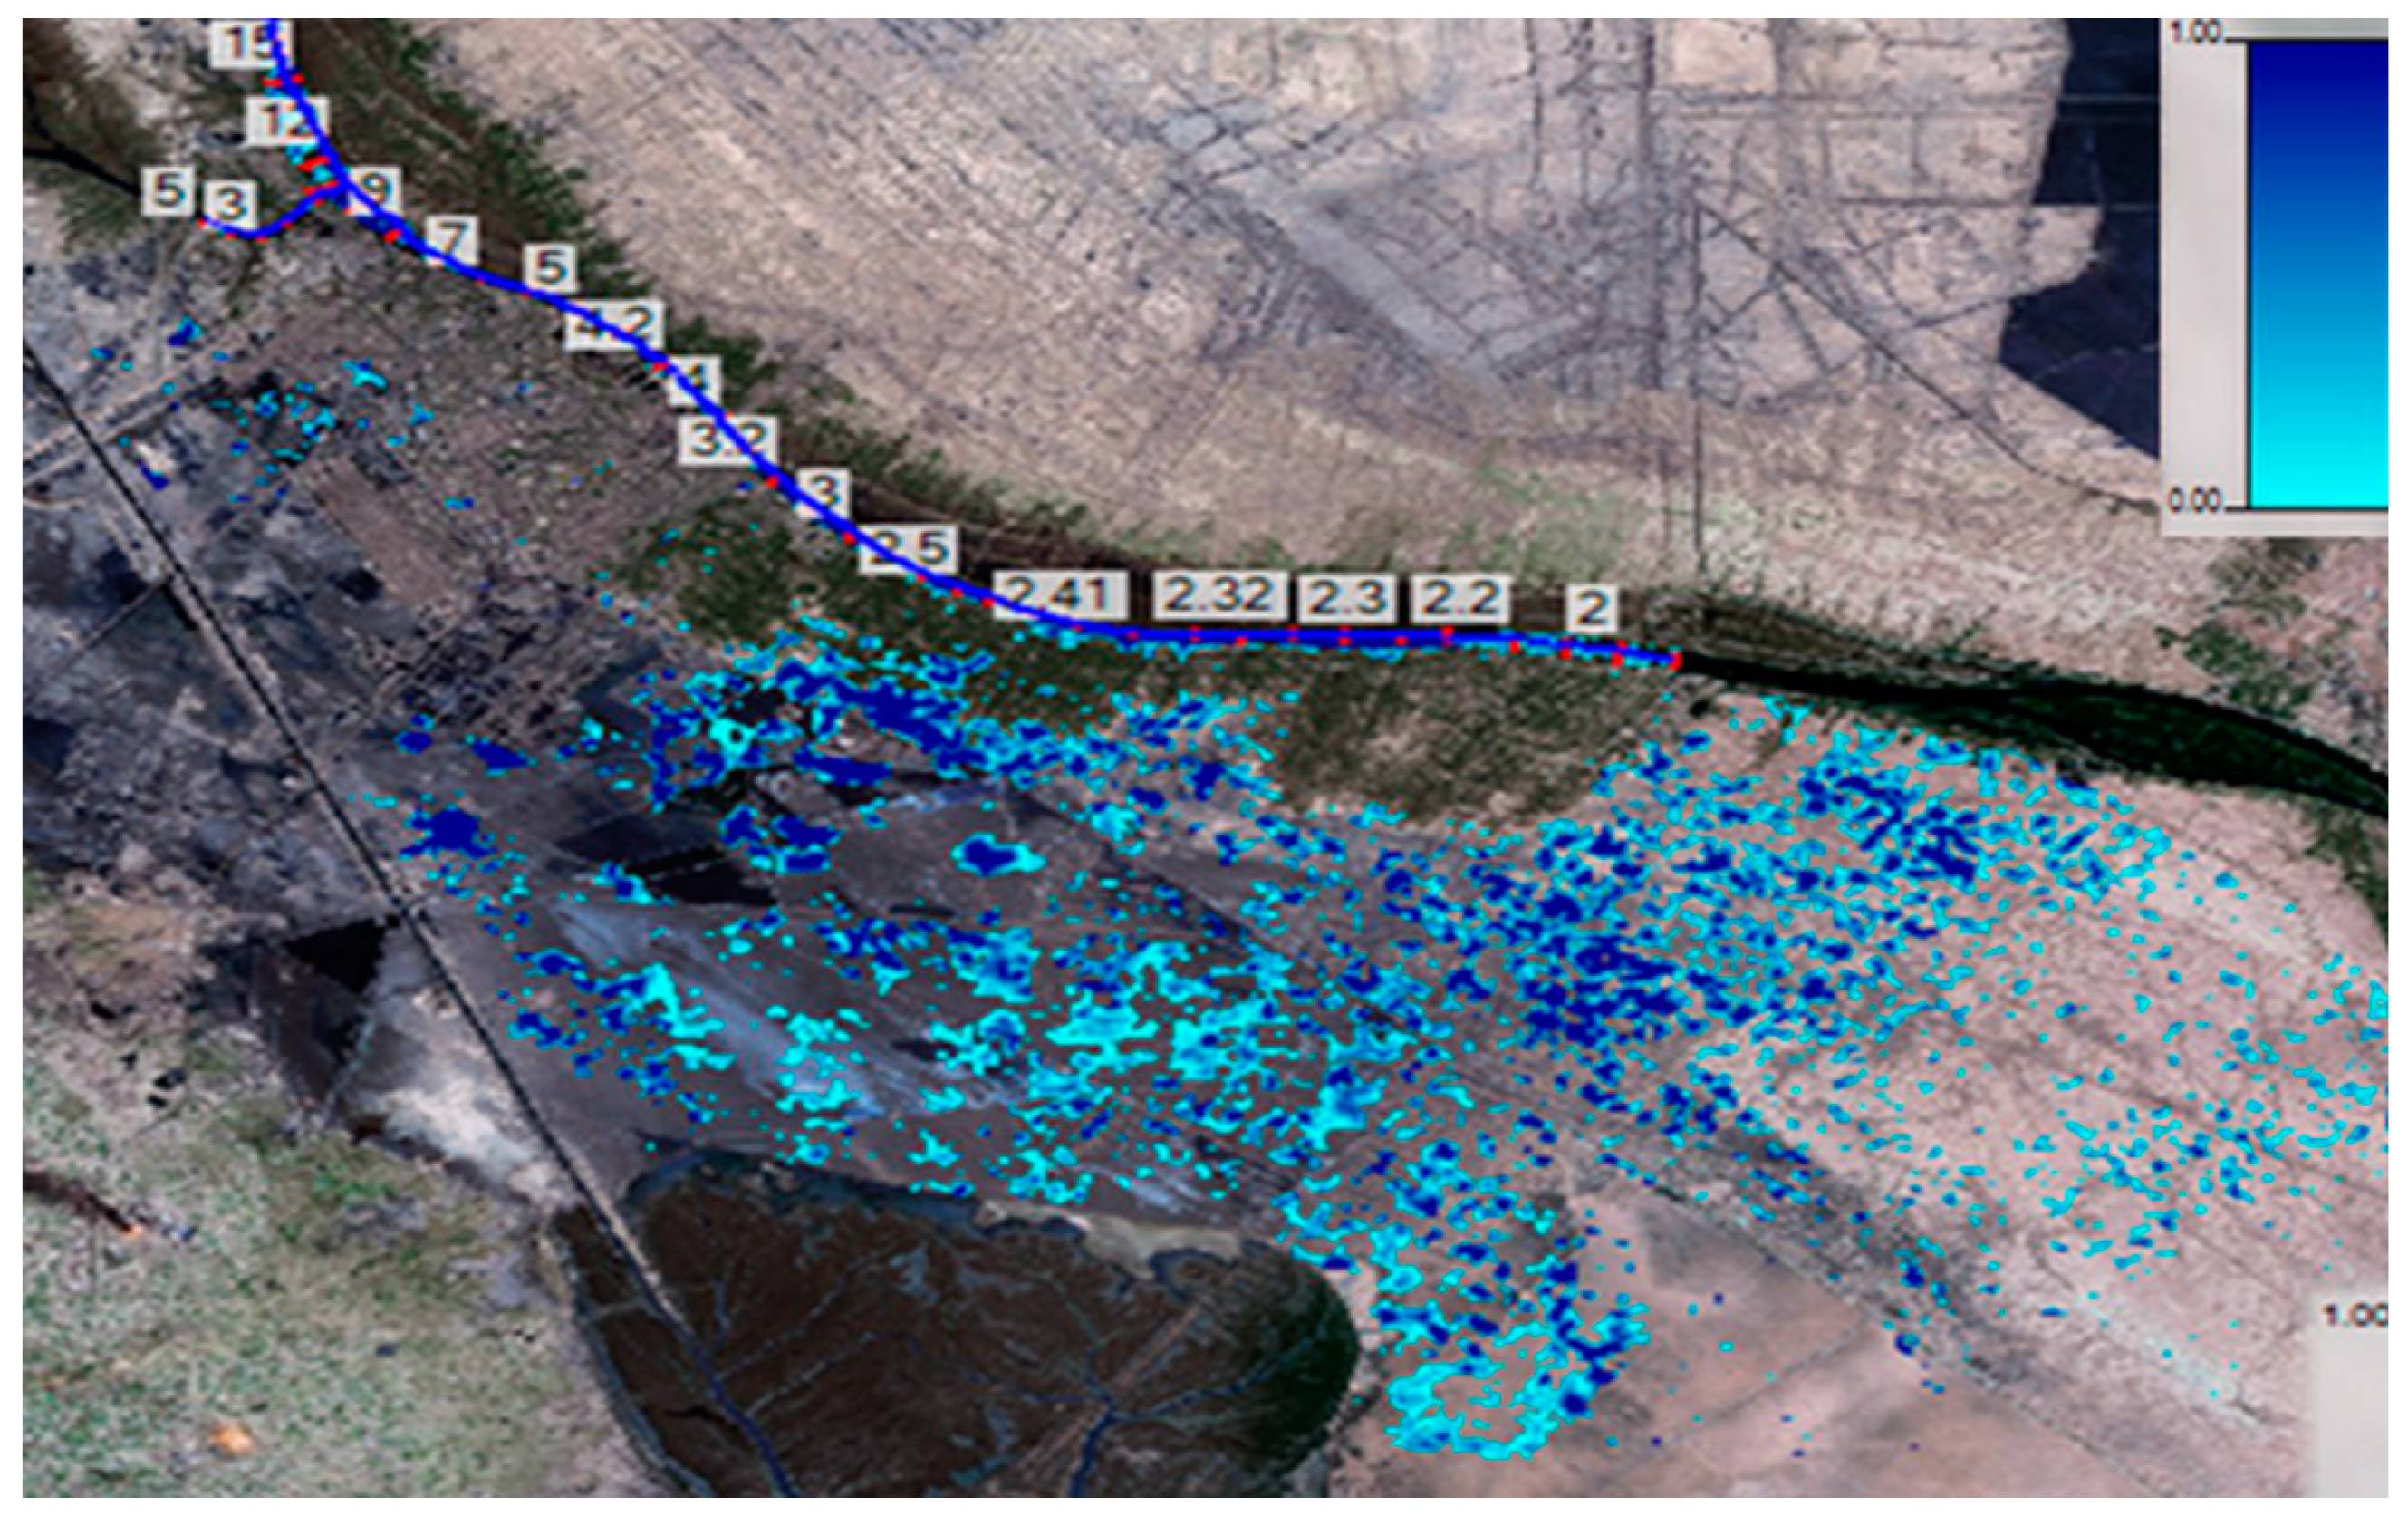
3.3. Flood Inundation Map
A flood inundation map is a map that shows the spatial extent and land area of flooding at specific water level intervals along an individual stream section. The flood inundation maps of the maximum water level for the three cases of regulator gates B1–B3 are shown in Figure 21, Figure 22 and Figure 23, respectively. The flooded land area did not appear in case B1, as shown in Figure 21, whereas it appeared in cases B2 and B3 on the right side of the river upstream of the regulator up to station 3.2, as shown in Figure 22 and Figure 23, respectively. It can be concluded that the worst gate condition was when they were tidal gates (B2) or closed gates (B3), where they led to inundation of lands by river flooding. However, the velocity of the flood flow did not exceed 0.1 m/s (very low), and such low velocities pose a very low hazard risk for people, as shown in Table 2 [29].
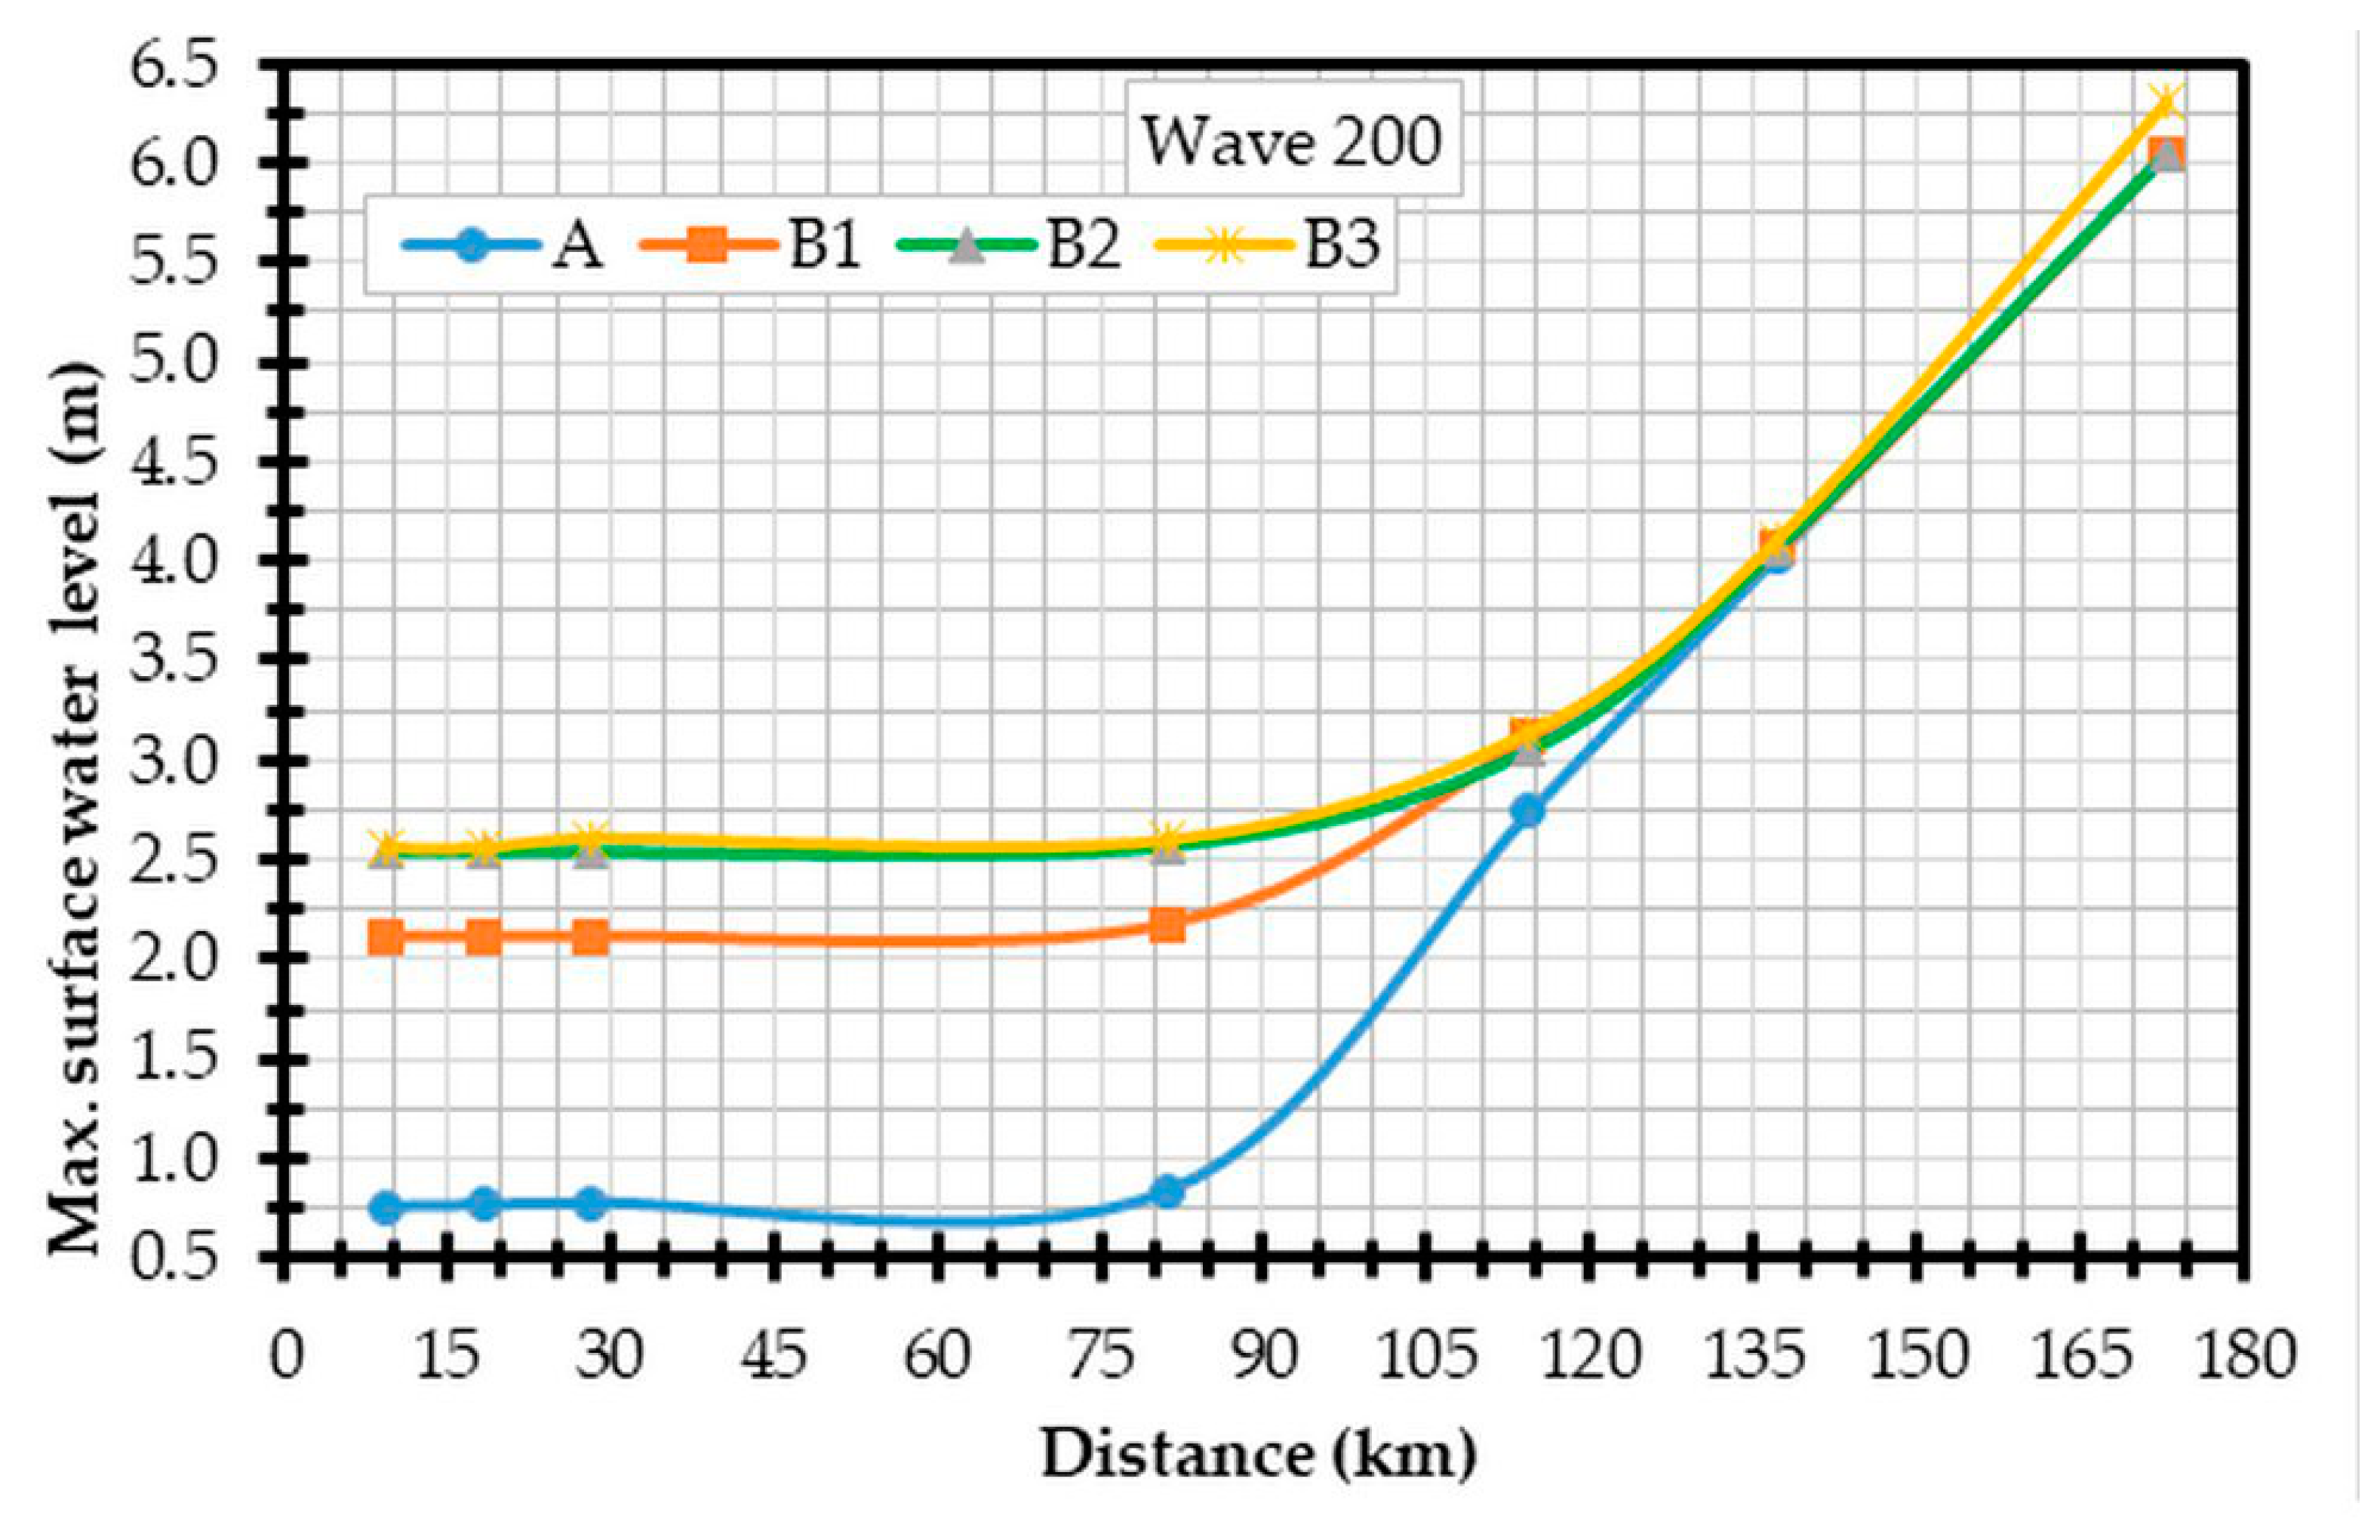
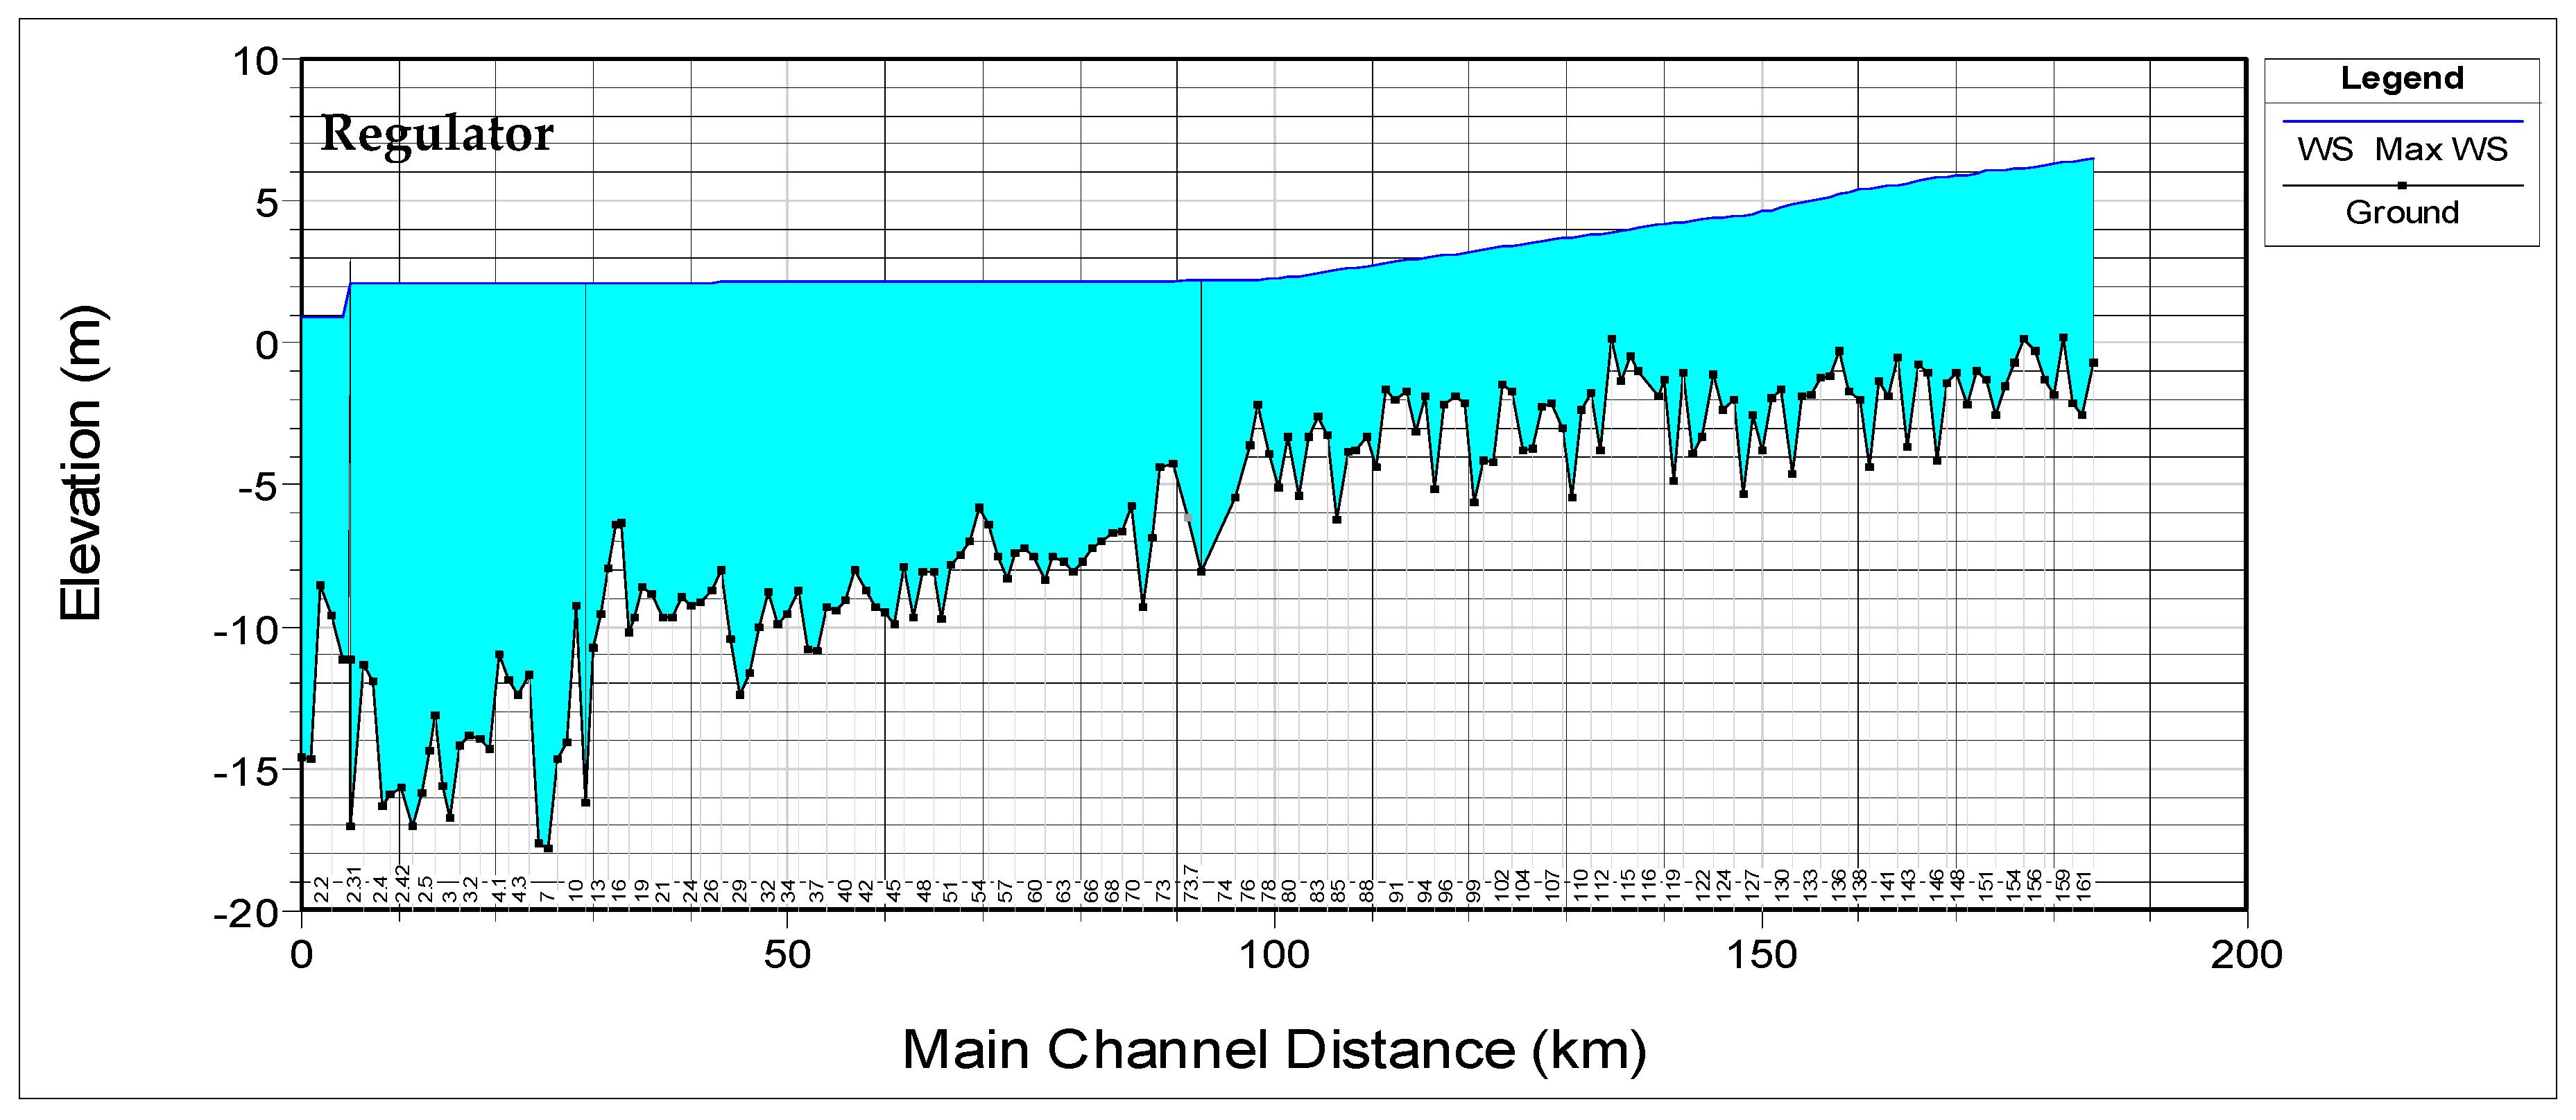
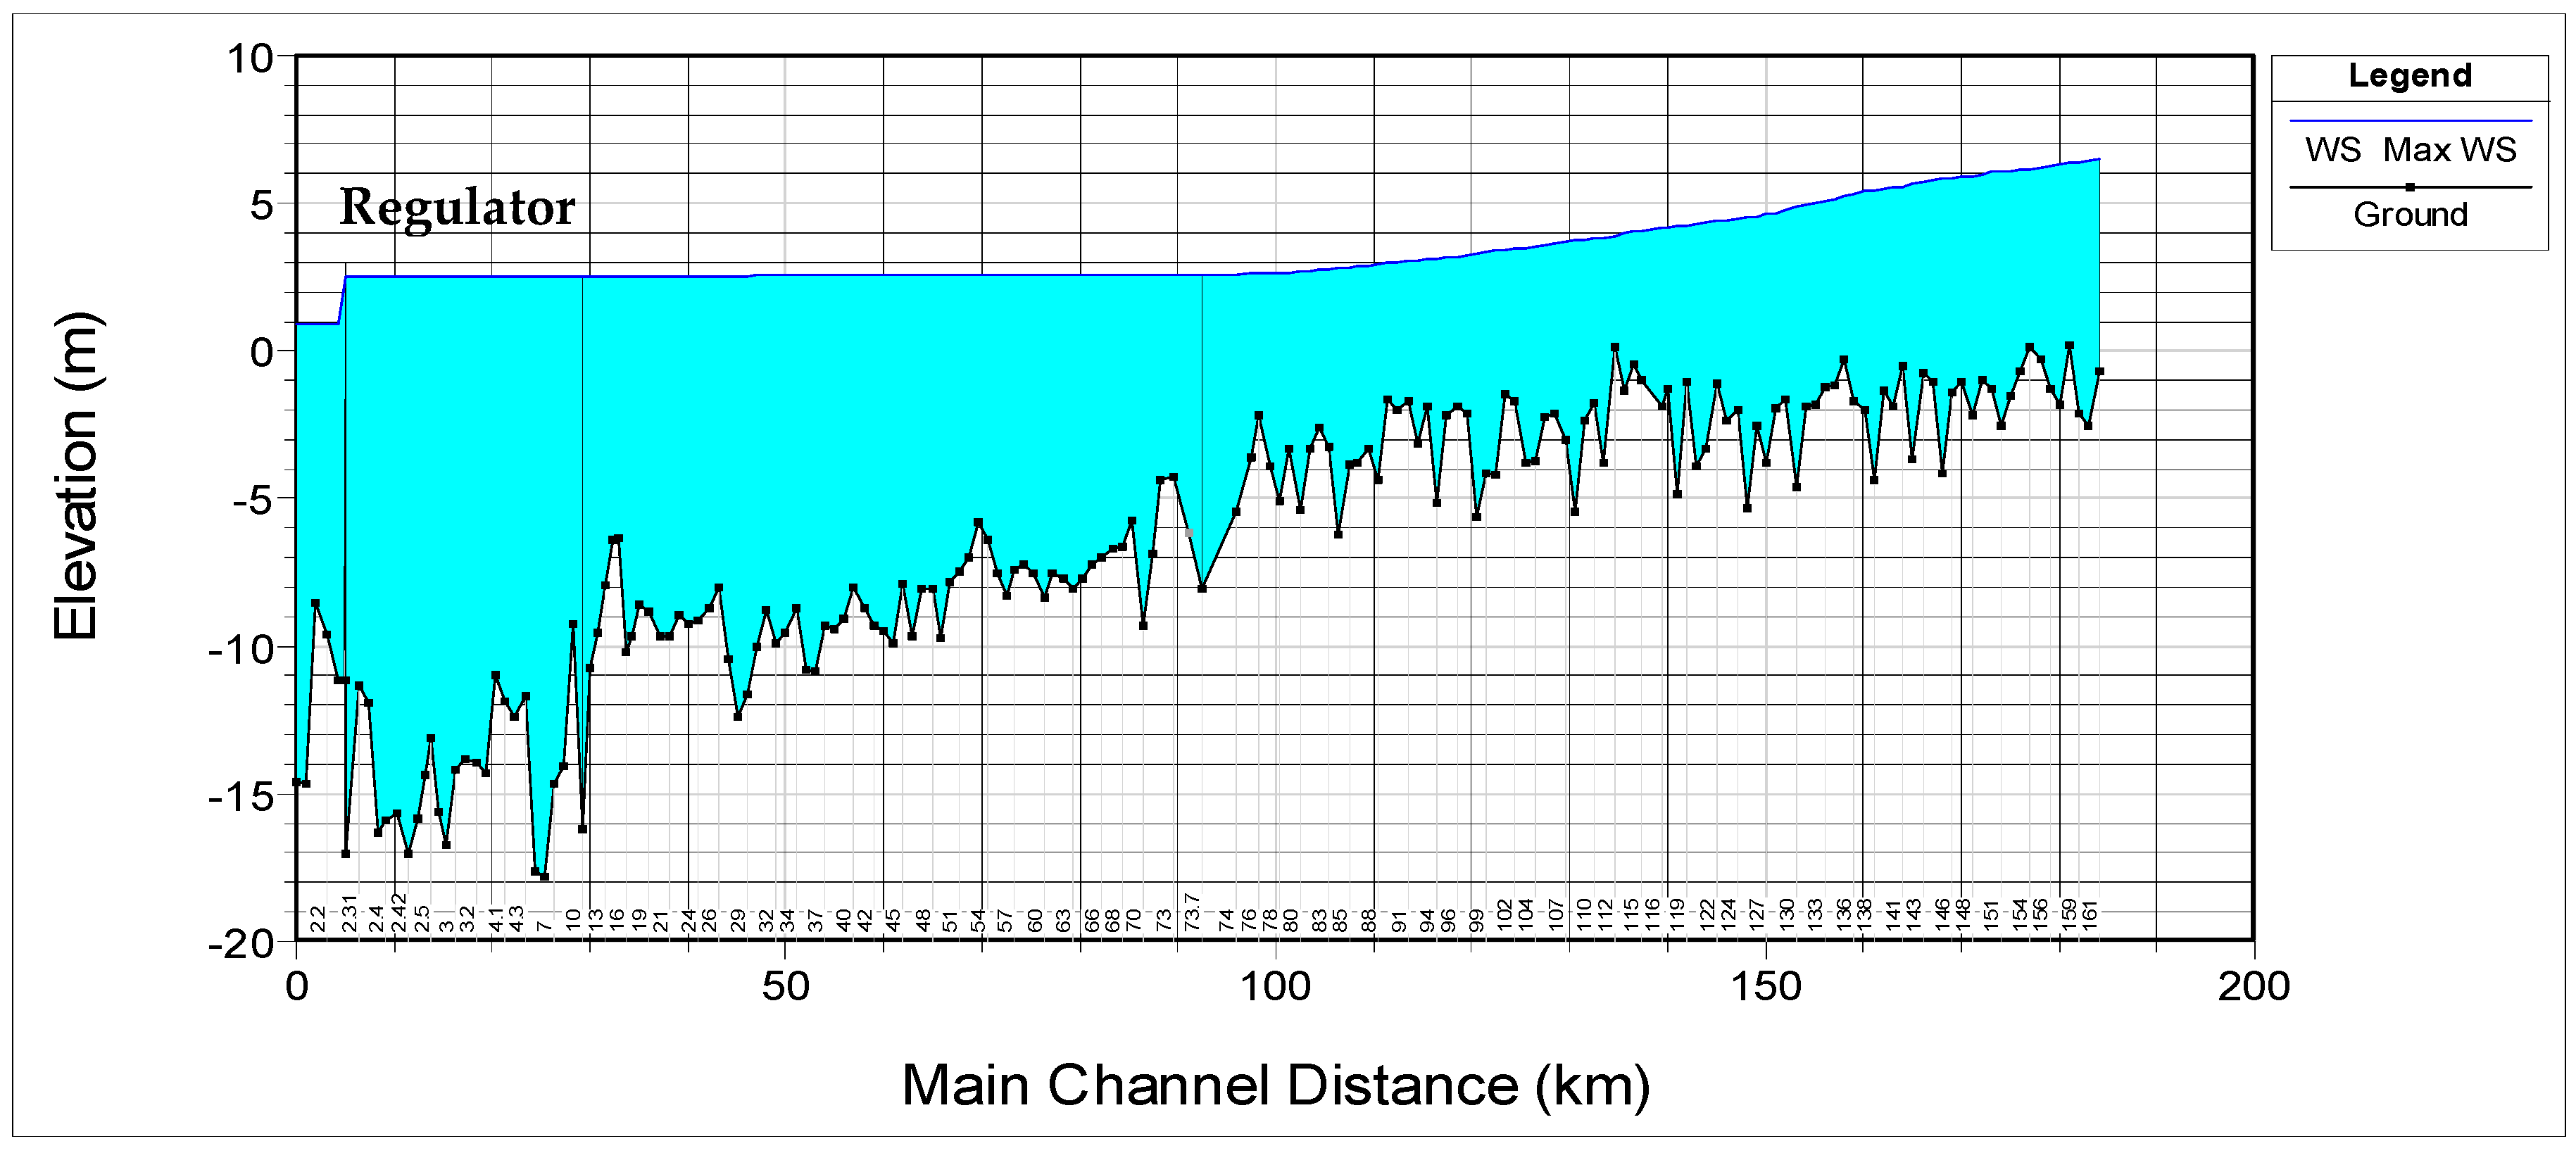
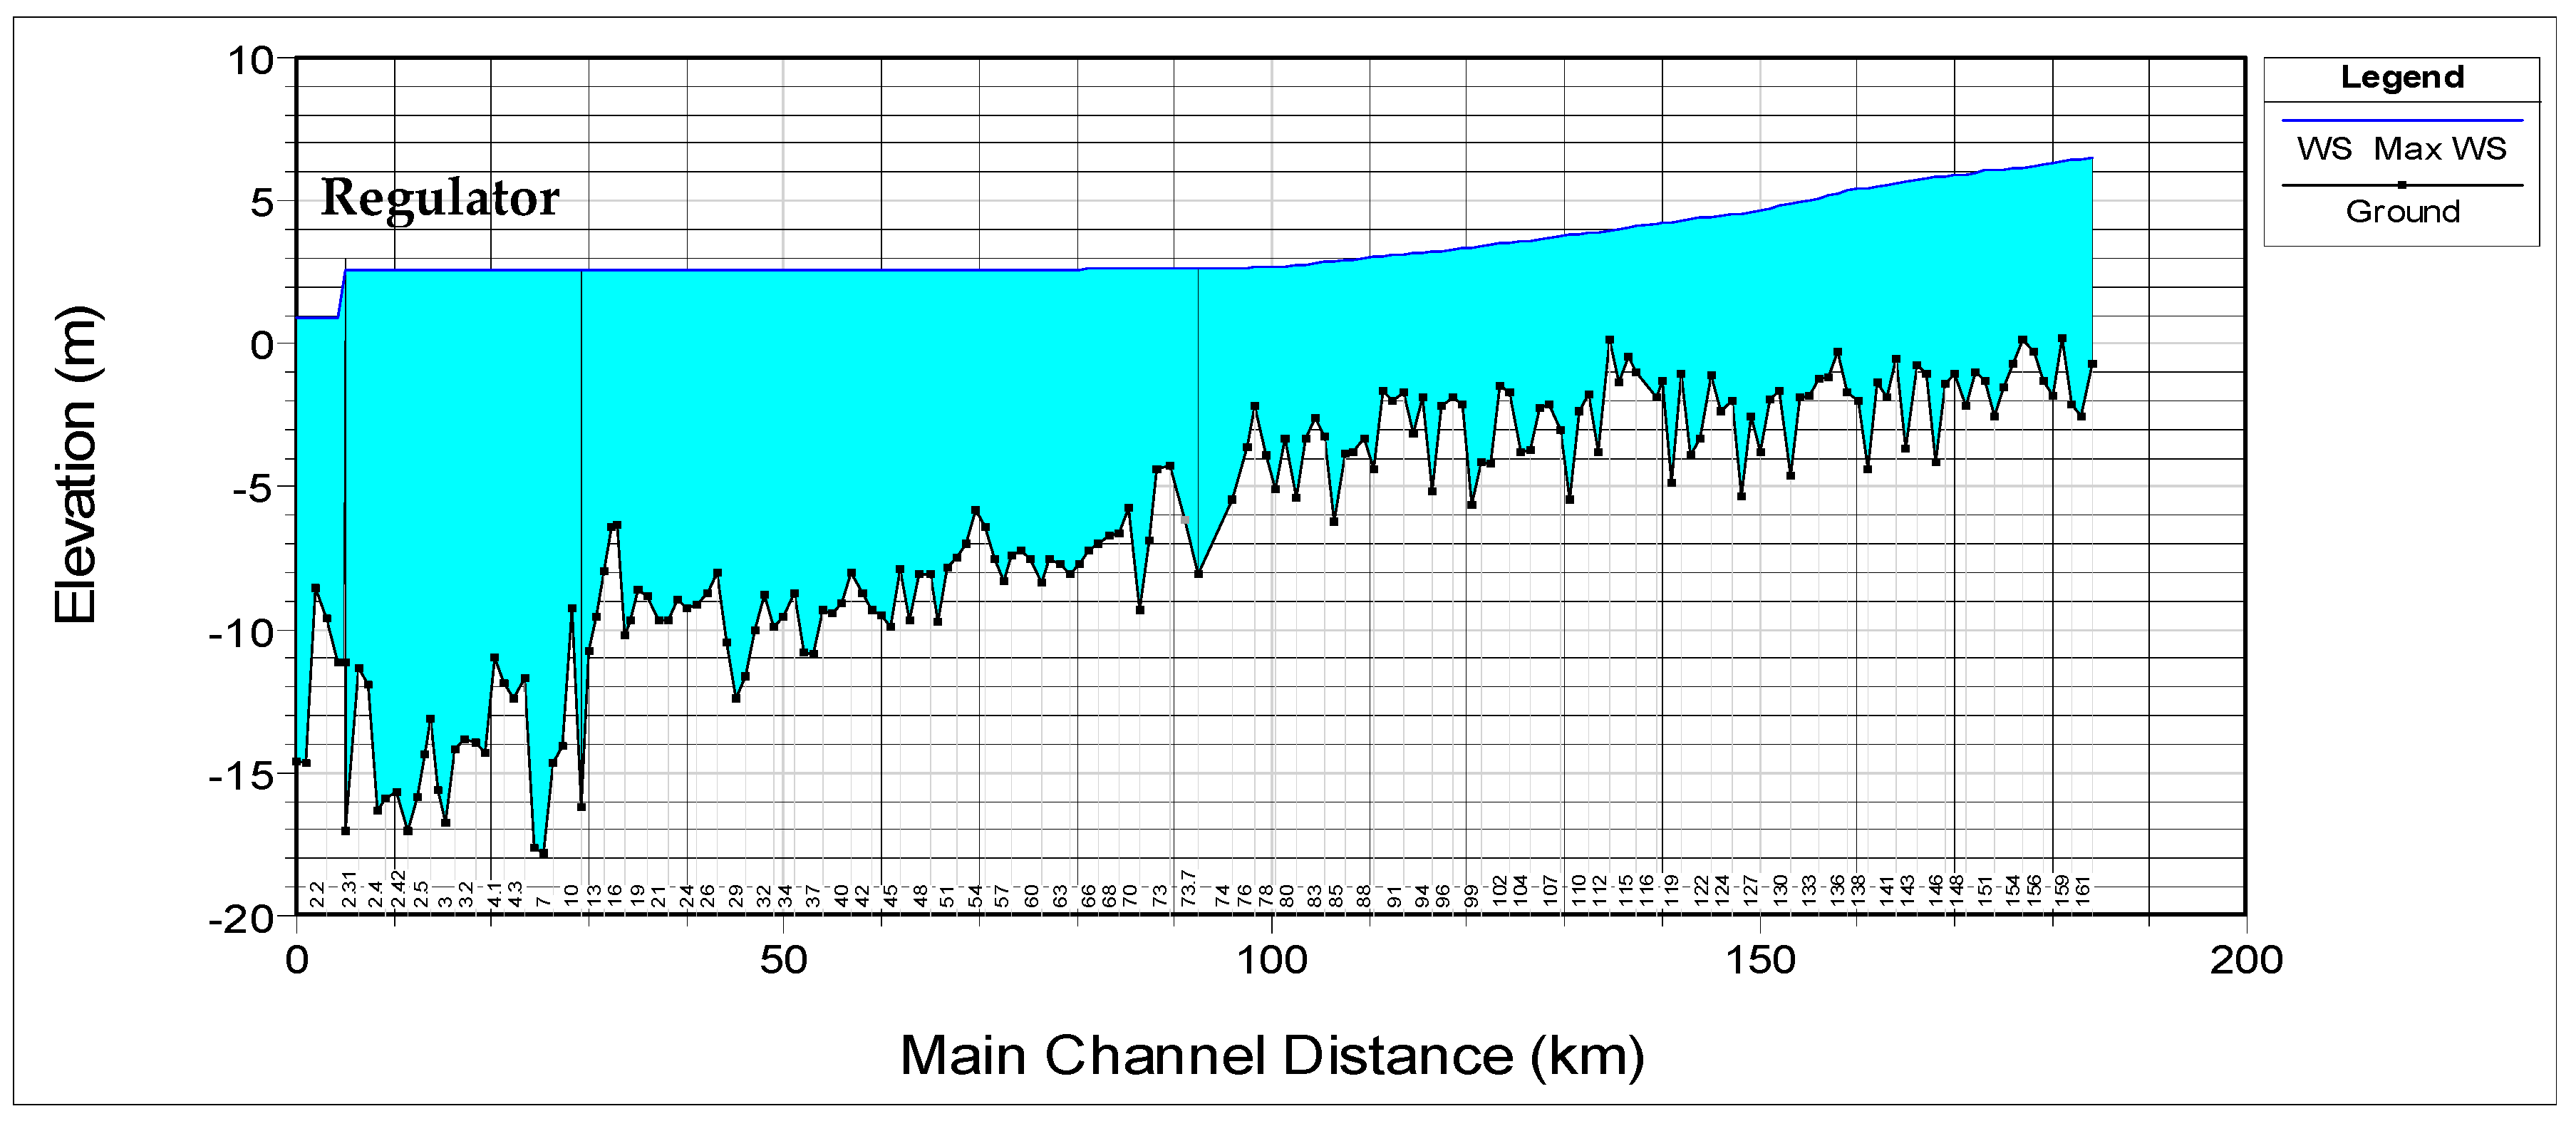
3.4. Water Surface Profile
Figure 24, Figure 25 and Figure 26 show the longitudinal profile of the Shatt Al-Arab River from Qal’at Saleh to Abu-Flus in the case of the maximum wave flow during the flood period for the three study cases B1–B3, respectively. Figure 27 shows the variation of the water surface along the Shatt Al-Arab River from Qal’at Saleh to Abu-Flus in the case of the maximum flow of the wave during the flood period for the four cases of this study. This figure shows that the highest water surface level of the river was in case B3, that is, the river with the regulator when the gates were closed. The lowest water surface level of the river was in case A, that is, the river without the regulator. In other words, the construction of a regulator will increase the water level near the regulator by about 1.36, 1.78, and 1.80 m for cases B1–B3, respectively, as compared with case A.
4. Discussion
4.1. Flood Occur Cases
Table 3 shows the chances of flooding in the selected cross-section numbers 2.4, 65, 92, and 115. If the maximum water level of the cross section exceeds the side bank level of the river in that section, it will lead to water overflow from the river to the floodplain and flooding over the land. It is clear that a flood event would occur in cases B2 and B3 in cross-section number 2.4 on the right river bank only. However, this surface flooding would be due to the rise of the water level of the river by a few centimeters, which would not exceed 6 cm. Therefore, the banks in this cross section should be raised by about 50 cm to avoid surface flooding.
4.2. Effect of a Regulator on Water Surface Levels
Table 4 shows the differences among the surface water levels in the four study cases A, B1, B2, and B3 during the flood wave at the selected cross-section numbers 2.4, 65, 92, and 115. It is evident from the table that the maximum increase would occur in cross-section 2.4 near the regulator, where the values were 1.36, 1.78, and 1.80 in cases B1–B3, respectively, whereas the minimum increase would occur in cross-section 115, where the values were 0.03, 0.04, and 0.08 in cases B1–B3, respectively.
5. Conclusions
A HEC-RAS model was calibrated and validated to simulate the real flow of the Shatt Al-Arab River without a regulator for the data from 2014. The results showed very good agreement between the simulated and observed stages, where the correlation coefficient (R2) was 0.88 (on average). The final Manning’s values (n) of the main channels for the Tigris, Euphrates, Shatt Al-Arab River, and Garmat Ali Rivers were 0.028, 0.029, 0.033, and 0.033, respectively, whereas the Manning’s values (n) of the banks for the river reaches were 0.06.
We examined the possibility of flooding areas on the two side banks (floodplain) of the river in the case of establishing a regulator exposed to a flood wave with peak flow 200 m3/s for 27 days. The study assumed that the regulator contained seven gates with a size of 3 × 5 m and that these gates could be fully opened, fully closed, or operated as tide gates. The worst gate condition was when they were tidal gates (B2) and closed gates (B3), where they led to inundation of land areas by flooding. However, the velocity of the flood flow did not exceeded 0.1 m/s (very low), such low velocities pose a very low hazard risk for people. This flood event occurred due to the water level of the river rising by a few centimeters, which did not exceed 6 cm over the bank level in cross-section number 2.4. Therefore, the banks in this cross section must be raised by 50 cm to avoid such a flood event. These results should encourage decision-makers to construct a regulator to prevent the intrusion of the saline tide from the Arabian Gulf towards the river. However, this requires raising the riverbank side and constructing lateral channels on the two sides of the river to reduce the excess water level during the flooding period.
Finally, integrating HEC-RAS and ArcGIS provides a way to predict flood extent or flood risks in any region of the world. The maps produced by this model are useful for developing plans for sustainable flood management.
Author Contributions
A.N.A.H.: Research idea methodology, supervision, validation, writing—original draft, review and editing.; A.A.A.: methodology, supervision, writing—original draft; A.T.N.: methodology, data collection, on-site measurements, Programming, and writing—original draft.
Funding
This research did not receive any specific grant from funding agencies in the public, commercial, or not-for-profit sectors.
Acknowledgments
Some of the cross-section data for the rivers were provided by the Ministry of Water Resources in Iraq, Water Resources Directorate, Basrah, Iraq. The authors would especially like to thank the officials for their assistance.
Conflicts of Interest
The authors declare no conflicts of interest.
References
- MED Ingegneria S.r.l; SGI Studio Galli Ingegneria S.p.A; El Concorde LLC. Shatt Al-Arab Irrigation Project—Main Technical Report; MED517; Center of Studies and Engineering Designs, Ministry of Water Resource: Baghdad, Iraq, January 2013.
- Moyel, M.S. Assessment of water quality of the Shatt Al-Arab River, using the multivariate statistical technique. Mesop. Environ. J. 2014, 1, 39–46. [Google Scholar]
- Abdulla, S.S. An Investigation to River Load of Shatt Al-Arab in Basrah. Master’s Thesis, Marine Science Centre, University of Basrah, Basrah, Iraq, September 1990. [Google Scholar]
- Hussian, N.A.; Abdullah, S.S.; Al-Mahdi, A.A. Some features of the physical oceanography in Iraqi marine waters. Mesop. J. Mar. Sci. 2009, 24, 13–24. [Google Scholar]
- Hamdan, A.N.A. Simulation of TDS Intrusion from Arabian Gulf to Shatt Al-Arab River. Basrah J. Eng. Sci. 2016, 16, 28–32. [Google Scholar]
- Jongman, B.; Hochrainer-Stigler, S.; Feyen, L.; Aerts, J.C.; Mechler, R.; Botzen, W.W.; Bouwer, L.M.; Pflug, G.; Rojas, R.; Ward, P.J. Increasing stress on disaster-risk finance due to large floods. Nat. Clim. Chang. 2014, 4, 264. [Google Scholar] [CrossRef]
- Kumar, N.; Lal, D.; Sherring, A.; Issac, R.K. Applicability of HEC-RAS & GFMS tool for 1D water surface elevation/flood modeling of the river: a Case Study of River Yamuna at Allahabad (Sangam), India. Model. Earth Syst. Environ. 2017, 3, 1463–1475. [Google Scholar]
- Gharbi, M.; Soualmia, A.; Dartus, D.; Masbernat, L. Comparison of 1D and 2D hydraulic models for floods simulation on the medjerda riverin tunisia. J. Mater. Environ. Sci. 2016, 7, 3017–3026. [Google Scholar]
- Horritt, M.S.; Bates, P.D. Evaluation of 1D and 2D numerical models for predicting river flood inundation. J. Hydrol. 2002, 268, 87–99. [Google Scholar] [CrossRef]
- Hicks, F.E.; Peacock, T. Suitability of HEC-RAS for flood forecasting. Can. Water Resour. J. 2005, 30, 159–174. [Google Scholar] [CrossRef]
- Ahmad, H.F.; Alam, A.; Bhat, M.S.; Ahmad, S. One Dimensional Steady Flow Analysis Using HECRAS–A case of River Jhelum, Jammu and Kashmir. Eur. Sci. J. 2016, 12, 32. [Google Scholar] [CrossRef]
- Nguyen, H.; Degener, J.; Kappas, M. Flash flood prediction by coupling KINEROS2 and HEC-RAS models for tropical regions of Northern Vietnam. Hydrology 2015, 2, 242–265. [Google Scholar] [CrossRef]
- Lamichhane, N.; Sharma, S. Development of flood warning system and flood inundation mapping using field survey and LiDAR data for the Grand River near the city of Painesville, Ohio. Hydrology 2017, 4, 24. [Google Scholar] [CrossRef]
- Hamdan, A.N.A. Controlling the Surface Water of Shatt Al-Arab River by Using Sluice Gates. J. Babylon Univ./Eng. Sci. 2016, 24, 85–94. [Google Scholar]
- Papaioannou, G.; Efstratiadis, A.; Vasiliades, L.; Loukas, A.; Papalexiou, S.; Koukouvinos, A.; Tsoukalas, I.; Kossieris, P. An operational method for flood directive implementation in ungauged urban areas. Hydrology 2018, 5, 24. [Google Scholar] [CrossRef]
- Angelidis, P.; Maris, F.; Kopasakis, K.; Vasileiou, A.; Kotsovinos, N. Overflow Discharges and Flooding Areas from Flood Hydrographs Routing in Arda River, Greece. Hydrology 2108, 5, 31. [Google Scholar] [CrossRef]
- Hardesty, S.; Shen, X.; Nikolopoulos, E.; Anagnostou, E. A Numerical Framework for Evaluating Flood Inundation Hazard under Different Dam Operation Scenarios—A Case Study in Naugatuck River. Water 2018, 10, 1798. [Google Scholar] [CrossRef]
- Criado, M.; Martínez-Graña, A.; San Román, J.; Santos-Francés, F. Flood risk evaluation in urban spaces: The study case of Tormes River (Salamanca, Spain). Int. J. Environ. Res. Public Health 2019, 16, 5. [Google Scholar] [CrossRef] [PubMed]
- Quiroga, V.M.; Kure, S.; Udo, K.; Mano, A. Application of 2d Numerical Simulation for the Analysis of the February 2014 Bolivian Amazonia Flood: Application of the New HEC-RAS Version 5. RIBAGUA 2016, 3, 25–33. [Google Scholar] [CrossRef]
- Bhandari, M.; Nyaupane, N.; Mote, S.R.; Kalra, A.; Ahmad, S. 2D Unsteady Flow Routing and Flood Inundation Mapping for Lower Region of Brazos River Watershed. World Environ. Water Resour. Congr. 2017, 292–303. Available online: https://doi.org/10.1061/9780784480625.027 (accessed on 30 August 2019).
- Tenzin, J.; Bhaskar, A.S. Modeling of the Precipitation Induced Flash Flood in Sarpang, Bhutan Using HEC-RAS. Rasayan J. Chem. 2017, 10, 399–406. [Google Scholar]
- Teng, J.; Jakeman, A.J.; Vaze, J.; Croke, B.F.W.; Dutta, D.; Kim, S. Flood inundation modelling: A review of methods, recent advances and uncertainty analysis. Environ. Model. Softw. 2017, 90, 201–216. [Google Scholar] [CrossRef]
- Brunner, G.W. Using HEC-RAS for Dam break studies: Hydraulic User’s Manual Version 5.0; US Army Corps of Engineers-Hydrologic Engineering Center (HEC): Davis, CA, USA, 2014. [Google Scholar]
- Alzahrani, A. Application of Two-Dimensional Hydraulic Modeling in Riverine Systems using HEC-RAS. Master’s Thesis, The School of Engineering, University of Dayton, Dayton, OH, USA, May 2017. [Google Scholar]
- Water Resources Ministry. Discharge, TDS, and Levels (Records from 2009 up to 2018); Water Resources Directorate in Basrah: Basrah, Iraq, 2018.
- Chow, Te Ven Open-Channel Hydraulics; McGraw-Hill: New York, NY, USA, 1959.
- USGS Web Site. Available online: https://earthexplorer.usgs.gov (accessed on 11 February 2017).
- Brunner, G.W. HEC-RAS River Analysis System: Hydraulic Reference Manual Version 5.0; US Army Corps of Engineers-Hydrologic Engineering Center (HEC): Davis, CA, USA, 2016. [Google Scholar]
- Krausmann, E.; Cruz, A.M.; Salzano, E. Natech Risk Assessment and Management: Reducing the Risk of Natural-Hazard Impact on Hazardous Installations; Elsevier: Amsterdam, The Netherlands, 2016; pp. 79–86. [Google Scholar]
Figure 1.
Shatt Al-Arab River and its tributaries.
Figure 2.
The main menu of HEC-RAS 5.0.3.
Figure 3.
Cross sections of the study area.
Figure 4.
Cross-section data editor for cross-section no. 1.
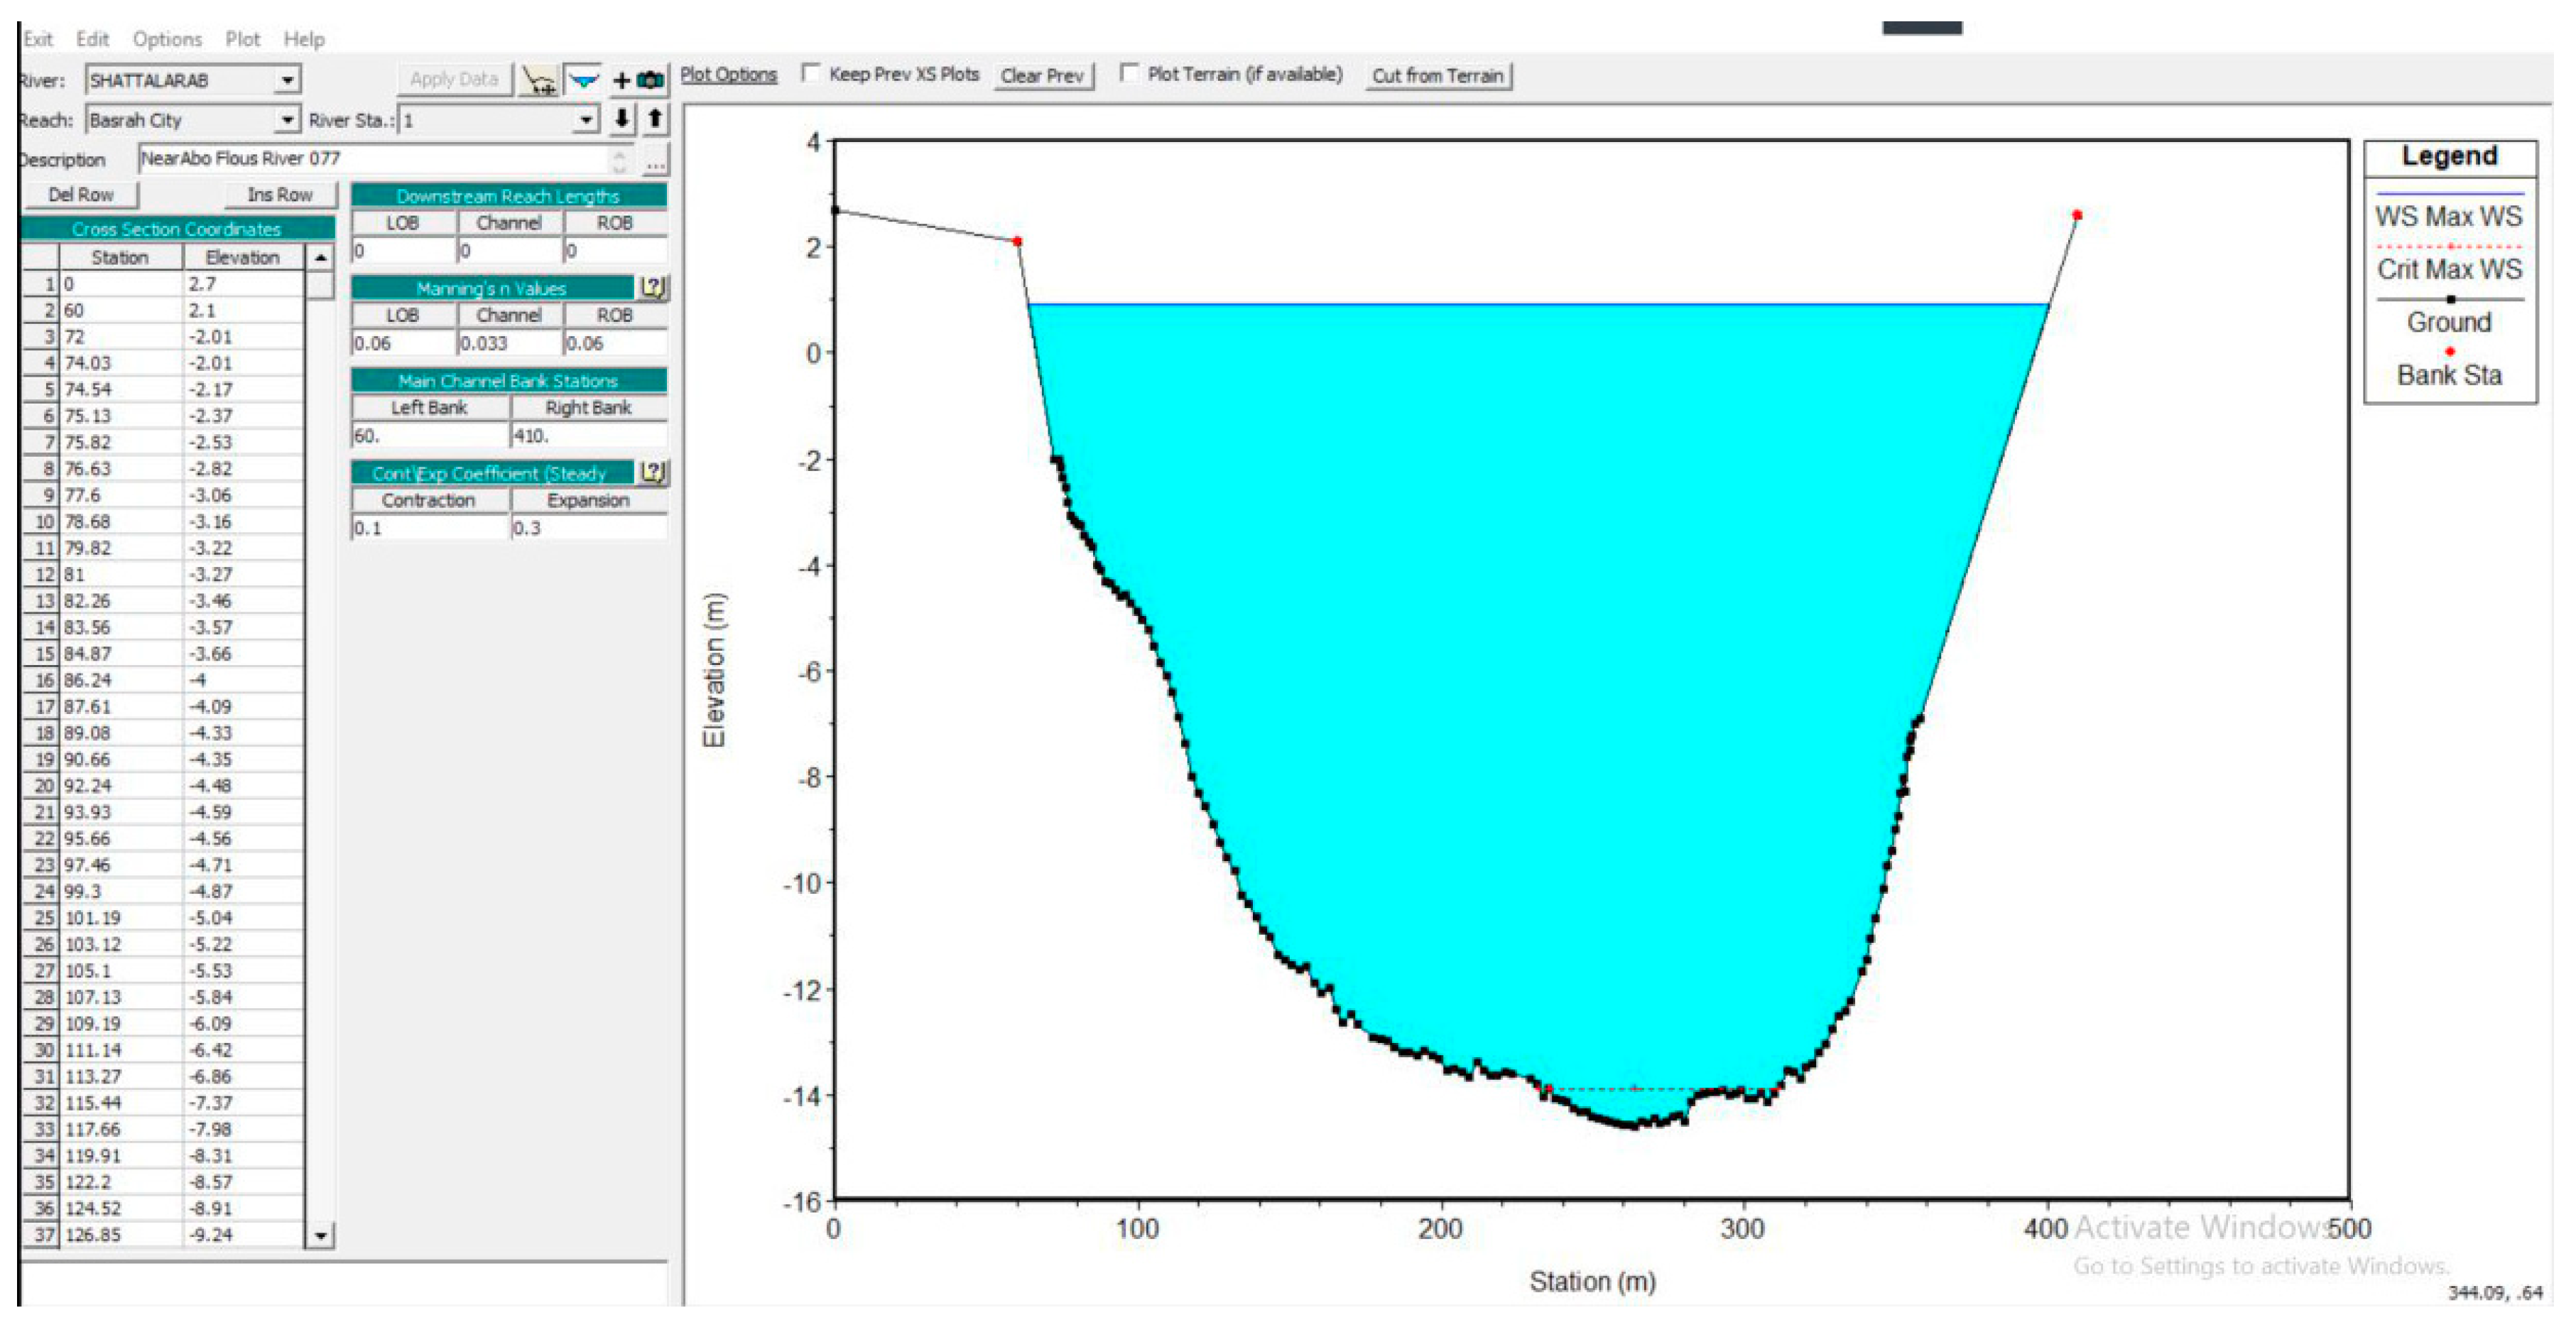
Figure 5.
Daily discharges of the Tigris River for the year 2014 [25].
Figure 5.
Daily discharges of the Tigris River for the year 2014 [25].
Figure 6.
Variation of tides (water stage) during the period from Feb to Nov 2014 [25].
Figure 6.
Variation of tides (water stage) during the period from Feb to Nov 2014 [25].
Figure 7.
DEM from United States Geological Survey (USGS )website [27].
Figure 7.
DEM from United States Geological Survey (USGS )website [27].
Figure 8.
Creating 2D flow-area polygon.

Figure 9.
Overview of the land cover of the study area (source USGS website) [27].
Figure 9.
Overview of the land cover of the study area (source USGS website) [27].
Figure 10.
Lateral structure profile.
Figure 11.
Suggested regulator location.
Figure 12.
Inline structure data.
Figure 13.
Discharge probability analysis.
Figure 14.
Model calibration comparison between computed and observed stages for the chosen Manning’s values at (a) station number 3.2 and (b) station number 55.
Figure 14.
Model calibration comparison between computed and observed stages for the chosen Manning’s values at (a) station number 3.2 and (b) station number 55.
Figure 15.
Model verification comparison between computed and observed stages for the chosen Manning’s values at (a) station number 3.2 and (b) station number 55.
Figure 15.
Model verification comparison between computed and observed stages for the chosen Manning’s values at (a) station number 3.2 and (b) station number 55.
Figure 16.
Suggested wave and real flow for the year 2014 behind the Qal’at Saleh regulator [25].
Figure 16.
Suggested wave and real flow for the year 2014 behind the Qal’at Saleh regulator [25].
Figure 17.
The stage in section no. 2.4 during the period of wave occurrence.
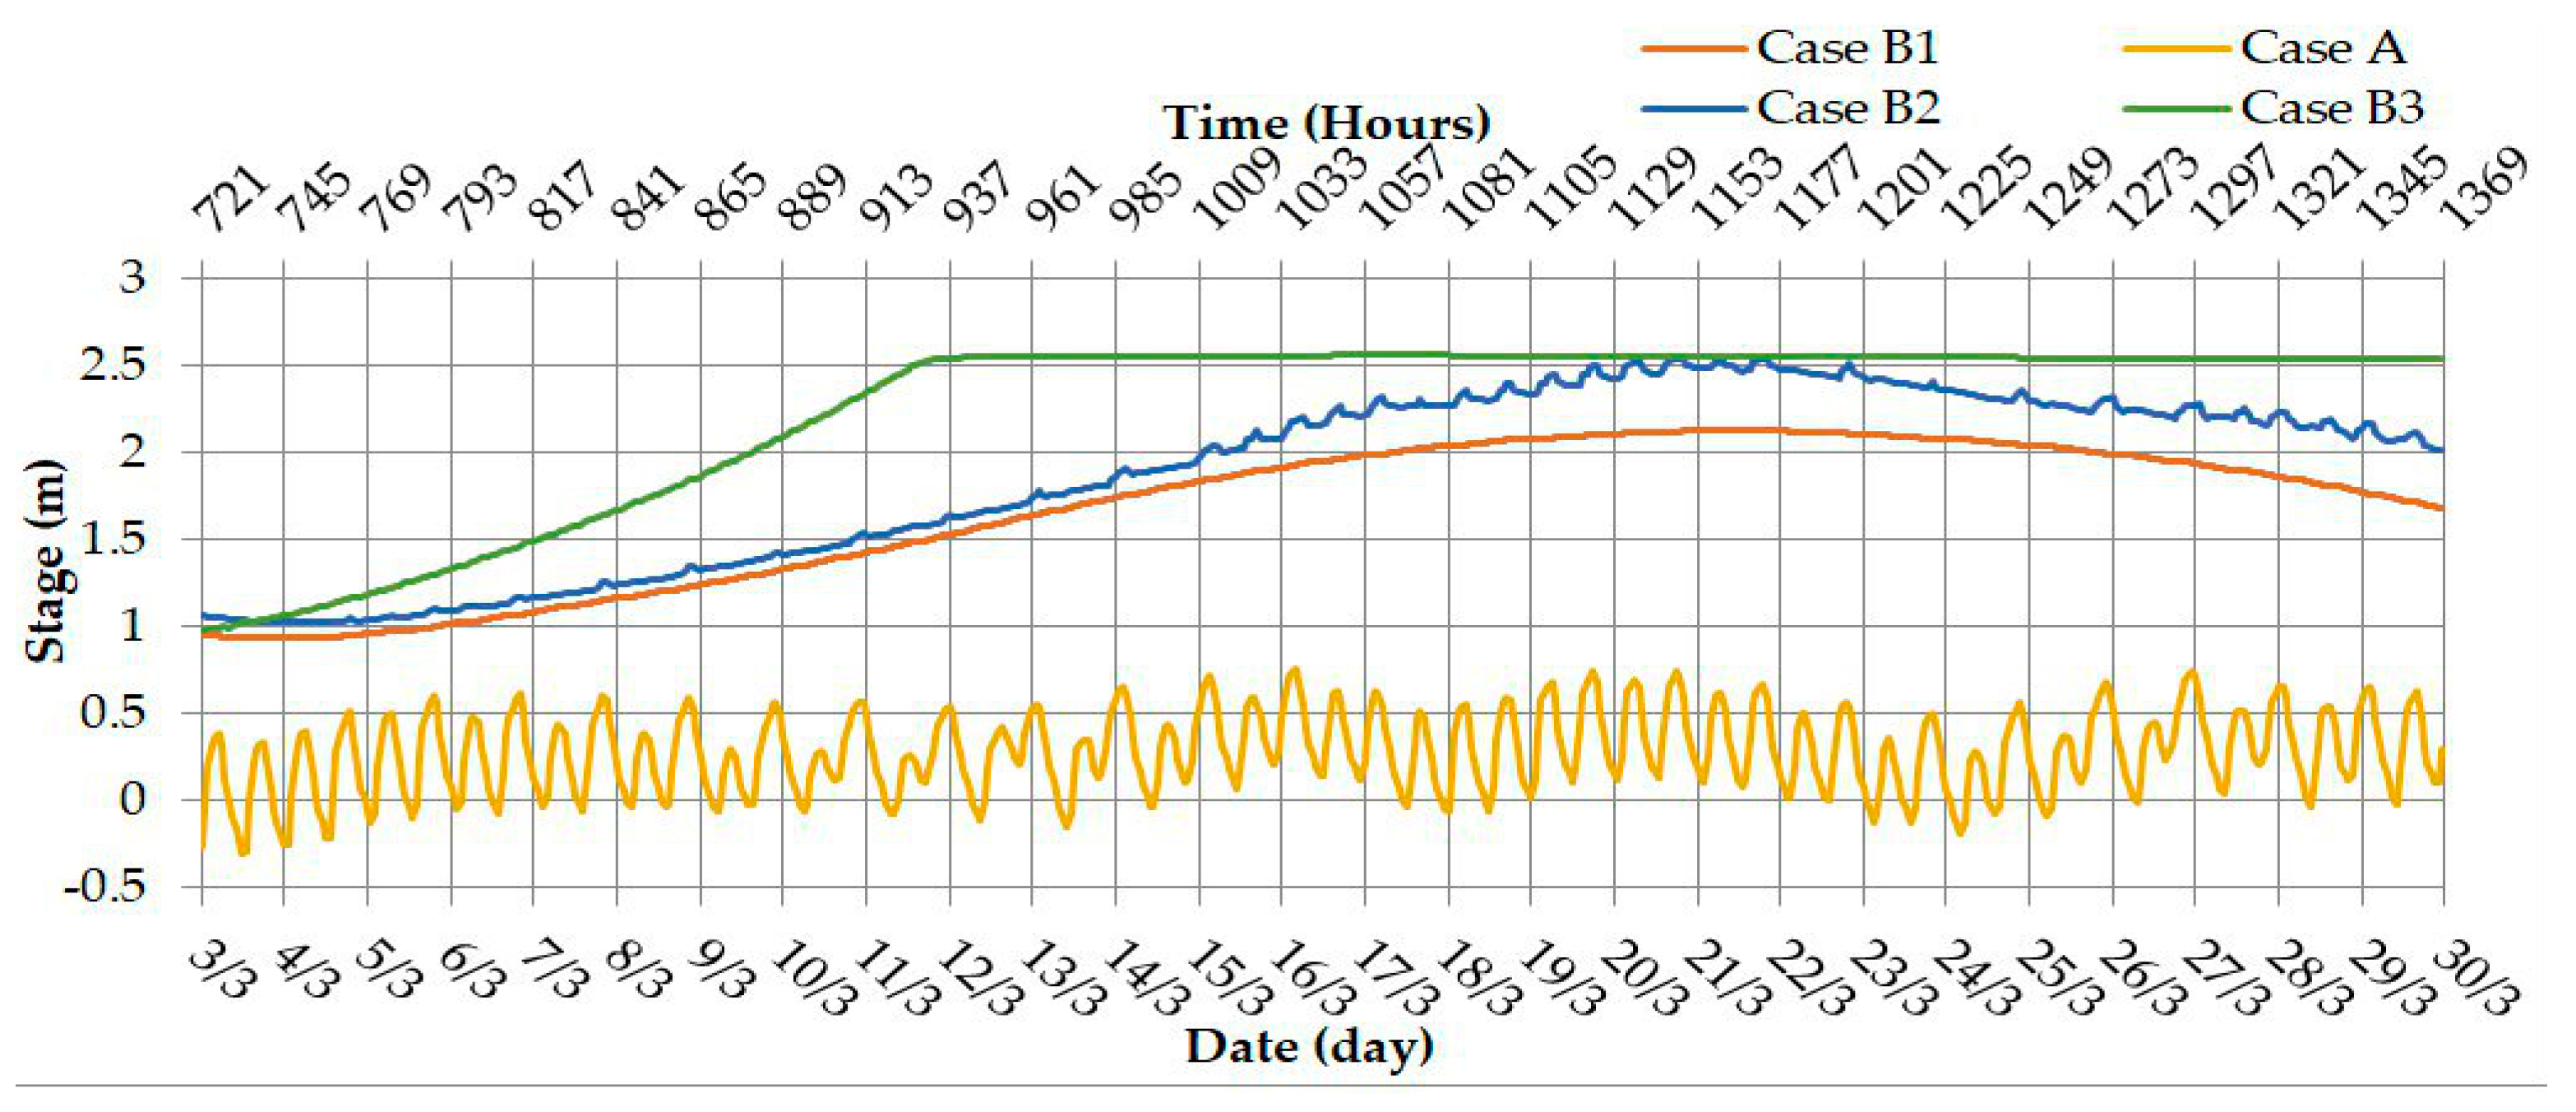
Figure 18.
The stage in section no. 65 during the period of wave occurrence.
Figure 19.
The stage in section no. 92 during the period of wave occurrence.
Figure 20.
The stage in section no. 115 during the period of wave occurrence.
Figure 21.
Flood extent generated by HEC-RAS 5.03 at the end of the wave period for case B1.
Figure 22.
Flood extent generated by HEC-RAS 5.03 at the end of the wave period for case B2.
Figure 23.
Flood extent generated by HEC-RAS 5.03 at the end of the wave period for case B3.
Figure 24.
Water level profiles for the wave of maximum flow for case B1.
Figure 25.
Water level profiles for the wave of maximum flow for case B2.
Figure 26.
Water level profiles for the wave of maximum flow for the case B3.
Figure 27.
Maximum water level profiles of the 200 m3/s wave for all considered cases.

Table 1.
Manning’s n values for each land use type [28].
Table 1.
Manning’s n values for each land use type [28].
| Land Use Classification | n |
|---|---|
| Complex cultivation systems | 0.030–0.040 |
| Pasture | 0.030–0.035 |
| Water bodies (channel) | 0.030–0.050 |
| Trees | 0.050–0.150 |
| Urban areas | 0.100–0.150 |
Table 2.
Flood hazard classification based on water depth and velocity [29].
Table 2.
Flood hazard classification based on water depth and velocity [29].
| Hazard Index | Hazard Classification | Depth (m/s) | Velocity (m/s) |
|---|---|---|---|
| 1 | Very low | ≤0.5 | ≤0.2 |
| 2 | Low | >0.5–1 | >0.2–0.5 |
| 3 | Moderate | >1–1.5 | >0.5–1.0 |
| 4 | High | >1.5 | >1.0 |
Table 3.
The floodplain of different study cases in cross-section nos. 2.4, 65, 92, and 115.
| Cross Section | Bank | Bank Level (m) | Case B1 | Case B2 | Case B3 | |||
|---|---|---|---|---|---|---|---|---|
| Max. Water Level (m) | Flood or Not | Max. Water Level (m) | Flood or Not | Max. Water Level (m) | Flood or Not | |||
| 2.4 | R | 2.5 | 2.12 | Not | 2.54 | Flood | 2.56 | Flood |
| L | 3.5 | 2.12 | Not | 2.54 | Not | 2.56 | Not | |
| 65 | R | 3.5 | 2.18 | Not | 2.57 | Not | 2.6 | Not |
| L | 3.5 | 2.18 | Not | 2.57 | Not | 2.6 | Not | |
| 92 | R | 4.5 | 3.11 | Not | 3.05 | Not | 3.14 | Not |
| L | 4.5 | 3.11 | Not | 3.05 | Not | 3.14 | Not | |
| 115 | R | 5.0 | 4.06 | Not | 4.07 | Not | 4.11 | Not |
| L | 5.0 | 4.06 | Not | 4.07 | Not | 4.11 | Not | |
Table 4.
Differences in water levels between case A and cases B1–B3 for a wave of 200 m3/s.
| Cross Section | Max. Water Level (MWL) for Each Case (m) | Differences in MWL Due to the Effect of Regulator | |||||
|---|---|---|---|---|---|---|---|
| A | B1 | B2 | B3 | B1–A | B2–A | B3–A | |
| 2.4 | 0.76 | 2.12 | 2.54 | 2.56 | 1.36 | 1.78 | 1.8 |
| 65 | 0.84 | 2.18 | 2.57 | 2.6 | 1.34 | 1.73 | 1.76 |
| 92 | 2.74 | 3.11 | 3.05 | 3.14 | 0.37 | 0.31 | 0.4 |
| 115 | 4.03 | 4.06 | 4.07 | 4.11 | 0.03 | 0.04 | 0.08 |
© 2019 by the authors. Licensee MDPI, Basel, Switzerland. This article is an open access article distributed under the terms and conditions of the Creative Commons Attribution (CC BY) license (http://creativecommons.org/licenses/by/4.0/).
Share and Cite
MDPI and ACS Style
Hamdan, A.N.A.; Abbas, A.A.; Najm, A.T. Flood Hazard Analysis of Proposed Regulator on Shatt Al-Arab River. Hydrology 2019, 6, 80. https://doi.org/10.3390/hydrology6030080
AMA Style
Hamdan ANA, Abbas AA, Najm AT. Flood Hazard Analysis of Proposed Regulator on Shatt Al-Arab River. Hydrology. 2019; 6(3):80. https://doi.org/10.3390/hydrology6030080
Chicago/Turabian StyleHamdan, Ahmed Naseh Ahmed, Abdulhussain A. Abbas, and Alauldeen T. Najm. 2019. "Flood Hazard Analysis of Proposed Regulator on Shatt Al-Arab River" Hydrology 6, no. 3: 80. https://doi.org/10.3390/hydrology6030080
Note that from the first issue of 2016, this journal uses article numbers instead of page numbers. See further details here.