1. Introduction
Llano Estacado is the major geographic feature of the Texas High plains of the USA [
1] as a mesa with a very slight increase in elevation from east to west, bounded by escarpments to the east, west and north. Surface hydrological features are unique. There are few draws that transverse the Llano Estacado and these represent the headwaters of the Red and Brazos River systems. Playa wetlands are the most common surface hydrological features of the Llano Estacado. Playas are naturally occurring, circular basins that occur in closed-system watersheds with basin floors containing a soil of higher clay content than the surrounding area [
2]. These clay soils create a basin floor that is only slightly permeable to water infiltration which allows the playa to hold water after significant rainfall events. Elevation change between the basin and the surrounding land tends to exceed 1 m [
3] and playa diameters vary greatly from a few meters to several kilometers [
4,
5]. It has been estimated that there are approximately 20,000 playas on the Llano Estacado [
6,
7].
The Llano Estacado has a semi-arid climate with average annual precipitation decreasing from 550 mm in the northeast to 330 mm in the southwest [
2]. Over 80% of the annual precipitation occurs from April through September [
8]. Potential evapotranspiration (ET) is high, typically exceeding precipitation by a factor of 2, due to high solar radiation, high daily maximum air temperatures in the summer, low humidity and high wind speeds [
9]. These climate conditions create the situation in which playas are dry most of the time [
3].
Another important hydrologic feature of the Llano Estacado is the underlying Ogallala Aquifer. The Ogallala Aquifer was formed 2–6 million years ago as water containing sediments were deposited by erosion from a western upland feature. Between 1950 and 1970, the number of acres of cropland irrigated with water from the Ogallala Aquifer increased significantly. By the 1970s, it was apparent that the depth to water was increasing in areas of intensive irrigation because withdrawals were greater than recharge. Scanlon et al. [
10] estimated rates of recharge to be less than 15 mm annually. In addition, no tritium has been found in Ogallala Aquifer water, indicating little or no recharge in the last 50 years since aboveground denotations of nuclear weapons were banned [
11].
In retrospective, low recharge of the aquifer in West Texas should have been expected for several reasons. The connection between the source of sediments and water in the western upland no longer exists and surface flows from the mountains tend to be intercepted by the Pecos River valley [
1], except in the case of the Canadian River. Second, the low rates of deep infiltration of rainfall are expected because of the high rates of potential ET [
9]. The infiltration rate of the Pullman clay loam (Fine, mixed, thermic Torrertic paleustolls) which occupies approximately 1 million ha in Texas High plains has been estimated to be less than 1 mm·h
−1 [
12,
13]. Third, there are no rivers crossing the Llano Estacado that could be a possible source of recharge to the aquifer.
The rate of drawdown of the aquifer in terms of decreases in saturated thickness has been reported to be less than that expected from estimated withdrawals [
14]. Such an observation argues in favor of greater rates of recharge. Playa wetlands are hypothesized to serve as a site of aquifer recharge [
6,
14,
15,
16,
17,
18], although the magnitude of their contribution to recharge is still a matter of debate. Gurdak and Roe [
17,
18] reviewed numerous studies and reported rates of infiltration and/or recharges rates that varied considerably among the reports and within reports. In general, infiltration and/or recharge rates tend to be higher for playas than the area between playas in those studies in which the two environments were compared.
The annulus of the playas on the Texas High plains tend to have lower clay content [
19] and therefore thought to be a more likely site for infiltration. However, Scanlon and Goldstein [
20] found significant downward movement of chloride and other tracers in the playa’s basin, indicating that the water infiltration through the basin’s high clay content soil was occurring. The debate regarding the role of the annulus and the playa basin in recharge is unresolved. Zartman et al. [
6] classified infiltration rates into two periods, initial rates and long-term rates. Initial rates of infiltration were greater varying from 2490 mm to 10 mm·min
−1. The long term rates of infiltration ranged from 9996 to 0.004 mm·min
−1.
The exact mechanism by which the playas of the Llano Estacada formed is not fully understand, but their formation occurred when the region was a short grass prairie with little or no slope. Forces thought to be involved in playa creation include: dissolution of underlying carbonates by infiltrating water and downward transport of fine grain minerals and organic matter [
15,
16]. The mechanism leading to the formation of large salt water playas of the extreme southern portion of the Llano Estacado may be distinct from those that led to the formation of fresh water playas [
21]. The environmental conditions today are quite different from those present during playa formation. In many areas of the Llano Estacado, the dominant land cover is crop land rather than rangeland [
1]. Row crop farming operations can alter the angle and the length of slope of the land draining into a playa basin. In addition, sediments being transported into the playa basin would be expected to be different in composition and quantity when the adjoining land is being farmed rather than in rangeland. Researchers [
22,
23] have hypothesized that changes in the sediment characteristics of playas basin have altered their hydrological functions. Human development (housing, roads, etc.) has altered the size and topology of watersheds contributing to numerous playas. Thus, the hydrological functions of playas on the Llano Estacado may be quite different today than in the past.
A precise understanding of the hydrology of the Llano Estacado is more important today because of changes in water policies enacted by the Texas state assembly between 1995 and 2007. One of the outcomes of these new policies was the implementation of desired future conditions (DFC) for major aquifers throughout the state in the regional water planning process. A DFC for an aquifer is a goal for the aquifer’s condition 50 years in the future. These goals can be related to the amount of water in storage or the relationship between water storage and spring outflows. For the Ogallala Aquifer, water plans submitted in September 2010 included DFC for the Ogallala Aquifer that would preserve a significant amount of the water in storage by 2060 [
24]. The law dictating the implementation of DFC also has enabled groundwater district to create rules and policies to meet these conditions. Better understanding of the hydrology of the Ogallala Aquifer will be needed to enable groundwater districts and water planning groups established future DFC and policies to meet them. This knowledge includes better information on, but not limited to, the water volume in storage, its spatial and temporal use, locations and quantity of recharge, and the relationship between water storage in playas and the recharge to the aquifer.
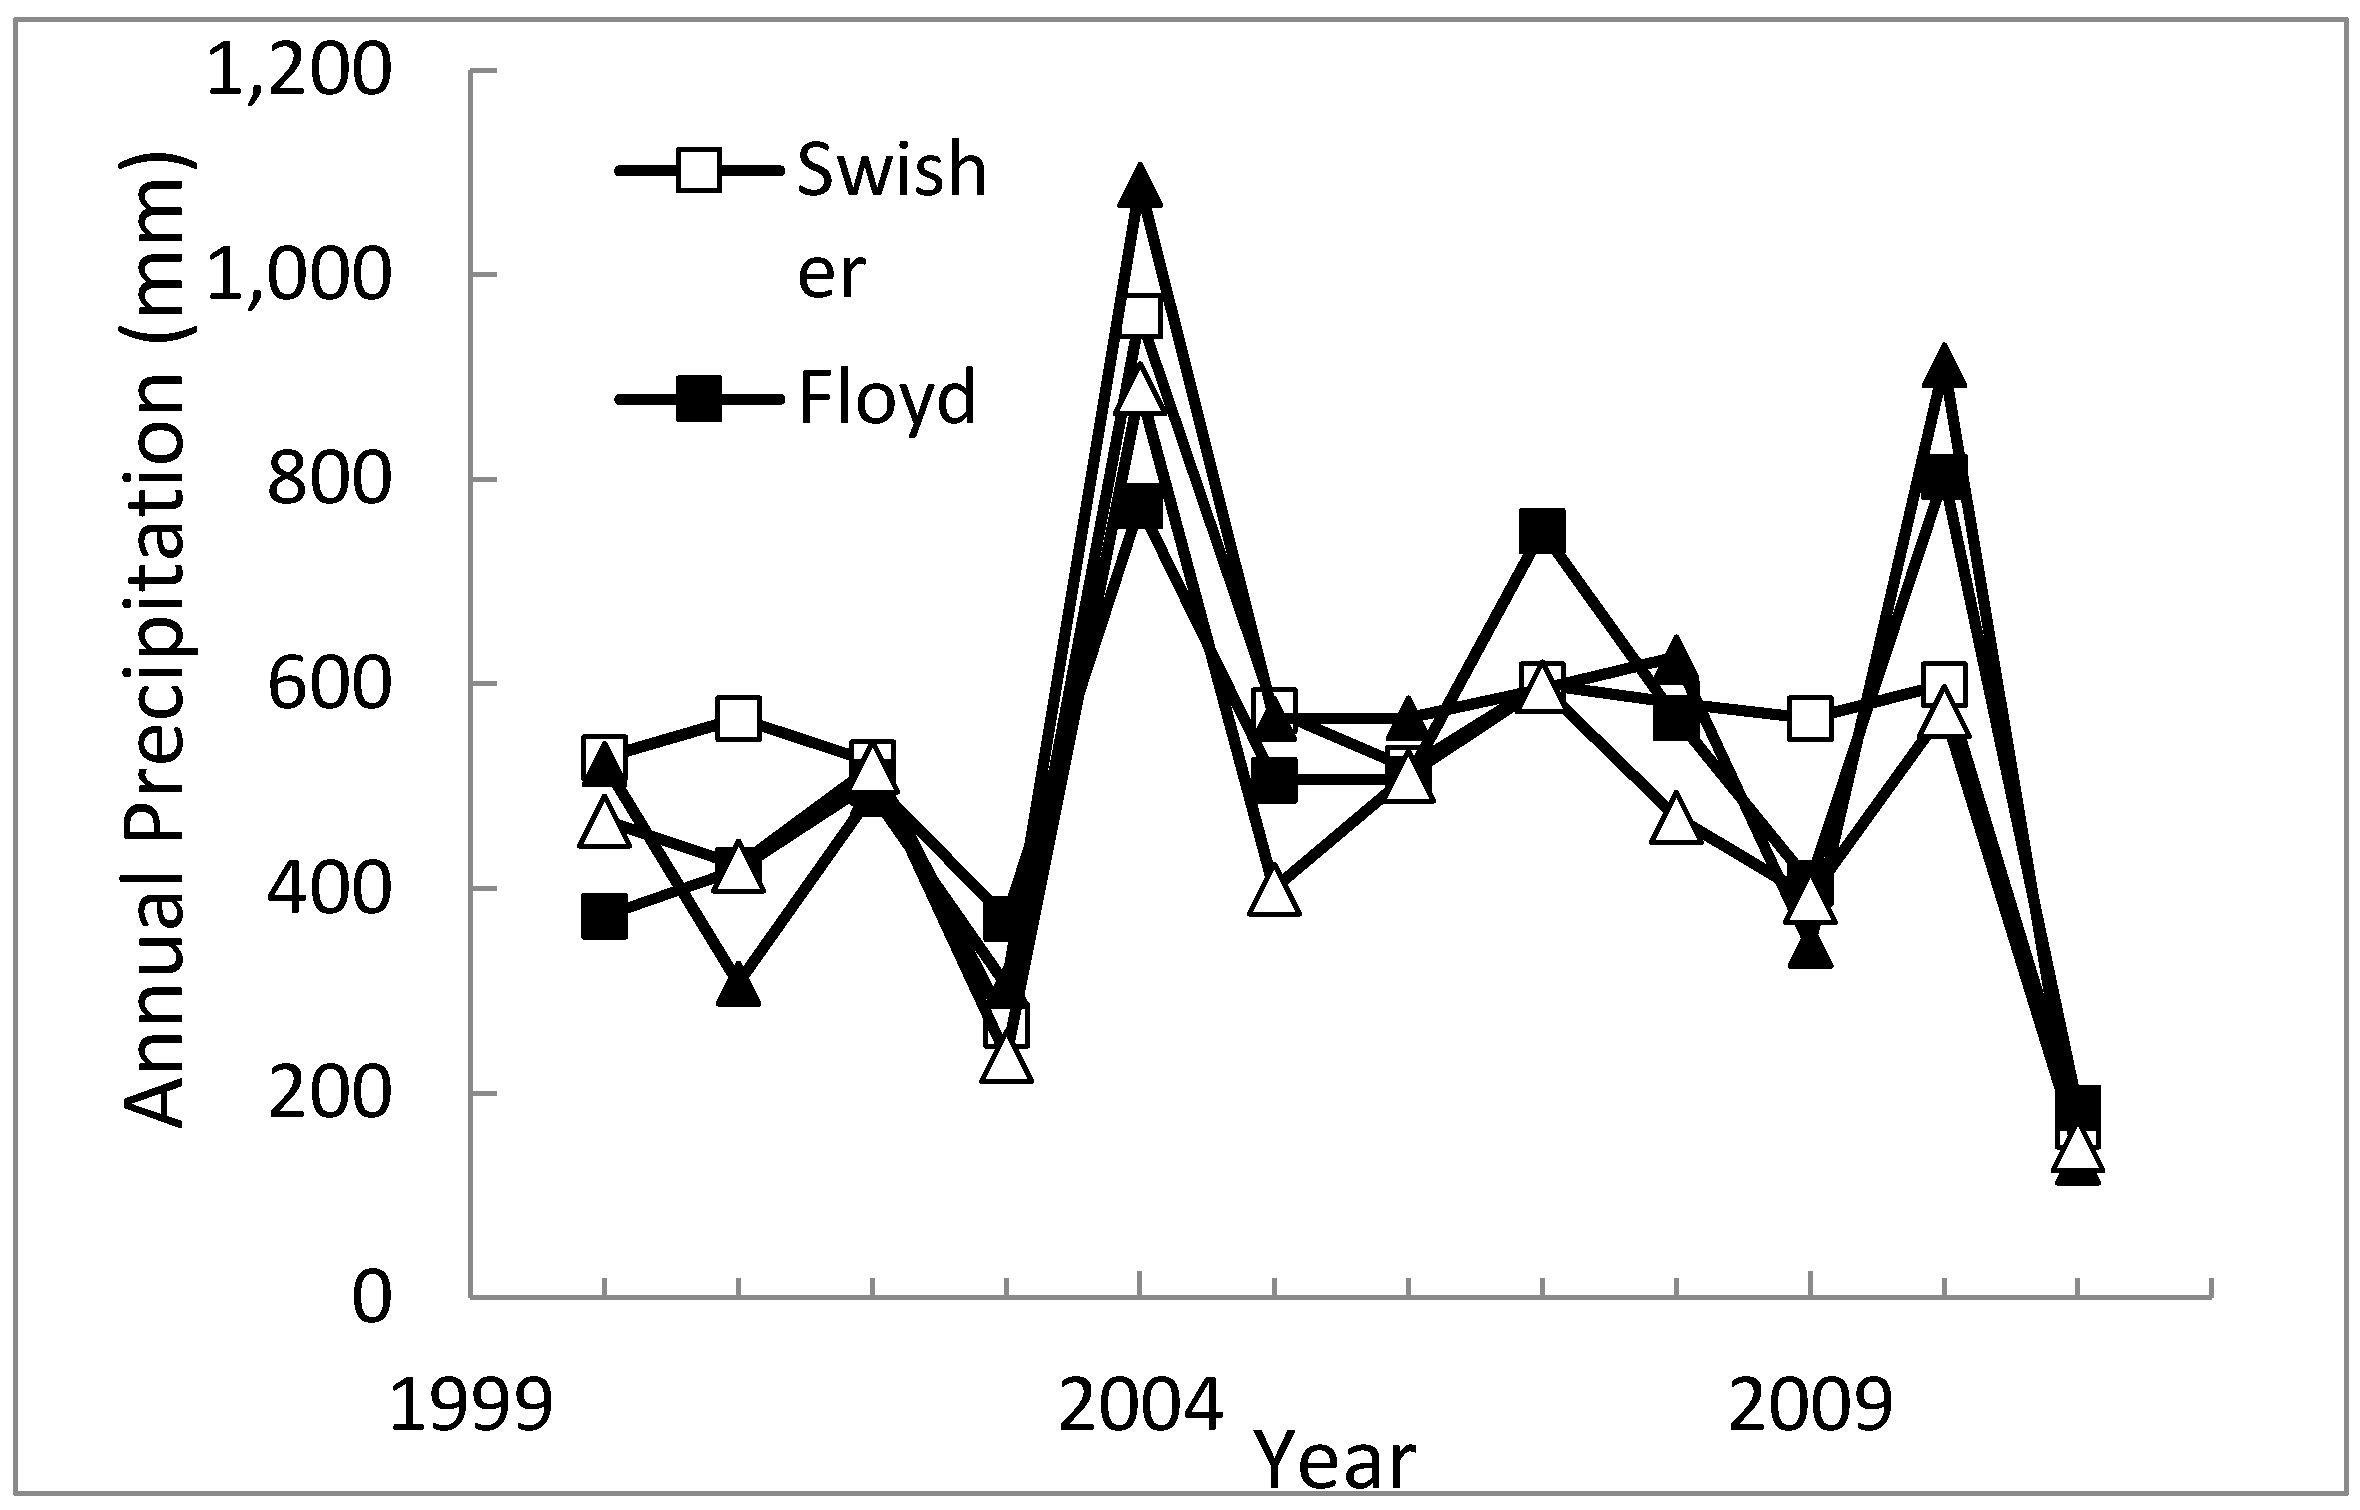
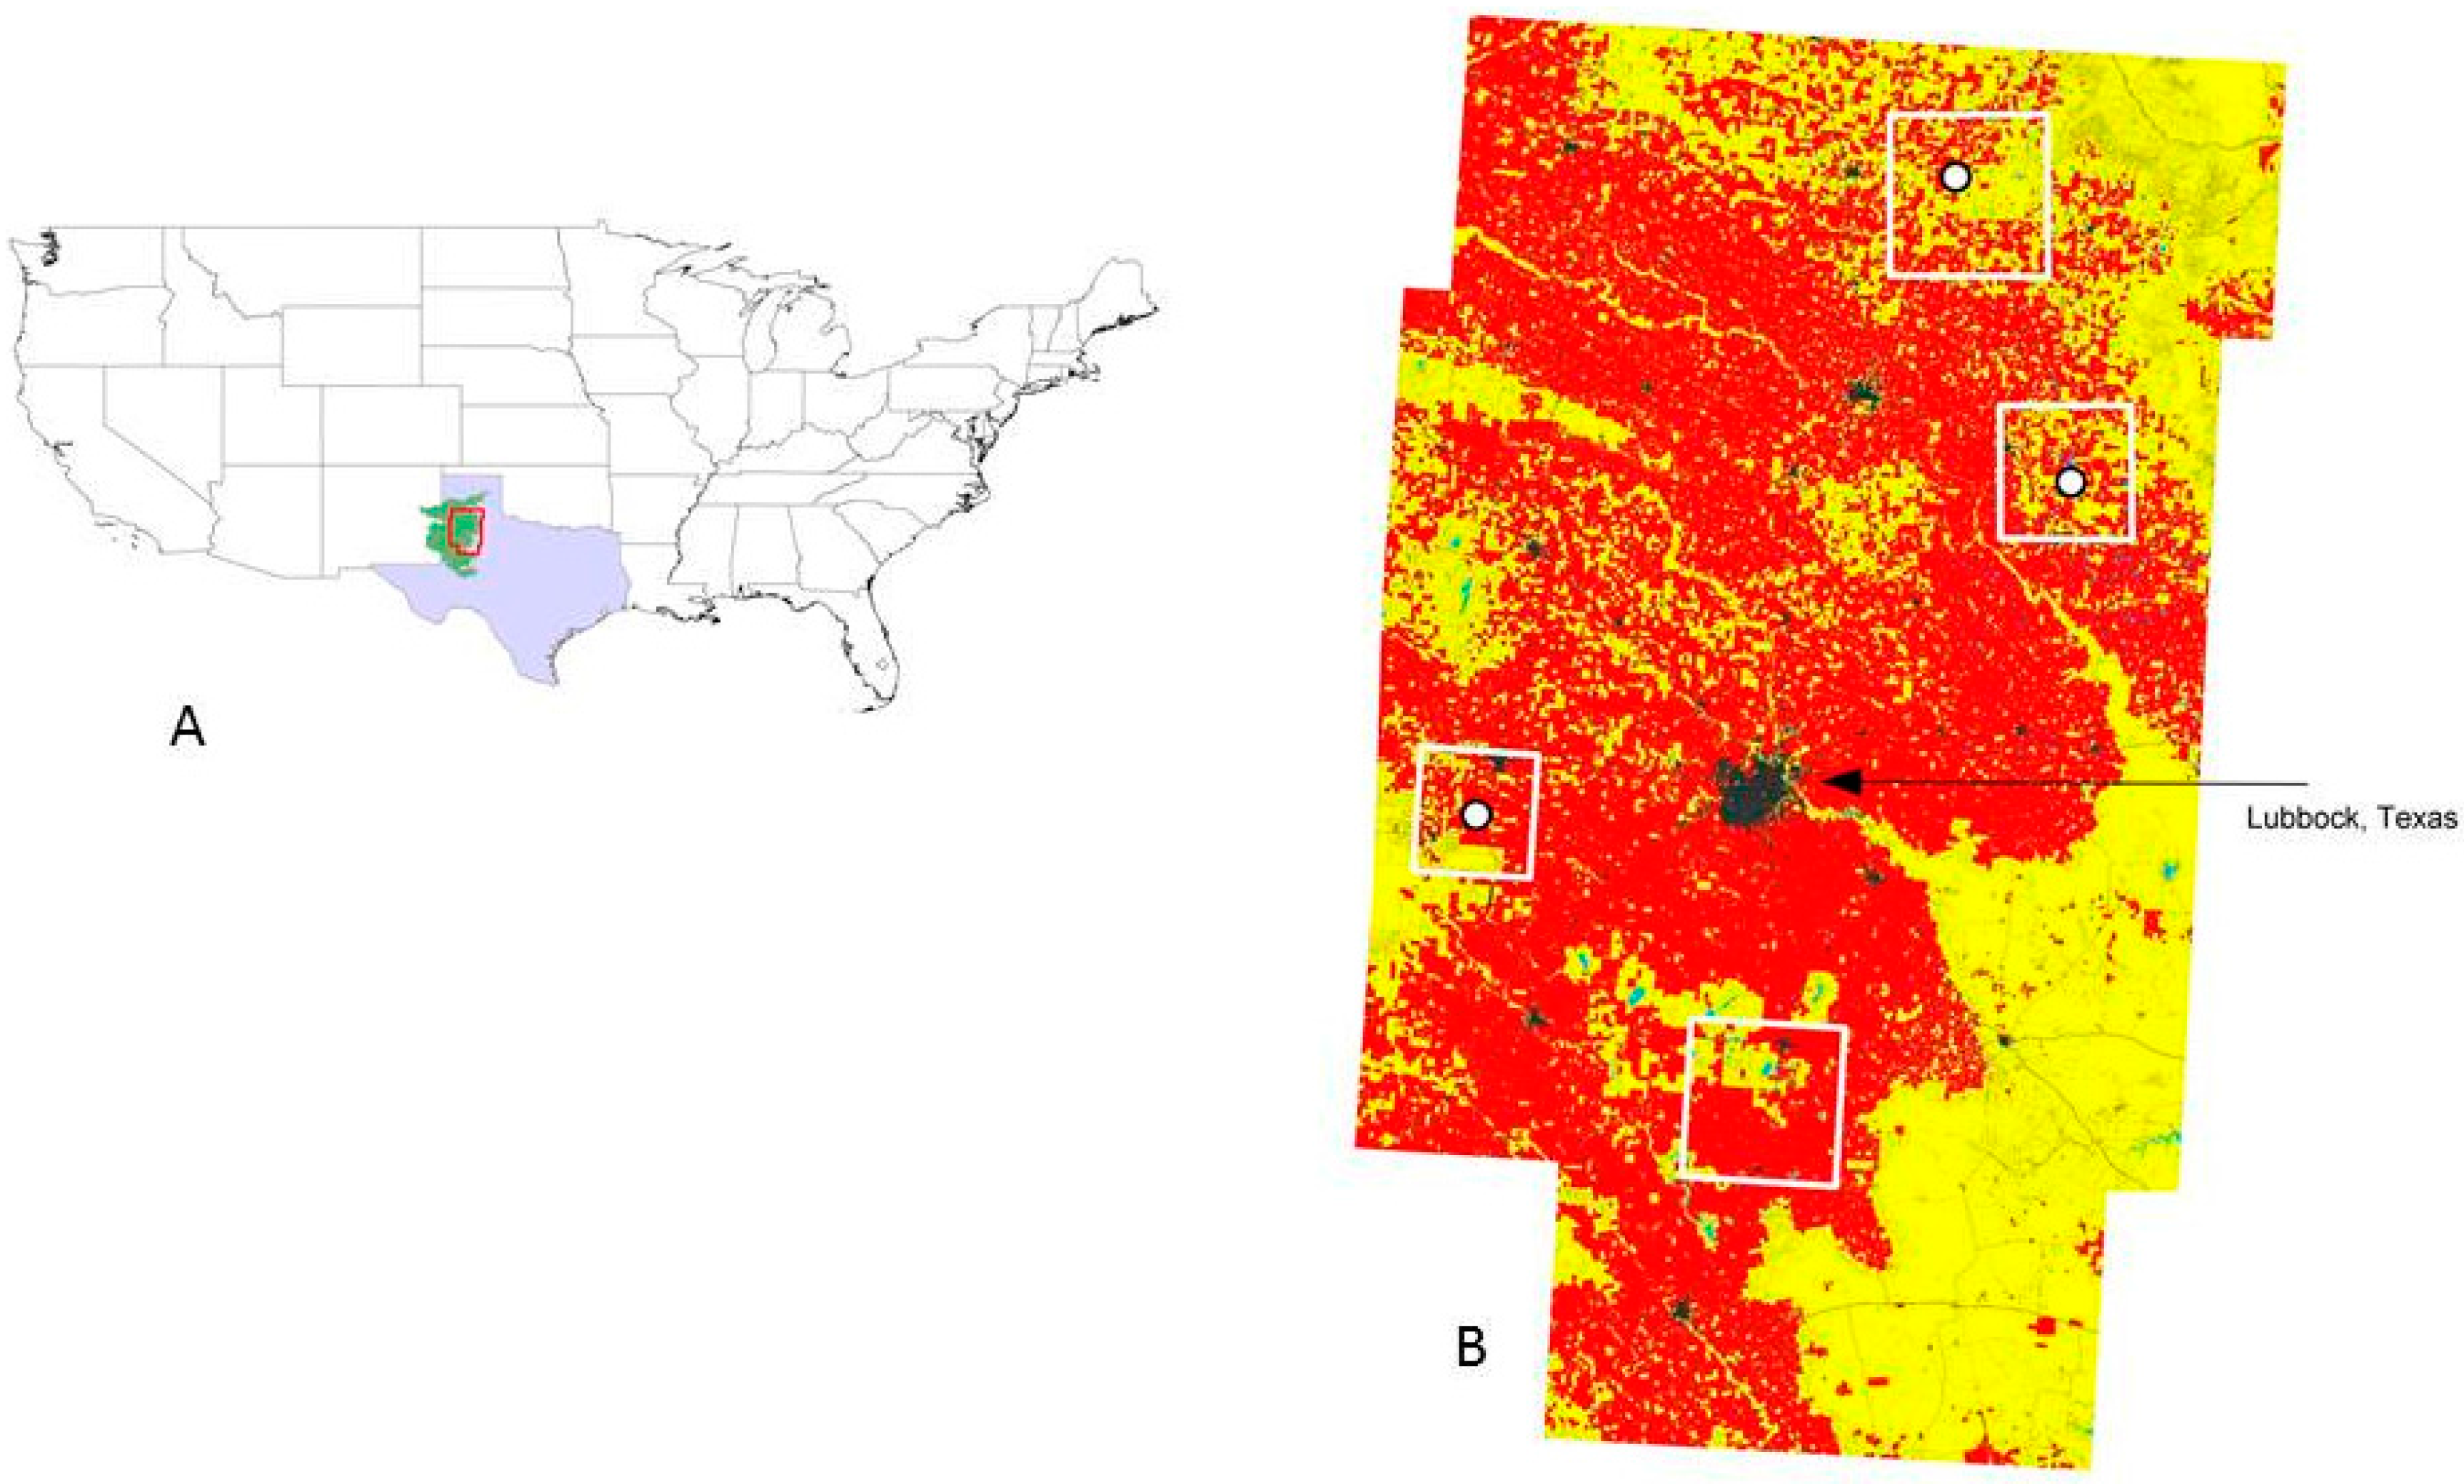
In this study, data regarding playa inundation, depth to groundwater, precipitation and land cover from 2001 to 2011 were collected and analyzed to ascertain associations between these characteristics for four areas of the Llano Estacado. Three of the study areas in Hockley, Floyd and Swisher counties were chosen because their centers had a playa containing equipment to measure weather and depth of inundation. The fourth study area was in Lynn County in an area in which recharge to the Ogallala Aquifer is suspected. Each study location occupied an area that comprised 20–30 wells in the Ogallala Aquifer that report the depth to groundwater annually. The study period, 2001–2011, included extreme variations in annual precipitation, from record setting high annual rainfall in 2004 to record setting lows during the drought of 2011. In general, there was a positive association between annual precipitation and annual change in groundwater in storage. However, annual changes in groundwater in storage were not strongly associated with the level of inundation of playas. In addition, many of the presumptive playas based on the presence of higher clay content soils and elevation change were not inundated in images obtained in late summer of 2004, a year of exceptionally high annual rainfall.
2. Study Area and Data
The overall area of investigation comprised of the 14 county regions of the Texas High plains covering a large portion of the Llano Estacado (
Figure 1). Four study areas were designated; the three study areas in Floyd, Hockley and Swisher counties were created such that the playa instrumented to collect weather and inundation data was near its center. The fourth study was in Lynn County in an area in which increases in water storage in the Ogallala Aquifer during the 2000s were suspected to have occurred. Each study area also encompassed a minimum of 20 wells with depth-to-water data from 1999 to 2012. Rainfall data were obtained for stations located at the Texas’ towns of Levelland, Tahoka, Floydada, and Silverton as a measure of precipitation in Hockley, Lynn, Floyd and Swisher county study areas, respectively [
25]. Rainfall measurements from these stations were assumed to be representative of the study area and uniform over the study area. The boundaries of the four study areas in
Figure 1 are presented in
Table 1. All geospatial data layers were projected as Albers Conical Equal Area prior to analyses. Land use in 1980, 1992, 2001 and 2006 were determined by analyses the raster files from the National Land Cover Dataset [
26] using ArcMap version 9.3 [
27]. Irrigated surface area within each study in 2004 was determined from analyses of the images downloaded from the USDA ARS Ogallala Aquifer Interactive Map Server [
7].
Sites of presumptive playas were identified by creating shapefiles of higher clay content soils and excluding those areas in which the change in elevation between the basin and surrounding area was less than 1 m [
1]. Soil maps were obtained from the NRCS Geospatial Gateway [
28]. Shapefiles of areas with higher clay content soils were produced by editing the attribute tables of downloaded files. The series of higher clay content soils varied by study area and are summarized in
Table 2.
Inundation of playas was determined using high resolution images of the study areas obtained from the National Agricultural Imaginary Program (NAIP) and downloaded from the internet [
28]. These images were routinely obtained between August and September, usually for every other year. During the study period, images were available for 2004, 2005, 2006, 2008 and 2010. NAIP images from 2004 and 2008 were selected for further analyses examining the effects of land use on inundation. These two years were selected because 2004 was high rainfall year and 2008 had annual rainfall that approximated the long term mean. For these additional analyses, the watershed adjacent to presumptive playas was approximated using the basin function in ArcHydro extensions of ArcMap [
29]. The dominant land use in each basin adjacent to presumptive playas was determined from the 2006 National Land Cover Dataset.
Depth to water data from the wells in the study areas were obtained from the Texas Water Development Board via the USDA ARS Ogallala Aquifer Interactive Map Server [
7]. Depth to-water measurements from November of one year until end of the February of the following year were used as measures of year-end levels. Depth-to-water rasters for each year were created from point files of the depth of water data using interpolation operations with the Kriging algorithm in the toolbox of ArcMap [
27]. Changes in aquifer storage were calculated by differences between annual depth-to-water rasters using the math operations in ArcMap [
27]. Regression analyses and chi-square comparisons were performed using PROC REG and FREQ, respectively [
30].
5. Discussion
Between 2001 and 2011, analyses of the depth to water from the four study areas was able to detect annual changes in the amount of groundwater in storage in the underlying Ogallala Aquifer (
Table 7). Annual changes in groundwater ranged from a decrease of approximately 116,000 m
3 of water to an increase of approximately 170,000 m
3. Annual changes in groundwater were positively correlated with the annual rainfall (
Table 8). Although the slopes of the regression equations between annual rainfall and changes in groundwater tended to be significantly different from zero, their values indicate that less than 0.04% of the annual rainfall was affecting groundwater storage.
This study was undertaken as a part of a larger series of studies to better understand the possible role of playas in changes in water storage in the Ogallala Aquifer underlying western Texas. A linchpin in these studies has been the deployment in 20 playas throughout the Llano Estacado instruments to measure inundation and local weather conditions. This study utilized data from only three of these 20 playas.
One of the critical questions was the proportion of water loss from inundated playas that was due to either ET or infiltration. Others using a mass balance approach have assigned the loss of water from playas not accounted for by potential ET as infiltration [
33,
34,
35,
36]. The loss of water in excess of potential ET from the three playas which would include substantial infiltration was occurring during the inundation events in 2006 through 2010. Apparent rates of infiltration were calculated to be 2–20 mm ·day
−1 (
Table 4). However, downward movement of soil would be greater than the loss of water because the porosity of the soil is not 100%, but some fraction. [
25]. Therefore, the maximum downward movement of the water through the playa basin soil could be as much as 40 mm·day
−1, or 15 m annually.
The above observed rates of apparent infiltration are sufficient to transport water beyond the 2 m depth that is a typical rooting zone [
25]. Once water has reached the underlying Blackwater draw and its associated caliche, the rate of infiltration should be significantly greater. Gile [
39] determined infiltration rates of underlying calcium rich horizons to be from 0.1 to approximately 150 mm·h
−1 or 130 m·year
−1. Infiltration rates of caliche have been estimated to be similar 150 mm·h
−1 or 130 m annually [
39,
40]. Therefore, it appears that the rates of infiltration through the playa soil and the underlying Blackwater Draw are sufficient for water to reach the caprock above the Ogallala Aquifer within a year.
Another aspect that needs to be evaluated to understand the potential role of playas in annual fluctuations in the depth to water for the Ogallala Aquifer is the volume of water stored in the playas. The characteristics of water storage in playas in Floyd County are presented here as being typical of the four study areas. If the levels of inundation (approximately 2 m) for the two events in 2010 (
Table 4) for the instrumented playa in the Floyd county study area reflected the general trend for that year, then 3000 ha of playa surface area (
Table 7) would contain approximately 60,000,000 m
3 of water. Similar values were obtained by converting surface area of playa inundation from the NAIP to volume using changes in elevation from digital elevation maps and assuming the volume of the playa could be approximated by half of an ellipsoid (data not shown). This volume of water would represent approximately 15% of the annual precipitation, and several times larger than the observed annual change in groundwater for the study area in 2010. These results suggest that there is sufficient water in storage in the playa lakes to affect groundwater storage.
The above analyses did not consider the impact of withdrawals on the water storage in the study areas. All four study areas are within the High Plains Underground Water District No. 1. This water district is implementing rules to restrict water pumping to a maximum of 1150 mm·ha
−1 annually [
41], a reduction from the estimated pumping rate during the study period of 1500 mm·ha
−1 annually. Using the Floyd county study as an example, there is still sufficient water in storage in playas to account for the changes in water storage in the Ogallala Aquifer. For example, in 2010, the total amount of water estimated to be in playas in August to September was 60,000,000 m
3. The change in groundwater was 9000 m
3. The amount estimated for withdrawals for irrigation was 48,000,000 m
3.
The above calculations assumed that water loss from lateral flows within the soil or the underlying Blackwater Draw was minimum. The clay content of the playa bottom soils would have a greater matrix potential, thus preventing lateral water movement to the lower clay content soils in the areas adjoining the playa. The relatively high infiltration rate of the caliche [
40] beneath the soil would encourage downward water movement over that of lateral flow.
To summarize for the Llano Estacado, there appears to be sufficient rates of water infiltration and water volume in playas to account for increases in groundwater that occurred from 2001 to 2010. Therefore, these data suggest that water stored in playas has a role in annual variations in groundwater storage and presumably recharge for the Ogallala Aquifer under the Llano Estacado.
Other results presented here indicate that not all presumptive playas, that is, areas with higher clay content and an elevation change of greater than 1 m became inundated even in 2004 when historically high annual rainfall amounts were recorded (
Table 9). A majority of the presumptive playas were not inundated in late summer in 2008, a year with near average annual rainfall. Similarly, Johnson et al. [
42] found that nearly one-third of 221 presumptive playas had no water in January from 2001 to 2010. In addition, further analyses by Johnson et al. [
42] indicated that previous year’s rainfall was an important factor determining whether or not a playa would be inundated in January.
At least two reasons could account for the lack of inundation of presumptive playas. First, the soil classification leading to an area being classified with a higher clay content soil could be inaccurate. Many of the soil series classification were based on aerial mapping techniques rather than on site evaluations. Second, the area containing the higher clay content soils or immediately adjoining area has been altered leading to a situation in which runoff no longer accumulates over the presumptive playa.
The effect of adjoining land use on playa inundation was most profoundly seen in the data from 2008. Playas adjoining cropland in three of the four study areas were significantly more likely to be inundated than playas with adjoining rangeland (
Table 9). There was no difference in the frequency of inundation in 2008 for the Swisher County study area. Differences in irrigation may have been one factor responsible for the different effect in the Swisher County study area since it had the least amount of irrigation (
Table 5). In addition, the percentage of suspected playas being inundated in Swisher County study area in 2008 was similar to that observed in the other three study areas adjoining cropland. The effect of land use adjoining the playa on the likelihood of inundation in 2004 was less, with only one study area having a significant difference in percentage of inundation (
Table 9). Since trends in the effect of land use adjoining the playa were more apparent in the year of higher annual rainfall, rainfall appeared to be a greater determinant of inundation than adjoining land use and its impact on runoff. These results are consistent with the findings of Johnson et al. [
42] in which these authors reported that previous year’s rainfall but not the fraction of the watershed in rangeland affected inundation in January.


