Article

A Combined Raindrop Aggregate Destruction Test-Settling Tube (RADT-ST) Approach to Identify the Settling Velocity of Sediment

Physical Geography and Environmental Change Research Group, Department of Environmental Sciences, University of Basel, Klingelbergstrasse 27, 4056 Basel, Switzerland
*
Author to whom correspondence should be addressed.
Hydrology 2015, 2(4), 176-192; https://doi.org/10.3390/hydrology2040176
Submission received: 3 August 2015 / Accepted: 13 October 2015 / Published: 16 October 2015

Abstract

:
The use of sediment settling velocity based on mineral grain size distribution in erosion models ignores the effects of aggregation on settling velocity. The alternative approach, wet-sieved aggregate size distribution, on the other hand, cannot represent all destructive processes that eroded soils may experience under impacting raindrops. Therefore, without considering raindrop impact, both methods may lead to biased predictions of the redistribution of sediment and associated substances across landscapes. Rainfall simulation is an effective way to simulate natural raindrop impact under controlled laboratory conditions. However, very few methods have been developed to integrate rainfall simulation with the settling velocity of eroded sediment. This study aims to develop a new proxy, based on rainfall simulation, in order to identify the actual settling velocity distribution of aggregated sediment. A combined Raindrop Aggregate Destruction Test-Settling Tube (RADT-ST) approach was developed to (1) simulate aggregate destruction under a series of simulated rainfalls; and (2) measure the actual settling velocity distribution of destroyed aggregates. Mean Weight Settling Velocity (MWSV) of aggregates was used to investigate settling behaviors of different soils as rainfall kinetic energy increased. The results show the settling velocity of silt-rich raindrop impacted aggregates is likely to be underestimated by at least six times if based on mineral grain size distribution. The RADT-ST designed in this study effectively captures the effects of aggregation on settling behavior. The settling velocity distribution should be regarded as an evolving, rather than steady state parameter during erosion events. The combined RADT-ST approach is able to generate the quasi-natural sediment under controlled simulated rainfall conditions and is adequately sensitive to measure actual settling velocities of differently aggregated soils. This combined approach provides an effective tool to improve the parameterization of settling velocity input for erosion models.

1. Introduction

1.1. Soil Erosion and Sediment Settling Velocity

Soil erosion represents a major environmental and agricultural problem worldwide [1,2,3,4]. On the one hand, soil erosion has significant on-site effects on agricultural land, e.g., by destroying the substrate for plant growth, or at least reducing the effective rooting depth, and thus water supply and soil fertility [5,6,7]. On the other hand, sediment transported to watercourses has tremendous off-site effects with respects to stream degradation, disturbance to wildlife habitat, and direct cost for dredging, levee maintenance, and loss of reservoir storages capacity [8,9,10,11,12,13,14]. Moreover, given that a large amount of C, N, and P is eroded and redistributed across landscapes, the potential effects of soil erosion on biogeochemical cycling and consequently on global climate change, has also drawn increasing attention [15,16,17,18,19]. However, the redistribution of eroded sediment as well as associated substances across landscapes is far from fully understood, and has largely impeded making an accurate estimation of the environmental impacts of soil erosion [18,19,20,21,22]. Improving our understanding of soil erosion and its impact on environment sustainability therefore requires a better understanding of the behavior of eroded soil as sediment during transport and deposition across agricultural landscapes [18,20,23].
The redistribution of sediment and associated substances across landscapes is determined by the transport distances of differently-sized sediment fractions [24,25]. Numerical models based on sediment transport distance have already contributed to improve our understanding of sediment redistribution [26,27,28,29]. However, the quality of the output depends highly on the quality of the input parameters, i.e., the “gigo” (“garbage in = garbage out”) principle. Among those parameters, settling velocity is a key factor in determining the transport distance of eroded particles in a given flow regime [24,30,31,32,33]: fast-settling fractions would be transported only short distances and preferentially deposited across landscapes, whereas slow-settling fractions would remain suspended in runoff and thus be more likely to be transported further and possibly to aquatic systems [18,34,35,36]. Improving the information on settling velocity of sediment in existing erosion models, as an advanced erodibility index, is therefore critical to understand the spatial redistribution of sediment and associated substances [21,37,38,39,40,41,42].

1.2. Parametrization of Settling Velocity

Settling velocity distributions based on dispersed mineral grains have been used in some erosion models to predict the redistribution of sediment and associated substances across landscapes (e.g., [29,43,44]). However, soil is not often eroded as individual mineral grains, but is mobilized mostly in the form of aggregates [36,45]. Aggregation increases effective particle size, but the settling velocity of a single mineral grain is also different from that of an aggregate of the same size, due to differences in its shape and density [27,46]. Using settling velocities based on mineral grain size distribution in erosion models therefore carries the risk of generating erroneous transport distance data. Alternatively, settling velocities can be calculated based on wet-sieved aggregate size distribution (e.g., [47]). However, wet-sieving fractionation cannot represent all processes of aggregate breakdown (e.g., mechanical breakdown, slaking, dispersion and liquefaction under raindrop impact) in the same way as experienced during natural rainfall [48,49]. Moreover, aggregate size distribution derived from wet-sieving fractionation ignores the potential influence of porosity, irregular shape, and the involvement of organic matter, and thus cannot accurately reflect the settling behavior of aggregates [27]. Furthermore, the inadequate representation of the actual settling behavior of aggregates in current soil erosion models may lead to a biased estimation on the redistribution of substances (e.g., C and P) associated with those aggregates. For instance, in current erosion investigations, soil organic carbon (SOC) erosion modeling is based on the assumption that SOC distributes uniformly across mineral grain (e.g., Revised Universal Soil Loss Equation (RUSLE) [50]), or aggregate size classes [51]. Hence, SOC erosion risk is often assessed by coupling the average SOC concentration of surface soil with mineral grain or aggregate size re-distribution [22]. However, SOC concentrations often differ among aggregate fractions in the soil matrix and thus also in eroded sediment, generating a settling velocity specific SOC distribution [30]. Therefore, disregarding the effects of aggregation on sediment settling velocity and associated SOC can lead to a biased estimation of SOC redistribution along sediment pathways after erosion.
To investigate the effects of aggregation on the spatial distribution of eroded soil and SOC across landscapes, sampling sediments (aggregated or not aggregated) in the field and studying their settling velocity distributions would provide the ideal input into soil erosion models. However, sediment composition and thus its settling velocity distribution also vary as erosion events proceed. Therefore, sampling sediment during and after natural rainfall events is not feasible to assess the risks associated with ignoring aggregation on sediment transport. As an alternative, rainfall simulation on micro-plot scale is a method widely used to systematically assess the generation of overland flow and sediment as well as to provide basic data for soil erosion modeling [52,53,54,55,56]. For example, Hu and Kuhn [30] used a settling tube apparatus to fractionate the aggregated silty loam eroded from a 150 cm × 80 cm flume after simulated rainfall events. From this, they predicted the potential transport distances of eroded sediment based on the settling behavior of the eroded soil fractions after crust formation. However, laboratory tests with flumes, even if well-designed to cover a wide range of rainfall conditions, still represent far too much work to be able to test all soils under all scenarios. Therefore, it is crucial to develop a simple, but efficient proxy method to: (1) generate natural or quasi-natural sediment under laboratory rainfall simulation; (2) provide sufficiently accurate settling velocity information of various soil types for erosion models with least effort input; and (3) use the settling velocity specific SOC distribution data to improve SOC erosion risk assessment.

2. The Design of RADT-ST Method

2.1. Experimental Rationale

An ideal settling velocity measurement of eroded sediment should involve quasi-natural destruction processes of aggregates followed by a settling velocity measurement, but avoiding any modification of sediment size distribution by selective deposition. To generate such sediments, a Raindrop Aggregate Destruction Test (RADT) (Figure 1a) can be used to simulate the physical process when aggregates are subject to direct raindrop impact under simulated rainfall events. Those raindrop impacted aggregates can then be fractionated by a settling tube (ST) apparatus (Figure 1b,c) according to their settling velocities. While the combined RADT-ST (Figure 2) is not designed to investigate soil erosion processes per se, it can capture the destructive effects of raindrop impact on aggregates and determine the actual settling behaviors of destroyed aggregates. The efficiency of the RADT-ST method to reflect the actual settling behavior of those raindrop destroyed aggregates can be evaluated by comparing the settling velocity distributions of those aggregates with that calculated from mineral grain size distributions and sediment eroded from an erosion plot (e.g., the flume in Hu and Kuhn [30]). The sensitivity of this method can be further examined by comparing the settling behaviors of soils with different degrees of aggregation in response to increasing cumulative raindrop kinetic energy. The effects of aggregation on the transport distance of sediment associated SOC can be evaluated by comparing the SOC distributions across destroyed aggregate fractions with that across mineral grain fractions. In this study, the use of a combined RADT-ST approach to generate such information on sediment is illustrated.
Figure 1. The sketch of the raindrop aggregate destruction test (RADT) used in this study (a); injection device (b); and settling tube (ST) apparatus (c) developed by Hu et al. [57]. All measurements given in mm.
Hydrology 02 00176 g001
Figure 2. Experimental setup adopted in this study: (a) raindrop aggregate destruction test (RADT) test; (b) start of the settling tube (ST) test; (c) sample collection of each sediment fraction; and (d) transfer of samples from the turntable to beakers.
Hydrology 02 00176 g002

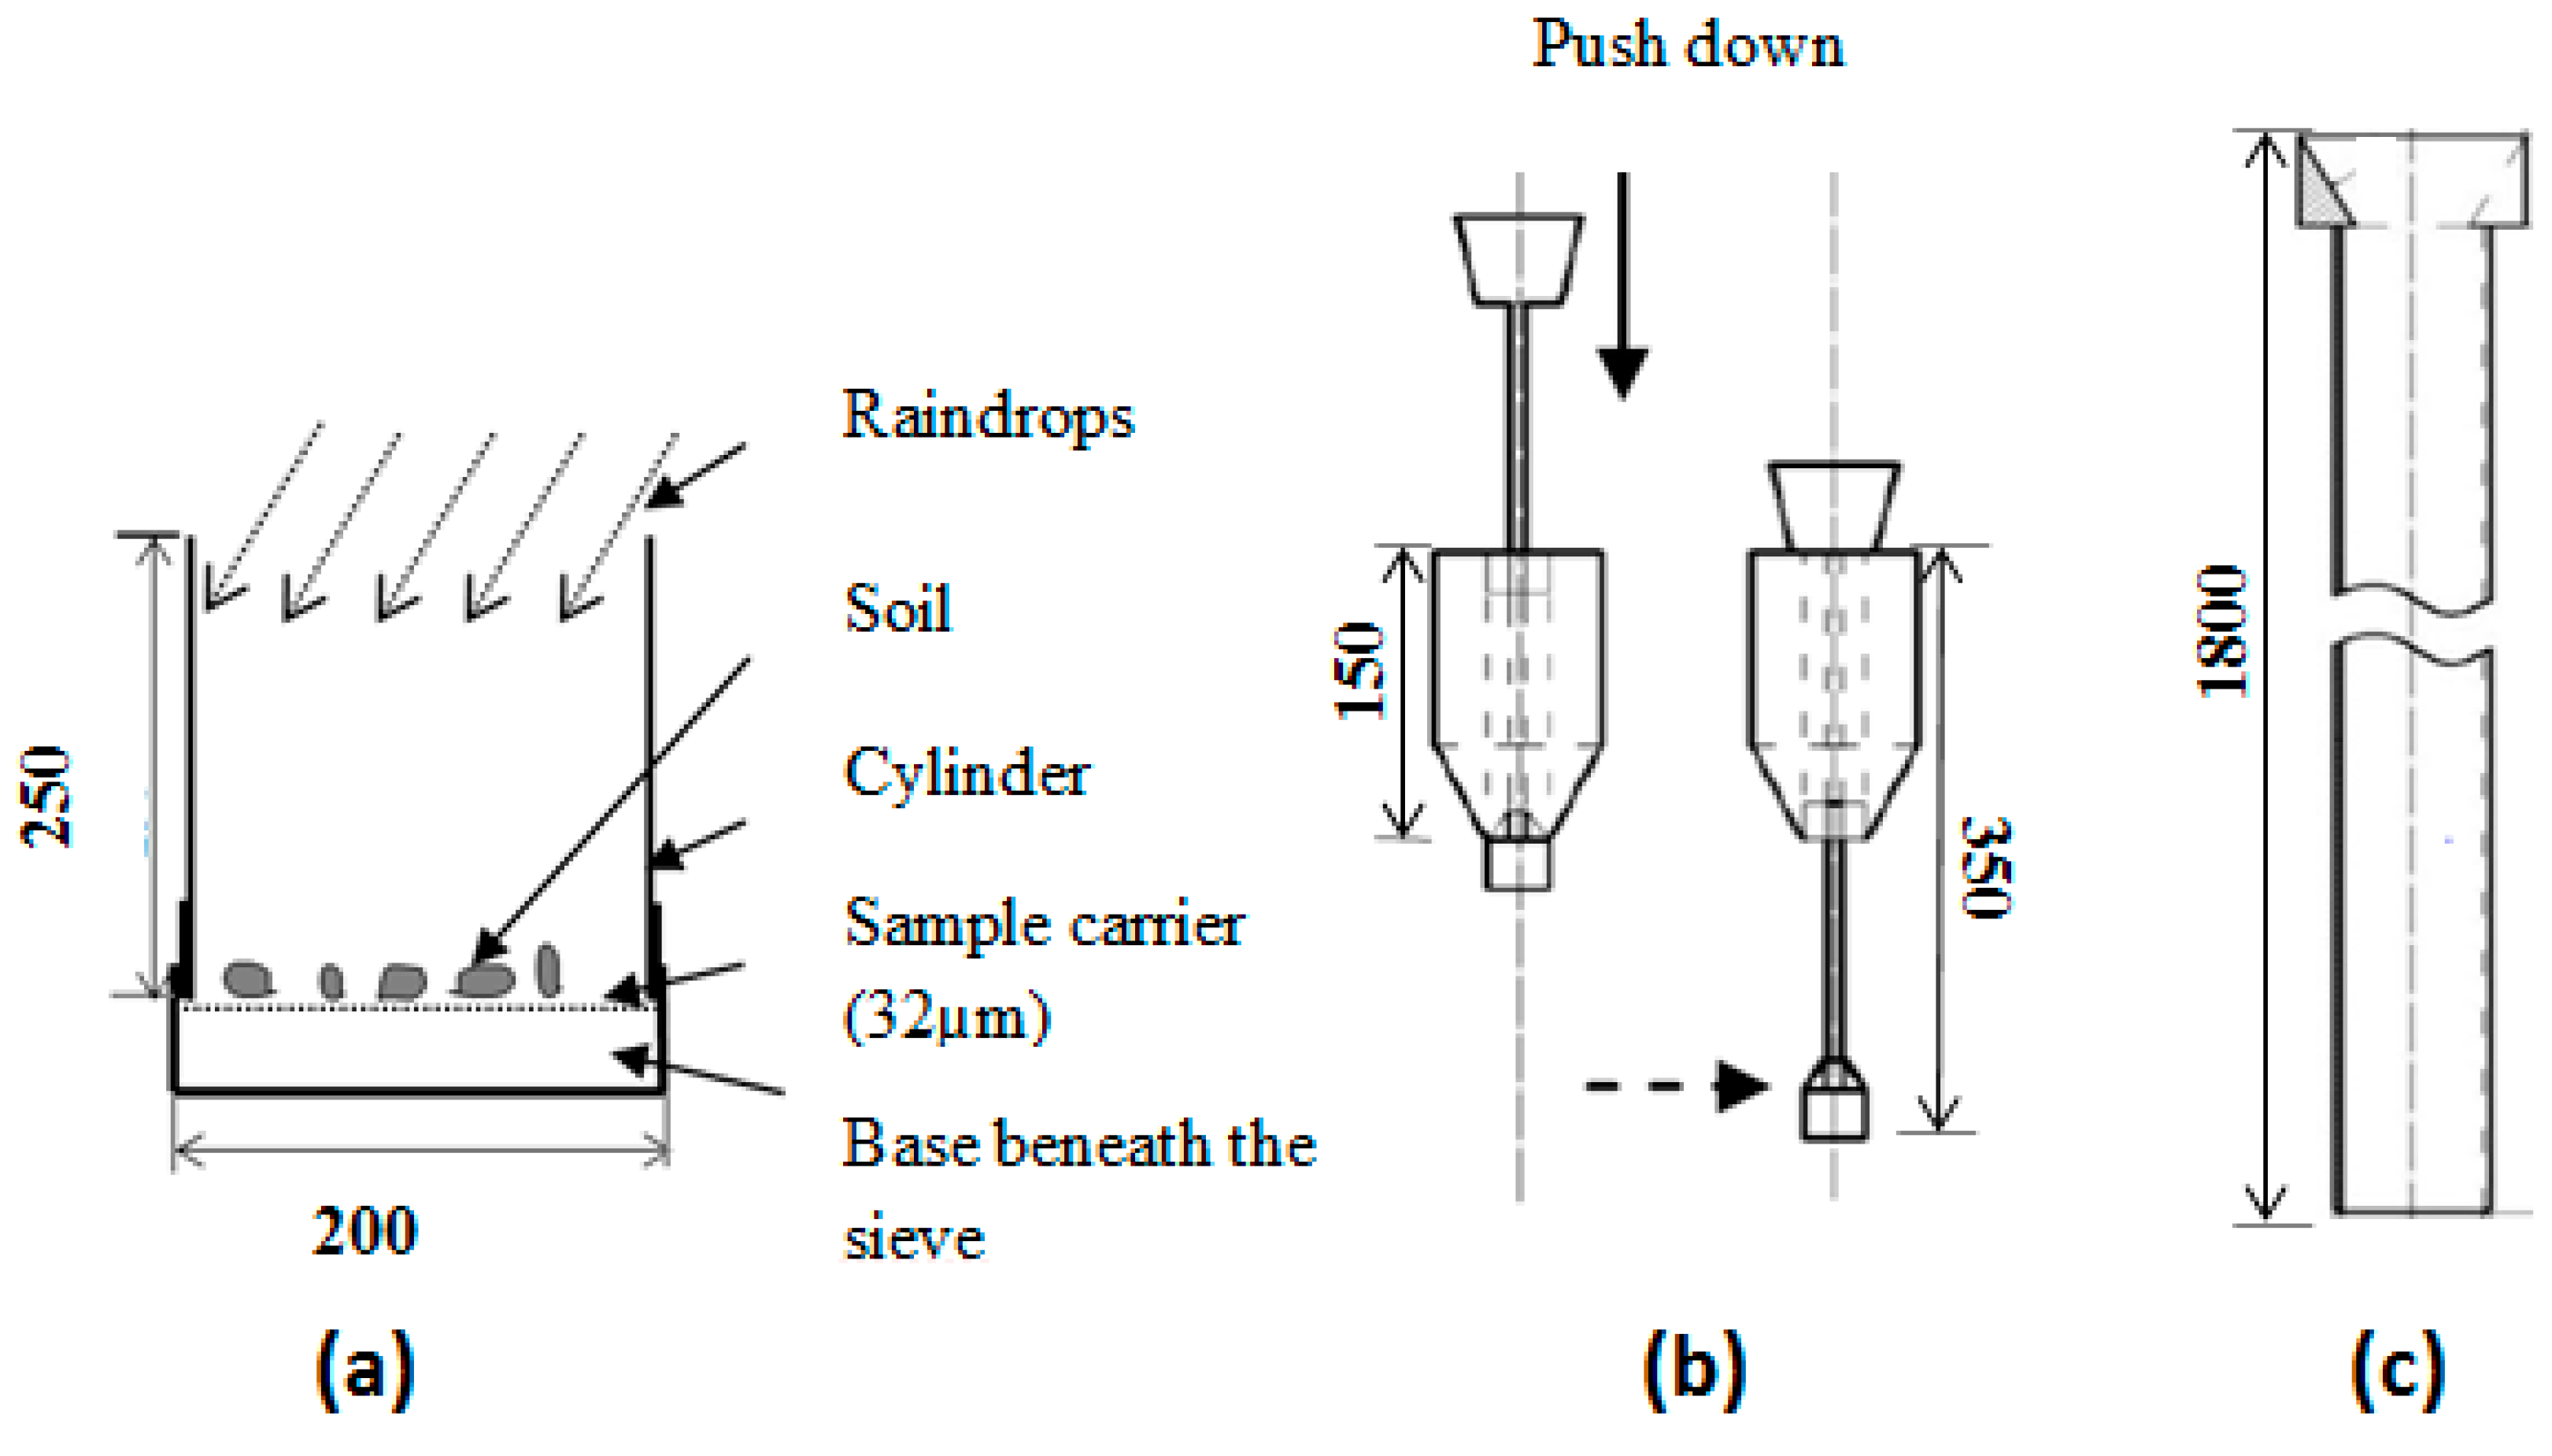
2.2. Raindrop Aggregate Destruction Test (RADT)

The RADT developed in this study consists of three parts (Figure 1 and Figure 2):
(1)
A sample carrier consisting of a 32-µm sieve to hold the dry soil samples prior to raindrop impact, and to collect aggregates surviving raindrop impact. The sieve can be uniformly covered by 25 g of soil, generating sufficient material to perform a settling tube fractionation. The sieve also allows a slow, but free drainage of water. This design ensures that a certain degree of ponding occurs, which resembles natural raindrop-impacted flow conditions [30], and prevents accumulation of surface water from forming a film, which attenuates the effect of raindrop kinetic energy on the soil surface [58,59].
(2)
A base beneath the sample carrier to collect fine particles and redundant water passing through the sieve.
(3)
A 25 cm tall cylinder embracing the sample carrier (the cylinder is 20 cm taller than the surface of the carrier). With this design, splashed particles can be caught on the sidewalls of the RADT and washed back to the base by rainwater, so that the RADT can capture all the sediment generated by raindrop impact.

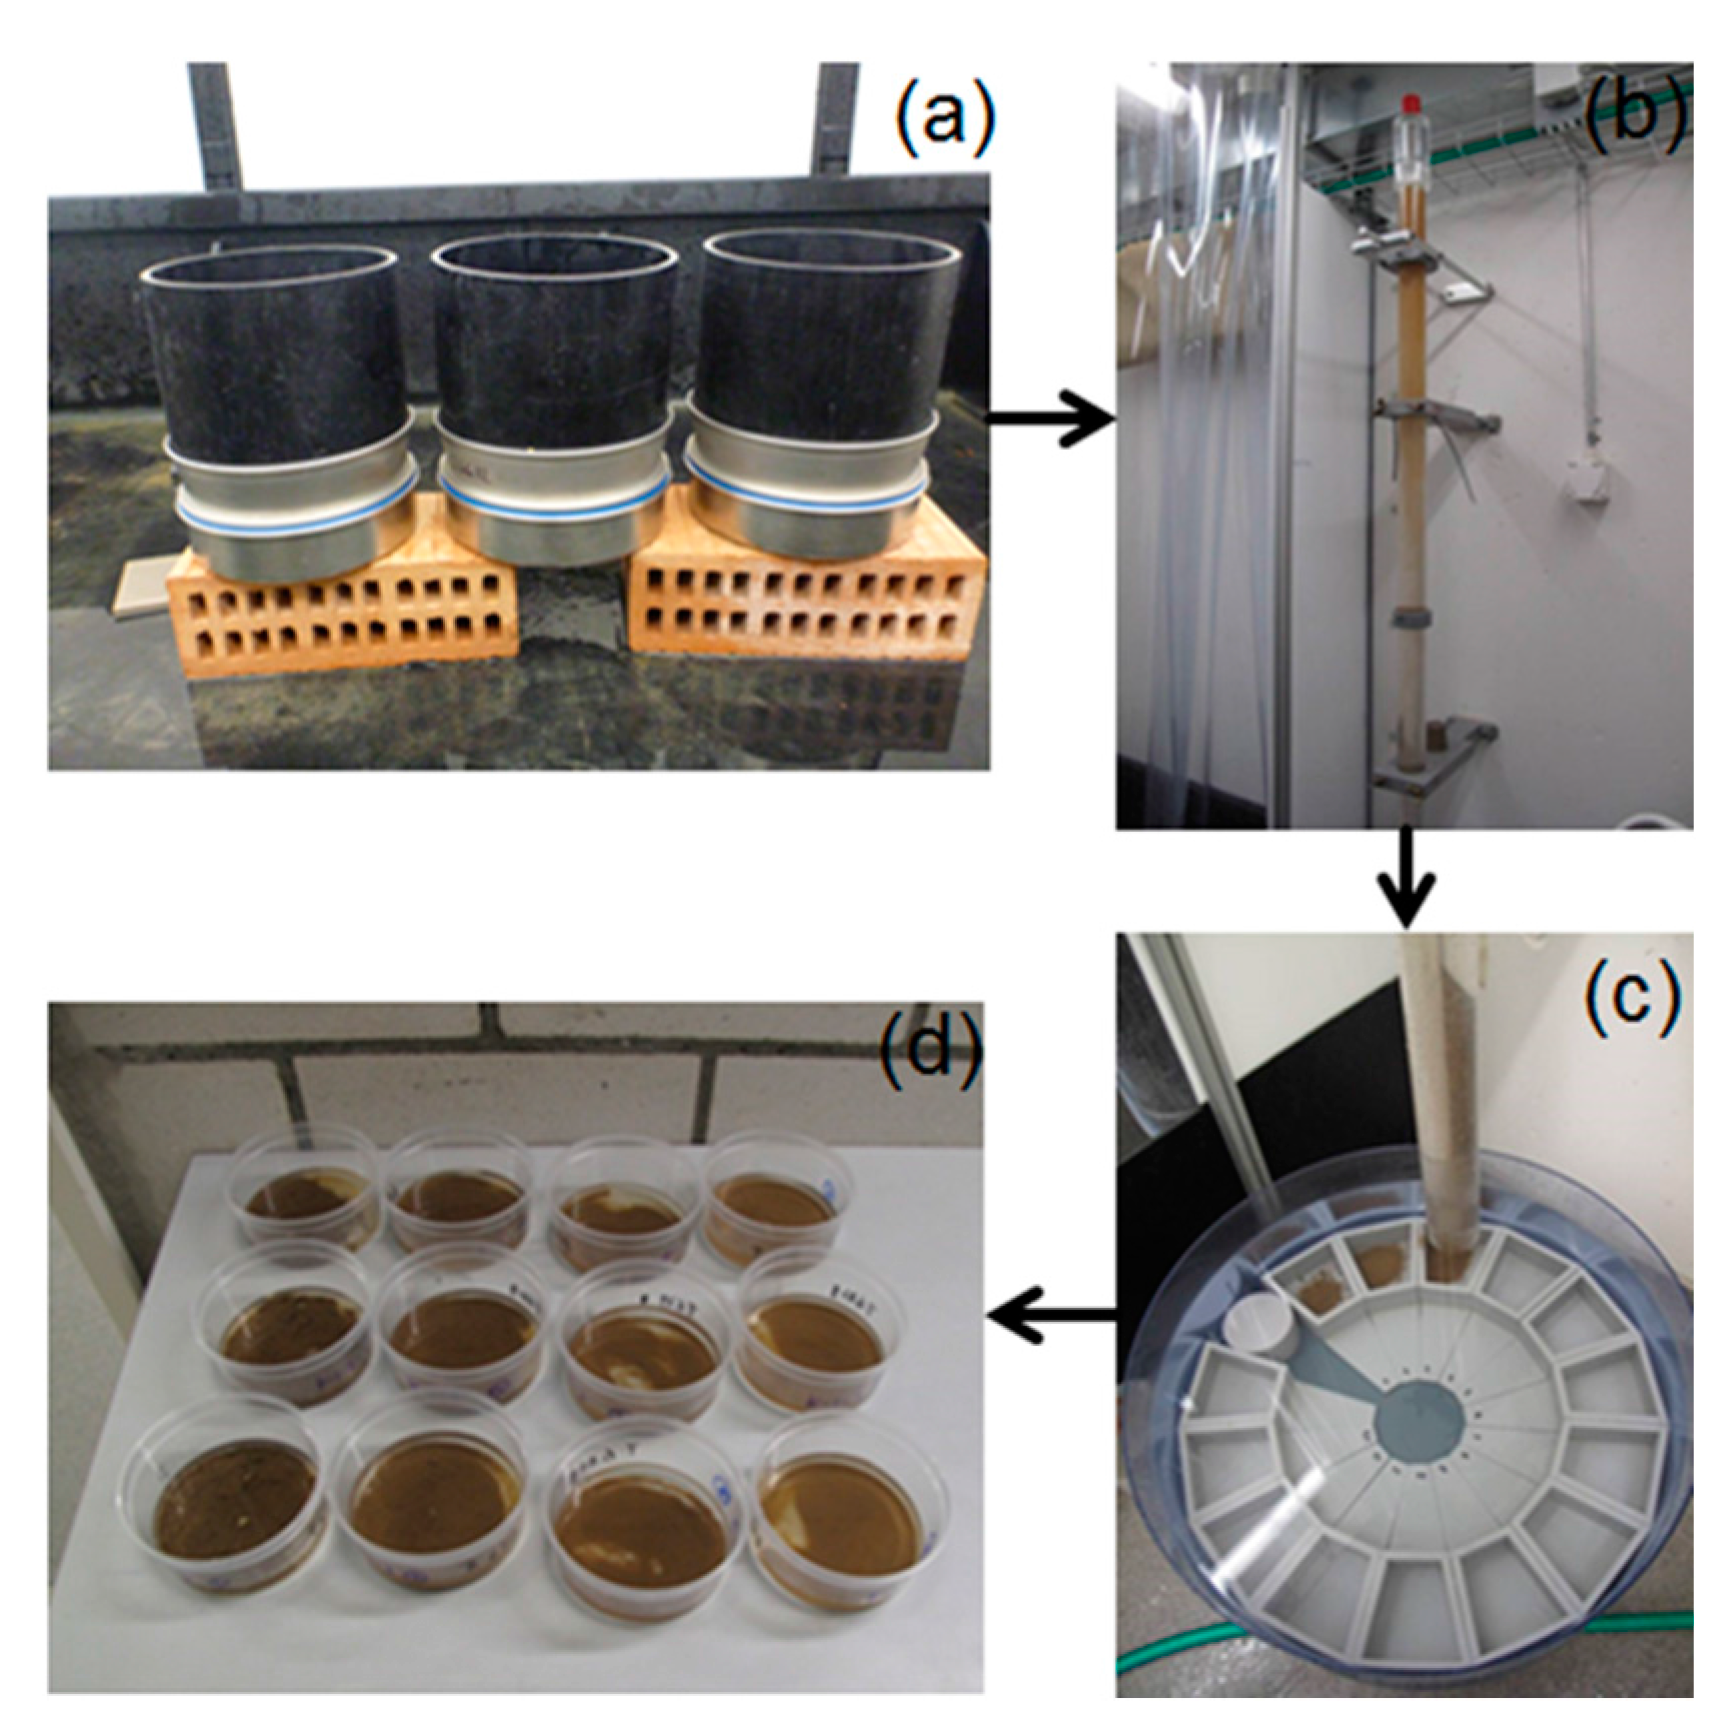
2.3. Settling Tube (ST)

The settling tube (ST) apparatus used in this study is developed from the “Griffith”-tube described by Hairsine and McTainsh [37] and Loch [27]. Detailed information about the design and operation of the ST apparatus has been described in Hu et al. [57]. In brief, the ST apparatus consists of four major components (Figure 1 and Figure 2):
(1)
The actual settling tube with a water column through which soil fractions settle.
(2)
An injection device to introduce soil into the tube.
(3)
A turntable to collect separated sample fractions.
(4)
A control panel to control the movement of the turntable.
After being introduced into the top of the tube by the injection device, the sediment sample is fractionated through the water column by settling velocity. Theoretically, the ST allows users to fractionate samples into a wide range of settling velocity classes through pre-set settling time intervals. However, for practical purposes, it is necessary to select the settling velocity fractions so as to generate sufficient sediment for each settling class in order to conduct further analysis. Meanwhile, the selected settling velocity distribution should also be related to the potential redistribution of sediment across landscapes. The concept of Equivalent Quartz Size (EQS) is thus introduced to represent the diameter of a spherical quartz particle that has the same velocity as the aggregated particle measured in the settling tube [27,30,57]. The soil sample can then be fractionated into six EQS classes corresponding to conventional size classes, i.e., 500 to 1000 µm, 250 to 500 µm, 125 to 250 µm, 62 to 125 µm, 32 to 62 µm, and <32 µm. These EQS classes correspond to settling velocities of 90 to 180 mm·s−1, 45 to 90 mm·s−1, 15 to 45 mm·s−1, 3 to 15 mm·s−1, 1 to 3 mm·s−1, and <1 mm·s−1 based on the settling equation proposed by Gibbs et al. [60], which was specifically developed for particles within these size ranges. From the perspective of sediment redistribution across a landscape, a particle size of 62 μm has been widely used as a cutoff to determine whether the eroded particles are deposited on hillslopes (>62 μm) or transported further downslope to enter aquatic ecosystems (<62 μm) (e.g., [30,34,61,62]). Therefore, a cut-off of EQS 62 µm (corresponding to a settling velocity of 3 mm·s−1) can be applied to separate landscape deposition of eroded soil (with settling velocity >3 mm·s−1) from that potentially transported into river systems (with settling velocity <3 mm·s−1) (Table 1).
Table 1. Possible fate, settling velocity, and Equivalent Quartz Size (EQS) of each fraction, and ratio of the proportion of each fraction between mineral grain and aggregate (after being impacted by 156 J·m−2). Values greater than 1 mean overestimation without considering aggregation, whereas values smaller than 1 mean underestimation without considering aggregation.
Possible Fate (Starr et al. [34])Settling Velocity (mm·s−1)EQSProportion of Mineral Grain/Proportion of Aggregate
(µm)MöhlinWeinanExeterEifel
Deposited across landscapes90–180500–10000.11-0.150.10
45–90250–5000.15-0.290.23
15–45125–2500.160.360.130.11
3–1562–1250.600.690.290.37
Possible transfer to aquatic systems1–332–620.801.000.710.63
<1<322.111.803.852.67

2.4. Mean Weight Settling Velocity (MWSV)

Ideally for comparison between various soil fractionation methods, the settling velocity distribution could be compiled into a single parameter enabling a simple, yet process-related comparison of soil settling behavior. Therefore, to compare the settling velocity distributions of various soils, the concept of Mean Weight Settling Velocity (MWSV), which follows the theory of Mean Weight Diameter (MWD), is used in this study. The MWSV represents the settling velocity distribution of destroyed aggregates depicted in Equation (1):
MWSV = x i × y i
where xi is the settling velocity of each settling fraction (mm·s−1), and yi is the proportion of each settling fraction with respect to the total sample.

3. The Application of the RADT-ST Method

3.1. Soil Samples and Preparations

The RADT-ST method developed in this study was applied to four soils sampled from A horizon in cultivated fields in Switzerland, Germany, the UK and the Loess Plateau in China. Detailed information about sampling of the four soils is listed in Table 2. All four soils are classified as Luvisols with similar texture, but different degrees of aggregation (Table 3) and all supported a maize-wheat rotation under conventional tillage. The selection of the four soils was therefore considered suitable to compare the diverse effects of aggregation on sediment settling and to examine the sensitivity of the combined RADT-ST approach. After sampling, soils were air dried for two weeks at 20 °C until constant dry weight was achieved. They were then passed through an 8 mm diameter sieve. This size standard aimed to exclude big clods that would excessively resist raindrop impact because of their size, and thereby ensured comparable results when examining the reactions of different soils to raindrop impact. For specific erosion-related questions, alternative pre-treatments such as controlling different precedent moisture regimes and/or aggregate size variation might be required.
Table 2. The sampling time, sites and coordinates of the four soils.
Sampling DateSampling CountryCoordinates
MöhlinMarch 2012Switzerland47°33′N, 7°50′E
WeinanFebruary 2013China34°30′N, 109°30′E
ExeterApril 2013UK50°44′N, 3°31′W
EifelApril 2013Germany50°02′N, 6°43′E
Table 3. Selected soil properties of the four soils. Numbers in brackets represent standard deviations. MWSV: Mean Weight Settling Velocity.
Clay (%)Silt (%)Sand (%)SOC mg·g−1Water Stable Aggregate (WSA) >250 µm (%)MWSV of Mineral Grain (mm·s−1)
Möhlin6.12 (0.06)78.12 (0.13)15.76 (0.19)9.60 (0.10)67.13 (0.61)3.92 (0.49)
Weinan6.78 (0.26)72.52 (0.34)20.70 (0.09)4.31 (0.03)48.00 (3.66)3.13 (0.02)
Exeter10.53 (0.47)75.37 (1.70)14.10 (1.23)24.30 (0.04)43.73 (1.82)8.67 (1.26)
Eifel9.04 (0.70)79.15 (0.96)11.81 (0.26)19.40 (0.07)54.42 (0.82)4.71 (0.42)

3.2. RADT-ST Test Procedure and Rainfall Simulation

A total of 25 g (dry weight) of each soil was distributed uniformly across the sample carrier of the RADT, fully covering the sieve (Figure 2). For each soil, three RADT cylinders were placed next to each other and simultaneously exposed to simulated rainfall. Details are described in the following paragraph. After raindrop impact induced destruction, all the soil fractions remaining on the sample carrier of the RADT were transferred into the settling tube (ST) apparatus to conduct settling fractionation. The settling velocity classes used in this experiment follow the protocol described in Section 2.3. To test the relevance of aggregation for transport of particulate substances, the SOC concentration of the four bulk soils (average SOC) and the respective EQS fractions (actual SOC) after the RADT-ST tests was measured using a LECO RC 612 (Mönchengladbach, Germany).
The rainfall was simulated using a Lechler full cone nozzle (type +460.728.30.CE, Lechler GmbH, Metzingen, Germany), with a fall height of 2 m over the sieve of the RADT. The intensity of the simulated rainfall was 35 mm·h−1 with an average raindrop size of 2.2 mm and an average kinetic energy of 105 J m−2·h−1. A pre-test had shown that, to completely break down aggregates and form a soil crust that did not change visibly anymore on all the four soils, it required a kinetic energy of 150 J·m−2. Such kinetic energy corresponds to natural precipitation of approximately 35 mm·h−1 for 15 min [63] in the areas where the soils originated. The natural precipitation intensity of 35 mm·h−1 is common in the regions of the sampling sites, with a return period of 0.33 years [64] for the sampling sites of the European soils, and 0.39 years for the Weinan soil in China [65]. However, the kinetic energy of the simulated rainfall used in this study is lower than that natural precipitation of similar intensity [30,64]. Therefore, rainfall intensity or rainfall duration can be increased to generate a cumulative rainfall kinetic energy comparable to natural precipitation. Given that rainfall kinetic energy is more essential than cumulative rainfall amount in this study in terms of observing raindrop impact-induced soil surface changes [66], simulated rainfalls of 35 mm·h−1 lasting up to 90 min with a cumulative kinetic energy about 150 J·m−2 was used in this study. Such simulated rainfall can, therefore, assemble aggregate breakdown processes that are likely to experience during natural crust formation. In order to observe the sensitivity of the aggregate settling velocity of the sediment generated on the four soils during the crust formation, tests were carried out where the kinetic energy was systematically increased from 26 J·m−2, up to 59, 78, 104, and 156 J·m−2, which correspond to rainfall durations of 15, 30, 45, 60 and 90 min, respectively.

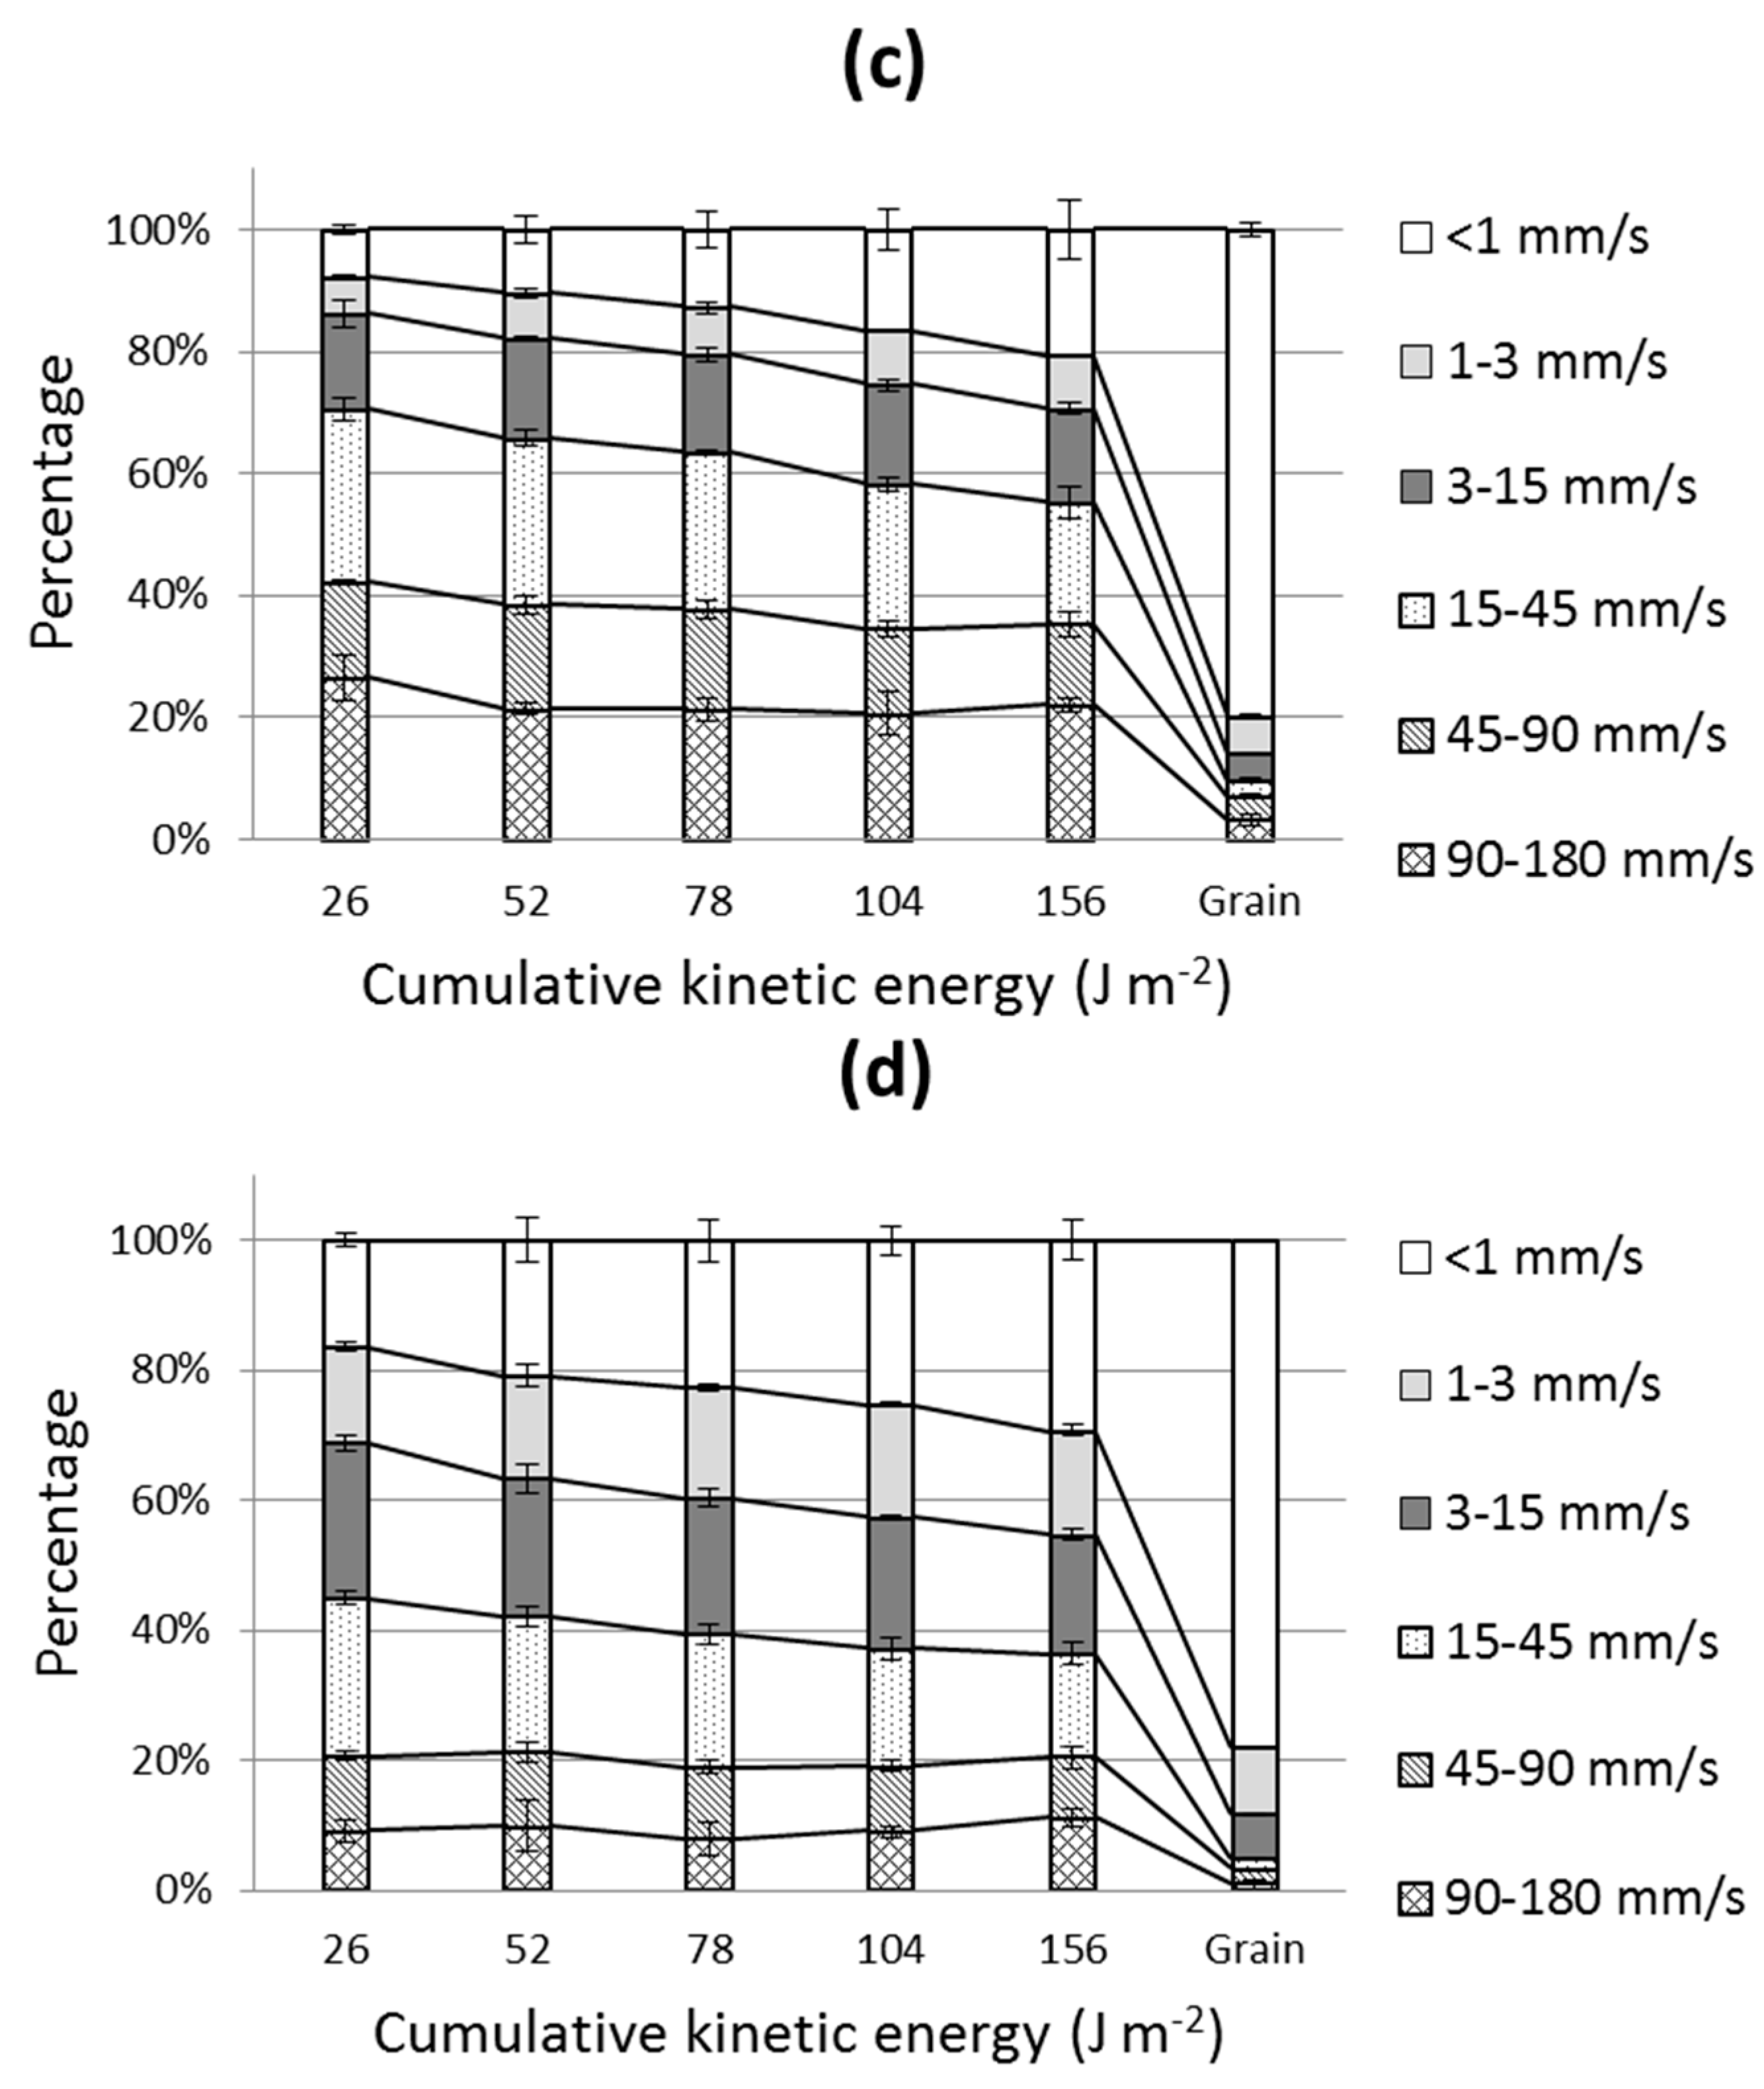
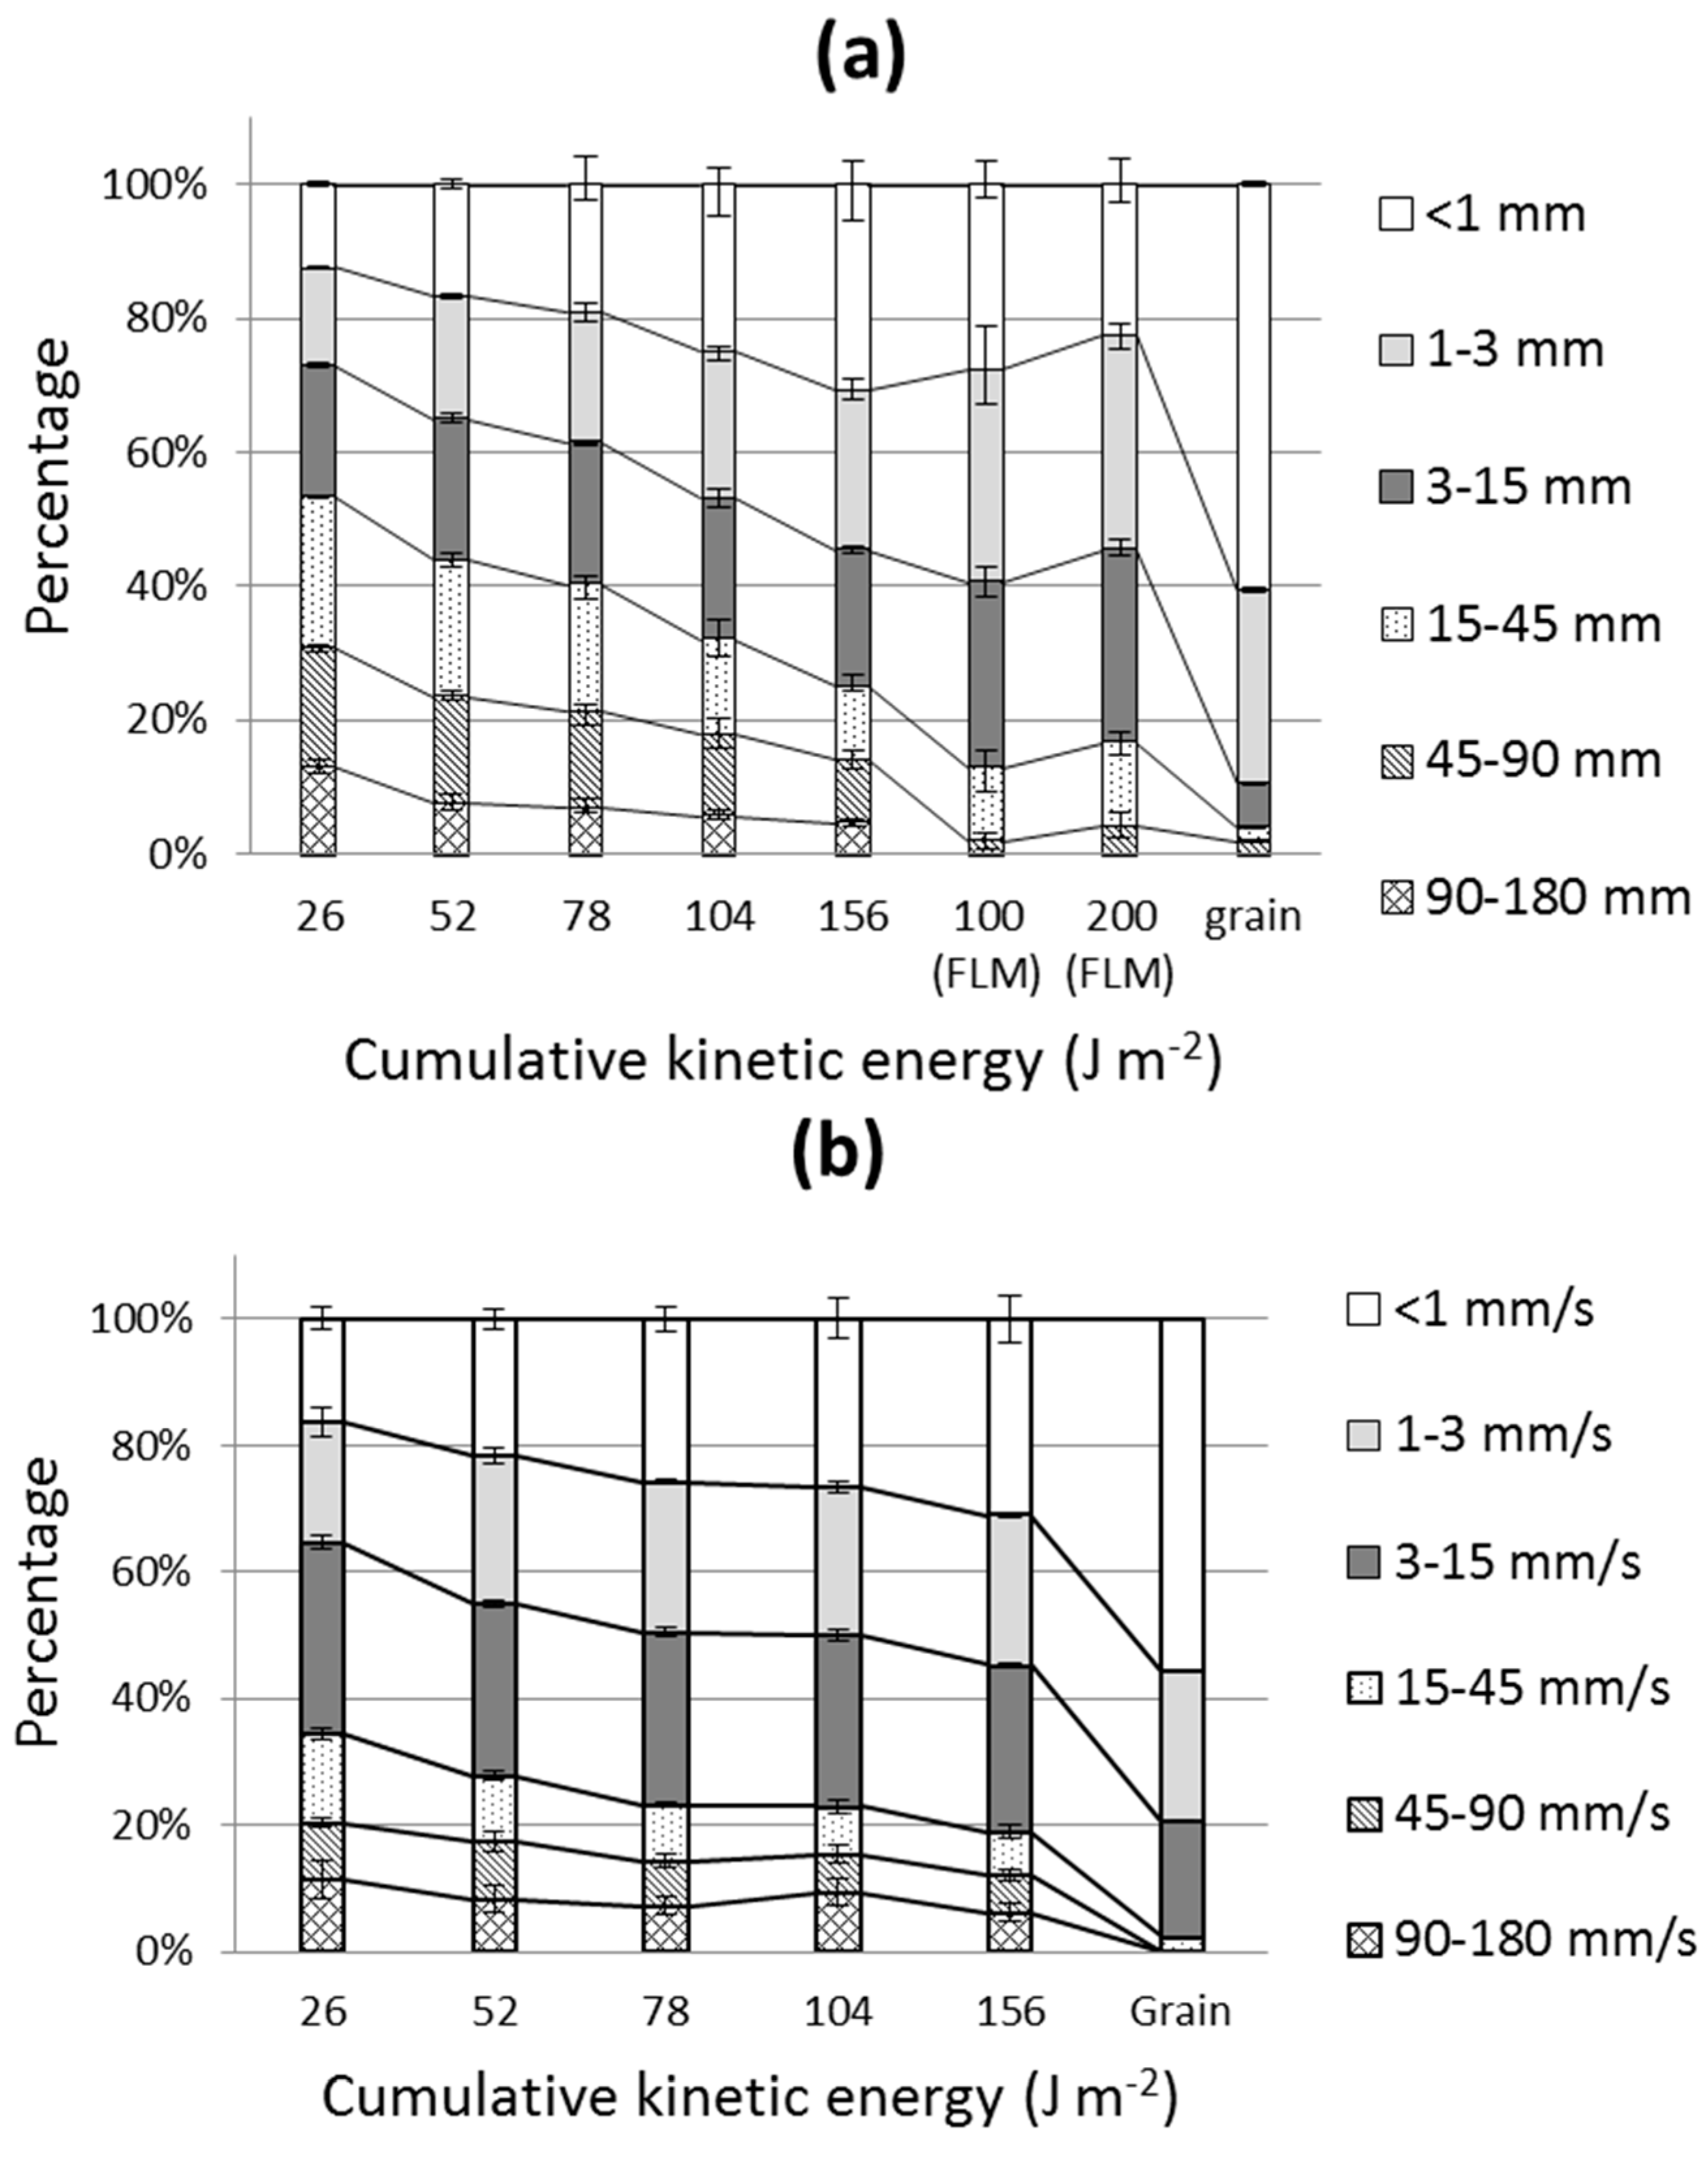
3.3. Mineral Grain Size Distribution

Comparing aggregated sediment settling velocity distribution to the soil texture derived settling velocity distribution allows an evaluation of the efficiency of the RADT-ST. The texture of the four soils was determined from a suspension of ca. 1 g of soil in 1000 mL of water, after pre-treatment with 5 mL of sodium hexametaphosphate and the further dispersed using ultrasound, with energy equivalent to 5.4 J·mL−1 for three minutes. The mineral grain size distributions of the four soils were then measured using a Malvern Mastersizer 2000 (Malvern Instruments Ltd., Malvern, UK). Mineral grains were divided into the same six size classes in accordance with the six EQS classes distinguished by the RADT-ST test described in Section 2.3. Subsequently, the MWSV based on mineral grain size distribution was also calculated to compare with that of the fractionated sediment aggregates.

4. Results and Discussion

The settling velocity distributions of the four soils after destruction and fractionation by RADT-ST are shown in Figure 3. Generally, for all four soils the mass of the fast-settling fractions decreased with cumulative rainfall kinetic energy, while the slow-settling fractions increased (Figure 3). This can be explained by the breakdown of large aggregates into smaller ones after being subjected to an increasing raindrop kinetic energy. For the Möhlin soil, a comparison of the RADT-ST results with the settling velocities of sediment generated from an eroding flume under laboratory simulated rainfalls [30] reveals a good agreement of the respective distributions after the maximum kinetic energy (156 J·m−2), except for the “missing” fast-settling fractions from the flume test (settling velocity > 45 mm·s−1) (Figure 3a). The good agreement between the two experiments shows that the RADT-ST method is a feasible approximation for sediment that is generated by raindrop-impacted flow. In fact, the “missing” fast-settling aggregates in sediment generated using a flume in Hu and Kuhn [30] are consistent with the differences between the two test procedures. These large aggregates are most likely those that moved slowly across the flume used by Hu and Kuhn [30] and thus did not all reach the outfall weir during the experiment. With the RADT-ST procedure, such scale-specific bias can be avoided in a simple and time-efficient manner.
Figure 3. The settling velocity distributions after different cumulative kinetic energy of (a) the Möhlin soil; (b) the Weinan soil; (c) the Exeter soil and (d) the Eifel soil. “Grain” represents the settling distribution based on soil texture after dispersion. “100 (FLM)” and “200 (FLM)” represent the EQS distribution of eroded sediment from a flume (FLM) (Hu and Kuhn [30]) after 100 and 200 J·m−2· of cumulative kinetic energy impact. Bars represent standard deviations.
Hydrology 02 00176 g003aHydrology 02 00176 g003b
The actual settling velocity distributions of the four soils were also distinctively different from that based on their mineral grain size distributions. For instance, aggregate fractions with a settling velocity < 3 mm·s−1 were two to four times less in amount than the mineral grains with equivalent settling velocity (Figure 3). Such differences were still evident even after the maximum cumulative kinetic energy (Figure 3), indicating that sediment would remain aggregated even throughout a prolonged erosion event or after multiple rainfall events. Therefore, if applying mineral grain size distribution into erosion models, the fractions potentially transferred into rivers (i.e., settling velocity < 3 mm·s−1) would have been largely over-estimated, while those likely deposited across the terrestrial system (i.e., settling velocity > 3 mm·s−1) would have been under-estimated. Furthermore, the MWSV of aggregates declined as cumulative kinetic energy increase (Figure 4). The ratios between the MWSV of aggregates and the MWSV of mineral grains were always larger than six for the four soils, suggesting that settling velocity based on mineral grain size distribution would have been underestimated by at least six times the actual amount (Figure 5). Our results therefore challenge the way of using “average diameter of the soil particles” to calculate the redistribution of soils without considering the effects of aggregation in RUSLE [50]. The biased estimation on settling velocity of soil fractions would further lead to 2–5-fold under-representation of SOC deposited across landscapes (white bars in Figure 6). While coupling aggregate size distribution with average SOC content (e.g., [51]) can largely improve the calibration of soil erosion model (light grey bars compared to white bars in Figure 6), the settling velocity specific SOC distribution identified with the RADT-ST method represents an even more efficient proxy to reflect the potential redistribution of eroded SOC across landscapes (dark grey bars in Figure 6). It therefore represents a promising tool to integrate actual settling velocity specific SOC distribution into soil redistribution parameters for the purpose of optimizing soil erosion model outputs (e.g., the Multi-Class Sediment Transport model (MCST) used in [29]).
Figure 4. Mean Weight Settling Velocity (MWSV) of aggregates as cumulative kinetic energy increased.
Hydrology 02 00176 g004
Figure 5. The ratios between Mean Weight Settling Velocity (MWSV) of aggregates and MWSV of mineral grains as cumulative kinetic energy increased.
Hydrology 02 00176 g005
Figure 6. The proportions of potential SOC deposition calculated in different ways. The SOC distribution across EQS fractions and mineral grain fractions were first calculated. The SOC contained in fractions >62 µm was regarded as potentially depositional across landscapes (Starr et al. [34]). “Aggregate+actual” represents the SOC distribution that was calculated by multiplying the SOC concentration of each EQS fraction with their individual weight proportions. “Aggregate+average” represents the SOC distribution was calculated by multiplying the average SOC concentration of bulk soil with weight of each EQS fraction. “Mineral+average” represents the SOC distribution was calculated by multiplying the average SOC concentration of bulk soil with weight of each EQS fraction.
Hydrology 02 00176 g006
Apart from the general trends observed from the four soils, the RADT-ST can also capture minor differences between different types of soil. For instance, the MWSV reaction of the four soils, despite similar texture (Table 3), differed from each other as kinetic energy increased (Figure 4). Higher cumulative kinetic energy is required to reach equilibrium MWSV for the Möhlin soil (at least 156 J·m−2) than the other three soils, all of which were rapidly destroyed only after an initial kinetic energy of 52 J·m−2. This is consistent with the greater aggregate stability expressed by the Möhlin soil (Table 3) which can better preserve its aggregates from rapid destruction. Therefore, the differences among the four soils in aggregate breakdown over increasing kinetic energy clearly demonstrate that the RADT-ST method can serve as a new proxy that is adequately sensitive to detect the effects of different degrees of aggregation on sediment settling velocity. The RADT-ST derived settling velocity distribution could therefore be used to generate settling velocity datasets composing a wide range of soils, which in turn can be easily integrated into erosion models. The simplicity and feasibility of the RADT-ST under simulated rainfall conditions also avoid rigorous field sampling and sediment quality monitoring that is usually required to understand the relationship between soil properties and their settling behavior (e.g., [67]).

5. Conclusions

In order to rectify the bias of settling velocity distribution introduced by mineral grain size distribution, a combined Raindrop Aggregate Destruction Test-Settling Tube (RADT-ST) approach was developed to simulate the generation of sediment aggregates by raindrop impact under controlled simulated rainfall conditions, and to further determine their actual settling velocity distributions. Four types of soils with similar texture, but different degrees of aggregation, were used to examine the feasibility and sensitivity of this RADT-ST approach. Through comparing the Mean Weight Settling Velocity (MWSV) of raindrop-destroyed aggregates with dispersed mineral grains, our results show that the settling velocity of the four soils and their SOC deposited across landscapes would have been underestimated by at least six times, if not considering the actual aggregate settling velocity distribution. This demonstrates the feasibility of the RADT-ST approach to capture the effects of aggregation onto sediment size and subsequent re-distribution. The feasibility of this approach was also illustrated by the comparable settling velocity distributions between aggregates collected from the RADT-ST in this study and that of the same soil collected from a previous flume experiment after receiving similar rainfall cumulative kinetic energy. Furthermore, the settling velocities gradually declined as raindrop kinetic energy increased, and the declining patterns differed between soils, clearly illustrating the sensitivity of the RADT-ST approach to detect subtle differences in soil erodibility properties. Overall, the RADT-ST approach developed in this study has the potential to provide actual settling information generated under relatively simple simulated rainfall conditions to optimize the parametrization of sediment behavior and quality in erosion models, such as the Multi-Class Sediment Transport model (MCST) [29]. If further extrapolated appropriately to a specific erosion scenario, the RADT-ST derived sediment quality parameters can also help to improve our understanding of sediment movement through watersheds and the environmental impacts of the heterogeneously distributed eroded substances.

Acknowledgments

We are grateful to the support of China scholarship council (CSC) and the University of Basel. The contribution of Ruth Strunk is also acknowledged.

Author Contributions

Nikolaus J. Kuhn and Liangang Xiao conceived and designed the experiments; Liangang Xiao performed the experiments; Liangang Xiao analyzed the data; and Liangang Xiao, Yaxian Hu and Philip Greenwood wrote the paper.

Conflicts of Interest

The authors declare no conflict of interest.

References

  1. Pimentel, D.; Harver, C.; Resosudarmo, P.; Sinclair, K.; Kurz, D.; McNair, M.; Crist, S.; Shpritz, L.; Fitton, L.; Saffouri, R.; et al. Environmental and economic costs of soil erosion and conservation benefits. Science 1995, 267, 1117–1123. [Google Scholar] [CrossRef] [PubMed]
  2. Cerdà, A.; Giménez-Morera, A.; Bodí, M.B. Soil and water losses from new citrus orchards growing on sloped soils in the western Mediterranean basin. Earth Surf. Process. Landf. 2009, 34, 1822–1830. [Google Scholar] [CrossRef]
  3. Lieskovský, J.; Kenderessy, P. Modelling the effect of vegetation cover and different tillage practi-ces on soil erosion in vineyards: A case study en Vráble (Slovakia) using Watem/Sedem. Land Degrad. Dev. 2014, 25, 288–296. [Google Scholar] [CrossRef]
  4. Zhao, G.; Mu, X.; Wen, Z.; Wang, F.; Gao, P. Soil erosion, conservation, and Eco-environment changes in the Loess Plateau of China. Land Degrad. Dev. 2013, 24, 499–510. [Google Scholar] [CrossRef]
  5. Cerdà, A.; Flanagan, D.C.; le Bissonnais, Y.; Boardman, J. Soil erosion and agriculture. Soil Tillage Res. 2009, 106, 107–108. [Google Scholar] [CrossRef]
  6. Colazo, J.C.; Buschiazzo, D. The impact of agriculture on soil texture due to wind erosion. Land Degrad. Dev. 2015, 26, 62–70. [Google Scholar] [CrossRef]
  7. Lal, R. Soil erosion and the global carbon budget. Environ. Int. 2003, 29, 437–450. [Google Scholar] [CrossRef]
  8. Ritter, W.F.; Shirmohammadi, A. Agricultural Nonpoint Source Pollution, Watershed Management and Hydrology; Lewis Publishers: New York, NY, USA, 2001; p. 342. [Google Scholar]
  9. Belsky, J.A.; Matzke, A.; Uselman, S. Survey of livestock influences on stream and riparian ecosystems in the western United States. J. Soil Water Conserv. 1999, 54, 419–431. [Google Scholar]
  10. Greenwood, P.; Kuhn, N.J. Does the invasive plant, Impatiens glandulifera, promote soil erosion along the riparian zone? An investigation on a small watercourse in northwest Switzerland. J. Soils Sediments 2014, 14, 637–650. [Google Scholar] [CrossRef]
  11. Jordan, C.; McGuckin, S.O.; Smith, R.V. Increased predicted losses of phosphorus to surface waters from soils with high Olsen-P concentrations. Soil Use Manag. 2000, 16, 27–35. [Google Scholar] [CrossRef]
  12. Quinton, J.N.; Catt, J.A.; Hess, T.M. The selective removal of phosphorus from soil: Is event size important? J. Environ. Qual. 2001, 30, 538–545. [Google Scholar] [CrossRef] [PubMed]
  13. Kuhn, N.J.; Armstrong, E.K.; Ling, A.C.; Connolly, K.L.; Heckrath, G. Interrill erosion of carbon and phosphorus from conventionally and organically farmed Devon silt soils. CATENA 2012, 91, 94–103. [Google Scholar] [CrossRef]
  14. Baker, L.A. Introduction to nonpoint source pollution in the United States and prospects for wetland use. Ecol. Eng. 1992, 1, 1–26. [Google Scholar] [CrossRef]
  15. Lal, R. Soil carbon sequestration impacts on global climate change and food security. Science 2004, 304, 1623–1627. [Google Scholar] [CrossRef] [PubMed]
  16. Van Oost, K.; Quine, T.A.; Govers, G.; de Gryze, S.; Six, J.; Harden, J.W.; Ritchie, J.C.; McCarty, G.W.; Heckrath, G.; Kosmas, C.; et al. The impact of agricultural soil erosion on the global carbon cycle. Science 2007, 318, 626–629. [Google Scholar] [CrossRef] [PubMed]
  17. Berhe, A.A.; Harte, J.; Harden, J.W.; Torn, M.S. The significance of the erosion-induced terrestrial carbon sink. BioScience 2007, 57, 337–346. [Google Scholar] [CrossRef]
  18. Kuhn, N.J.; Hoffmann, T.; Schwanghart, W.; Dotterweich, M. Agricultural soil erosion and global carbon cycle: Controversy over? Earth Surf. Process. Landf. 2009, 34, 1033–1038. [Google Scholar] [CrossRef]
  19. Quinton, J.N.; Govers, G.; van Oost, K.; Bardgett, R.D. The impact of agricultural soil erosion on biogeochemical cycling. Nat. Geosci. 2010, 3, 311–314. [Google Scholar] [CrossRef] [Green Version]
  20. Kirkels, F.M.S.A.; Cammeraat, L.H.; Kuhn, N.J. The fate of soil organic carbon upon erosion, transport and deposition in agricultural landscapes—A review of different concepts. Geomorphology 2014, 226, 94–105. [Google Scholar] [CrossRef]
  21. Fiener, P.; Auerswald, K.; van Oost, K. Spatio-temporal patterns in land use and management affecting stromflow response of agricultural catchments—A review. Earth Sci. Rev. 2011, 106, 92–104. [Google Scholar] [CrossRef]
  22. Kuhn, N.J. Assessing Lateral Organic Carbon Movement in Small Agricultural Catchments. Available online: http://www.wsl.ch/dienstleistungen/publikationen/pdf/12491.pdf (accessed on 15 October 2015).
  23. Lal, R.; Pimentel, D. Letter on “Soil Erosion: A carbon sink or source?”. Science 2008, 319, 1040–1041. [Google Scholar] [CrossRef] [PubMed]
  24. Kinnell, P.I.A. Particle travel distances and bed and sediment compositions associated with rain-Impacted flows. Earth Surf. Process. Landf. 2001, 26, 749–758. [Google Scholar] [CrossRef]
  25. Kuhn, N.J.; Armstrong, E.K. Erosion of organic matter from sandy soils: Solving the mass balance. CATENA 2012, 98, 87–95. [Google Scholar] [CrossRef]
  26. Fiener, G.; Govers, G.; van Oost, K. Evaluation of a dynamic multi-class sediment transport model in a catchment under soil-conservation agriculture. Earth Surf. Process. Landf. 2008, 33, 1639–1660. [Google Scholar]
  27. Loch, R.J. Settling velocity—A new approach to assessing soil and sediment properties. Comput. Electron. Agric. 2001, 31, 305–316. [Google Scholar] [CrossRef]
  28. Van Oost, K.; Govers, G.; Quine, T.A.; Heckrath, G.; Olesen, J.E.; de Gryze, S.; Merckx, R. Landscape-scale modeling of carbon cycling under the impact of soil redistribution: The role of tillage erosion. Glob. Biogeochem. Cycles 2005, 19, 1733–1739. [Google Scholar] [CrossRef]
  29. Van Oost, K.; Beuselinck, L.; Hairsine, P.B.; Govers, G. Spatial evaluation of a multi-class sediment transport and deposition model. Earth Surf. Process. Landf. 2004, 29, 1027–1044. [Google Scholar] [CrossRef]
  30. Hu, Y.; Kuhn, N.J. Aggregates reduce transport distance of soil organic carbon: Are our balances correct? Biogeosciences 2014, 11, 6209–6219. [Google Scholar] [CrossRef]
  31. Hairsine, P.B.; Rose, C.W. Rainfall detachment and deposition: Sediment transport in the absence of flow-driven processes. Soil Sci. Soc. Am. J. 1991, 55, 320–324. [Google Scholar] [CrossRef]
  32. Hairsine, P.B.; Rose, C.W. Modelling water erosion due to overland flow using physical principles: I. Uniform flow. Water Resour. Res. 1992, 28, 237–243. [Google Scholar] [CrossRef]
  33. Hairsine, P.B.; Rose, C.W. Modelling water erosion due to overland flow using physical principles: II. Rill flow. Water Resour. Res. 1992, 28, 245–250. [Google Scholar] [CrossRef]
  34. Starr, G.C.; Lal, R.; Malone, R.; Hothem, D.; Owens, L.; Kimble, J. Modeling soil carbon transported by water erosion process. Land Degrad. Dev. 2000, 11, 83–91. [Google Scholar] [CrossRef]
  35. Wang, Z.; Govers, G.; Steegen, A.; Clymans, W.; van den Putte, A.; Langhans, C.; Merckx, R.; van Oost, K. Catchment-scale carbon redistribution and delivery by water erosion in an intensively cultivated area. Geomorphology 2010, 124, 65–74. [Google Scholar] [CrossRef]
  36. Nadeu, E.; de Vente, J.; Martínez-Mena, M.; Boix-Fayos, C. Exploring particle size distribution and organic carbon pools mobilized by different erosion processes at the catchment scale. J. Soils Sediments 2011, 11, 667–678. [Google Scholar]
  37. Hairsine, P.B.; McTainsh, G.H. The Griffith Tube: A Simple Settling Tube for the Measurement of Settling Velocity of Soil Aggregates; AES working paper 3/86; Griffith University: Brisbane, Australia, 1986. [Google Scholar]
  38. Smith, R.E.; Quinton, J.; Goodrich, D.C.; Nearing, M. Soil-erosion models: Where do we really stand? Earth Surf. Process. Landf. 2010, 35, 1344–1348. [Google Scholar] [CrossRef]
  39. Proffitt, A.P.B.; Rose, C.W.; Lovell, C.J. Settling velocity characteristics of sediment detached from a soil surface by raindrop impact. Catena 1993, 20, 27–40. [Google Scholar] [CrossRef]
  40. Proffitt, A.P.B.; Rose, C.W. Soil erosion processes II. Settling velocity characteristics of eroded sediment. Aust. J. Soil Res. 1991, 29, 685–695. [Google Scholar] [CrossRef]
  41. Lovell, C.J.; Rose, C.W. Wake capture effects observed in a comparison of methods to measure particle settling velocity beyond Stokes’ range. J. Sediment. Petrol. 1991, 61, 575–582. [Google Scholar] [CrossRef]
  42. Lovell, C.J.; Rose, C.W. The effects of sediment concentration and tube-diameter on particle settling velocity measured beyond Stokes’ range: Experiment and theory. J. Sediment. Petrol. 1991, 61, 583–589. [Google Scholar] [CrossRef]
  43. Lu, H.; Moran, C.J.; Prosser, I.P. Modelling sediment delivery ratio over the Murray Darling Basin. Environ. Model. Softw. 2006, 21, 1297–1308. [Google Scholar] [CrossRef]
  44. Pieri, L.; Bittelli, M.; Wu, J.Q.; Dun, S.; Flanagan, D.C.; Pisa, P.R.; Ventura, F.; Salvatorelli, F. Using the Water Erosion Prediction Project (WEPP) model to simulate field-observed runoff and erosion in the Apennines Mountain Range, Italy. J. Hydrol. 2007, 336, 84–97. [Google Scholar] [CrossRef]
  45. Walling, D.E. Erosion and sediment yield research—Some recent perspectives. J. Hydrol. 1988, 100, 113–141. [Google Scholar] [CrossRef]
  46. Dietrich, W.E. Settling velocity of natural particles. Water Resour. Res. 1982, 18, 1615–1626. [Google Scholar] [CrossRef]
  47. Angima, S.D.; Stott, D.E.; O’Neill, M.K.; Ong, C.K.; Weesies, G.A. Soil erosion prediction using RUSLE for central Kenyan highland conditions. Agric. Ecosyst. Environ. 2003, 97, 295–308. [Google Scholar] [CrossRef]
  48. Le Bissonnais, Y. Aggregate stability and assessment of soil crustability and erodibility: I. Theory and methodology. Eur. J. Soil Sci. 1996, 47, 425–437. [Google Scholar] [CrossRef]
  49. Levy, G.J.; Warrington, D.N.; Bhardwaj, A.K.; Mamedov, A.I. Changes in eroded material and runoff as affected by rain depth and aggregate slaking in three semiarid region soils. Geophys. Res. Abstr. 2007, 9, 05380. [Google Scholar]
  50. Renard, K.G.; Foster, G.R.; Weesies, G.A.; Porter, J.P. Rusle: Revised universal soil loss equation. J. Soil Water Conserv. 1991, 46, 30–33. [Google Scholar]
  51. Van Oost, K.; Verstraeten, G.; Doetterl, S.; Notebaert, B.; Wiaux, F.; Broothaerts, N.; Six, J. Legacy of human-induced C erosion and burial on soil-atmosphere C exchange. Proc. Natl. Acad. Sci. USA 2012, 109, 19492–19497. [Google Scholar] [CrossRef] [PubMed]
  52. Ries, J.B.; Iserloh, T.; Seeger, M.; Gabriels, D. Rainfall simulations—Constraints, needs and challenges for a future use in soil erosion research. Z. Geomorphol. Suppl. 2013, 57, 1–10. [Google Scholar] [CrossRef]
  53. Iserloh, T.; Ries, J.B.; Arnaez, J.; Boix Fayos, C.; Butzen, V.; Cerdá, A.; Echeverría, M.; Fernández-Gálvez, J.; Fister, W.; Gómez, J.A. European small portable rainfall simulators: A comparison of rainfall characteristics. CATENA 2013, 110, 100–112. [Google Scholar] [CrossRef] [Green Version]
  54. Kuhn, N.J.; Bryan, R.B.; Navar, J. Seal formation and interrill erosion on a smectite-rich Kastanozem from NE-Mexico. CATENA 2003, 52, 149–169. [Google Scholar] [CrossRef]
  55. Kuhn, N.J.; Bryan, R.B. Drying, soil surface condition and interrill erosion on two Ontario soils. Catena 2004, 57, 113–133. [Google Scholar] [CrossRef]
  56. Kuhn, N.J. Erodibility of soil and organic matter: Independence of organic matter resistance to interrill erosion. Earth Surf. Process. Landf. 2007, 35, 1344–1348. [Google Scholar] [CrossRef]
  57. Hu, Y.; Fister, W.; Rüegg, H.R.; Kinnell, P.I.A.; Kuhn, N.J. The Use of Equivalent Quartz Size and Settling Tube Apparatus to Fractionate Soil Aggregates by Settling Velocity. Available online: http://www.geomorphology.org.uk/sites/default/files/geom_tech_chapters/1.1.1_SettlingTube.pdf (accessed on 15 October 2015).
  58. Kinnell, P.I.A. Sediment transport by medium to large drops impacting flows at subterminal velocity. Soil Sci. Soc. Am. J. 2005, 69, 902–905. [Google Scholar] [CrossRef]
  59. Kinnell, P.I.A. Raindrop-impact-induced erosion processes and prediction: A review. Hydrol. Process. 2005, 19, 2815–2844. [Google Scholar] [CrossRef]
  60. Gibbs, R.J.; Matthews, M.D.; Link, D.A. The relationship between sphere size and settling velocity. J. Sediment. Petrol. 1971, 41, 7–18. [Google Scholar]
  61. Pert, M.R.; Walling, D.E. Particle size characteristics of fluvial suspended sediment. In Recent Developments in the Explanation and Prediction of Erosion and Sediment Yield; International Association of Hydrological Sciences (IAHS): Exeter, UK, 1982; pp. 397–407. [Google Scholar]
  62. Polyakov, V.O.; Lal, R. Soil organic matter and CO2 emission as affected by water erosion on field runoff plots. Geoderma 2008, 143, 216–222. [Google Scholar] [CrossRef]
  63. Iserloh, T.; Fister, W.; Seeger, M.; Willger, H.; Ries, J.B. A small portable rainfall simulator for reproducible experiments on soil erosion. Soil Tillage Res. 2012, 124, 131–137. [Google Scholar] [CrossRef]
  64. MeteoSwiss. Monthly Total Precipitation during April, May, and June at Station Arisdorf (47°30′N, 7°46′E) Near Möhlin from 1985 to 2012; MeteoSwiss, Federal Office of Meteorology and Climatology: Zürich, Switzerland, 2013. [Google Scholar]
  65. Wan, L.; Zhang, X.P.; Ma, Q.; Zhang, J.J.; Ma, T.Y.; Sun, Y.P. Spatiotemporal characteristics of precipitation and extreme events on the Loess Plateau of China between 1957 and 2009. Hydrol. Process. 2014, 28, 4971–4983. [Google Scholar] [CrossRef]
  66. Torri, D.; Regüés, D.; Pellegrini, S.; Bazzoffi, P. Within-storm soil surface dynamics and erosive effects of rainstorms. Catena 1999, 38, 131–150. [Google Scholar] [CrossRef]
  67. Flanagan, D.C.; Livingston, S.J. (Eds.) Water Erosion Prediction Project (WEPP) Version 95.7, User Summary. In WEPP User Summary; Report No. 11; NSERL: West Lafayette, IN, USA, 1995.

