
Experimental and Kinetic Study of the Catalytic Behavior of Sulfate-Treated Nanostructured Bifunctional Zirconium Oxide Catalysts in n-Heptane Hydroisomerization Reactions
 , ,
, , 
Abstract
:1. Introduction
2. The Experimental Work
2.1. Materials
2.2. The Characterization Techniques
2.3. Bifunctional Nanocatalyst Preparation
Catalyst Pelletizing
2.4. Experimental Catalytic Reactions
3. Results Discussion
3.1. Catalysts Characterization
3.1.1. X-ray Diffraction Analysis
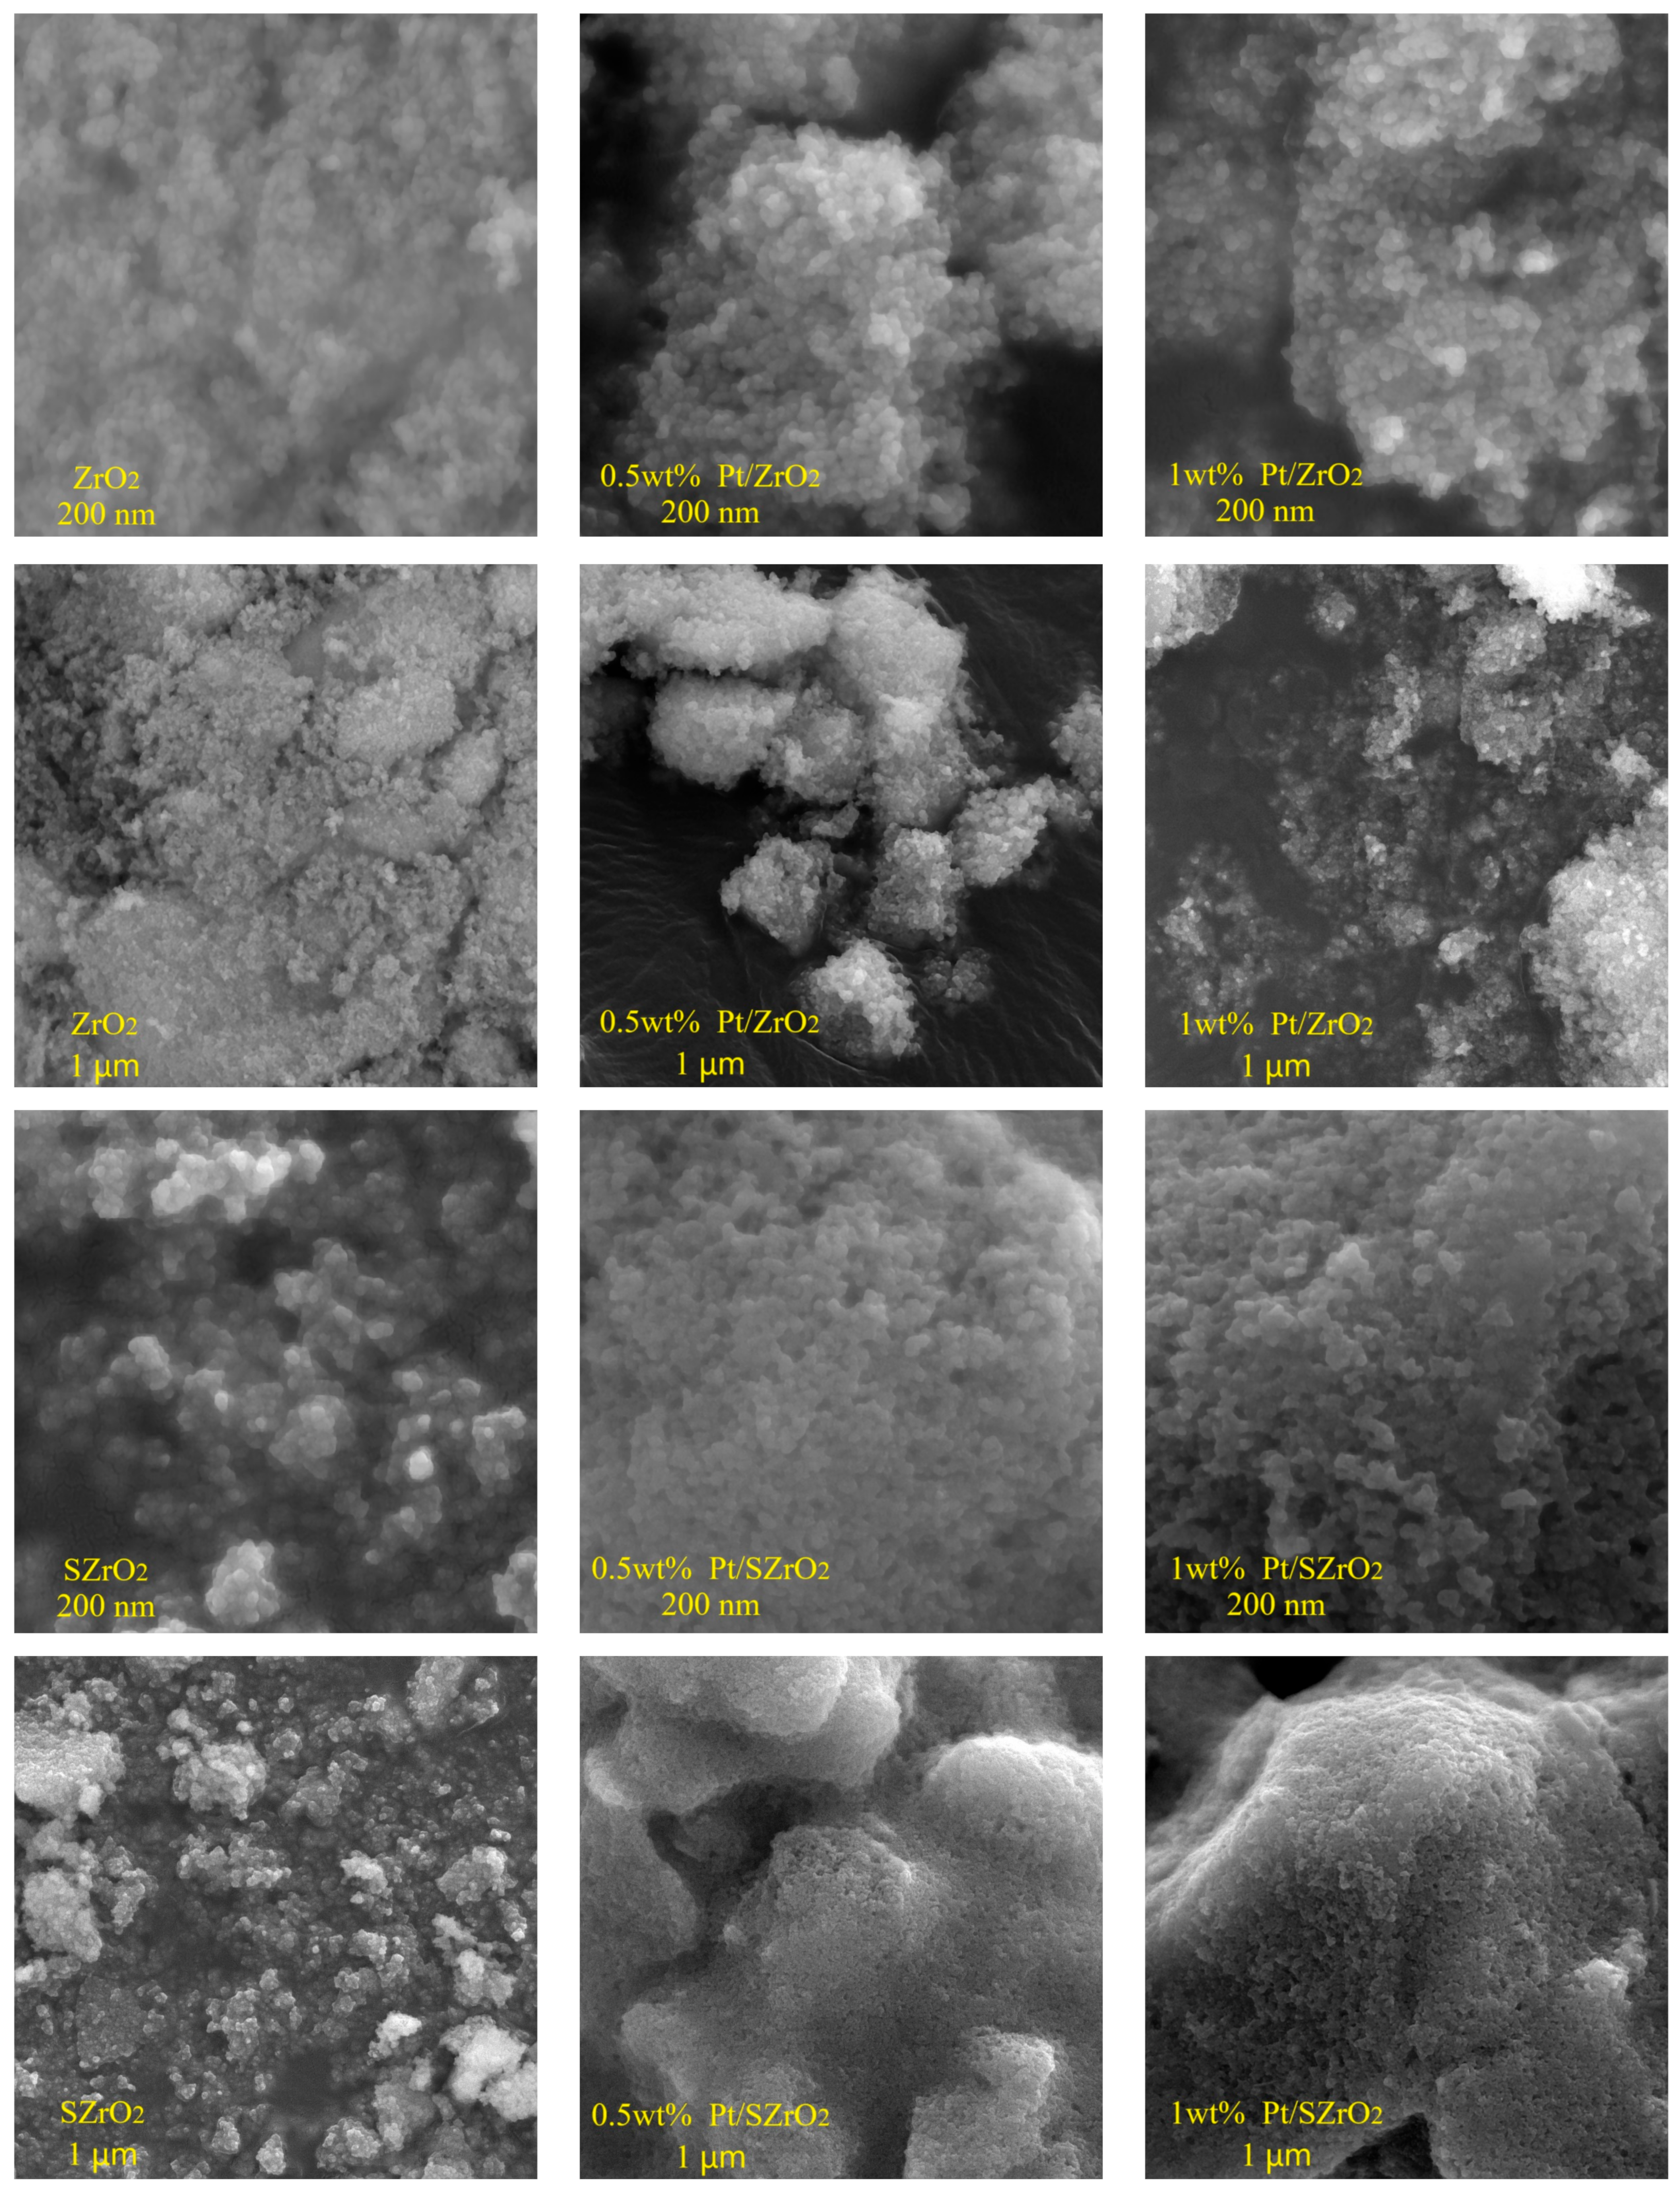
3.1.2. Scanning Electron Microscope Analysis
3.1.3. Energy Dispersive X-ray Analysis
3.1.4. BET-Surface Area Analysis
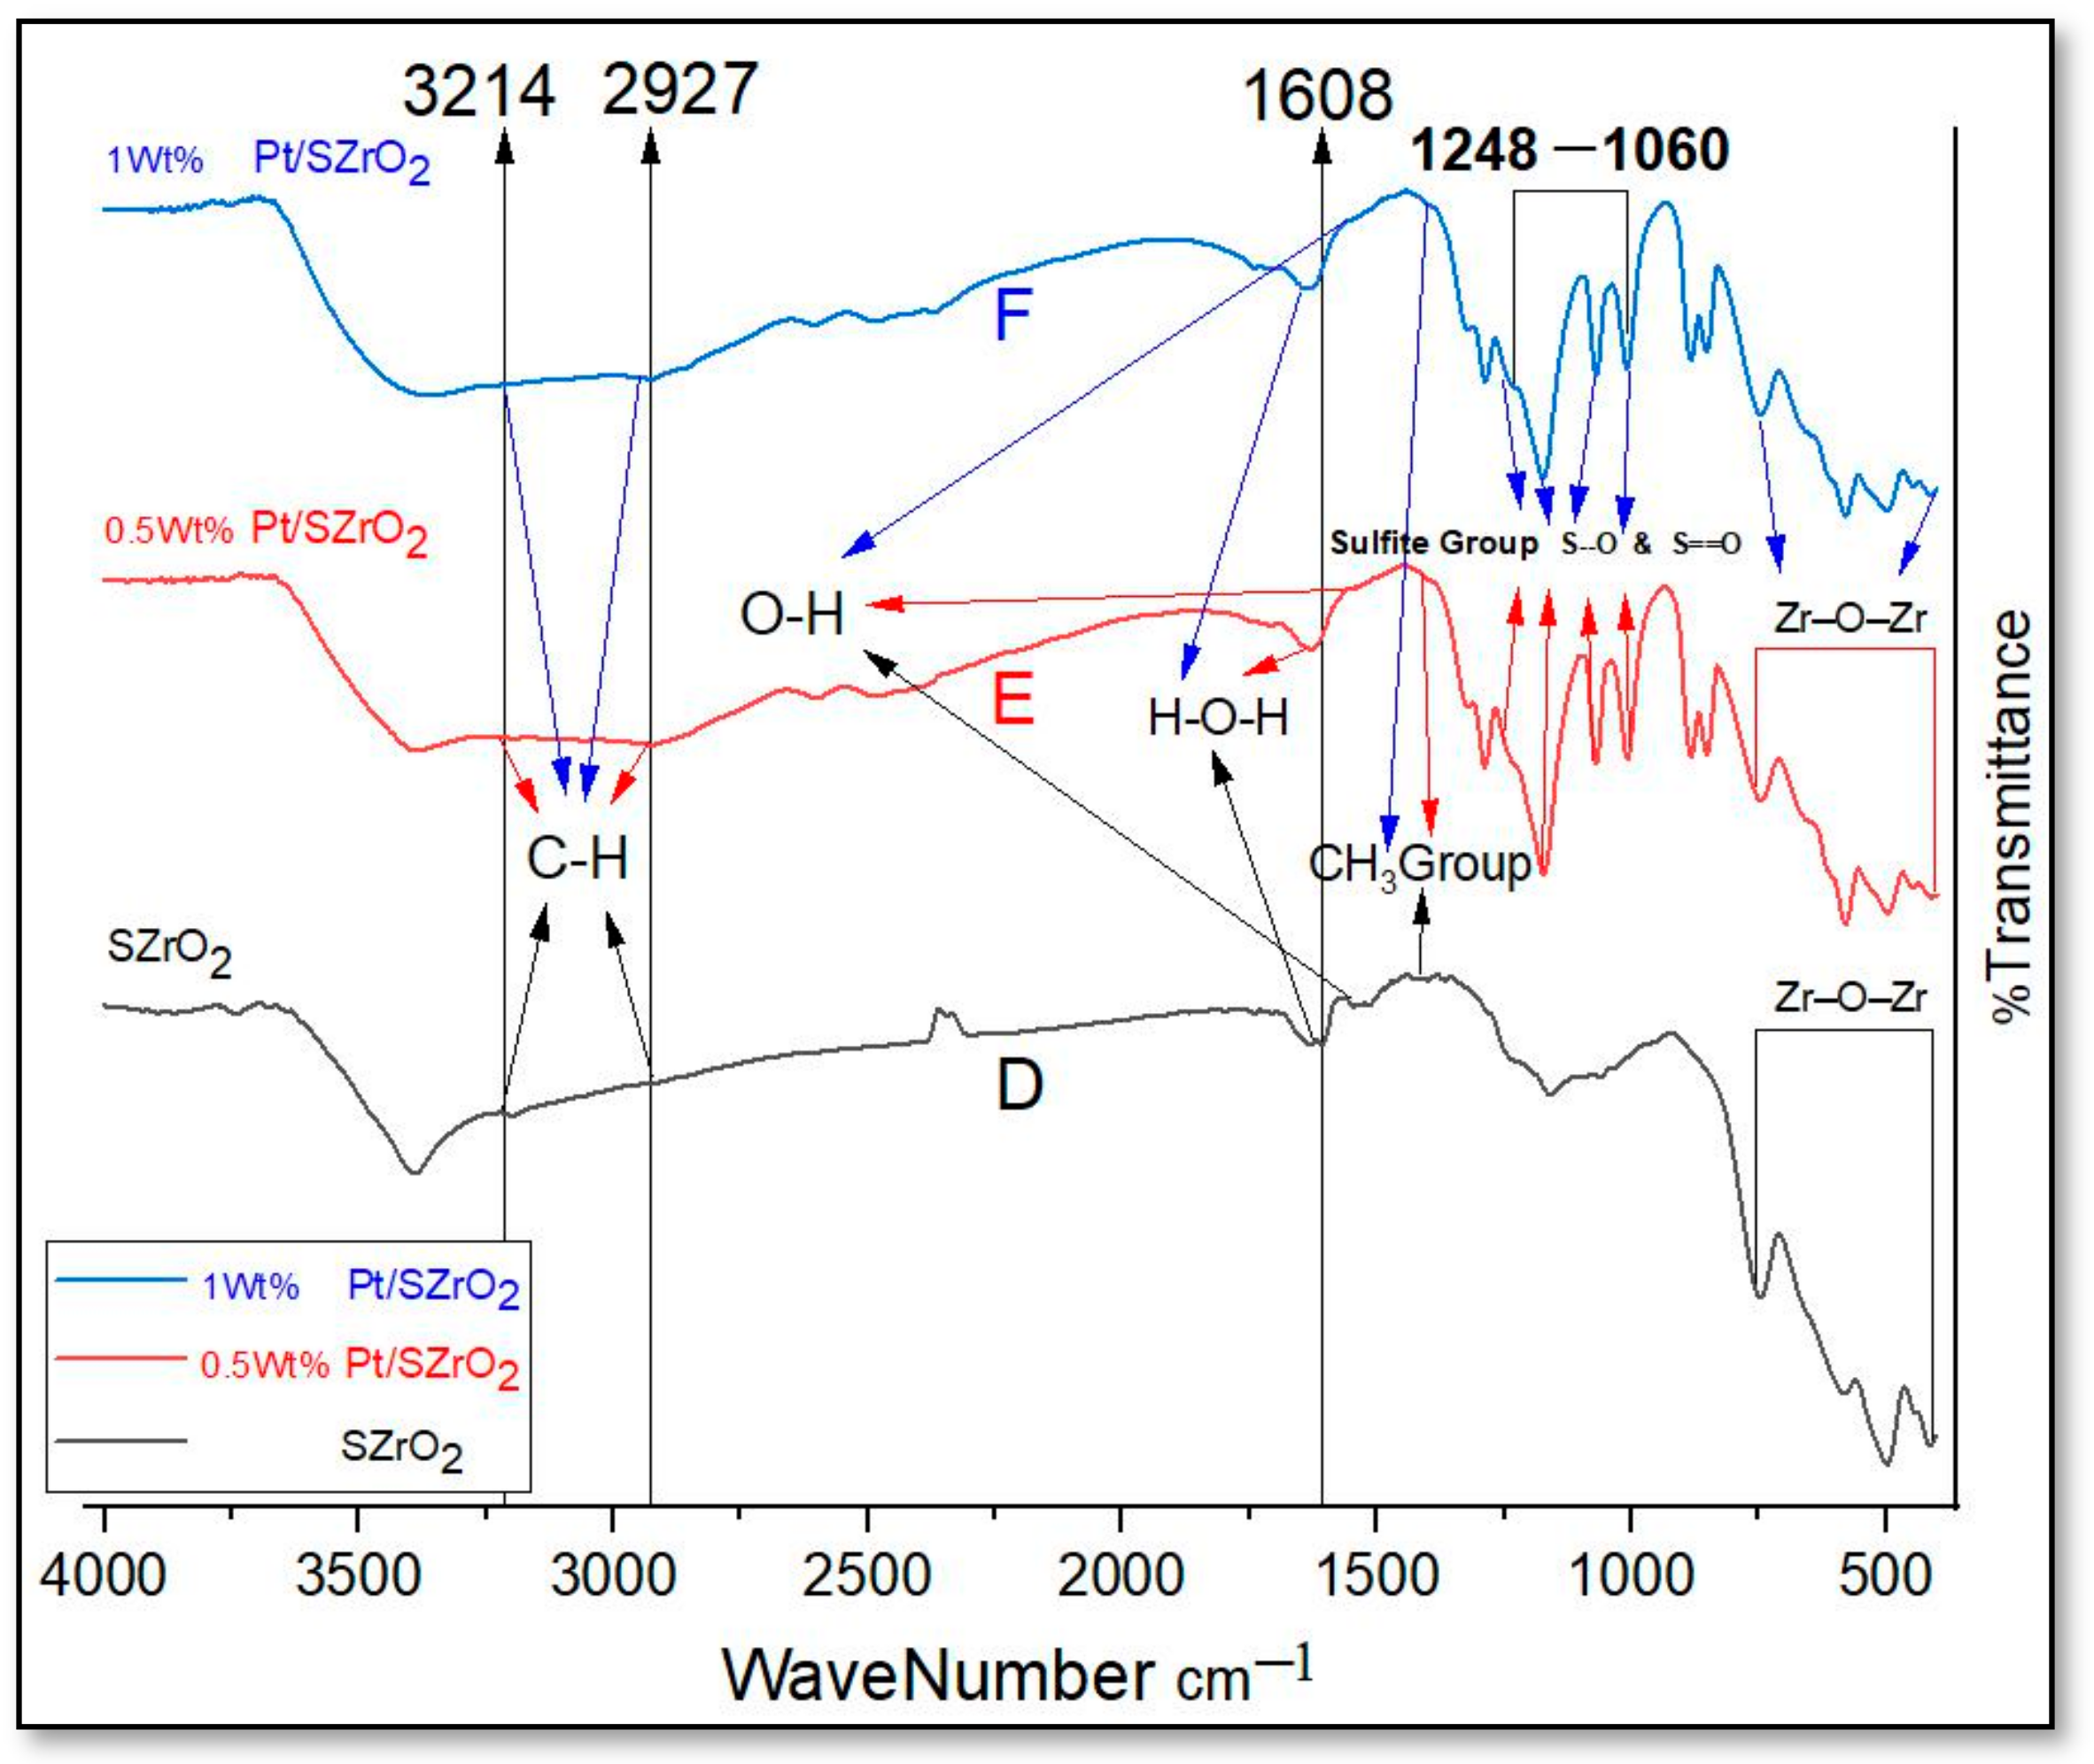
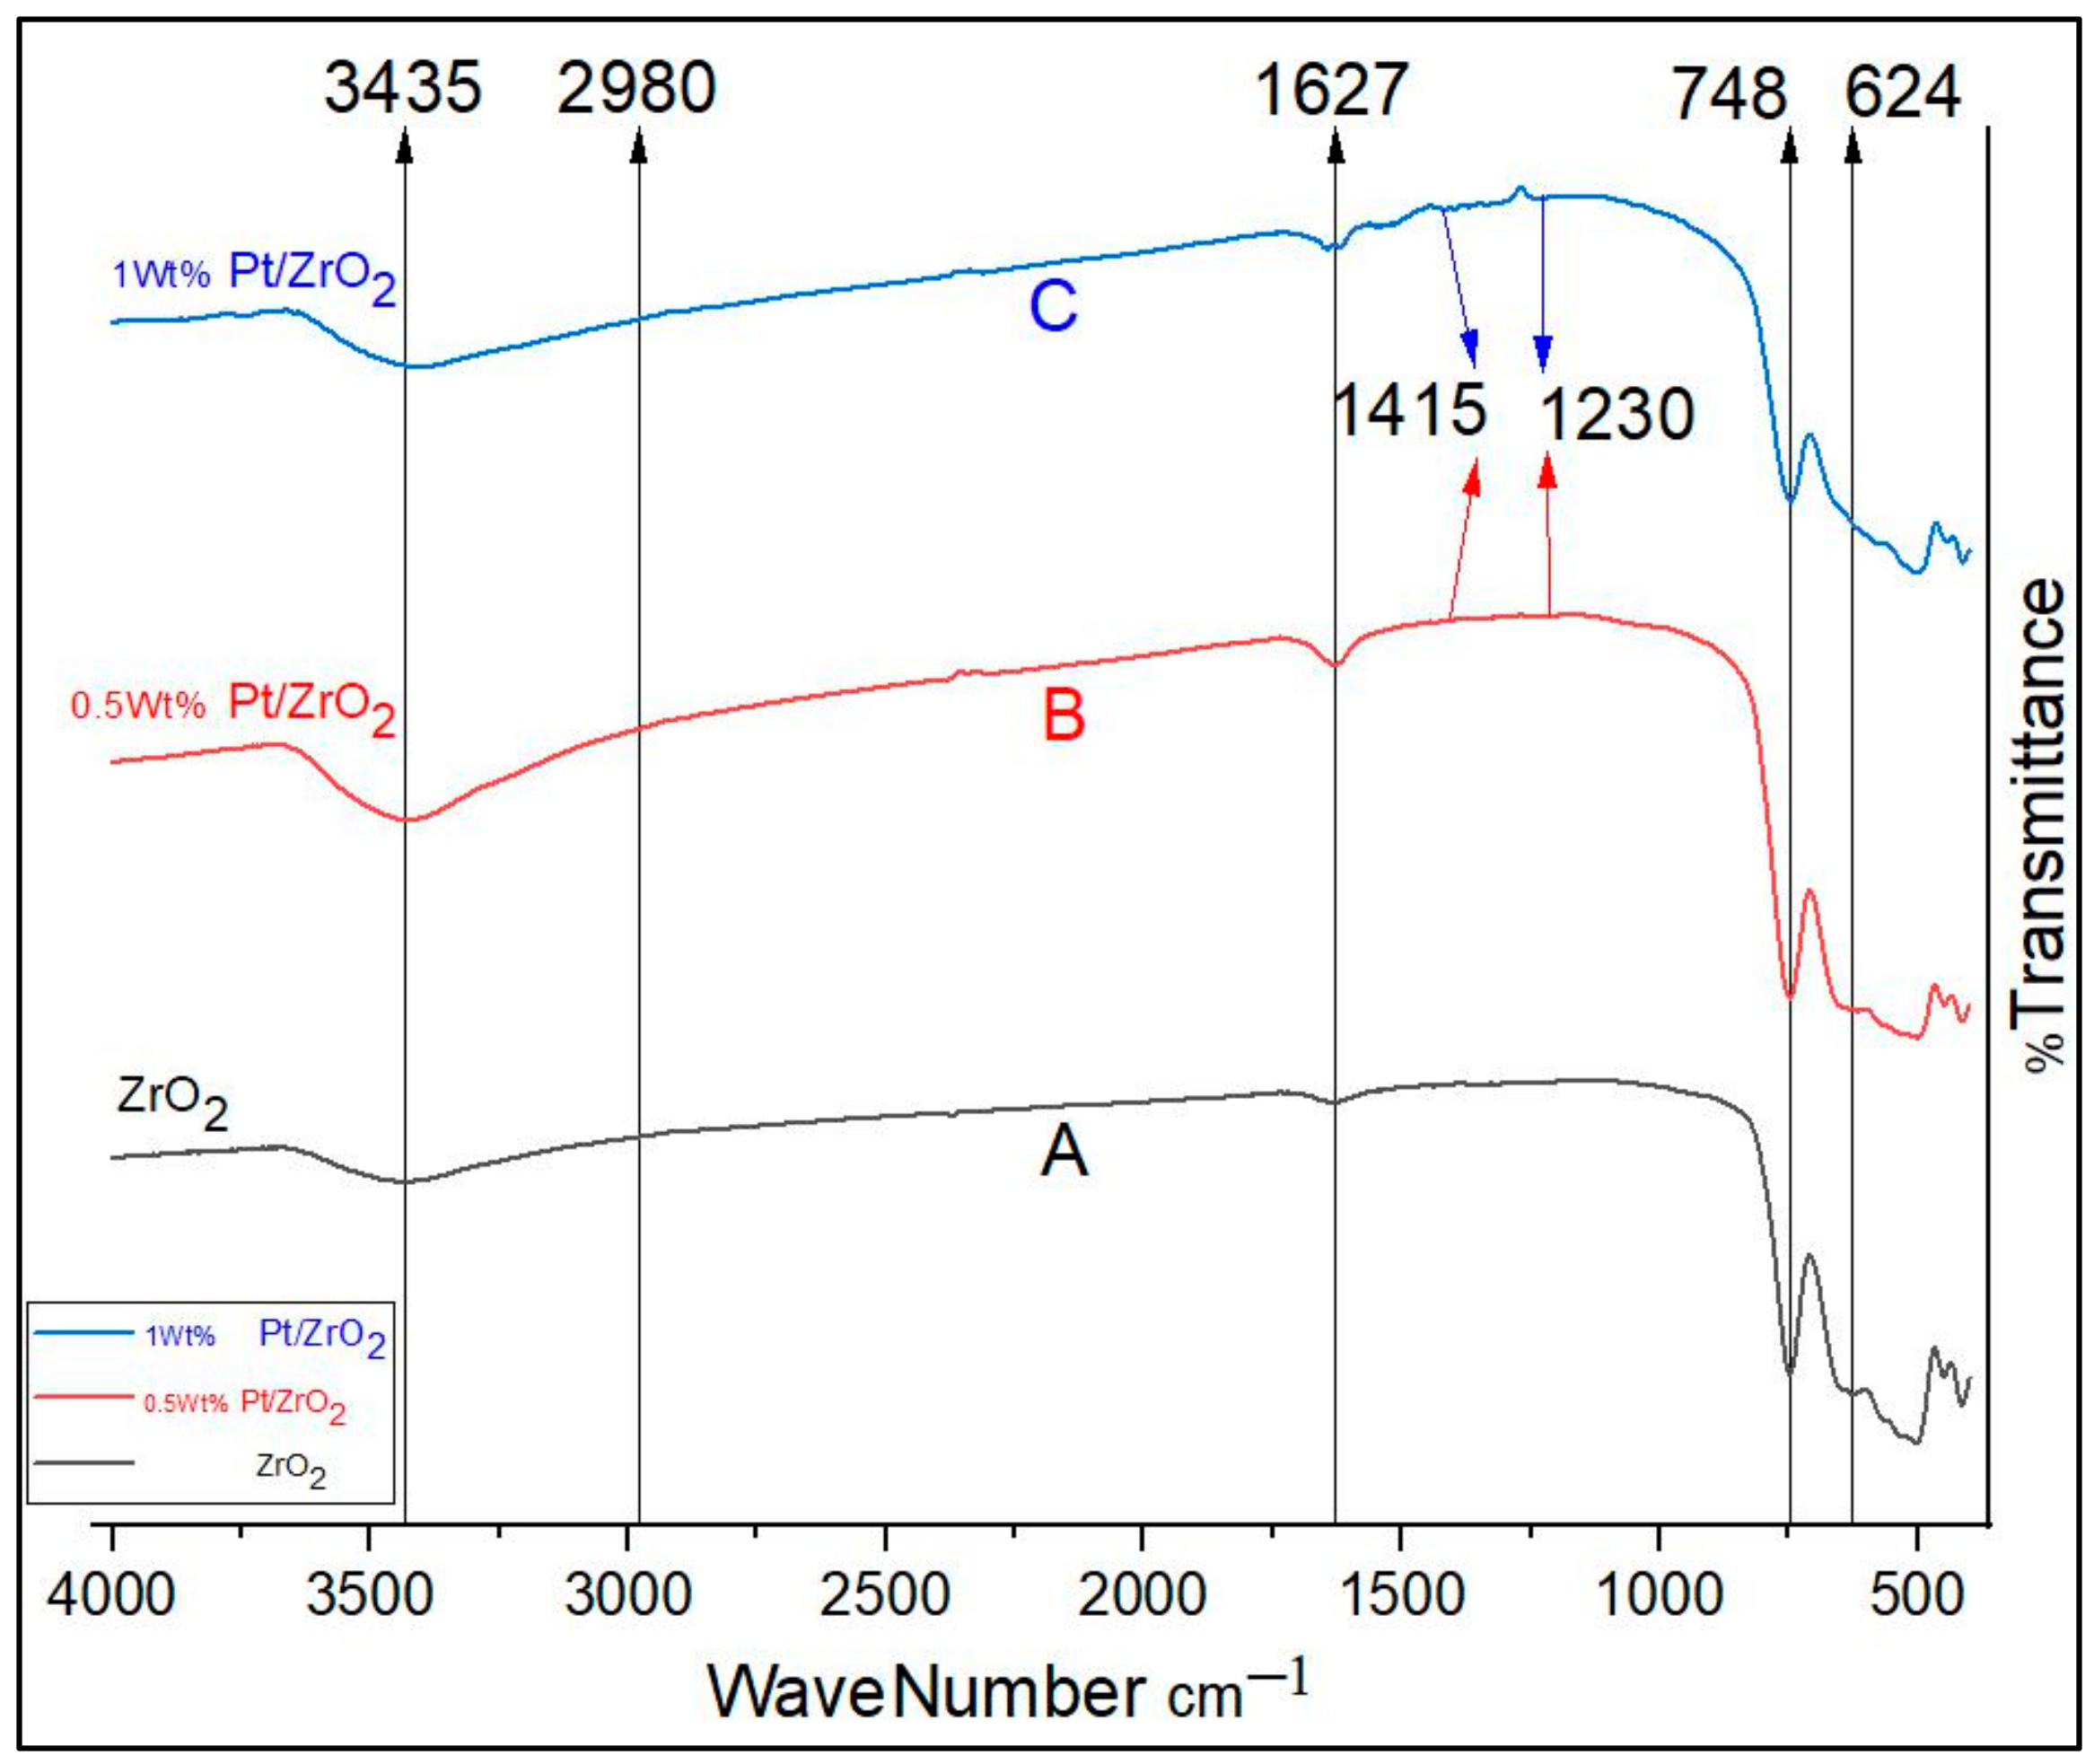
3.1.5. Fourier-Transformed Infrared Spectra Analysis
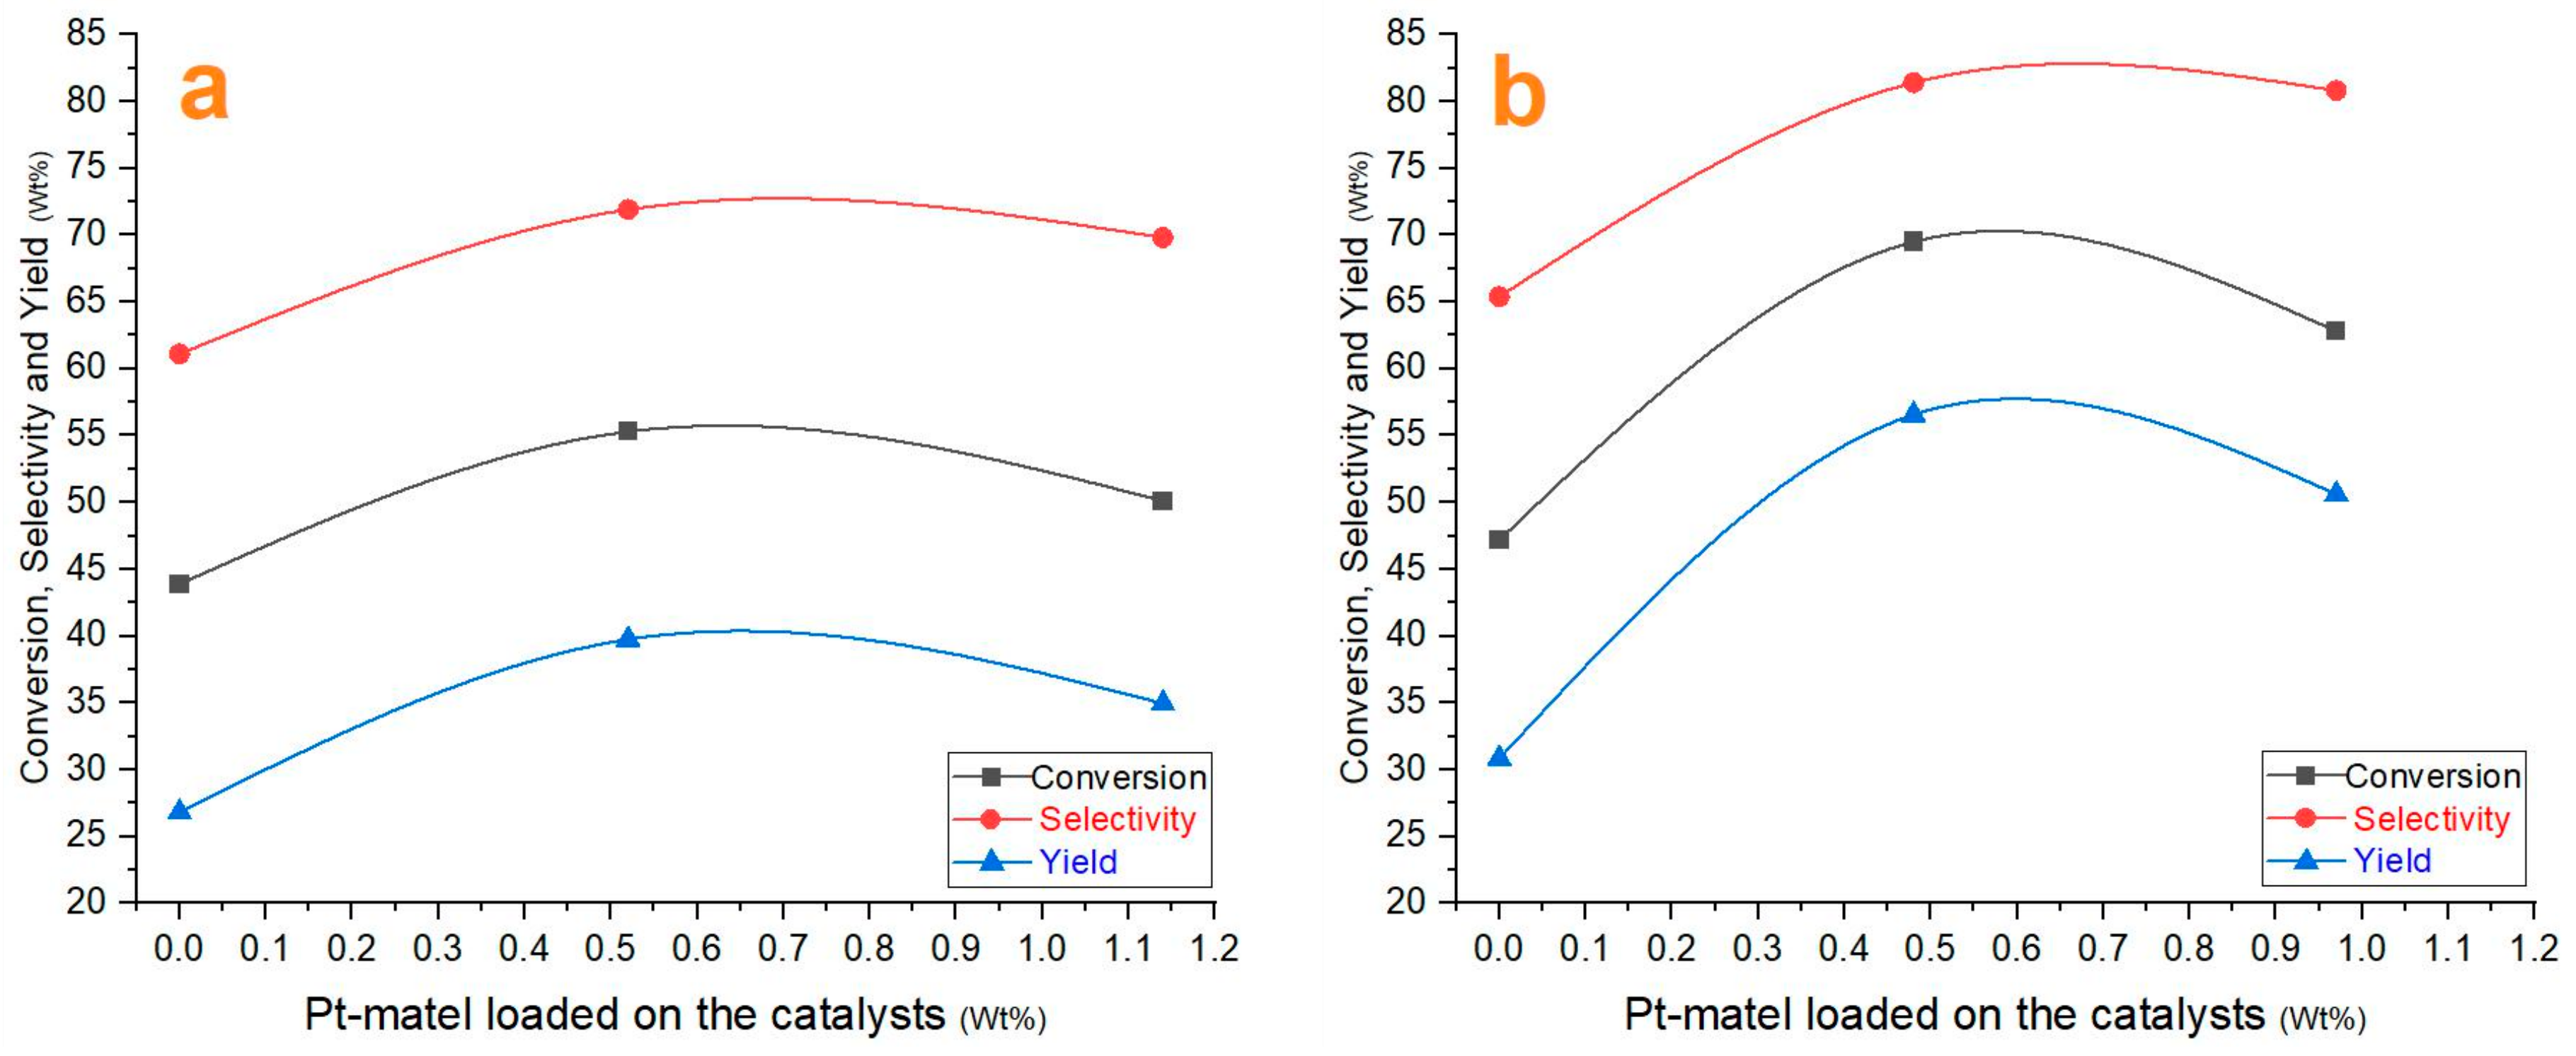
3.2. Results of Catalytic Hydroisomerization Reactions
4. Mathematical Modelling
4.1. Model Assumptions
- Steady state isothermal plug flow reactor.
- Homogeneous gas-phase reactions.
- First order reaction rate.
- Constant pressure (Neglecting pressure drop within catalyst bed).
- Neglecting the radial distribution within the reactor.
4.2. Proposed Reaction Scheme
4.3. Kinetic Model
4.4. Evaluation of Kinetic Parameters
4.5. Kinetic Modeling Results
5. Conclusions
Supplementary Materials
Author Contributions
Funding
Data Availability Statement
Acknowledgments
Conflicts of Interest
Nomenclature
| E | Activation energy (kJ/mol) |
| Fi | Molar flow rate of species i (mol/min) |
| Pre-exponential factor (mol/gmcat·Min·bar) | |
| ki | ith reaction rate (kmol min−1) |
| Partial pressure of ith component (bar) | |
| Pt | Total pressure (bar) |
| R | Universal gas constant (kJ/mol·K) |
| ri | Rate of reaction (mol/gmcat·min) |
| Si | Selectivity toward component i |
| Si,j | Stoichiometry of reaction |
| t | Time (min) |
| T | Temperature (K) |
| w | Weight of catalyst (gm) |
| y | Mole fraction |
| subscript | |
| exp | Experimental |
| i | Component number |
| j | Reaction number |
| pred | Predicted |
| N | Component number |
References
- Alemán-Vázquez, L.O.; Cano-Domínguez, J.L.; Torres-García, E.; Villagómez-Ibarra, J.R. Industrial aplication of catalytic systems for n-heptane isomerization. Molecules 2011, 16, 5916–5927. [Google Scholar] [CrossRef]
- Yadav, G.D.; Nair, J.J. Sulfated zirconia and its modified versions as promising catalysts for industrial processes. Microporous Mesoporous Mater. 1999, 33, 1–48. [Google Scholar] [CrossRef]
- Normair, C.J.; Goulding, P.A.; McAlpine, I. Role of anions in the surface area stabilisation of zirconia. Catal. Today 1994, 20, 313–321. [Google Scholar] [CrossRef]
- Song, X.; Sayari, A. Sulfated zirconia-based strong solid-acid catalysts: Recent progress. Catal. Rev. 1996, 38, 329–412. [Google Scholar] [CrossRef]
- Utami, M.; Wijaya, K.; Trisunaryanti, W. Effect of sulfuric acid treatment and calcination on commercial zirconia nanopowder. Key Eng. Mater. 2017, 757, 131–137. [Google Scholar] [CrossRef]
- Arata, K.; Hino, M.; Yamagata, N. Acidity and catalytic activity of zirconium and titanium sulfates heat-treated at high temperature. Solid superacid catalysts. Bull. Chem. Soc. Jpn. 1990, 63, 244–246. [Google Scholar] [CrossRef]
- Ardizzone, S.; Bianchi, C.L.; Cattagni, W.; Ragaini, V. Effects of the precursor features and treatments on the catalytic performance of SO4/ZrO2. Catal. Lett. 1997, 49, 193–198. [Google Scholar] [CrossRef]
- Busto, M.; Vera, C.R.; Grau, J.M. Optimal process conditions for the isomerization—Cracking of long-chain n-paraffins to high octane isomerizate gasoline over Pt/SO42-ZrO2 catalysts. Fuel Process. Technol. 2011, 92, 1675–1684. [Google Scholar] [CrossRef]
- Said, A.E.-A.A.; Abd El-Wahab, M.M.; Abd El-Aal, M. The catalytic performance of sulfated zirconia in the dehydration of methanol to dimethyl ether. J. Mol. Catal. A Chem. 2014, 394, 40–47. [Google Scholar] [CrossRef]
- Alemán-Vázquez, L.O.; Mariel-Reyes, P.R.; Cano-Domínguez, J.L. The effect of sulfates concentration in sulfated zirconia (SZ) catalysts n-heptane isomerization. Pet. Sci. Technol. 2010, 28, 374–381. [Google Scholar] [CrossRef]
- Zalewski, D.J.; Alerasool, S.; Doolin, P.K. Characterization of catalytically active sulfated zirconia. Catal. Today 1999, 53, 419–432. [Google Scholar] [CrossRef]
- Iglesia, E.; Soled, S.L.; Kramer, G.M. Isomerization of alkanes on sulfated zirconia: Promotion by Pt and by adamantyl hydride transfer species. J. Catal. 1993, 144, 238–253. [Google Scholar] [CrossRef]
- Grau, J.M.; Parera, J. Single and composite bifunctional catalysts of H-MOR or SO42-ZrO2 for n-octane hydroisomerization-cracking. Influence of the porosity of the acid component. Appl. Catal. A Gen. 1997, 162, 17–27. [Google Scholar] [CrossRef]
- Sayari, A.; Dicko, A. The state of platinum in Pt on sulfated zirconia superacid catalysts. J. Catal. 1994, 145, 561–564. [Google Scholar] [CrossRef]
- Vijay, S.; Wolf, E.E. A highly active and stable platinum-modified sulfated zirconia catalyst: 1. Preparation and activity for n-pentane isomerization. Appl. Catal. A Gen. 2004, 264, 117–124. [Google Scholar] [CrossRef]
- Comelli, R.A.; Finelli, Z.R.; Vaudagna, S.R.; Figoli, N.S. Hydroisomerization of n-hexane on Pt/SO42TMTM ZrO2: Effect of total and hydrogen partial pressure. Catal. Lett. 1997, 45, 227–231. [Google Scholar] [CrossRef]
- Song, Y.; Tian, J.; Ye, Y.; Jin, Y.; Zhou, X.; Wang, J.-A.; Xu, L. Effects of calcination temperature and water-washing treatment on n-hexane hydroisomerization behavior of Pt-promoted sulfated zirconia based catalysts. Catal. Today 2013, 212, 108–114. [Google Scholar] [CrossRef]
- Pfeifer, S.; Demirci, P.; Duran, R.; Stolpmann, H.; Renfftlen, A.; Nemrava, S.; Niewa, R.; Clauß, B.; Buchmeiser, M.R. Synthesis of zirconia toughened alumina (ZTA) fibers for high performance materials. J. Eur. Ceram. Soc. 2016, 36, 725–731. [Google Scholar] [CrossRef]
- Suseno, A.; Wijaya, K.; Trisunaryanti, W.; Shidiq, M. Synthesis and Characterization of ZrO2-Pillared Bentonites. Asian J. Chem. 2015, 27, 2619–2623. [Google Scholar] [CrossRef]
- Ejtemaei, M.; Tavakoli, A.; Charchi, N.; Bayati, B.; Babaluo, A.A.; Bayat, Y. Synthesis of sulfated zirconia nanopowders via polyacrylamide gel method. Adv. Powder Technol. 2014, 25, 840–846. [Google Scholar] [CrossRef]
- Tominaka, S.; Akiyama, N.; Croce, F.; Momma, T.; Scrosati, B.; Osaka, T. Sulfated zirconia nanoparticles as a proton conductor for fuel cell electrodes. J. Power Sources 2008, 185, 656–663. [Google Scholar] [CrossRef]
- Abu, I.I.; Das, D.D.; Mishra, H.K.; Dalai, A.K. Studies on platinum-promoted sulfated zirconia alumina: Effects of pretreatment environment and carrier gas on n-butane isomerization and benzene alkylation activities. J. Colloid Interface Sci. 2003, 267, 382–390. [Google Scholar] [CrossRef] [PubMed]
- Khalaf, Y.H.; Sherhan, B.Y.; Shakor, Z.M.; Al-Sheikh, F. Bimetallic Catalysts for Isomerization of Alkanes (A Review). Pet. Chem. 2023, 63, 829–843. [Google Scholar] [CrossRef]
- Jiang, H.; Ni, X.; Jiang, A.; Yang, G.; Wang, L. Increase of Zr-β zeolites Lewis acidity and insights into the reactivity enhancement. Catal. Commun. 2023, 183, 106777. [Google Scholar] [CrossRef]
- Oloye, F.F.; Aliyev, R.; Anderson, J.A. Hydroisomerisation of n-heptane over Pt/sulfated zirconia catalyst at atmospheric pressure. Fuel 2018, 222, 569–573. [Google Scholar] [CrossRef]
- AlKhafaji, K.S.; Shakor, Z.M.; Al-Zaidi, B.Y.; Hussein, S.J. Preparation and Characterization of Metakaolin-Based Catalysts for Gasoil Hydrodesulfurization Purposes. Arab. J. Sci. Eng. 2022, 47, 6283–6296. [Google Scholar] [CrossRef]
- Hwang, K.-R.; Ihm, S.-K.; Park, S.-C.; Park, J.-S. Pt/ZrO2 catalyst for a single-stage water-gas shift reaction: Ti addition effect. Int. J. Hydrogen Energy 2013, 38, 6044–6051. [Google Scholar] [CrossRef]
- Al-Iessa, M.S.; Al-Zaidi, B.Y.; Almukhtar, R.S.; Shakor, Z.M.; Hamawand, I. Optimization of Polypropylene Waste Recycling Products as Alternative Fuels through Non-Catalytic Thermal and Catalytic Hydrocracking Using Fresh and Spent Pt/Al2O3 and NiMo/Al2O3 Catalysts. Energies 2023, 16, 4871. [Google Scholar] [CrossRef]
- Khalaf, Y.H.; Sherhan, B.Y.; Zaidoon, M. Hydroisomerization of n-Heptane in a Fixed-Bed Reactor Using a Synthesized Bimetallic Type-HY Zeolite Catalyst. Eng. Technol. J. 2022, 40, 1158–1170. [Google Scholar] [CrossRef]
- Al-Iessa, M.S.; Almukhtar, R.S.; Sherhan, B.Y. Experimental study for converting the HDPE wastes into valuable fuel. AIP Conf. Proc. 2023, 2820, 030016. [Google Scholar]
- Vijay, S.; Wolf, E.E.; Miller, J.T.; Kropf, A.J. A highly active and stable platinum-modified sulfated zirconia catalyst: Part 2. EXAFS studies of the effect of pretreatment on the state of platinum. Appl. Catal. A Gen. 2004, 264, 125–130. [Google Scholar] [CrossRef]
- Ait Rass, H.; Essayem, N.; Besson, M. Selective aerobic oxidation of 5-HMF into 2,5-furandicarboxylic acid with Pt catalysts supported on TiO2-and ZrO2-based supports. ChemSusChem 2015, 8, 1206–1217. [Google Scholar] [CrossRef]
- Tang, Z.; Liu, P.; Cao, H.; Bals, S.; Heeres, H.J.; Pescarmona, P.P. Pt/ZrO2 prepared by atomic trapping: An efficient catalyst for the conversion of glycerol to lactic acid with concomitant transfer hydrogenation of cyclohexene. ACS Catal. 2019, 9, 9953–9963. [Google Scholar] [CrossRef] [PubMed]
- Khalaf, Y.H.; Sherhan Al-Zaidi, B.Y.; Shakour, Z.M. Experimental and Kinetic Study of the Effect of using Zr-and Pt-loaded Metals on Y-zeolite-based Catalyst to Improve the Products of n-heptane Hydroisomerization Reactions. Orbital 2022, 14, 153–167. [Google Scholar] [CrossRef]
- Saeed, A.Q.; Al-Zaidi, B.Y.; Hamadi, A.S.; Majdi, H.S.; AbdulRazak, A.A. Upgrade of heavy crude oil via aquathermolysis over several types of catalysts. Mater. Express 2022, 12, 278–287. [Google Scholar] [CrossRef]
- Al-Zaidi, B.Y.S. The Effect of Modification Techniques on the Performance of Zeolite-y Catalysts in Hydrocarbon Cracking Reactions. Ph.D. Thesis, University of Manchester, Manchester, UK, 31 December 2011. [Google Scholar]
- Sohail Ahmad, M.; Sadiq, M.; Aman, R. Potent heterogeneous catalyst for low temperature selective oxidation of cyclohexanol by molecular oxygen. J. Chem. 2016, 2016, 1254796. [Google Scholar]
- Saeed, K.; Sadiq, M.; Khan, I.; Ullah, S.; Ali, N.; Khan, A. Synthesis, characterization, and photocatalytic application of Pd/ZrO 2 and Pt/ZrO2. Appl. Water Sci. 2018, 8, 60. [Google Scholar] [CrossRef]
- Aboul-Gheit, A.K.; El-Desouki, D.S.; Abdel-Hamid, S.M.; Ghoneim, S.A.; Ibrahim, A.H.; Gad, F.K. Sulfated zirconia catalysts for low temperature isomerization of n-pentane. Egypt. J. Chem 2012, 55, 509–527. [Google Scholar]
- Singhania, A.; Gupta, S.M. Nanocrystalline ZrO2 and Pt-doped ZrO2 catalysts for low-temperature CO oxidation. Beilstein J. Nanotechnol. 2017, 8, 264–271. [Google Scholar] [CrossRef]
- Yakout, S.M.; Hassan, H.S. Adsorption characteristics of sol gel-derived zirconia for cesium ions from aqueous solutions. Molecules 2014, 19, 9160–9172. [Google Scholar] [CrossRef]
- Sekewael, S.J.; Pratika, R.A.; Hauli, L.; Amin, A.K.; Utami, M.; Wijaya, K. Recent progress on sulfated nanozirconia as a solid acid catalyst in the hydrocracking reaction. Catalysts 2022, 12, 191. [Google Scholar] [CrossRef]
- Zhai, Y.; Zhang, H.; Hu, J.; Yi, B. Preparation and characterization of sulfated zirconia (SO42-/ZrO2)/Nafion composite membranes for PEMFC operation at high temperature/low humidity. J. Memb. Sci. 2006, 280, 148–155. [Google Scholar] [CrossRef]
- Reddy, B.M.; Patil, M.K. Organic syntheses and transformations catalyzed by sulfated zirconia. Chem. Rev. 2009, 109, 2185–2208. [Google Scholar] [CrossRef] [PubMed]
- Hsu, Y.-S.; Wang, Y.-L.; Ko, A.-N. Effect of sulfation of zirconia on catalytic performance in the dehydration of aliphatic alcohols. J. Chin. Chem. Soc. 2009, 56, 314–322. [Google Scholar] [CrossRef]
- Utami, M.; Trisunaryanti, W.; Shida, K.; Tsushida, M.; Kawakita, H.; Ohto, K.; Wijaya, K.; Tominaga, M. Hydrothermal preparation of a platinum-loaded sulphated nanozirconia catalyst for the effective conversion of waste low density polyethylene into gasoline-range hydrocarbons. RSC Adv. 2019, 9, 41392–41401. [Google Scholar] [CrossRef] [PubMed]
- Sang, X.; Zhang, L.; Wang, H.; He, D.; Deng, L.; Huang, S.; Wang, J.; Luo, Y. Influence of synthetic parameters on structural and catalytic properties of sulfated zirconia nanoparticles prepared by employing sulfate-containing anion surfactants via one-step route. Powder Technol. 2014, 253, 590–595. [Google Scholar] [CrossRef]
- Mossayebi, Z.; Saririchi, T.; Rowshanzamir, S.; Parnian, M.J. Investigation and optimization of physicochemical properties of sulfated zirconia/sulfonated poly (ether ether ketone) nanocomposite membranes for medium temperature proton exchange membrane fuel cells. Int. J. Hydrogen Energy 2016, 41, 12293–12306. [Google Scholar] [CrossRef]
- Al-Shathr, A.; Al-Zaidi, B.Y.; Shehab, A.K.; Shakoor, Z.M.; Aal-Kaeb, S.; Gomez, L.Q.; Majdi, H.S.; Al-Shafei, E.N.; AbdulRazak, A.A.; McGregor, J. Experimental and kinetic studies of the advantages of coke accumulation over Beta and Mordenite catalysts according to the pore mouth catalysis hypothesis. Catal. Commun. 2023, 181, 106718. [Google Scholar] [CrossRef]
- Jiang, F.; Zeng, L.; Li, S.; Liu, G.; Wang, S.; Gong, J. Propane dehydrogenation over Pt/TiO2–Al2O3 catalysts. ACS Catal. 2015, 5, 438–447. [Google Scholar] [CrossRef]
- Benesi, H.A.; Curtis, R.M.; Studer, H.P. Preparation of highly dispersed catalytic metals: Platinum supported on silica gel. J. Catal. 1968, 10, 328–335. [Google Scholar] [CrossRef]
- Sinfelt, J.H.; Hurwitz, H.; Rohrer, J.C. Kinetics of n-pentane isomerization over Pt-Al2O3 catalyst. J. Phys. Chem. 1960, 64, 892–894. [Google Scholar] [CrossRef]
- Khurshid, M.; Al-Khattaf, S.S. n-Heptane isomerization over Pt/WO3-ZrO2: A kinetic study. Appl. Catal. A Gen. 2009, 368, 56–64. [Google Scholar] [CrossRef]
- Tan, Y.; Hu, W.; Du, Y.; Li, J. Species and impacts of metal sites over bifunctional catalyst on long chain n-alkane hydroisomerization: A review. Appl. Catal. A Gen. 2021, 611, 117916. [Google Scholar] [CrossRef]
- Kooh, A.B.; Han, W.-J.; Hicks, R.F. Kinetics of heptane reforming on Pt/L zeolite. Catal. Lett. 1993, 18, 209–218. [Google Scholar] [CrossRef]
- Potter, M.E.; Le Brocq, J.J.M.; Oakley, A.E.; McShane, E.B.; Vandegehuchte, B.D.; Raja, R. Butane isomerization as a diagnostic tool in the rational design of solid acid catalysts. Catalysts 2020, 10, 1099. [Google Scholar] [CrossRef]
- Ribeiro, F.; Marcilly, C.; Guisnet, M. Hydroisomerization of n-hexane on platinum zeolites. I. Kinetic study of the reaction on platinum/Y-zeolite catalysts: Influence of the platinum content. J. Catal. 1982, 78, 267–274. [Google Scholar] [CrossRef]
- Saito, M.; Iwasaki, T. Isomerization of Pentanes on Platinum/Rare Earths-Hydrogen-Zeolite Y Catalysts. Bull. Japan Pet. Inst. 1976, 18, 117–126. [Google Scholar] [CrossRef]
- Ribeiro, F.R. Use of platinum HY zeolite and platinum H mordenite in the hydroisomerization of n-hexane. In Zeolites: Science Technology; Springer: Berlin/Heidelberg, Germany, 1984; pp. 545–569. [Google Scholar]
- Aammer, H.; Shakor, Z.M.; Al-Sheikh, F.; Al-Naimi, S.A.; Anderson, W.A. Simulation and optimization of the ethane cracking furnace using ASPEN PLUS and MATLAB: A case study from petrochemical complexes. Combust. Sci. Technol. 2023, 195, 2634–2654. [Google Scholar] [CrossRef]
- Shakor, Z.M.; Ramos, M.J.; AbdulRazak, A.A. A detailed reaction kinetic model of light naphtha isomerization on Pt/zeolite catalyst. J. King Saud Univ. Sci. 2022, 34, 303–308. [Google Scholar] [CrossRef]
- Soustelle, M. An Introduction to Chemical Kinetics; John Wiley & Sons: Hoboken, NJ, USA, 2011. [Google Scholar]
- Al-Zaidi, B.Y.; Al-Shathr, A.; Shehab, A.K.; Shakor, Z.M.; Majdi, H.S.; AbdulRazak, A.A.; McGregor, J. Hydroisomerisation and Hydrocracking of n-Heptane: Modelling and Optimisation Using a Hybrid Artificial Neural Network-Genetic Algorithm (ANN-GA). Catalysts 2023, 13, 1125. [Google Scholar] [CrossRef]


| No. | Material | Composition | Company | Origin | Purity |
|---|---|---|---|---|---|
| 1 | Zirconium Oxide Nanoparticles | ZrO2 | US Research Nanomaterials, Inc | USA | 99.+% |
| 2 | Hydro-HexachloroPlatinic Acid | (H2 PtCl6)·6H2O | Direvo Industrial Biotechnology | Germany | 99% |
| 3 | n-Heptane | CH3(CH2)5CH3 | J.T. Baker | USA | 99% |
| 4 | Sulfuric Acid | H2SO4 | J.T. Baker | USA | 98% |
| 5 | Hydrogen Gas | H2 | Petroleum Research and Development Center | Iraq | 99.9% |
| 6 | Deionized Water | H2O | University of Technology—Baghdad | Iraq | 99.99% |
| No. | Catalyst Code | Catalysts Type |
|---|---|---|
| 1 | Cat-1 | Unsulfated Zirconium Oxide; [ZrO2] |
| 2 | Cat-2 | [ZrO2] loaded with 0.5% Pt; [0.5% Pt/ZrO2] |
| 3 | Cat-3 | [ZrO2] loaded with 1% Pt, [1% Pt/ZrO2] |
| 4 | Cat-4 | Sulfated Zirconium Oxide; [SZrO2] |
| 5 | Cat-5 | [SZrO2] loaded with 0.5% Pt; [0.5% Pt/SZrO2] |
| 6 | Cat-6 | [SZrO2] loaded with 1% Pt, [1% Pt/SZrO2] |
| No. | Catalysts Type | Measured Surface Area (m2/g) | Pore Volume (cm3/g) |
|---|---|---|---|
| 1 | ZrO2 | 35.55 | 0.123 |
| 2 | ZrO2 loaded with 0.5% Pt | 30.73 | 0.106 |
| 3 | ZrO2 loaded with 1% Pt | 30.21 | 0.104 |
| 4 | SZrO2 | 24.00 | 0.068 |
| 5 | SZrO2 loaded with 0.5% Pt | 20.98 | 0.059 |
| 6 | SZrO2 loaded with 1% Pt | 19.72 | 0.056 |
| Catalysts | Cat-1 | Cat-2 | Cat-3 | Cat-4 | Cat-5 | Cat-6 |
|---|---|---|---|---|---|---|
| Conversion | 43.9 | 55.3 | 50.1 | 47.2 | 69.64 | 62.8 |
| Selectivity | 61.1 | 71.9 | 69.8 | 65.4 | 81.4 | 80.8 |
| Yield | 26.82 | 39.76 | 34.96 | 30.86 | 56.68 | 50.74 |
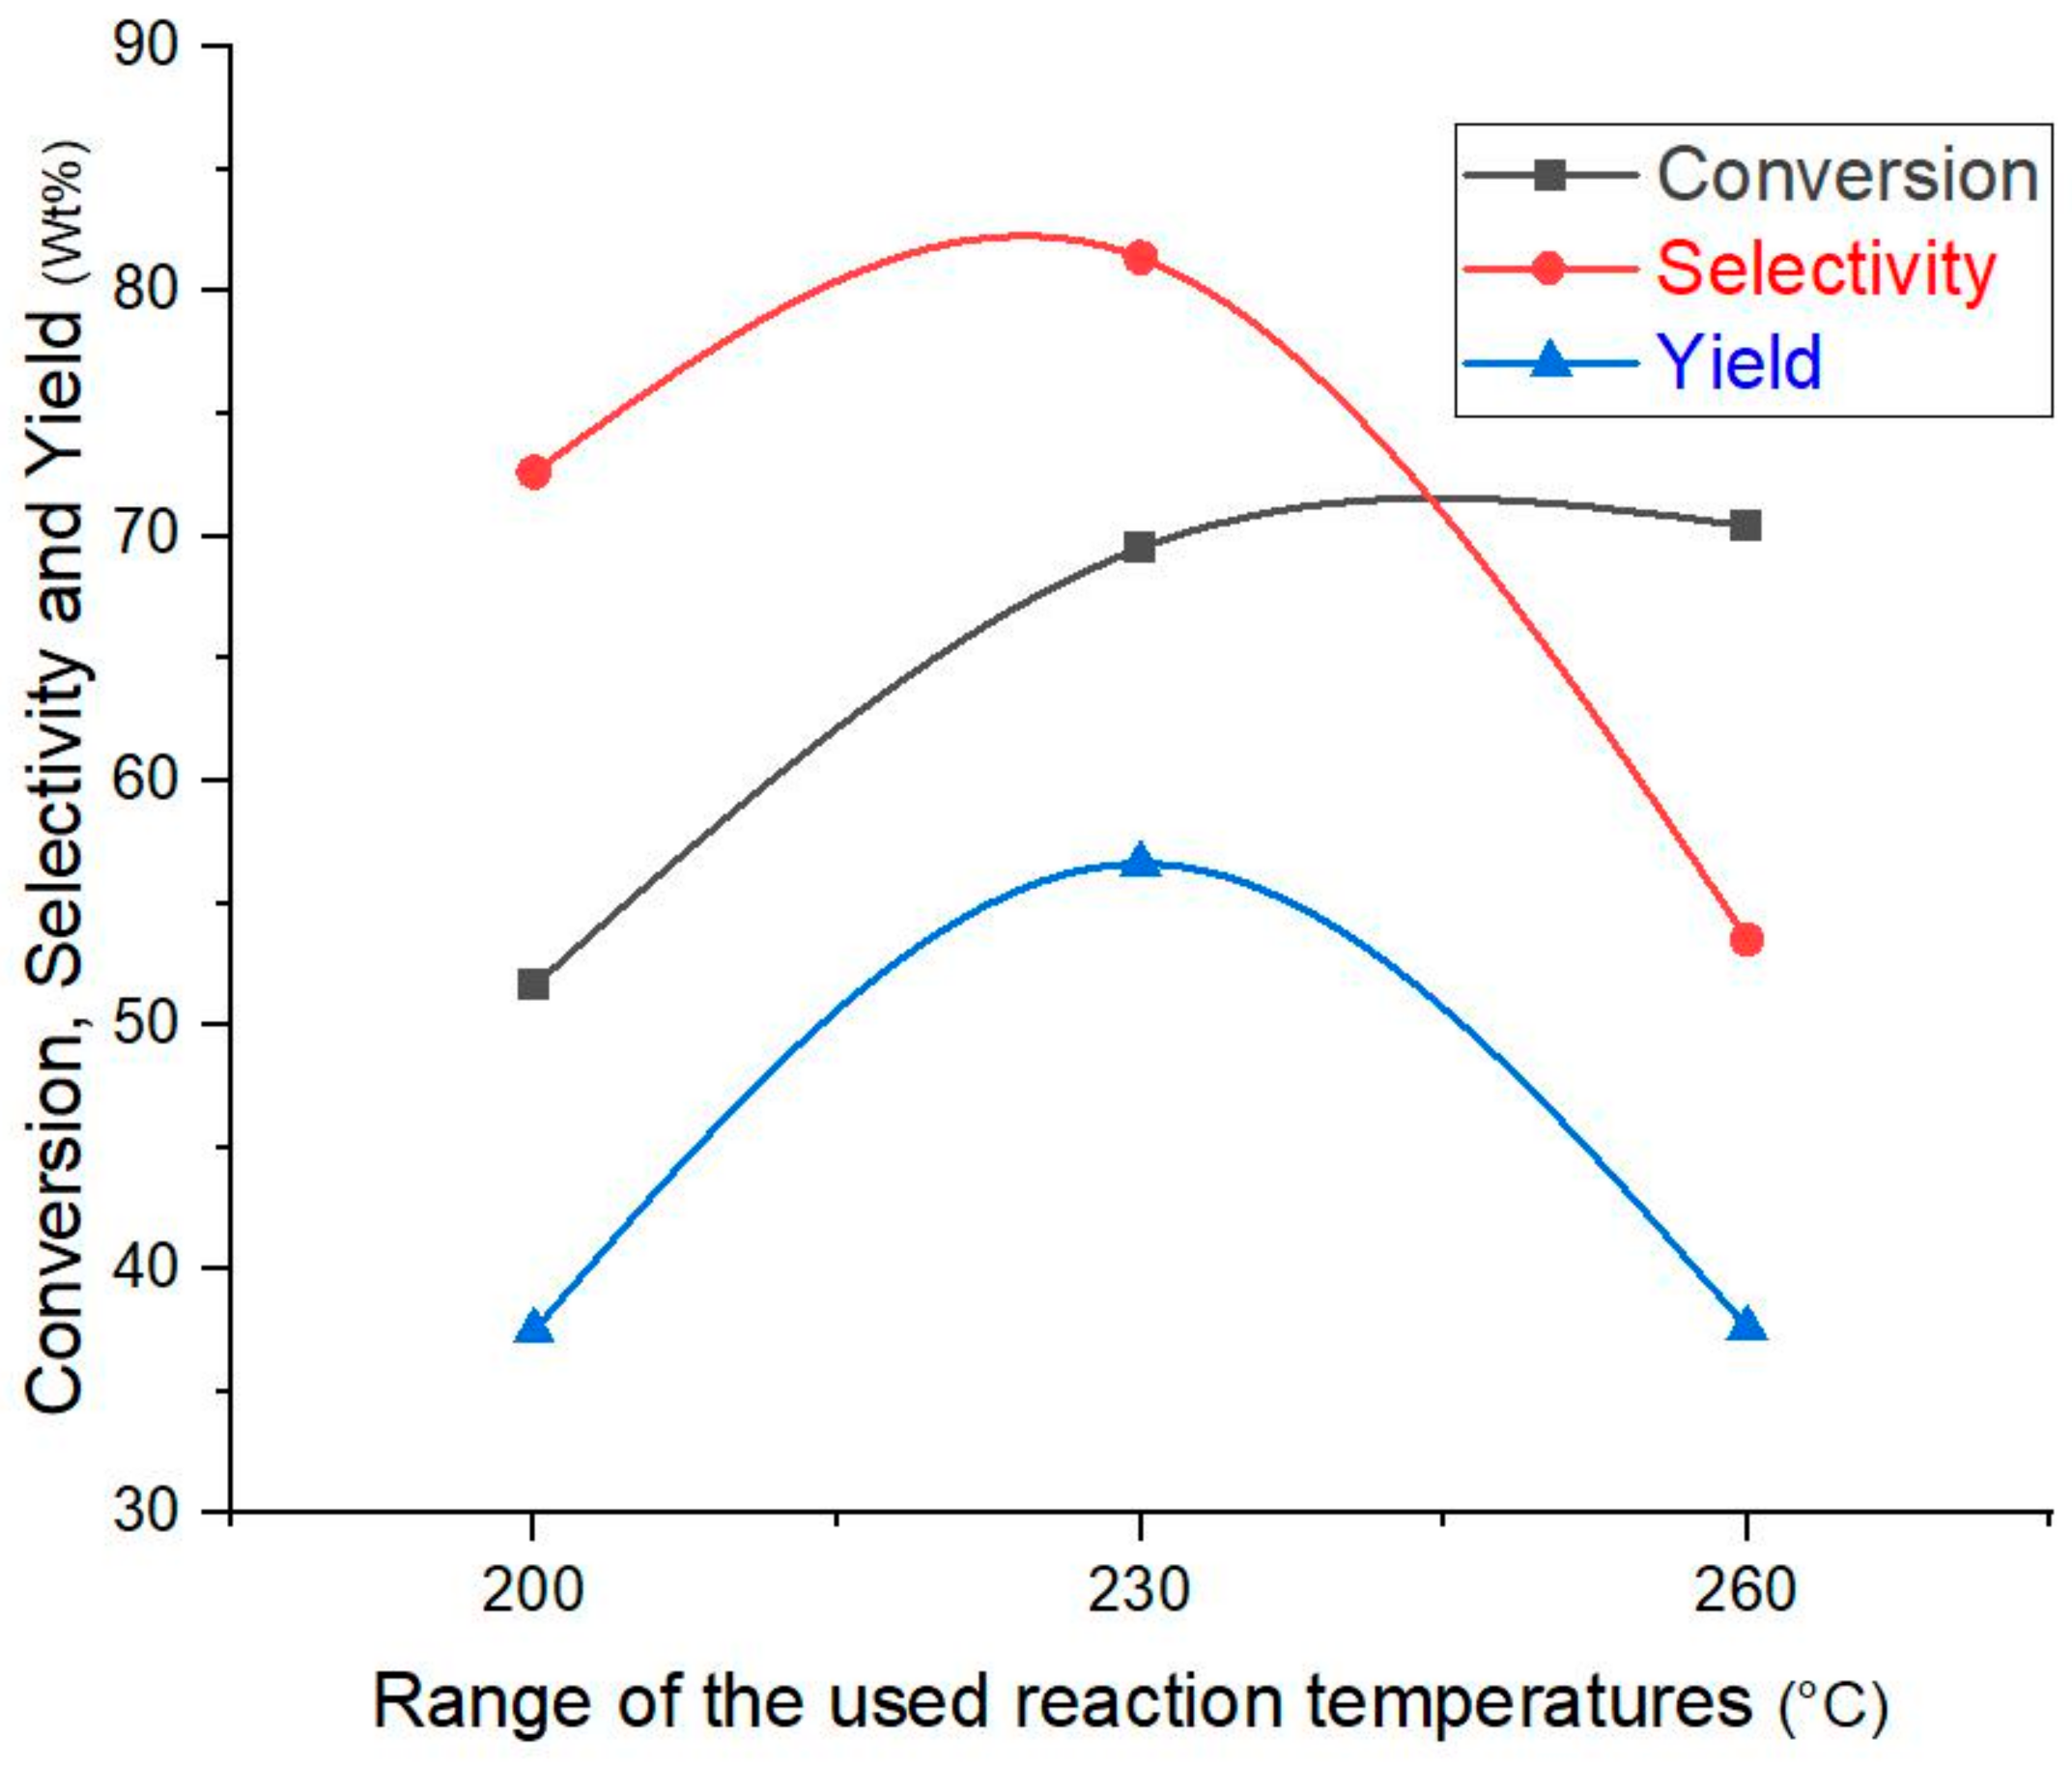
| Temperatures | 200 °C | 230 °C | 260 °C |
|---|---|---|---|
| Conversion | 51.61 | 69.50 | 70.35 |
| Selectivity | 72.62 | 81.56 | 53.51 |
| Yield | 37.48 | 56.68 | 37.64 |
| No. | Reaction | Chemical Reaction | |
|---|---|---|---|
| 1 | Dehydrogenation of n-pentane | n-C5H12 → C5H10 + H2 | Hydrogenation/Dehydrogenation Reactions |
| 2 | Hydrogenation of pentene | C5H10 +H2 → n-C5H12 | |
| 3 | Dehydrogenation of n-butane | n-C4H10 → C4H8 + H2 | |
| 4 | Hydrogenation of butene | C4H8 +H2 → n-C4H10 | |
| 5 | Dehydrogenation of propane | n-C3H8 → C3H6 + H2 | |
| 6 | Hydrogenation of propene | C3H6 + H2 → C3H8 | |
| 7 | Skeletal hydroisomerisation of n-heptane | n-C7H16 → i-C7H16 | Hydroisomerization Reactions |
| 8 | Skeletal hydroisomerisation of i-heptane | i-C7H16 → n-C7H16 | |
| 9 | Skeletal hydroisomerisation of n-hexane | n-C6H14 → i-C6H14 | |
| 10 | Skeletal hydroisomerisation of i-hexane | i-C6H14 → n-C6H14 | |
| 11 | Skeletal hydroisomerisation of n-pentane | n-C5H12 → i-C5H12 | |
| 12 | Skeletal hydroisomerisation of i-pentane | i-C5H12 → n-C5H12 | |
| 13 | Skeletal hydroisomerisation of n-butane | n-C4H10 → i-C4H10 | |
| 14 | Skeletal hydroisomerisation of i-butane | i-C4H10 → n-C4H10 | |
| 15 | Hydrocracking of heptane | C7H16 + H2 → CH4 + C6H14 | Hydrocracking Reactions |
| 16 | Hydrocracking of heptane | C7H16 + H2 → C2H6 + C5H12 | |
| 17 | Hydrocracking of heptane | C7H16 + H2 → C3H8 + C4H10 | |
| 18 | Hydrocracking of hexane | C6H14 + H2 → CH4 + C5H12 | |
| 19 | Hydrocracking of hexane | C6H14 + H2 → C2H6 + C4H10 | |
| 20 | Hydrocracking of hexane | C6H14 + H2 → C3H8 + C3H8 | |
| 21 | Hydrocracking of pentane | C5H12 + H2 → CH4 + C4H10 | |
| 22 | Hydrocracking of pentane | C5H12 + H2 → C2H6 + C3H8 | |
| 23 | Hydrocracking of butane | C4H10 + H2 → CH4 + C3H8 |
| Reaction Rate Equations | Ordinary Differential Equations |
|---|---|
| Organic Compounds/Temperatures | Experimental Results | Predicted Results | % Average Relative Error | ||||||
|---|---|---|---|---|---|---|---|---|---|
| 200 °C | 230 °C | 260 °C | 200 °C | 230 °C | 260 °C | 200 °C | 230 °C | 260 °C | |
| Propane | 1.35 | 1.01 | 1.42 | 1.32 | 1.53 | 1.42 | 3.41 | 52.90 | 0.00 |
| Propene | 1.32 | 1.16 | 4.08 | 1.32 | 3.34 | 5.87 | 0.00 | 54.29 | 43.88 |
| i-Butane | 3.02 | 6.63 | 3.26 | 2.99 | 4.63 | 3.26 | 0.82 | 0.04 | 0.00 |
| n-Butane | 1.33 | 0.86 | 1.3 | 1.33 | 1.34 | 1.30 | 0.00 | 54.50 | 0.00 |
| Butene | 7.60 | 7.84 | 23.51 | 6.68 | 15.84 | 32.54 | 12.03 | 0.00 | 38.41 |
| i-Pentane | 9.05 | 25.51 | 16.04 | 8.45 | 15.99 | 21.00 | 6.63 | 13.60 | 30.90 |
| n-Pentane | 0.98 | 0.91 | 1.24 | 0.76 | 1.11 | 1.24 | 21.69 | 21.76 | 0.00 |
| Pentene | 1.21 | 0.9 | 0.99 | 1.21 | 1.14 | 0.86 | 0.00 | 26.25 | 12.77 |
| i-Hexane | 0.20 | 0.19 | 0.11 | 0.23 | 0.18 | 0.11 | 13.22 | 3.52 | 0.00 |
| n-Hexane | 0.34 | 0.27 | 0.16 | 0.39 | 0.27 | 0.15 | 13.97 | 0.00 | 9.48 |
| i-Heptane | 25.21 | 24.36 | 18.24 | 26.87 | 24.36 | 17.05 | 6.57 | 0.00 | 6.56 |
| n-Heptane | 48.39 | 30.36 | 29.65 | 48.45 | 30.27 | 15.21 | 0.13 | 0.30 | 48.70 |
| % Average Relative Error | 6.54 | 18.93 | 15.89 | ||||||
| No. | Chemical Reaction | Pre-Exponential Factor (mol/bar·gm·min) | Activation Energy E (kJ/mol) | |
|---|---|---|---|---|
| 1 | n-C5H12 → C5H10 + H2 | 32,532.45 | 43.4 | Hydrogenation/Dehydrogenation Reactions |
| 2 | C5H10 +H2 → n-C5H12 | 33,333,379 | 72.5 | |
| 3 | n-C4H10 → C4H8 + H2 | 12,892.94 | 46.7 | |
| 4 | C4H8 +H2 → n-C4H10 | 2.72 × 10¹⁰ | 212.3 | |
| 5 | C3H8 → C3H6 + H2 | 1699.389 | 43.6 | |
| 6 | C3H6 + H2 → C3H8 | 321.946 | 46.5 | |
| 7 | n-C7H16 → i-C7H16 | 334,991.1 | 50.4 | Hydroisomerization Reactions |
| 8 | i-C7H16 → n-C7H16 | 1195.458 | 25.9 | |
| 9 | n-C6H14 → i-C6H14 | 186,366.5 | 50.4 | |
| 10 | i-C6H14 → n-C6H14 | 45,113.46 | 42.8 | |
| 11 | n-C5H12 → i-C5H12 | 94.6291 | 23.1 | |
| 12 | i-C5H12 → n-C5H12 | 220.6853 | 40.7 | |
| 13 | n-C4H10 → i-C4H10 | 167.6447 | 32.7 | |
| 14 | i-C4H10 → n-C4H10 | 5.64 × 10¹⁰ | 123.4 | |
| 15 | C7H16 + H2→ CH4 + C6H14 | 44,931.58 | 64.5 | Hydrocracking Reactions |
| 16 | C7H16 + H2→ C2H6 + C5H12 | 4724.774 | 57.2 | |
| 17 | C7H16 + H2→ C3H8 + C4H10 | 5423.617 | 62.0 | |
| 18 | C6H14 + H2→ CH4 + C5H12 | 3,300,815 | 67.6 | |
| 19 | C6H14 + H2→ C2H6 + C4H10 | 228,999 | 53.1 | |
| 20 | C6H14 + H2→ C3H8 + C3H8 | 2.99 × 10¹⁴ | 252.2 | |
| 21 | C5H12 + H2→ CH4 + C4H10 | 40,971,414 | 87.6 | |
| 22 | C5H12 + H2→ C2H6 + C3H8 | 3.13 × 10¹⁰ | 178.1 | |
| 23 | C4H10 + H2→ CH4 + C3H8 | 9 × 10¹³ | 213.6 |
| Reactions | Eapp (kJ/mol) |
|---|---|
| Hydrogenation/Dehydrogenation | 212.1 |
| Hydroisomerization | 123.4 |
| Hydrocracking | 243.2 |
Disclaimer/Publisher’s Note: The statements, opinions and data contained in all publications are solely those of the individual author(s) and contributor(s) and not of MDPI and/or the editor(s). MDPI and/or the editor(s) disclaim responsibility for any injury to people or property resulting from any ideas, methods, instructions or products referred to in the content. |
© 2023 by the authors. Licensee MDPI, Basel, Switzerland. This article is an open access article distributed under the terms and conditions of the Creative Commons Attribution (CC BY) license (https://creativecommons.org/licenses/by/4.0/).
Share and Cite
Khalil, M.; Al-Zaidi, B.Y.; Shakor, Z.M.; Hussein, S.J.; Al-Shathr, A. Experimental and Kinetic Study of the Catalytic Behavior of Sulfate-Treated Nanostructured Bifunctional Zirconium Oxide Catalysts in n-Heptane Hydroisomerization Reactions. ChemEngineering 2023, 7, 115. https://doi.org/10.3390/chemengineering7060115
Khalil M, Al-Zaidi BY, Shakor ZM, Hussein SJ, Al-Shathr A. Experimental and Kinetic Study of the Catalytic Behavior of Sulfate-Treated Nanostructured Bifunctional Zirconium Oxide Catalysts in n-Heptane Hydroisomerization Reactions. ChemEngineering. 2023; 7(6):115. https://doi.org/10.3390/chemengineering7060115
Chicago/Turabian StyleKhalil, Mohammed, Bashir Y. Al-Zaidi, Zaidoon M. Shakor, Sattar J. Hussein, and Ali Al-Shathr. 2023. "Experimental and Kinetic Study of the Catalytic Behavior of Sulfate-Treated Nanostructured Bifunctional Zirconium Oxide Catalysts in n-Heptane Hydroisomerization Reactions" ChemEngineering 7, no. 6: 115. https://doi.org/10.3390/chemengineering7060115