Article

Process Intensification in a Double-Pipe Reactor with Additively Manufactured Internal Inserts

1
Institute for Micro Process Engineering (IMVT), Karlsruhe Institute of Technology, 76344 Eggenstein-Leopoldshafen, Germany
2
Cargill R&D Centre Europe, Havenstraat 84, B-1800 Vilvoorde, Belgium
*
Author to whom correspondence should be addressed.
ChemEngineering 2022, 6(6), 85; https://doi.org/10.3390/chemengineering6060085
Submission received: 15 August 2022 / Revised: 15 September 2022 / Accepted: 29 September 2022 / Published: 2 November 2022

Abstract

:
The polycondensation reaction to produce polydextrose can be intensified by using micro-process engineering. Fluid Guiding Elements are additively manufactured internal inserts that have already shown their potential to intensify heat transfer in double-pipe heat exchangers. This study investigated the intensification of the polydextrose yield when these internal inserts were used. Different reactor lengths and internal inserts geometries, as well as different operating conditions, were analyzed. The experiments showed that the reactant concentration had no effect on the product yield. Furthermore, it was shown that the process could be intensified at higher temperatures, with relatively low residence times and lower pressures. It was confirmed that the good heat transfer characteristics of the internal inserts allow them to continuously evaporate water during the reaction and to further reach the required reaction temperature, thus shifting the equilibrium towards the desired product. These findings are of special significance for the optimization of the polycondensation reaction of polydextrose.

1. Introduction

The condensation reaction of polydextrose is a reversible reaction that can be carried out at high temperatures and small residence times, with high yield and selectivity in micro-channel reactors [1]. Polydextrose (CAS Reg. No. 68424-04-4, see molecule structure in Figure 1) is a sugar substitute used as a bulking agent [2,3,4,5] in the food industry [6,7], with half the energy of sugar (1–2 kcal instead of 4 kcal/g [8]). Polydextrose is therefore added to a variety of foods, such as sugar-free confectionery, dairy products, baked goods, and beverages [8]. The polycondensation reaction to produce polydextrose is a step-growth polymerization where one molecule of water is released each time two glucose monomers combine [9]. Process intensification can therefore be achieved when the water (product of the polycondensation) is removed from the reaction mixture, i.e., as per Le Chatelier’s principle, the equilibrium of the reaction is shifted to the products.
In recent times, additive manufacturing has been applied in chemical and process engineering [10,11,12] due to, e.g., the design freedom of apparatuses enhancing the performance [13,14].With the emergence of additive manufacturing processes for metals, [15,16], new possibilities have opened up in construction design, allowing for the design of internals adapted to their respective applications for process intensification [17].
Fluid Guiding Elements (FGEs) [18] are internal inserts manufactured via powder bed fusion of metals using a laser-based system (PBF-LB/M). Their good heat transfer characteristics have been shown previously [17].The FGEs are made of repeating units, the fluid guiding units (FGUs), which can be lined up in all three spatial directions. The idea behind the geometry of the FGUs, shown in Figure 2a, is that at each point, only a partial flow of the fluid is in contact with the wall where the heat transfer takes place. Through this, the internal inserts create a constantly unsteady flow regime due to the constant change in the flow form along the flow direction. As a result, no thick boundary layer is formed, which slows down the heat transfer due to the lower temperature gradients towards the wall. This leads to a high heat transfer performance with a relatively low pressure drop. Using a double-pipe heat exchanger with FGEs in the inner tube and annular gap, respectively (see Figure 2b,c), it has already been shown that a significant increase in heat transfer (up to over twice the transferred power) compared to an empty tube is achieved. This enables a significant reduction in the apparatus size [17].
This study aimed to investigate the effect of different process parameters (e.g., temperature, pressure, feed concentration, and residence time) on the production of polydextrose to achieve higher yields and to intensify the process.
For this purpose, internal inserts based on the Fluid Guiding Elements design [17] are used in double-pipe reactors.

2. Materials and Methods

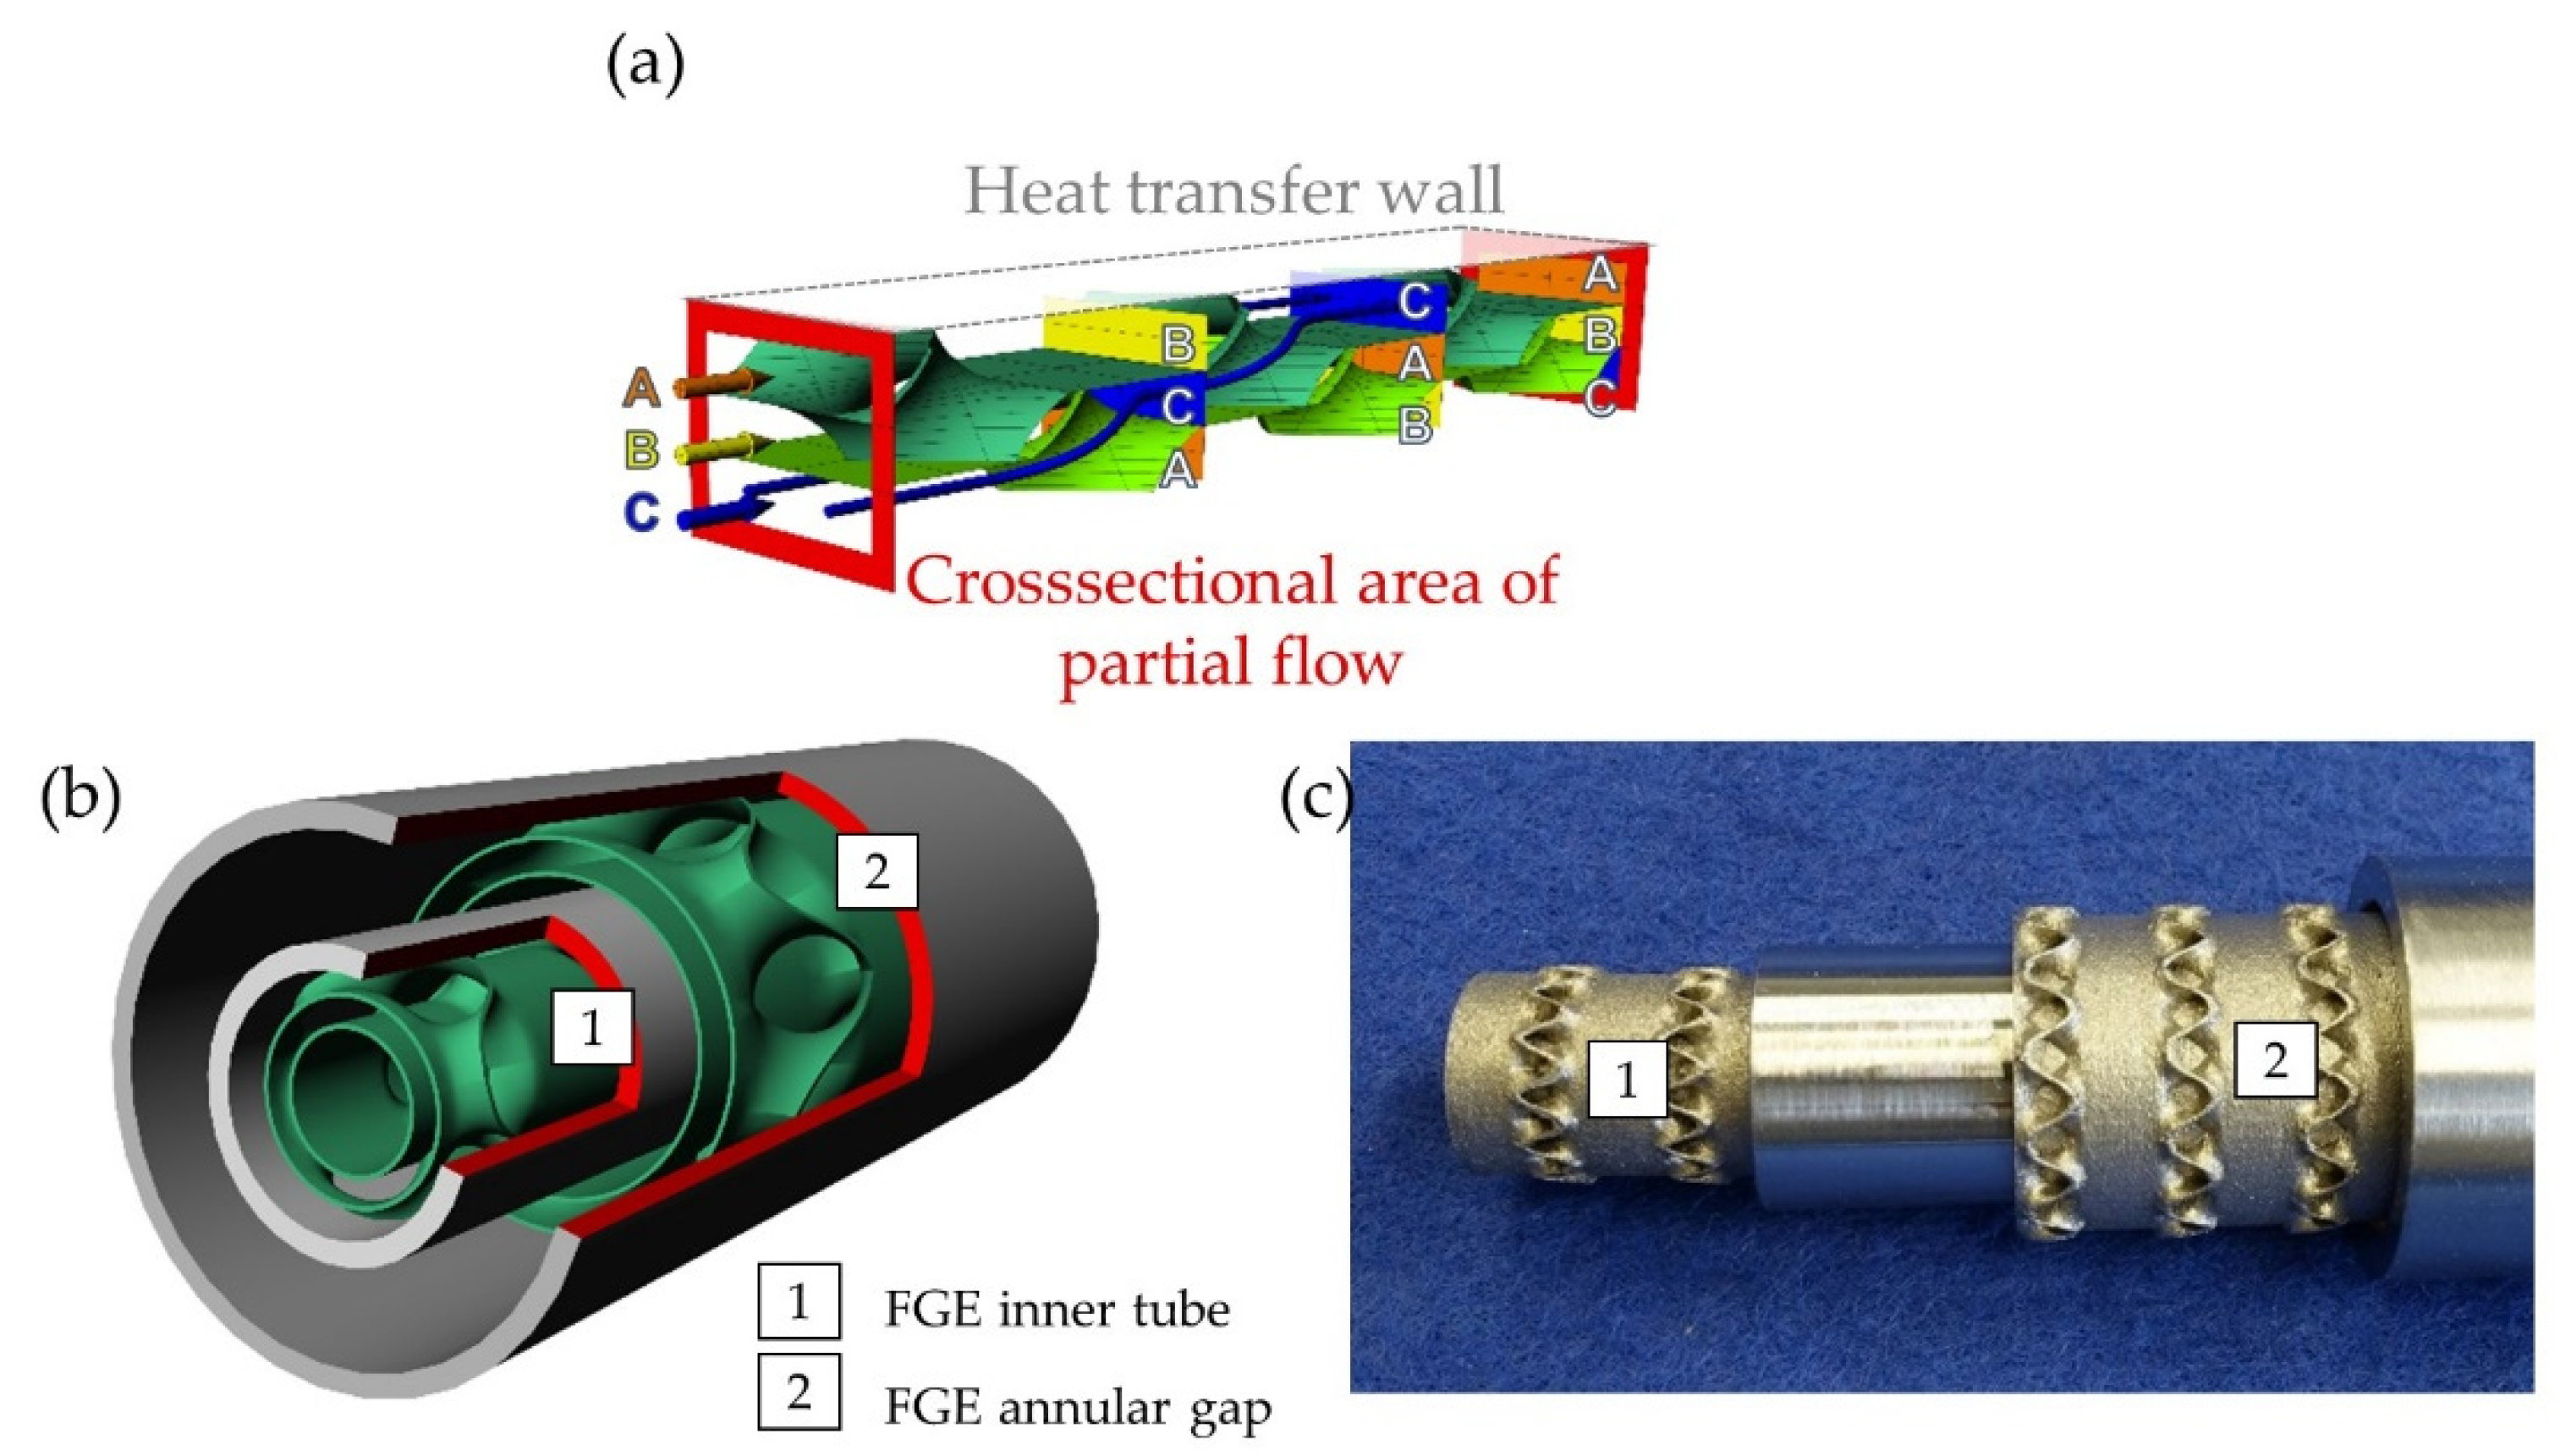
2.1. Double-Pipe Reactors Equipped with Additively Manufactured Internal Inserts

The most relevant dimensions of the heat exchangers are summarized in Table 1. In the inner pipe (inner diameter: 10 mm), as well as in the ring gap of the double tubes, Fluid Guiding Elements manufactured according to [17,18] were used. The geometrical characteristics of the three different Fluid Guiding Elements are detailed in Table 2. The reacting glucose solution flows in the inner pipe (reaction side), and the heat transfer oil flows in a counter-current configuration in the 3 mm-thick annular gap. The length designations of 30, 40, and 50 cm for the reactors refer to the approximate total contact length of the oil with the inner tube.
Three different FGE geometries were tested in the inner pipe, while the FGE geometry for the annular gap (oil side) was not modified. For the design of the different FGE geometries, the repetition length and the length between the blades were varied so that different FGU shapes and lengths were obtained. Different FGU lengths for a given FGE length led to a variation of the number of FGUs. The geometrical characteristics of the three different FGEs in the inner pipe are detailed in Table 2 and depicted in Figure 3. Starting from type A (left in Figure 3), the repetition length (black bar in Figure 3) for type B (middle) was shortened from 9 to 6 mm so that the partial flows alternated more frequently over the same length. In type C, the number of partial flows was reduced to two, which alternated constantly so there were no straight pipe sections. The repetition length was 9 mm, as in type A, so that the contact lengths for the partial streams remained the same but the layer thickness was considerably greater. The internal inserts were manufactured using stainless steel powder (316 L) with a particle size between 5 and 45μm, using the PBF-LB/M-System Realizer SLM125 (DMG Mori, Bielefeld, Germany).

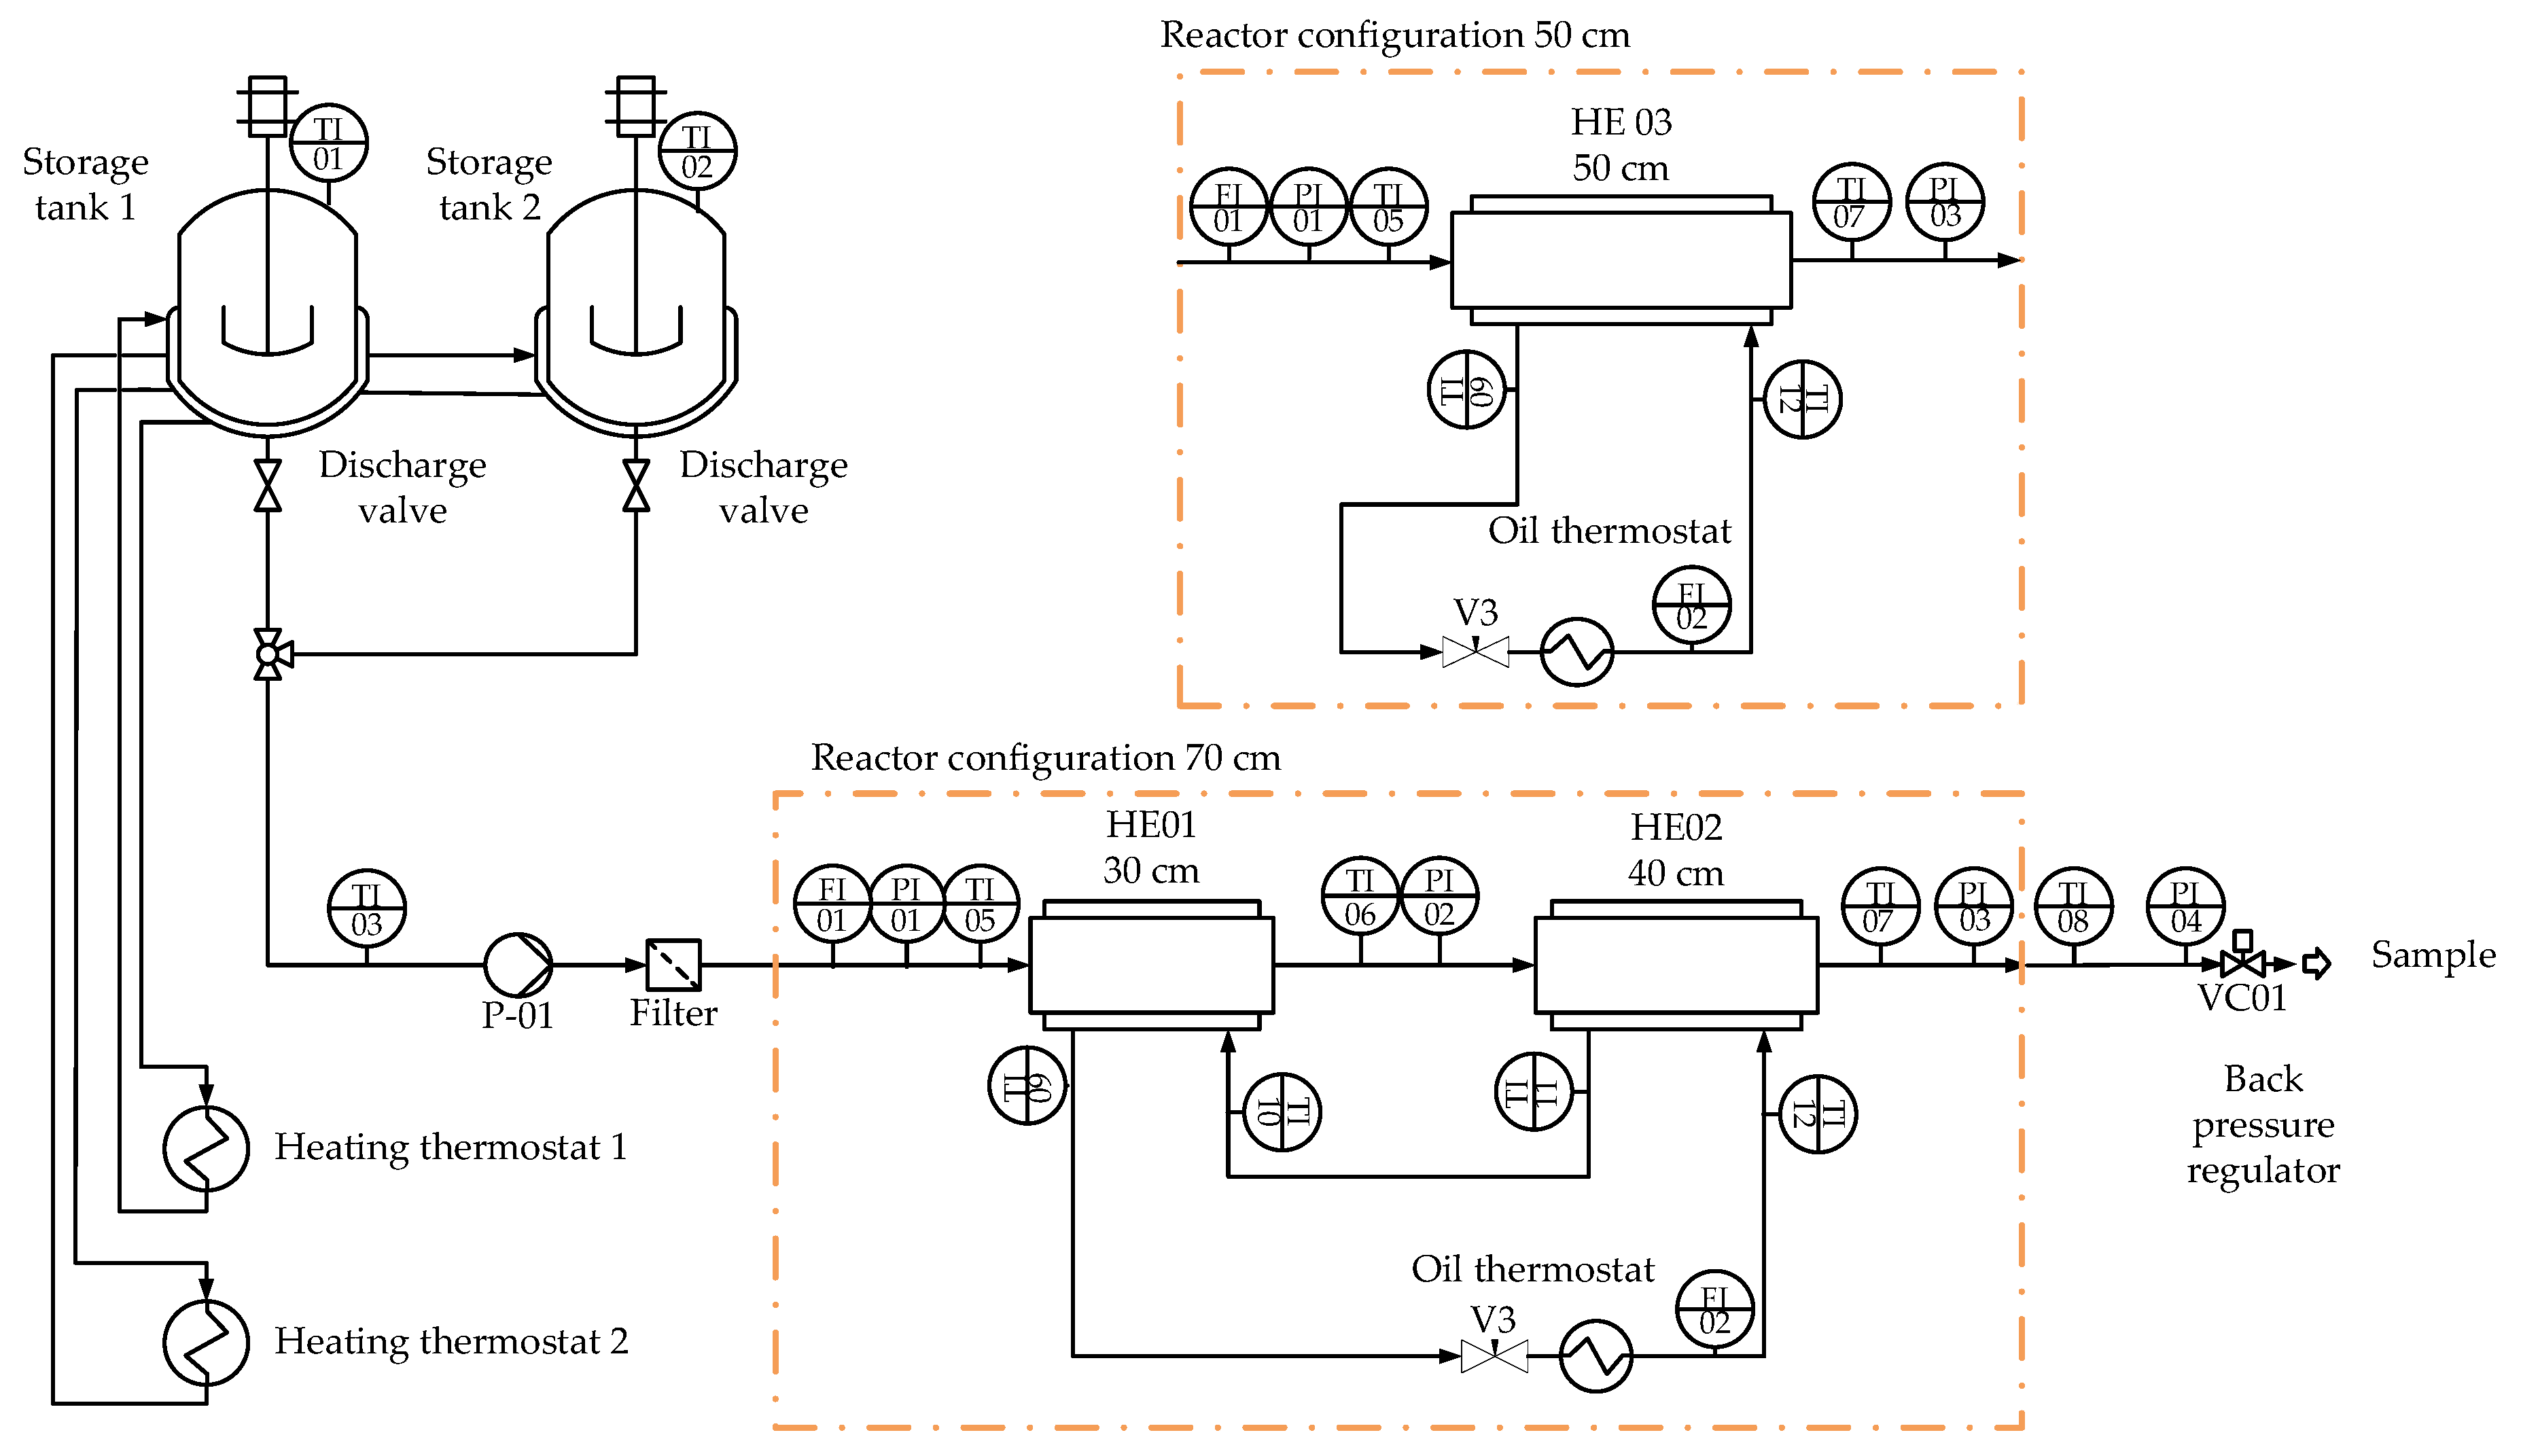
2.2. Experimental Plant for the Production of Polydextrose

The experiments for the lab-scale production of polydextrose were conducted in the experimental set-up depicted in Figure 4. The reaction solution and rinsing water were stored in two double-jacketed tanks (Storage tank 1 and Storage tank 2) and heated by a thermostat(LAUDA) each. The entire length of the supply line, from the tanks to the reactor, was heated using heating cords. An eccentric screw pump (P-01, SEEPEX, Bottrop, Germany) supplied the medium into the plant. The pump flow was measured using a Coriolis flow meter (FI01, RHEONIK, Odelzhausen, Germany). Three double-pipe heat exchangers (HE01 to HE03) of different lengths were available as reactors. They could be arranged in any order. The two configurations investigated more thoroughly in this work are shown in the process flow diagram in Figure 4 and indicated by boxes with a dash-dotted frame, i.e., the 30 cm-long reactor followed by the 40 cm-long reactor (70 cm) or the 50 cm reactor used as a stand-alone reactor. Pressure and temperature were measured upstream and downstream of each reactor. A back pressure regulator (VC01, Swagelok, Solon, OH, USA) was installed downstream of the reactors to adjust the system pressure. The adjoining pipes were heated externally using heating cords, just like the supply pipe. This configuration led to 9 cm of bare pipe and 14 cm of insulated length between the reactor outlet and the pressure regulator. The reactors themselves were heated in a counter-current configuration, with heat transfer oil flowing at 300 kg/h, using a thermostat(Tool-Temp, Sulgen, Switzerland). The temperature of the oil was measured at each reactor, both at the inlet and the outlet (TI09 to TI14). To measure the mass flow, the oil from the thermostat flowed through a Coriolis flow meter (FI02, Endress + Hauser, Reinach, Switzerland) before it flowed through the heat exchangers. The mass flow could be controlled by a needle valve (V03, Swagelok, Solon, OH, USA). The product was collected in a stirred water bath. Samples of the product could be taken at the outlet of the pipe before the product ended in the water bath.

2.3. Experimental Procedure

The procedure was based on the following steps:
  • Solution preparation. The first step was to prepare the feed solution with glucose and deionized water. For each experiment, the solutions were prepared in storage ank BR01 and heated to 80 °C.
  • Warm-up phase. The heating cords and the oil thermostat were switched on to ensure that the reactors were brought to the target temperature. Simultaneously, heated deionized water from storage tank 2 was pumped through the system. When the target-set temperature was reached, 1%wt. (regarding the dry mass) of catalyst(citric acid) was added to storage tank 1. Next, the pump feed was switched from storage tank 2 (DI water) to storage tank 1 (reacting glucose solution).
  • Reaction conditions. Different experiments were set to determine the effect of the glucose solution in the feed (50–80%). In addition, the reactor setting was varied, using the 70 cm or the 50 cm reactor configuration. The influence of the type of inserts was also investigated, as well as the effect when no inserts (Type 0) were placed inside the reactor. The oil set temperature varied between 200 and 235 °C, and the system pressure was set between 1 and 3 bar g. Oscillations in pressure could be observed due to the ongoing evaporation. The pump was set to deliver feed mass flow rates between 1.5 and 2.5 kgh−1. A summary of the operating conditions is given in Table 3.
  • Samples. Each operation point was held between 15 and25 min to reach a steady state. When sampling, the product was mixed with cold deionized water and neutralized with sodium hydroxide up to a pH value >5 to prevent further reactions.
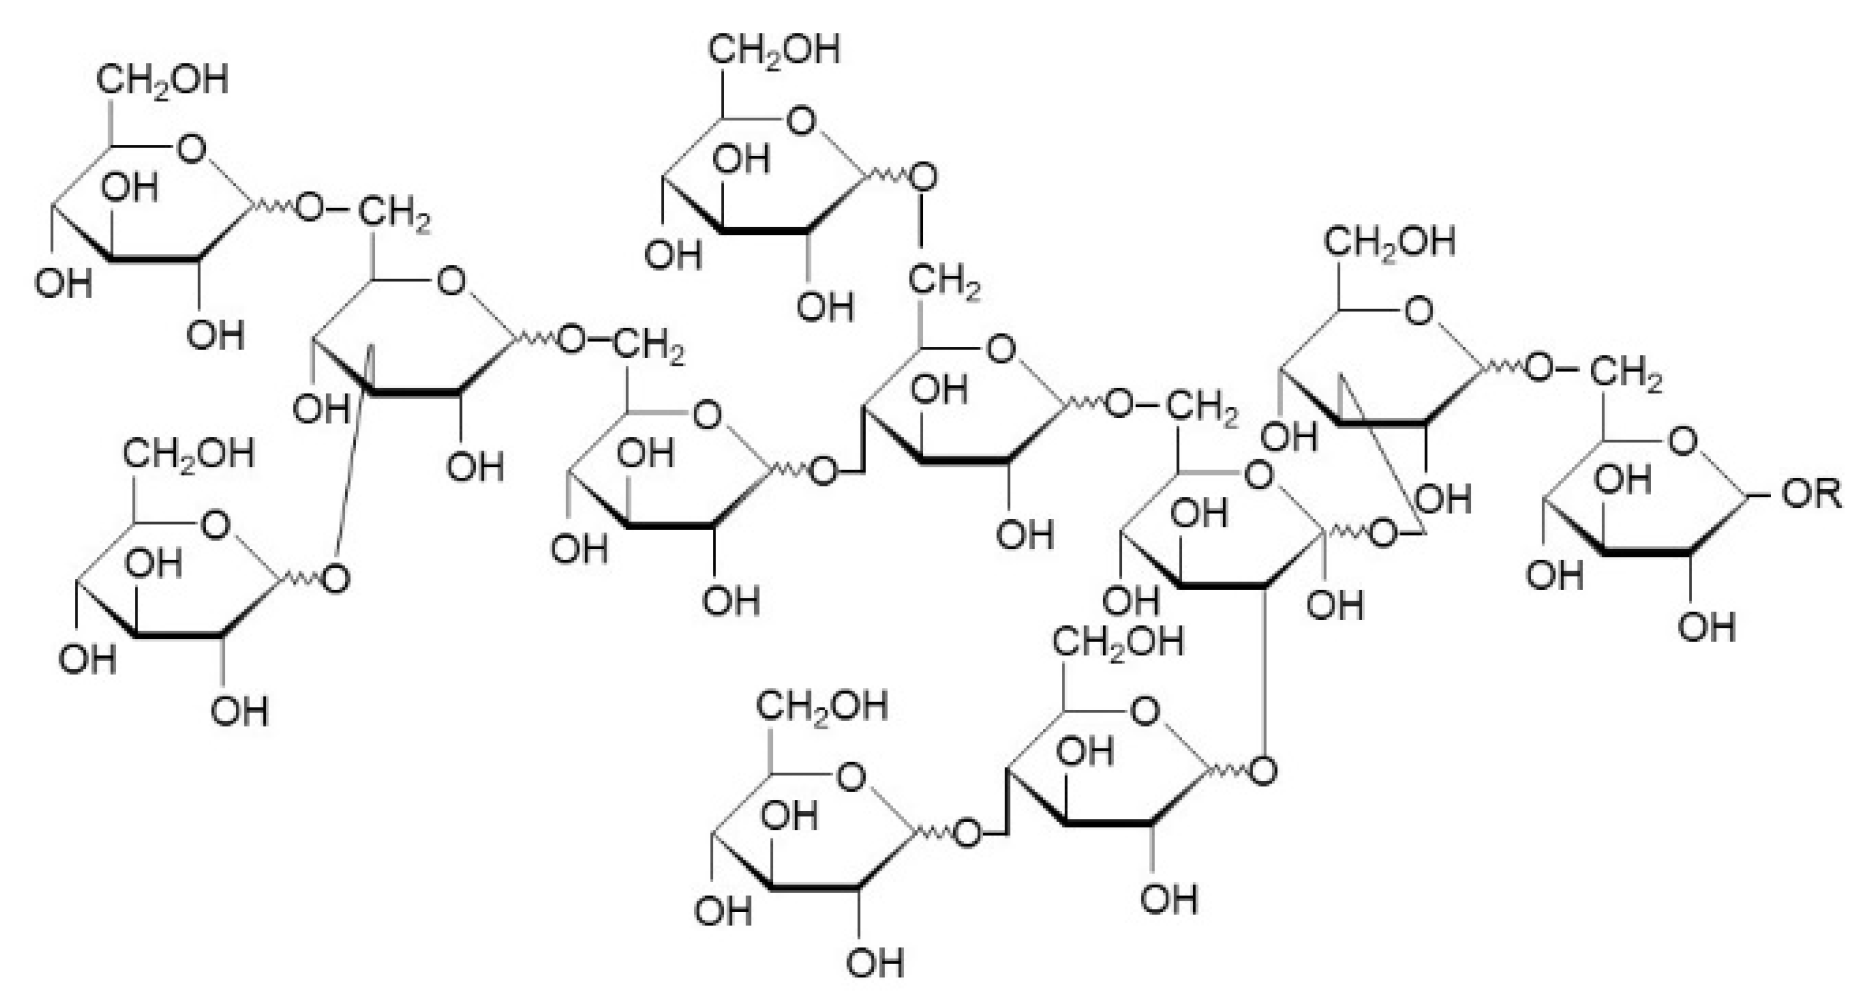
  • Analysis. The samples were analyzed using HPLC according to the established method [19]. The product yield was determined as the total number of oligomers that had a polymerization degree ⩾2(polymerized glucose).
  • Calculations. Due to the evaporation in the reactor, the density of the flowing medium along the reacting path was not constant. For an exact determination of the residence time, the course of the density of the reaction mixture over the length should be known. However, the kinetics of evaporation in the reactor were difficult to determine. Considering the known parameters, a Mass Hourly Volumetric Velocity (in kgh−1m−3) can be defined for a comparison of the experiments, as follows:
MHVV =   M ˙ V Reactor
where   M ˙ is the mass flow rate in kg/h and V Reactor is the total volume of the reactor. To have a reference value to evaluate the experimental results in terms of time, the residence time was also calculated as the formal hydrodynamic residence time ( τ Formal   hydrodynamic in sec) of liquid water at normal temperature pressure conditions (NTP):
τ Formal   hydrodynamic = V Reactor   V ˙ = V Reactor M 3600 ˙ · ρ Water NTP
where   M ˙ is the mass flow rate in kg h−1,  V Reactor is the total volume of the reactor, and ρ Water NTP is the density of liquid water at NTP conditions.

3. Results

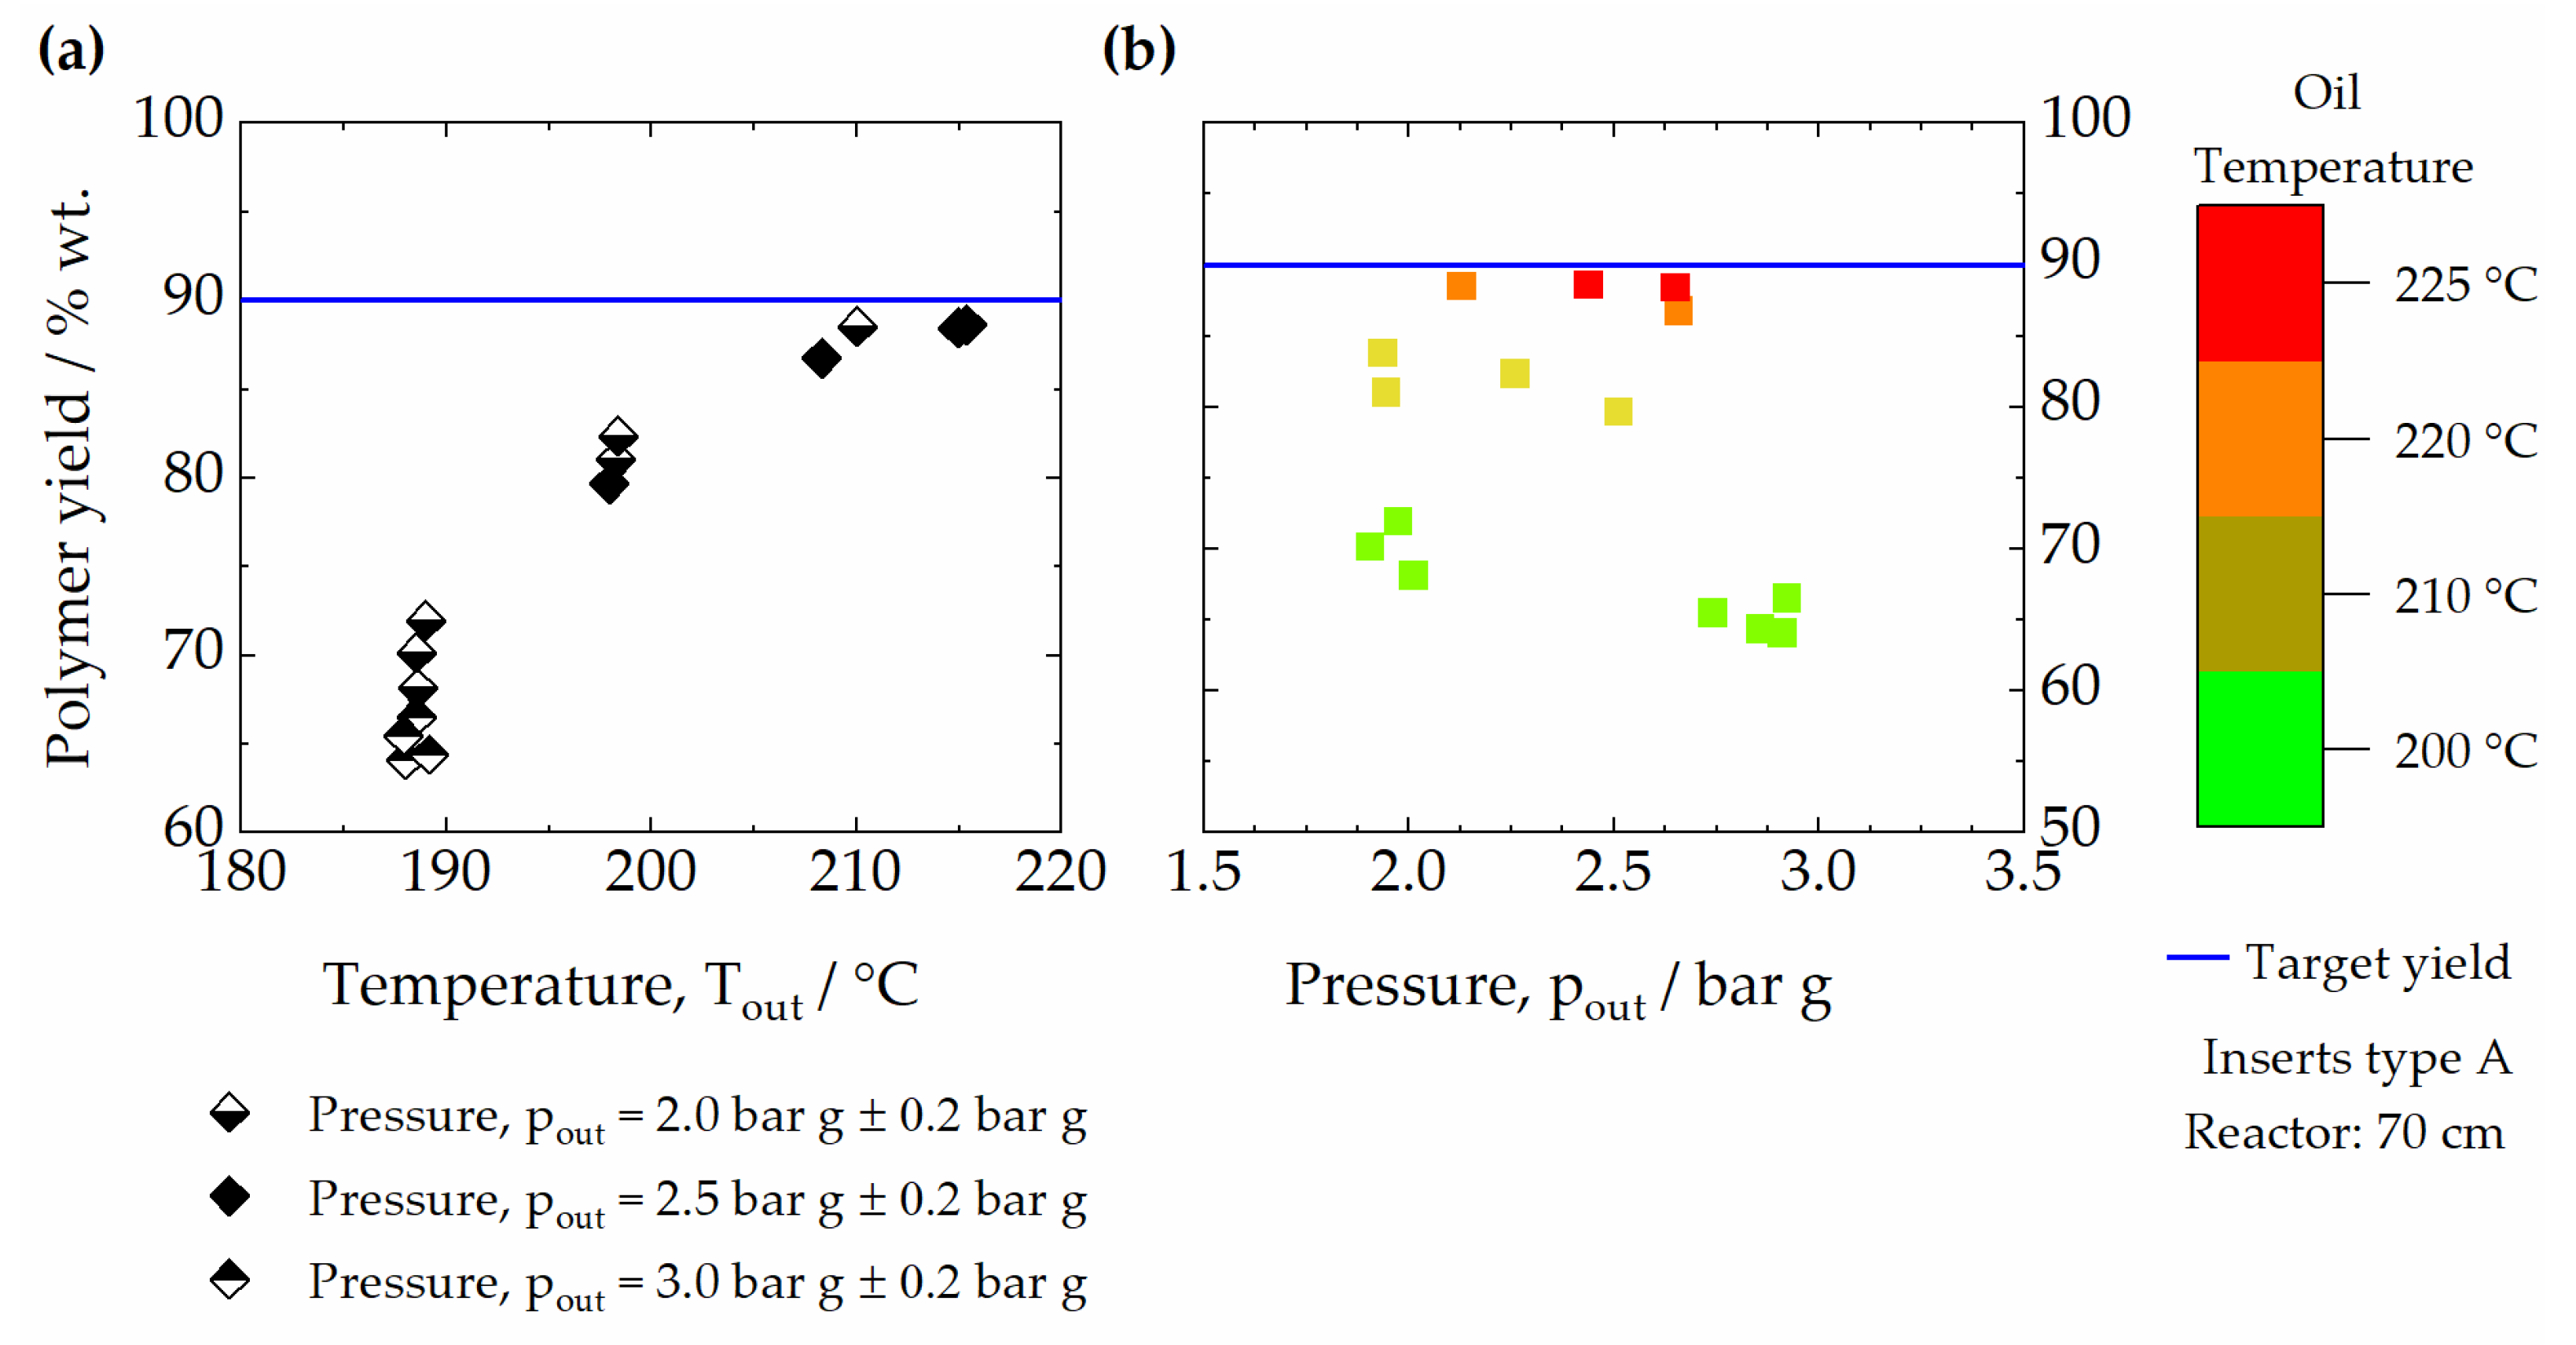
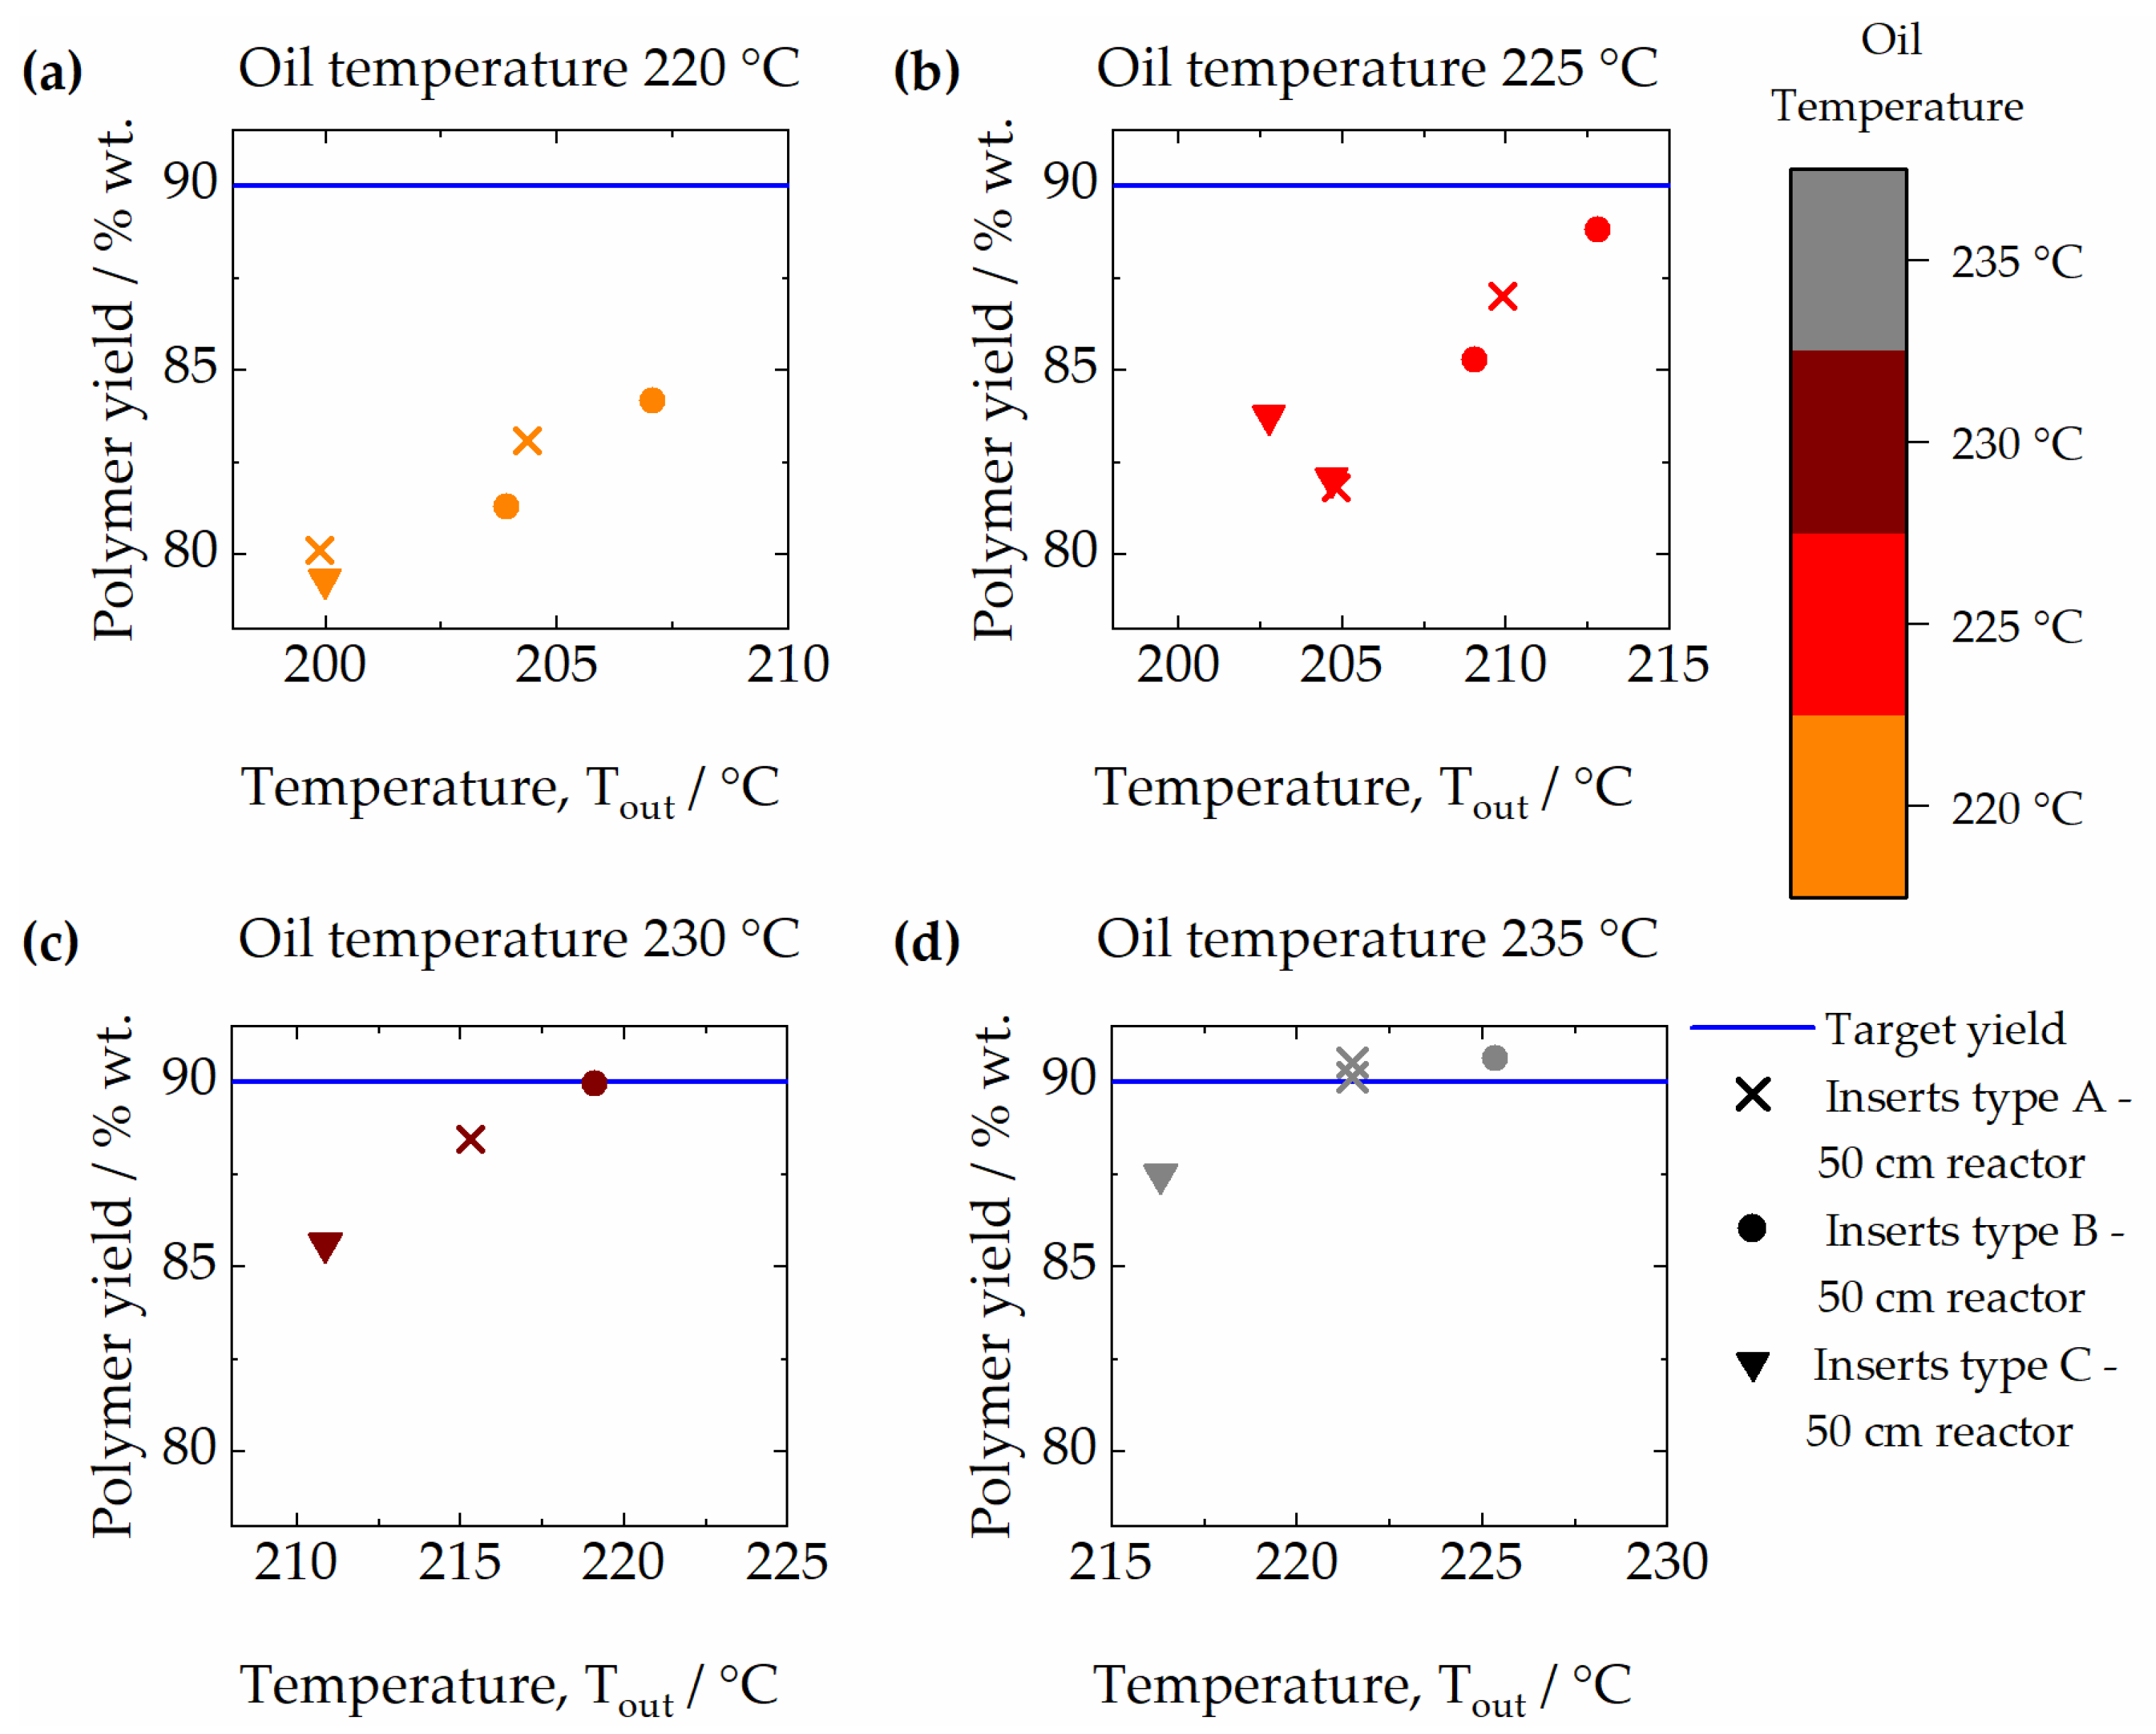
3.1. Effect of Temperature and Pressure

To determine the influence of temperature and pressure on the product yield, the oil temperature was increased from 200 °C up to 225 °C in steps of 10 or 5 °C. At each temperature level, samples were taken at pressures between 2 and 3 bar g. Figure 5 shows the influence of the temperature and pressure on the polymer yield for a constant formal hydrodynamic residence time (i.e., 89 s ± 2 s). In Figure 5a, the product yield is plotted against the average temperature at the reactor outlet (Tout, measured by the thermocouple at the reactor outlet, TI07). Tout was always the highest temperature measured in the reactor path. For a better overview, the data points are formatted differently for the three different pressure levels shown, i.e., 2 bar g, 2.5 bar g, and 3 bar g. The curve clearly confirms that higher temperatures lead to higher product yields. In addition, it can be observed that the higher the product yield, the smaller the scatter in the y-direction becomes. From this observation, we can conclude that the nearer the reaction is to the equilibrium, the less impact small differences in temperature and residence time have. In Figure 5b, the polymer yield is plotted against the pressure at the reactor outlet, pout. Comparing the points in the same oil set point temperature, it becomes apparent that lower pressures lead to higher product yields. The reason for this fact probably lies in the increased water evaporation at lower pressures. The glucose is only in the liquid phase, and thus, the reaction only takes place in the liquid phase. As the pressure is reduced, more water evaporates, which leads to smaller water concentrations in the liquid phase. At higher temperatures, the equilibrium already lies at higher polymer yields anyway, so the pressure effect is less pronounced.

3.2. Effect of Glucose Concentration in the Feed

Considering the previous studies in a microreactor with micro-channels which led to a patent [1], it was expected that higher mass fractions of glucose in the feed would have a positive effect on the product yield. In fact, more water in the feed should affect the reaction equilibrium in such a way that less glucose can react. In the current study, however, it was seen that the mass fraction of glucose in the feed had almost no effect on the product yield, and therefore, the local reaction equilibrium. Figure 6 displays the product yield vs. glucose concentration in the feed (% in mass) for different set oil temperatures. For instance, as seen in Figure 6, at an oil set temperature of 220 °C, product yields of 85% were reached at a feed glucose concentration of ~60%, whereas 88% of product was yielded at ~80% of glucose concentration in the feed. In the set of experiments shown in Figure 6, the same pump speed was always set. This means that higher feed concentrations, and therefore higher densities, led to an increase in the mass flow rate. Consequently, this fact resulted in shorter residence times for higher feed concentrations. This might be one of the possible reasons for the similar product yield values for different feed concentrations.

3.3. Effect of Residence Time

The effect of the residence time on the product yield was also investigated. For that, experiments were performed at the same mass flow rate for each concentration, using reactors of different lengths. In Figure 7a,b, the product yields obtained with the 70 cm reactor setup (squares) and with the 50 cm reactor (crosses) are plotted against the temperature at the reactor outlet, Tout. Figure 7a shows the results for a feed concentration of 80%wt. and a common mass flow rate of 3.7 kg h−1 ± 0.05 kg h−1,whereas Figure 7b illustrates the product yield for a glucose concentration of 60%wt. and a common mass flow rate of 3.10 kgh−1 ± 0.05 kg h−1.In both cases, only results obtained at an outlet pressure of pout 2 ± 0.5 bar are shown. As expected, for a given feed concentration, i.e., 80%wt., and common mass flow rate, i.e., 3.7 kg h−1 ± 0.05 kg h−1, the product yields obtained with the longer set-up (70 cm) are higher as a consequence of the larger residence time that a higher reactor volume offers. It is very remarkable that this difference in product yield between the reactors is higher at lower temperatures. For example, this can be seen in Figure 7a, where the difference in product yield between both reactors lengths is much higher at an oil set temperature of 200 °C (difference in product yield of 18%wt.) than when a temperature of 220 °C is set (difference of 4%wt.). In fact, the nearer the reaction is to the equilibrium (i.e., at higher temperatures), the less impact differences in residence time have. It can be observed that the same oil set temperatures always result in almost-5 °C-higher reactor outlet temperatures for the reactor with a larger residence time. Accordingly, the outlet temperature is the governing factor for reaching higher yields. In Figure 7c,d, both reactor configurations (70 cm and 50 cm) are compared for different formal hydrodynamic residence times (between 50 s and 150 s). From Figure 7c,d, it becomes clear that higher residence times do not necessarily lead to higher polymer yields; rather, the reaction temperature is the dominant factor. If the reaction rate increases strongly with the temperature, it is conceivable that only the residence time at the highest temperature accounts for the majority of the conversion. The effect on the product yield visible in Figure 7c,d is therefore a superposition of the effects of residence time and reaction temperature, which itself depends on the residence time.
As a comparative value, the literature data regarding the polymer yield achieved with one microchannel reactor (μchannels, one-stage reactor) are shown—Example 2 in [1]. In that case, for a glucose concentration of 80% in the feed, a polymer yield of 54.7% was obtained. The residence time was given as 70 s, which is only about 5 s shorter than in the comparable experiments made in this study. This corresponds to ~5% deviation. Furthermore, the patent described the example of a two-stage reactor process. In this case, the flow was circulated through a collection chamber before entering the second reactor. In the chamber, water was partly evaporated to increase the degree of polymerization of polydextrose in the second reactor. Despite these extra steps, the final polymer yield given in the patent (Example 3 in [1]) was only 80% (“μchannels, two-stage reactor” in Figure 7), definitely lower than the values obtained in this work.

3.4. Effect of Internal Inserts Geometry

In Figure 8, an empty 50 cm reactor is compared to a 50 cm reactor filled with internal inserts of type A. Here, the polymer yield is represented against the temperature at the reactor outlet for a 60% glucose solution in the feed and the same mass flow rate (~3.15 kgh−1).Since the applied oil temperatures were the same, it can be seen in Figure 8 that the internal inserts definitely contribute to intensifying the process and therefore increasing the polymer yield. The values obtained with an empty reactor at 235 °C fall close to those obtained with the reactor fitted with internal inserts at 220 °C oil temperature. Furthermore, the enhancing effect of the internal inserts on the heat transfer can be seen in Figure 8a. Without internal inserts, the reaction temperature for an oil set temperature of 235 °C is only about 200 °C, whereas when the reactor is fitted with internal inserts, the temperature reached in the reactor is about 220 °C for the same oil set temperature. Therefore, the internal inserts contribute to the enhancement of the heat transfer and consequently to the process intensification. From Figure 8b, it is remarkable that higher residence times (obtained in the empty reactor) do not necessarily lead to larger polymer yields. Therefore, the earlier conclusion—that temperature is the most influencing factor in this process—is supported once more.
Three different FGE geometries were additively manufactured (see Table 2 and Figure 3). Comparing the geometry of type B with type A, the partial flows alternated more frequently over the same length. More frequent alternation means more frequent renewal of the in-flow effect, so it was expected that the heat transfer would be better for type B. In type C, the contact lengths for the partial streams remained the same as in type A, but the layer thickness was considerably greater. Therefore, a reduction in heat transfer was expected for type C. Considering the total volume of the 50 cm reactor, as well as the void fraction of each type mentioned in Table 2, the volume relative to the reactor fitted with type A decreased by 1.3% for type B and increased by 1.0% for type C. Therefore, it seems justified to assume that the effect due to the use of different types of internals is primarily due to the differences in geometry and not due to the differences in residence time caused by the void fraction variation.
Figure 9 illustrates the polydextrose yield in a 50 cm reactor fitted with inserts of the three different types against the temperature at the reactor outlet (feed: 60% glucose solution, mass flow rate: 3.15 kg h−1 ± 0.5 kg h−1). For a better overview, individual plots for the single set temperatures are shown. Thus, Figure 9a shows the polymer yield vs. the reactor temperature for a set oil temperature of 220 °C, Figure 9b shows the results for a set oil temperature of 225 °C, Figure 9c depicts the polymer yield for a set oil temperature of 230 °C, and finally, Figure 9d displays the product yield for a set oil temperature of 235 °C. At the same applied oil temperatures, it is notable that outlet temperatures of the reaction mixture consistently varied in the same order (B > A > C) (Figure 9).It is well known that these systems are able to provide an improvement of heat transfer at the expense of pressure drop. In fact, for the same mass flow rate, a pressure drop of 0.45 bar was measured for the reactor fitted with FGE type B.A pressure drop of 0.25 bar was measured for FGE type A; for type C, a 0.12 bar pressure drop was recorded. These values were significantly lower than the pressure drop values measured for the device used in [1], which were in the range of about 2 bar.

4. Conclusions

In this work, the performance of PBF-LB/M-manufactured, regularly structured internal inserts known as Fluid Guiding Elements was studied. Two reactor configurations with double-pipe reactors of lengths 70 and 50 cm were equipped with these internal inserts to investigate their suitability for the production of polydextrose. It was confirmed that higher temperatures and lower pressures led to higher polymer yields, most probably due to the evaporation of water and the achievement of the required temperature.
Furthermore, the residence time and the reaction temperature obtained had a clear positive influence on the product yield. Higher polymer yields were only possible at higher temperatures. A possible cause for this observation is an equilibrium limitation.
The obtained product yield was almost independent of the mass fraction of glucose in the feed in the range of 50 to 80%. When using a finer-structured geometry (type B), an increase in the temperature of the reaction mixture at the reactor outlet and higher product yields for the investigated residence times were observed.
Considering the obtained results, the production of polydextrose in a double-pipe reactor equipped with additively manufactured, FGE-based internal inserts shows benefits in comparison to the previous patented solution with microchannels: higher product yields can be obtained, and less glucose solution in the feed is possible. Thus, not only can the intermediate step of water separation be avoided, but also the use of a second microchannel reactor. Accordingly, the results presented in this study enable a simplification of the process via the elimination of equipment, which leads to a reduction in investment, maintenance, and energy costs.

Author Contributions

Conceptualization, S.C.; methodology, S.C.; validation, P.V.S., S.C. and M.K.; formal analysis, P.V.S. and S.C.; investigation, P.V.S. and S.C.; resources, S.C., M.K. and R.D.; data curation, P.V.S. and S.C.; writing—original draft preparation, S.C.; writing—review and editing, S.C., P.V.S., M.K., B.F.S., C.F.K. and R.D.; visualization, S.C.; supervision, M.K., R.D., B.F.S. and C.F.K.; project administration, M.K.; funding acquisition, M.K. and R.D. All authors have read and agreed to the published version of the manuscript.

Funding

This research received no external funding.

Acknowledgments

The authors would like to thank Cornelia Schorle and Conrad Grehl for technical and electrical support; Fabian Grinschek for the additive manufacturing of the internal inserts; and Christa Hueser-Schwerin and Baerbel Guenther for the HPLC analysis of the product. The authors acknowledge support by the KIT-Publication Fund of the Karlsruhe Institute of Technology.

Conflicts of Interest

The authors declare no conflict of interest.

References

  1. Kuesters, C.F.; Stengel, B.F.; Benzinger, W.; Brandner, J. Microprocessing for Preparing a Polycondensate. WO 2011/091962, 19th January 2011. Available online: https://data.epo.org/publication-server/document?iDocId=5859464&iFormat=0 (accessed on 15 June 2022).
  2. do Carmo, M.M.; Walker, J.C.; Novello, D.; Caselato, V.M.; Sgarbieri, V.C.; Ouwehand, A.C.; Andreollo, N.A.; Hiane, P.A.; Dos Santos, E.F. Polydextrose: Physiological Function, and Effects on Health. Nutrients 2016, 8, 553. [Google Scholar] [CrossRef] [PubMed]
  3. Craig, S.A.S.; Holden, J.F.; Troup, J.P.; Auerbach, M.H.; Frier, H.I. Polydextrose as Soluble Fiber: Physiological and Analytical Aspects. Cereal Foods World 1998, 43, 370–376. [Google Scholar]
  4. Auerbach, M.; Craig, S.; Mitchell, H. Bulking Agents: Multi-Functional Ingredients. In Sweeteners and Sugar Alternatives in Food Technology; Mitchell, H., Ed.; John Wiley & Sons: Hoboken, NJ, USA, 2006; pp. 435–467. [Google Scholar] [CrossRef]
  5. Auerbach, M.; Mitchell, H.; Moppett, F.K. Polydextrose. In Alternative Sweeteners; O’Brien-Nabors, L., Ed.; Taylor & Francis Group: Baton Rouge, LA, USA, 2011; pp. 489–505. [Google Scholar]
  6. EU-Commission. Annexes II and III to Regulation (EC) No 1333/2008 of the European Parliament and of the Council Text with EEA Relevance. 22 March 2012. Available online: https://eur-lex.europa.eu/legal-content/EN/ALL/?uri=celex%3A32012R0231 (accessed on 12 June 2022).
  7. The United States Pharmacopeial Convention, Food Chemicals Codex. 8. Ed. Rockville Md.: USP 2012. ISBN 9781936424054. Available online: http: //swb.bsz-bw.de/DB=2.1/PPN?PPN=1442229853 (accessed on 15 September 2022).
  8. Rennhard, H.H. Polysaccharides and Their. Preparation. Patent US3766165 (A), 16 October 1973. [Google Scholar]
  9. Stowell, J. Prebiotic Potential of Polydextrose. In Prebiotics and Probiotics Science and Technology; Charalampopoulos, D., Rastall, R.A., Eds.; Springer: Berlin/Heidelberg, Germany, 2009; pp. 337–352. ISBN 978-0-387-79057-2. [Google Scholar]
  10. Zentel, K.M.; Fassbender, M.; Pauer, W.; Luinstra, G.A. Chapter Four-3D printing as chemical reaction engineering booster. In Advances in Chemical Engineering; Moscatelli, D., Sponchioni, M., Eds.; Academic Press: Cambridge, MA, USA, 2020; Volume 56, pp. 97–137. [Google Scholar]
  11. Alimi, O.A.; Meijboom, R. Current and future trends of additive manufacturing for chemistry applications: A review. J. Mater. Sci. 2021, 56, 16824–16850. [Google Scholar] [CrossRef] [PubMed]
  12. Bhargava, S.K.; Ramakrishna, S.; Brandt, M.; Selvakannan, P.R. Additive Manufacturing for Chemical Sciences and Engineering; Springer: Berlin/Heidelberg, Germany, 2022. [Google Scholar] [CrossRef]
  13. Grinschek, F.; Xie, D.; Klumpp, M.; Kraut, M.; Hansjosten, E.; Dittmeyer, R. Regular Microstructured Elements for Intensification of Gas-Liquid Contacting Made by Selective Laser Melting. Ind. Eng. Chem. Res. 2020, 59, 3736–3743. [Google Scholar] [CrossRef]
  14. Trinkies, L.L.; Düll, A.; Deschner, B.J.; Stroh, A.; Kraut, M.; Dittmeyer, R. Simulation of Fluid Flow During Direct Synthesis of H2O2 in a Microstructured Membrane Reactor. Chem. Ing. Tech. 2021, 93, 789–795. [Google Scholar] [CrossRef]
  15. Frazier, W.E. Metal Additive Manufacturing: A Review. J. Mater. Eng. Perform. 2014, 23, 1917–1928. [Google Scholar] [CrossRef]
  16. Gibson, I.; Rosen, D.; Stucker, B. Additive Manufacturing Technologies; Springer International Publishing: New York, NY, USA, 2021; ISBN 978-3-030-56127-7. [Google Scholar]
  17. Hansjosten, E.; Wenka, A.; Hensel, A.; Benzinger, W.; Klumpp, M.; Dittmeyer, R. Custom-designed 3D-printed metallic fluid guiding elements for enhanced heat transfer at low pressure drop. Chem. Eng. Processing Process Intensif. 2018, 130, 119–126. [Google Scholar] [CrossRef]
  18. Hensel, A.; Wenka, A.; Hansjosten, E.; Benzinger, W. Flow Guide in a Channel. DE 10 2015 113 432 A1. 2017. Available online: https://www.kit-technology.de/fileadmin/user_upload/DE102015113432A1_01.pdf (accessed on 13 July 2022).
  19. ISO 10504:2013; International Organization for Standardization (ISO) Starch Derivatives—Determination of the Composition of Glucose Syrups, Fructose Syrups and Hydrogenated Glucose Syrups—Method Using High-Performance Liquid Chromatography. ISO: Geneva, Switzerland, 2013. Available online: https://www.iso.org/standard/50792.html (accessed on 13 July 2022).
Figure 1. Schematic representation of the polydextrose structure.
Chemengineering 06 00085 g001
Figure 2. (a) Partial flow paths in the FGE, adapted from [18]. (b) Double-pipe configuration with FGEs in both the internal tube and the annular gap, adapted from [18]. (c) Picture of the double-pipe configuration fitted with FGEs.
Chemengineering 06 00085 g002
Figure 3. Fluid Guiding Element types used in this study.
Chemengineering 06 00085 g003
Figure 4. Experimental plant for the production of polydextrose in double-pipe reactors fitted with internal inserts.
Chemengineering 06 00085 g004
Figure 5. Polymer yield for (a) different reaction temperatures and (b) different pressures at the reactor outlet, with mass flow rates of 3.15 kgh−1 ± 0.1 kg h−1. The color scale refers to the oil set temperature.
Chemengineering 06 00085 g005
Figure 6. Polymer yield for different glucose concentrations%wt. in feed. Only samples for pout =2 ± 0.4 bar g in the 70 cm reactor are shown. The color scale refers to the oil set temperature.
Chemengineering 06 00085 g006
Figure 7. Product yield vs. outlet temperature for (a) 80%wt. glucose solution in feed (b) 60%wt. glucose solution in feed. Product yield vs. hydrodynamic residence time for (c) 80%wt. glucose solution in feed (d) 60%wt. glucose solution in feed. The MHVV is also indicated in the graph. The results for a 70 cm reactor are compared with the results with a 50 cm reactor. The pressure was 2 ± 0.5 bar. Literature values according to [1] are given as a comparative value.
Chemengineering 06 00085 g007
Figure 8. Comparison of the polymer yield versus (a) temperature at the reactor outlet and (b) hydrodynamic residence time, using internals type A and no internals (empty reactor) in a 50 cm reactor, for 60%wt. glucose in feed, with mass flow rate 3.15 ± 0.05 kg h−1 and pressure in the range of 2 ± 0.3 bar. The MHHV is also indicated in the graph. The color scale represents oil set temperatures.
Chemengineering 06 00085 g008
Figure 9. Comparison of the polymer yield versus the temperature at the reactor outlet using the different types of the internals, A, B, and C, in a 50 cm reactor for (a) set oil temperature of 220 °C, (b) set oil temperature of 225 °C, (c) set oil temperature of 230 °C, and (d) set oil temperature of 235 °C. The mass flow rate was set to 3.15 kg h−1 ± 0.05 kg h−1 and pressure was in the range of 2 ± 0.3 bar. The color scale represents oil set temperatures.
Chemengineering 06 00085 g009
Table 1. Dimensions of the inlet and outlet pipes of the different reactors used in this study. HE-01 with 30 cm length, HE-02 with 40 cm length, and HE-03 with 50 cm length.
TubeOuter
Diameter
Inner Diameter Wall ThicknessContact Length
Inner12 mm10 mm1 mm30 cm/40 cm/50 cm
Outer18 mm15 mm1.5 mm
Table 2. Geometry parameters of the different FGE types.
Tube Number of Partial Streams Repetition Length (FGU)Length of an
Element
Void Fraction
A39 mm 89%
B36 mm55 mm88%
C29 mm 91%
Table 3. Operating conditions set during the study.
Set Glucose
Solution
/%wt.
Reactor
Configuration
Type of
Inserts
Oil Set
Temperature
/°C
Pressure
/Bar g
Feed Mass Flow Rate
/kgh−1
50, 60,
70, 80
70 cm,
50 cm
A, B, C, 0200, 210, 220,
225, 230, 235
1.5, 2, 2.5,
3, 4
2, 3.15, 3.50, 3.75
Publisher’s Note: MDPI stays neutral with regard to jurisdictional claims in published maps and institutional affiliations.

