Article

Influence of Pyrolysis Parameters Using Microwave toward Structural Properties of ZnO/CNS Intermediate and Application of ZnCr2O4/CNS Final Product for Dark Degradation of Pesticide in Wet Paddy Soil

by
Tutik Setianingsih
*,
Danar Purwonugroho
and
Yuniar Ponco Prananto
Department of Chemistry, Brawijaya University, Malang 65145, Indonesia
*
Author to whom correspondence should be addressed.
ChemEngineering 2021, 5(3), 58; https://doi.org/10.3390/chemengineering5030058
Submission received: 21 June 2021 / Revised: 16 August 2021 / Accepted: 26 August 2021 / Published: 3 September 2021
(This article belongs to the Special Issue Chemical Engineering and Multidisciplinary)

Abstract

:
Pesticide is a pollution problem in agriculture. The usage of ZnCr2O4/CNS and H2O2 as additive in liquid fertilizer has potency for catalytic pesticide degradation. Colloid condition is needed for easy spraying. Rice husk and sawdust were used as carbon precursor and ZnCl2 as activator. The biomass–ZnCl2 mixtures were pyrolyzed using microwave (400–800 W, 50 min). The products were dispersed in water by blending then evaporated to obtain ZnO/CNS. The composites were reacted with KOH, CrCl3·6H2O, more ZnCl2, and little water by microwave (600 W, 5 min). The ZnCr2O4/CNS and H2O2 were used for degradation of buthylphenylmethyl carbamate (BPMC) in wet deactivated paddy soil. TOC was measured using TOC meter. The FTIR spectra of the ZnO/CNS composites indicated the completed carbonization except at 800 W without ZnCl2. The X-ray diffractograms of the composites confirmed ZnO/CNS structure. SEM images showed irregular particle shapes for using both biomass. ZnCr2O4/CNS structure was confirmed by XRD as the final product with crystallite size of 74.99 nm. The sawdust produced more stable colloids of CNS and ZnO/CNS composite than the rice husk. The pyrolysis without ZnCl2 formed more stable colloid than with ZnCl2. The ZnCr2O4/CNS from sawdust gave better dark catalytic degradation of BPMC than from rice husk, i.e., 2.5 and 1.6 times larger for 400 and 800 W pyrolysis, respectively.

1. Introduction

The brown grasshopper is a main pest of paddy plants. This pest can damage plants quickly by adsorption of cell liquid, which causes plants to dry and finally look burned. Although the grasshopper problem can be overcome physically, biologically, and mechanically, the usage of pesticide is still considered as quick and practices inhibition [1]. However, pesticide can be pollutant in both water and soil environments. Over long periods, pesticide will accumulate and become toxic, leading to the death of animals. Pesticide can also cause resistance of pests, cancer disease, disability at birth, brain damage, genetic mutation, and disturbance of the immune system. Pesticide residue can be accumulated in various agricultural products such as paddy, soyabean, or vegetables [2]. For example, among 315 agriculture products, 47% (fresh products) and 7% (cooked products) of them contain pesticide. Among 180 vegetables, 89% (fresh) and 11% (cooked) also contain pesticide [3].
Organochlorine and organophosphate are very toxic and have long persistence. Carbamate and pyrethroid are safer due to their easy degradation, but in the long term they remain accumulated [2]. One of ways to overcome pesticide pollutant is by the use of the activated carbon. This porous material can adsorb pesticide and microbes so that degradation can occur biologically [3]. However, the colloid system of activated carbon is needed to make easy the spraying on paddy fields by farmers.
Colloid is a combination of particles and medium which form dispersion [4]. A dispersion system consists of particulate matter as dispersed phase and dispersion medium as continuous phase [5]. Sonication is an alternative technique to make dispersion of nanomaterials. Dispersion by ultrasound is caused by microturbulences which are affected by fluctuation of pressure and cavitation [6]. It has been applied for conditioning the nano size of the carbon [7] but a blending technique is better to form a dispersion system [8].
The colloid system contains a particle size of 1–100 nm, between suspension (particle size > 100 nm) and solution (particle size < 1 nm). It means that the colloid formation can be used as a qualitative indication for CNS formation. Nanocarbon or carbon nanomaterial is carbon which has a particle size of 1–100 nm [9]. In another classification, colloidal dispersion consists of the particle size in the range of 1–500 nm. This range is between molecular dispersion (<1 nm) and coarse dispersion (>500 nm) [5]. Based on this second classification, the carbon colloid systems which contain more than 100 nm particle size potentially can be settled down. That way, the test of colloid stability becomes important in this research, not only as indicator of availability as fertilizer additive, but also as an indicator of nanomaterial formation. Particle size of the activated carbon also affects its surface area and adsorption [10]. For example, adsorption of toluene and xylene increased by increasing of the commercial activated carbon surface area [11].
Nano carbon can be produced from biomass. This material is rich of lignocellulose, including lignin, hemicellulose, and cellulose. Those three substances are polymers with different structures. Lignin is rich with aromatics and oxy functional groups. This substance is built by three monomers of coniferyl alcohol, sinapyl alcohol, and p-coumaryl alcohol. Its portion of monomer depends on the natural source. The main linkages in the lignin are β-O-4, β-5, and β-1 and the most frequent one is β-O-4-aryl ether bond. The phenolic, hydroxyl and methoxy groups provide great influence on its reaction activity due to their strong electronegativity [12]. Cellulose is a polysaccharide which consists of D-glucose units with glycosidic bonds that are formed between monomeric units at positions 1 and 4. Cellulose material includes high ordered (crystallione) and low ordered (amorphous) in ration depending on its natural source. Degree of crystallinity affects its physicochemical properties and pyrolysis pathway [13].
Each biomass contains different distribution of lignocellulose components which influence properties of the carbon. For example, the various biomass gave different properties such as particle size, moisture of the nanocarbon after pyrolysis by microwave or electric heating under same pyrolysis conditions [14]. Three different biomass, including patchouli, rice husk, and sugarcane leaf have been used to synthesize ZnFe2O4/CNM by the sequent hydrothermal-microwave method. In application of the composites for BPMC pesticide degradation reaction in the soil, the composite gave different degradation percentages. The rice husk showed the best performance of degradation [8]. Rice husk is an abundant waste in Indonesia because Indonesia is an agrarian country which produces rice as the main food. Besides that, Indonesia also has a wide forest area which produces various woods for furniture and homes, which result in abundant sawdust waste.
Some pyrolysis methods have been recognized, such as hydrothermal [8,9,15] thermal by microwave [16,17] and thermal by conventional furnace [16,18,19]. Among those methods, microwave has short duration of pyrolysis than both thermal conventional and hydrothermal [15,16,18,19,20]. Not only carbon, but oxide metal nanoparticle was also synthesized using microwave calcination, such as ZnO [21] and alpha-Fe2O3 [22]. Microwave is an electromagnetic wave which has wavelengths from 1 m to 0.1 cm or frequencies of 300 MHz–300 GHz. The mechanism of microwave heating includes polar molecules or ions agitation which oscillate due to oscillating electric or magnetic field. These particle motions are restricted by resisting forces (inter-particle interaction and electric resistance), which restrict particle motions and produce random motion, generating heat [23]. Not only carbon, but oxide metal nanoparticle was also synthesized using microwave, such as ZnO [24] and alpha-Fe2O3 [22] and spinels [24,25].
Based on comparation of five different synthesis methods (sol gel, co-precipitation, conventional heating (thermal decomposition), hydrothermal, and microwave) for synthesis of three different spinels (ZnFe2O4, MnFe2O4, and NiZnFe2O4), the sequence of their average nanoparticle sizes from the highest to the least related to synthesis method of those ferrospinels is by sol-gel > thermal decomposition > microwave > hydrothermal > co-precipitation [25]. Among them all, the dry synthesis can be applied through thermal decomposition and microwave. Between both methods, microwave needs shorter calcination time than thermal furnace. For example, synthesis of ZnCr2O4 by calcination at 700 °C for 2 h [26] or ZnCr2O4/CNS at 600 °C for 15 min [8], but by using microwave it just needed 5 min [24].
ZnCr2O4 (zinc chromite) has a normal spinel structure, the Zn2+ cations occupy at tetrahedral sites and Cr(III) cations occupy at octahedral sites. This substance was used as catalyst for high temperature methanol synthesis [27]. ZnCr2O4 is an important material because of its wide applications as humidity sensor, photocatalyst, catalysts for hydrogenation, oxidation, steam reforming reactions, and magnetic material [28]. As the photocatalysts, the chromite-type materials get a high interest due to their small band-gap energy and chemical stability. The bad gap energies of ZnCr2O4 are 2.9–3.25 eV at temperature range of 450–800 °C [29]. The other research reported in the range of 2.47–3.09 eV at 200–700 °C [26]. These bandgaps are lower than of ZnO (3.37 eV) [30]. ZnCr2O4 has been also successfully used for synthesis of nanobiocomposites for curing the wounds of mice [31].
Both chromium metal and Cr(III) compounds are not carcinogenic to humans. Cr(III) is not mutagenic in most cellular systems to humans or animals [32]. Cr(III) compounds cannot enter the cells by any mechanism of transport which has the potency to initiate tumor like Cr(VI). In nature, Cr(III) is mainly found in the soil and small in the rock as the mixed oxide, phosphate, and sulphate. The Cr(III) mixed oxide presents as the ferro chromite, FeCr2O4 [33]. Iron (II) chromite (FeCr2O4) has normal spinel structure, consisting of Fe(II) occupying the tetrahedral sites and Cr(III) in octahedral sites [34]. That has the same structure as the ZnCr2O4 structure [27] which was synthesized in this research. Chromium (III) oxide is low oral toxic because it is insoluble in water and poorly absorbed [32]. Cr(III) can be oxidized to form the toxic and carcinogenic Cr(VI) which induces DNA damage, chromosome aberrations, epigenome alterations, and micro satellite instability [33], but Cr(VI) in the soil can be rapidly reduced to chromium(III) by organic matter [35] or microorganisms such as bacteria [36].
Excess Cr(III) in the plant can inhibit plant growth, limit the seed germination rate of cucumis melo, reduce the shoot growth of allium cepa, reduce root length of sour orange, and decrease leaf size, wilting, and chlorosis of brassica oleracea [37]. Cr(III) can reduce chloropyll content [38]. However, uptake and accumulation of Cr(III) in plants such as rice, tomato, sunflower, maize, lunece, nelumbo nucifer, medicago sativa, tend to happen in the root rather than the shoot. For example, accumulation of Cr (III) by lucerne is 10–200 times in the roots and in allium cepa is 70–90% in the root. In smart weed, it achieves 44 mg/Kg in the shoot and 2980 mg/Kg in the root [39]. It means that applying zinc chromite in paddy field is safe from too much accumulation of the seed because it tends to accumulate in the root.
Cr(III) is also recognized as a trace element that is essential to both humans and animals [40]. Cr(III) is a component of many multivitamins and nutritional supplements [41]. Cr(III) presents in some foods, such as butter, cheese, bread; in some fruits such as banana, apple, orange, and blue berry; in some vegetables such as cabbage and carrot; in egg and in green bean. The estimated and safe daily dose for chromium is 50 to 200 micrograms. Good health requires Cr(III) not more than 200 µg daily [35]. Cr(III) has an important role in the maintenance of normal carbohydrate, lipid, and protein metabolism [32]. It is needed for decreasing cholesterol, enzymes reactions, and increasing muscle mass [35].
Chemically, degradation of pesticide in the soil can be conducted using friendly oxidators such as peroxide acid. This oxidator is usually added into the liquid fertilizer to handle problems of fungi or bacteria which inhibit the growth of plants [42]. Peroxide acid is safe for fish and improving of DO [43]. Although biologically pesticide can be handled by microbia, its performance is determined by its life condition. In previous research [8], the composites of MFe2O4/CNM and MCr2O4/CNM (M = Zn, Ni, Mn) were used for catalytic degradation of BPMC pesticide. CNM were prepared from sugarcane leaf, patchouli, rice husk, and wood char using hydrothermal-microwave. Based on the research, ZnCr2O4/CNS and ZnFe2O4/CNS showed good performance as catalyst in the dark degradation of pesticide.
Based on previous researches about the need of carbon colloid for fertilizer additive, the performance of microwave for pyrolysis in short time for synthesis of CNS, performance of ZnCr2O4 in catalytic oxidation of pesticide, and safety of Cr(III) in the soil, in this research, CNS was prepared from pyrolysis of rice husk and sawdust using dry microwave pyrolysis and activator of ZnCl2. The final composite was focused on ZnCr2O4/CNS for remediation of wet soil in paddy field. The wet medium is needed in application due to presence of pesticide as the solution is essential for lasting chemical degradation reactions.

2. Materials and Methods

2.1. Material of Research

This research used 2 kinds of biomass, including sawdust (Serbuk Gergaji) with code of SG and rice husk (Gabah) with code of G; ZnCl2 (Merck, Darmstadt, Germany); CrCl3.·6H2O (Merck, Darmstadt, Germany); KOH (Merck, Darmstadt, Germany); H2O2 3% solution (technis); BPMC (buthylphenylmethyl carbamate) technis; and distilled water.

2.2. Procedures of Research

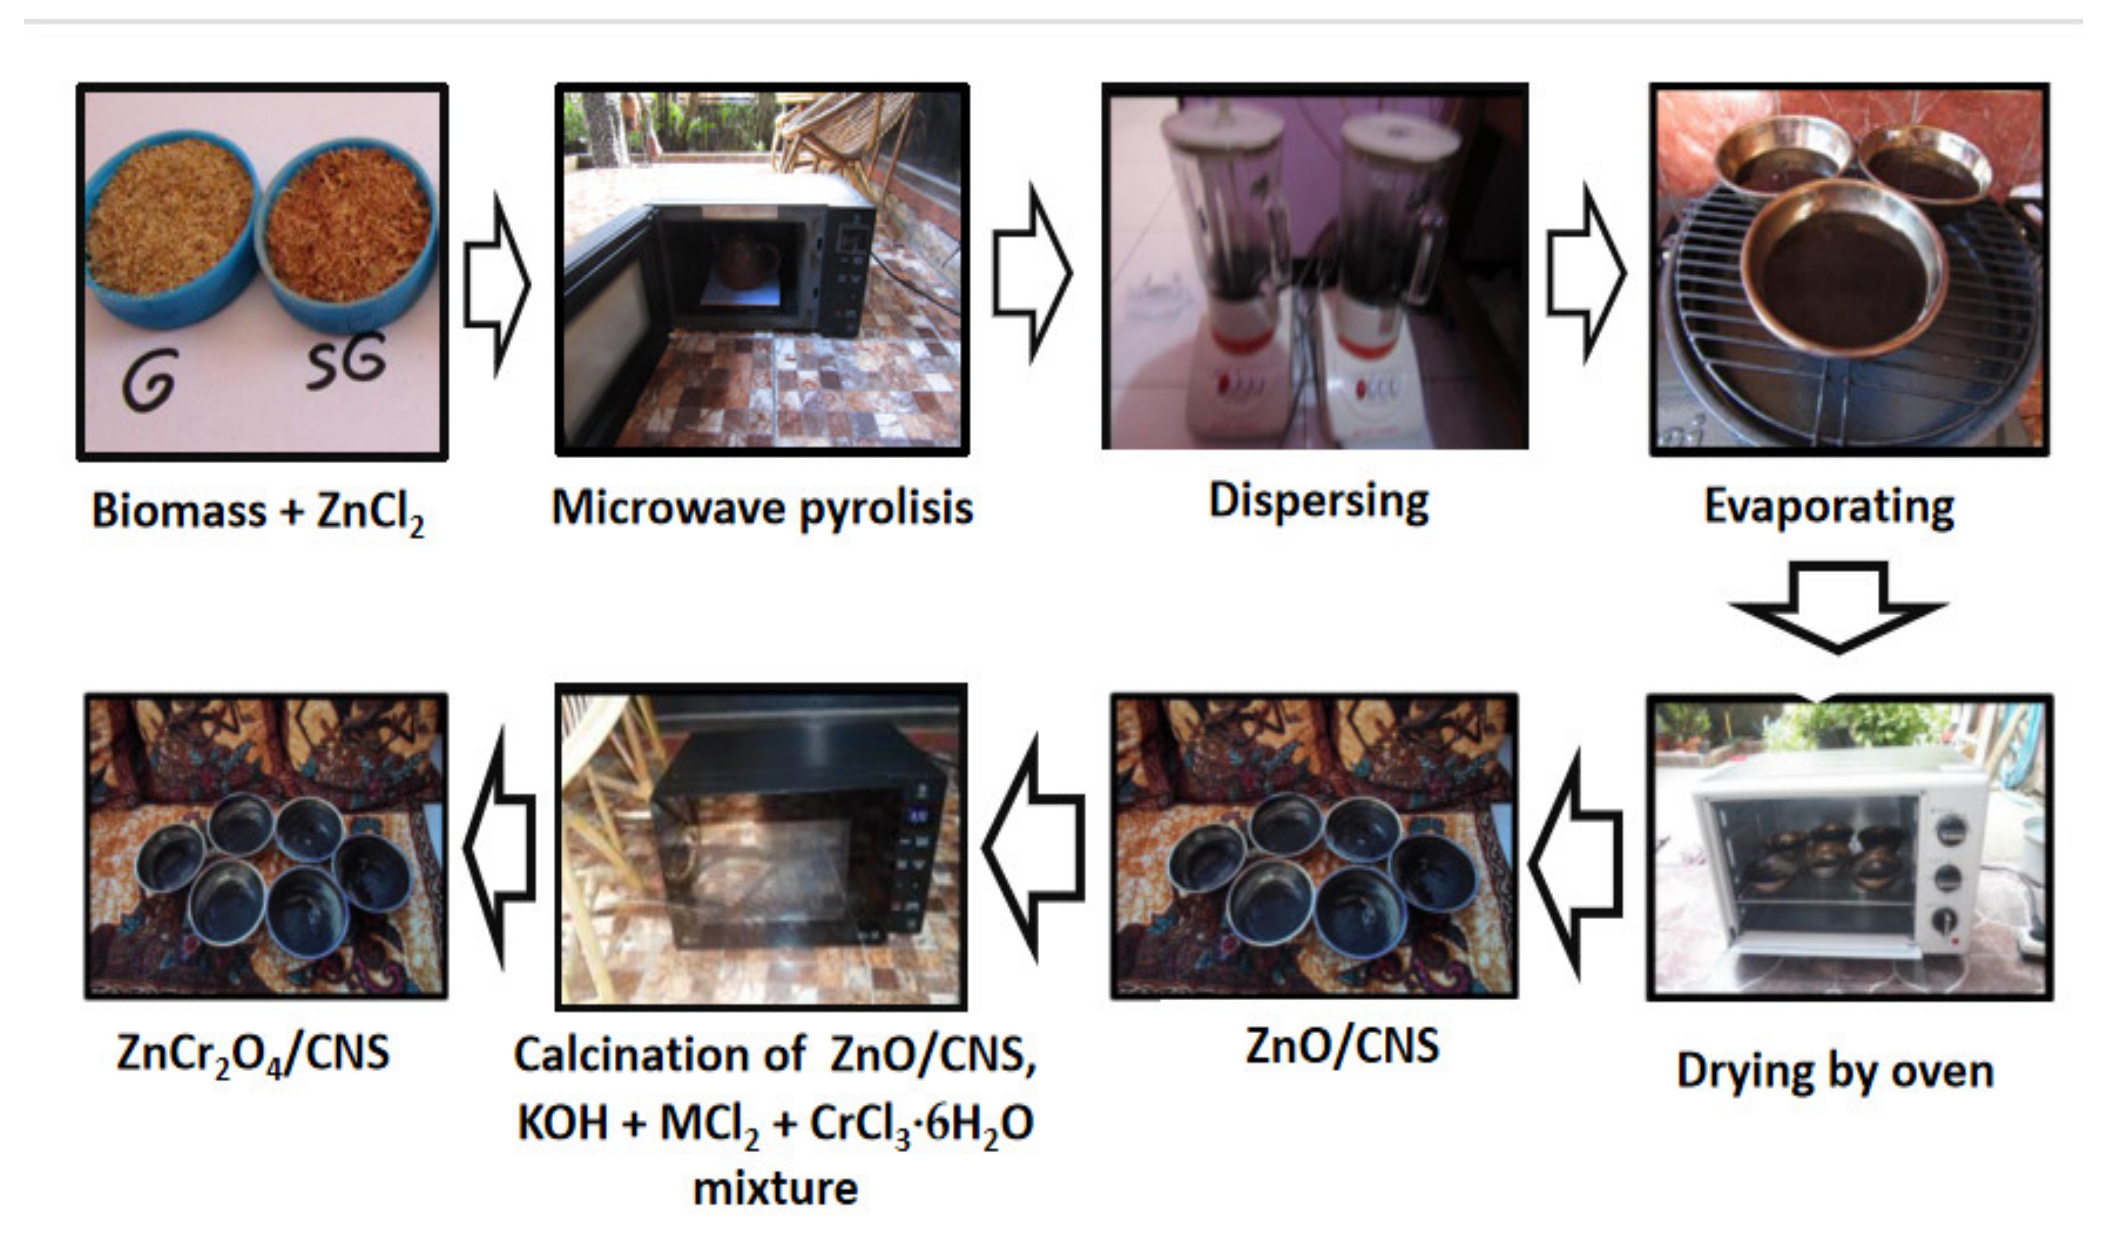
2.2.1. Synthesis of ZnO/CNS and ZnCr2O4/CNS

Each dry biomass, including sawdust (SG) and rice husk (G) was conditioned by tea sieve then was mixed with ZnCl2 at ratio of 5:1 (10 g of biomass and 2 of ZnCl2). The mixture was homogenized manually using a spoon. The mixture was placed in the center of earthenware and the earthenware was placed in the center of the microwave. The point of place must be same because the position in the microwave affected the carbonization (pyrolysis) reaction. Both earthenware and the ceramics ware were closed to limit the oxygen gas in the room to prevent the burning reaction which could substitute carbonization reaction. However, there was a little hole on each earthenware and ceramics ware to remove the emitted gas which resulted from the pyrolysis reactions. The powers of microwave were adjusted at 400, 600, and 800 W. The pyrolysis was conducted for 50 min (10 times, each time is 5 min) using microwave (LG-MS2336GIB, RRC). The pyrolysis was also conducted at the same procedure but without activator. The products of pyrolysis by this procedure were the activated carbons with and without ZnO impurity from the activator. To get the colloid, each activated carbon product was mixed with water in composition of 250 mL water and 2.5 g of the carbon, and then blended using blender (Matsunichi, MSI-T2GN, RRC) for 2 h.
The powers of microwave were marked as codes of 4, 6, and 8 for 400, 600, and 800 W, respectively, for both pyrolysis products and their colloids. The codes for the activated carbons and their each colloid based on each precursor are given as follows:
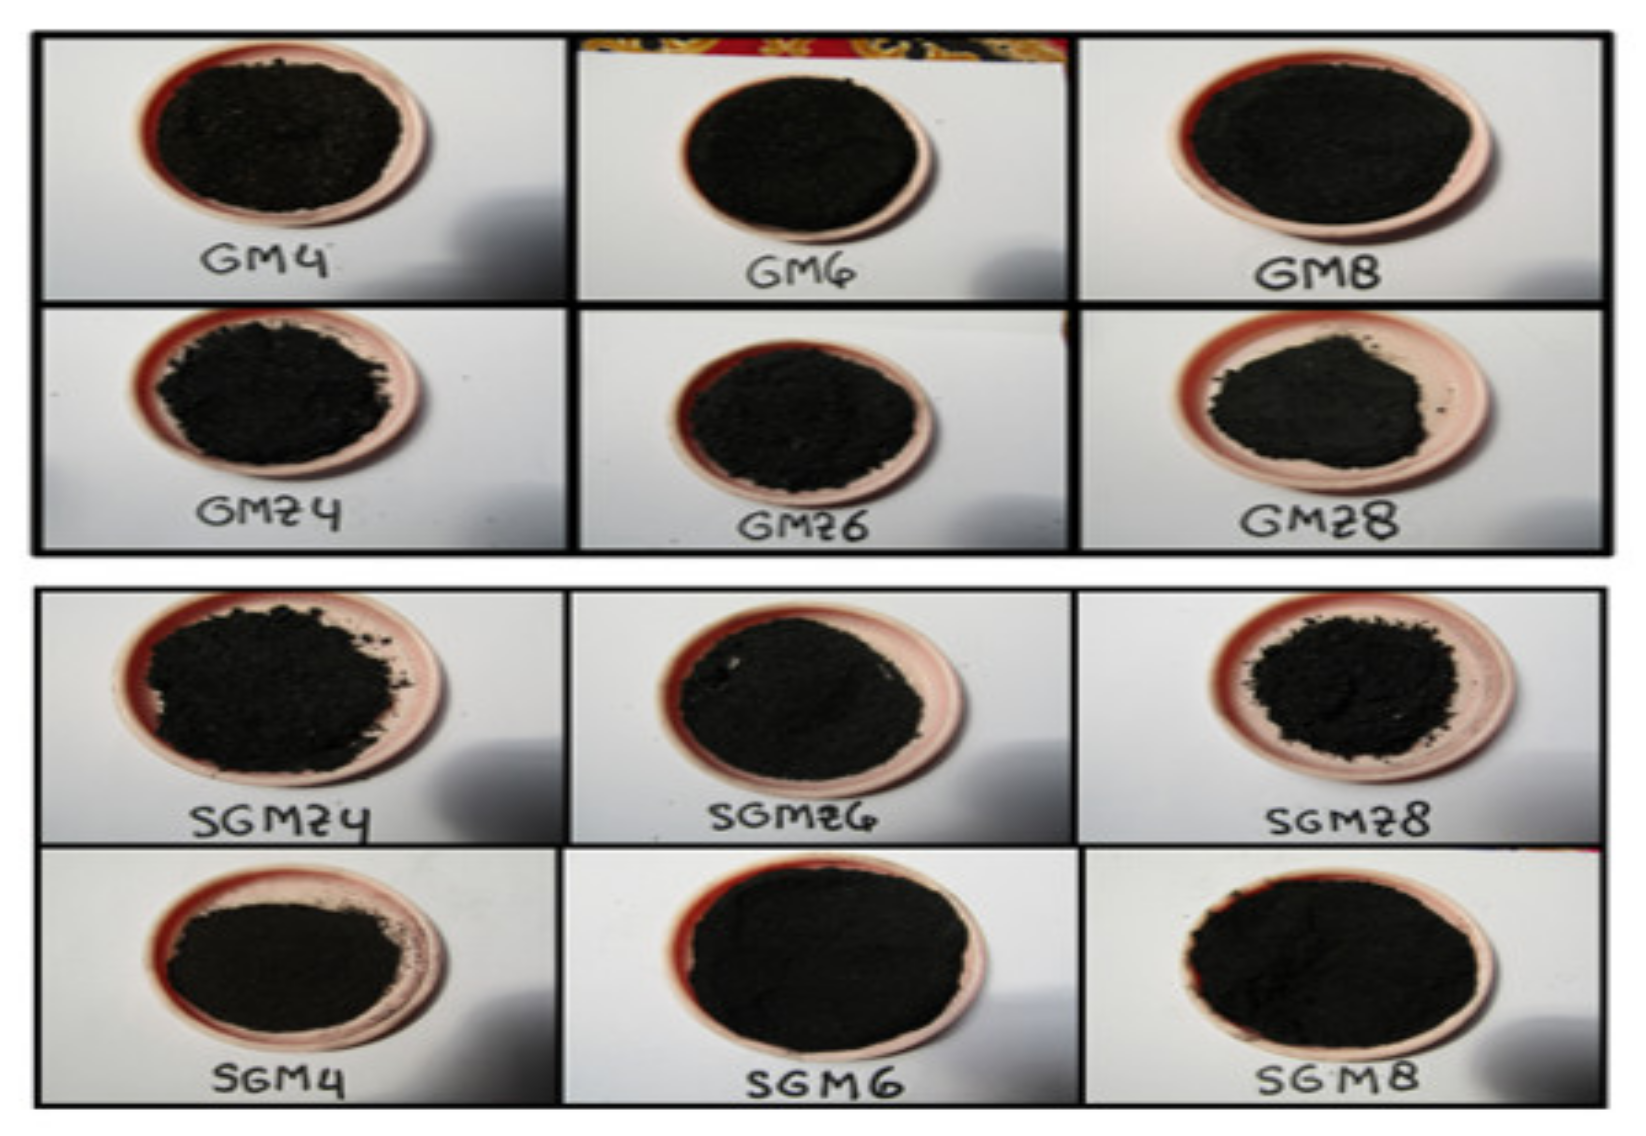
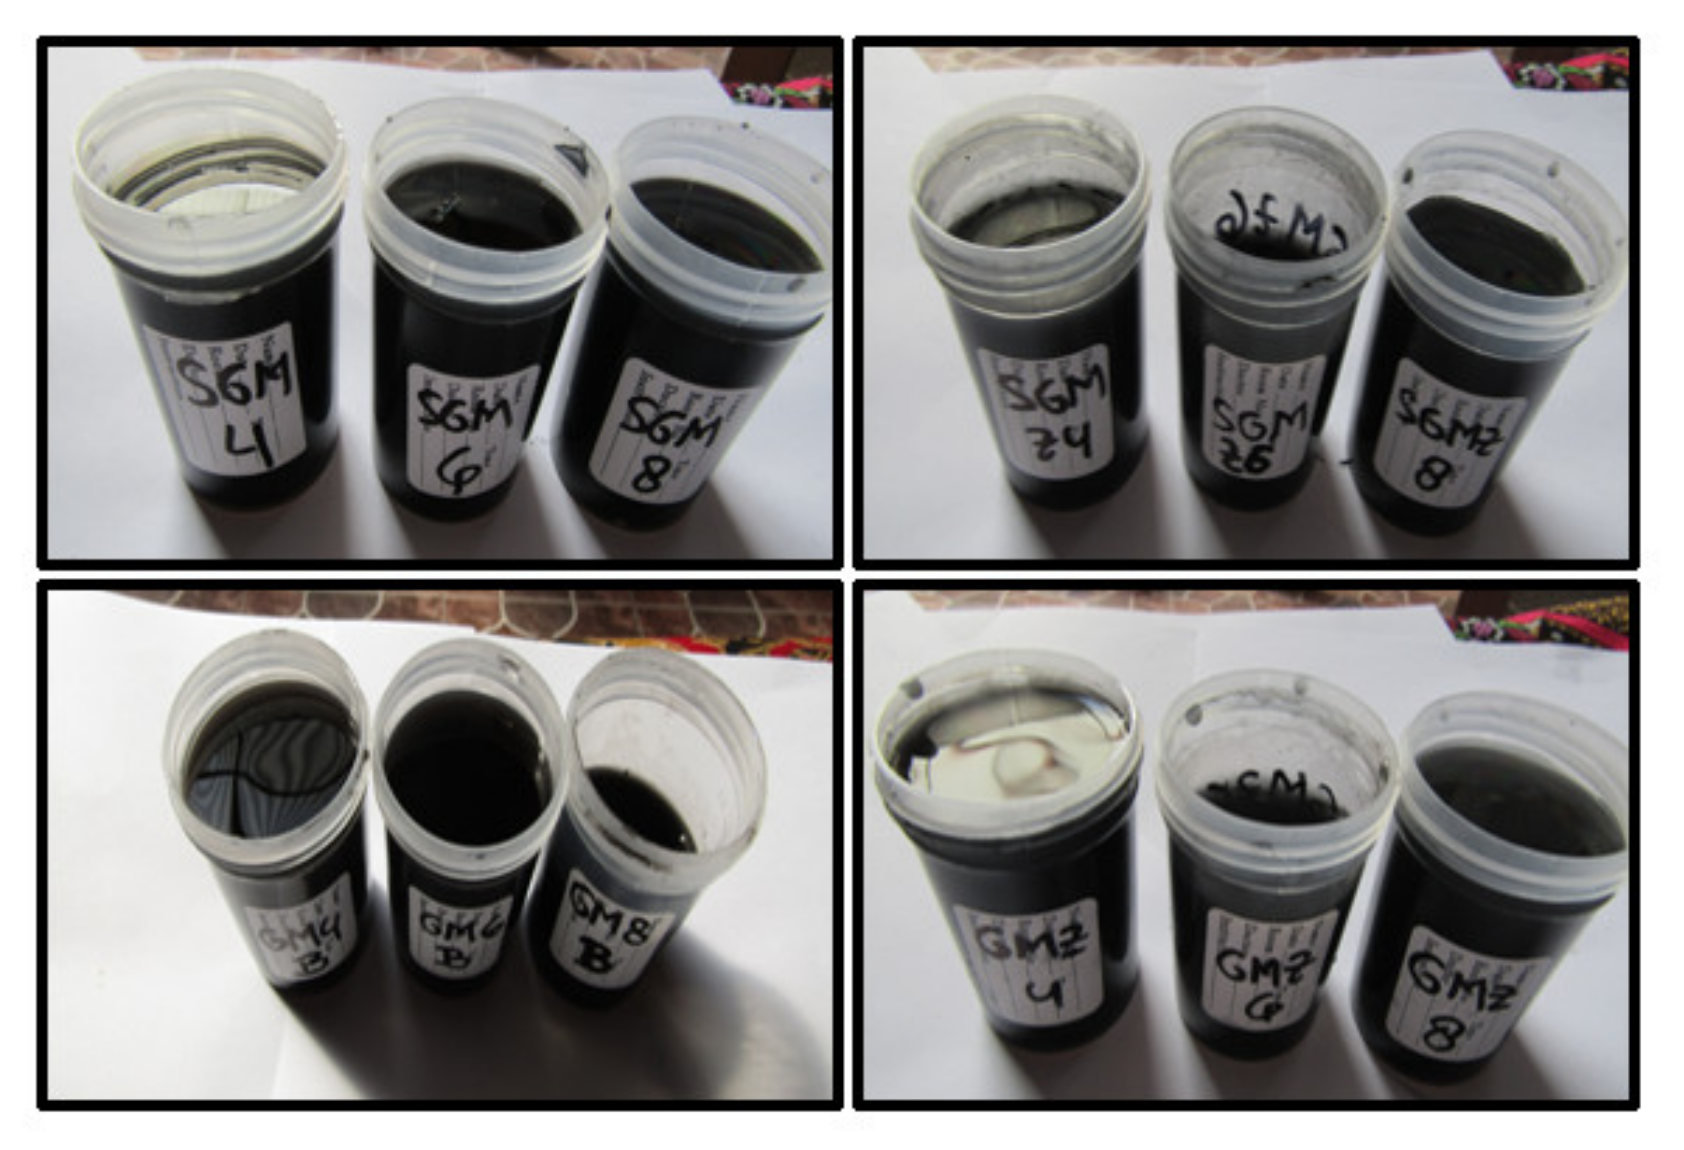
  • Rice husk without ZnCl2 activator—GM4, GM6, GM8;
  • Rice husk with ZnCl2 activator (Z)—GMZ4, GMZ6, GMZ8;
  • Sawdust without ZnCl2 activator—SGM4, SGM6, SGM8;
  • Sawdust with ZnCl2 activator (Z)—SGMZ4, SGMZ6, SGMZ8.
A part of colloids were used to check their stability, and the other part was evaporated by stove to get the CNS and the nanocomposite of ZnO/CNS. The codes of the CNS and the intermediate composites (ZnO/CNS) are as follows:
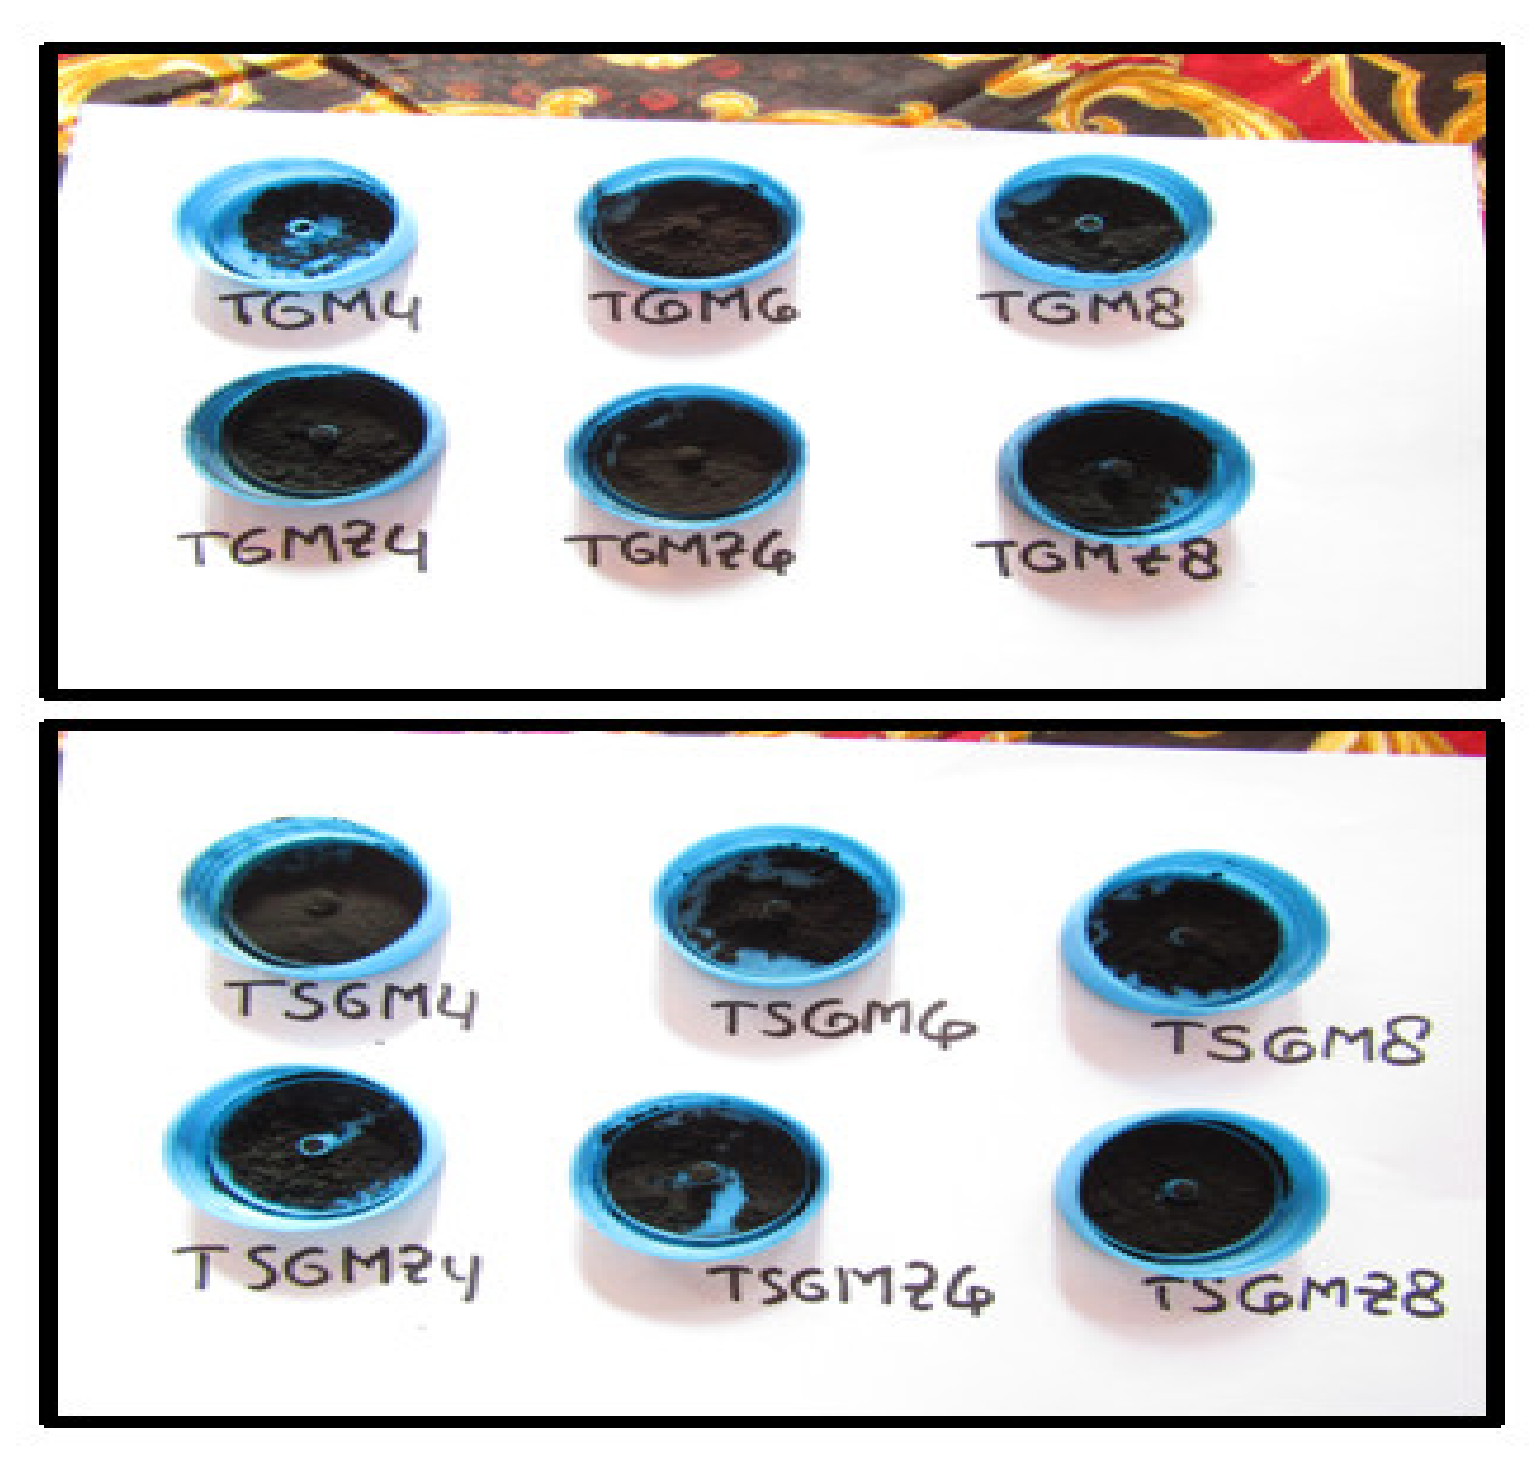
  • Rice husk without ZnCl2 activator—TGM4, TGM6, TGM8;
  • Rice husk with ZnCl2 activator (Z)—TGMZ4, TGMZ6, TGMZ8;
  • Sawdust without ZnCl2 activator—TSGM4, TSGM6, TSGM8;
  • Sawdust with ZnCl2 activator (Z)—TSGMZ4, TSGMZ6, TSGMZ8.
Each intermediate composite (1.0 g) was mixed with KOH (1.34 g), more ZnCl2 (0.20 g), CrCl3·6H2O (0.79 g), the distilled water (1 mL), then was calcined by microwave for 5 min at 600 W in the ceramic with a little hole on top to get product of ZnCr2O4/CNS. Before calcination, the mixture was homogenized manually using a spoon. The mixture was placed in the center of the ceramic and the ceramic was placed in the center of the microwave. The codes of the intermediate composites as follows:
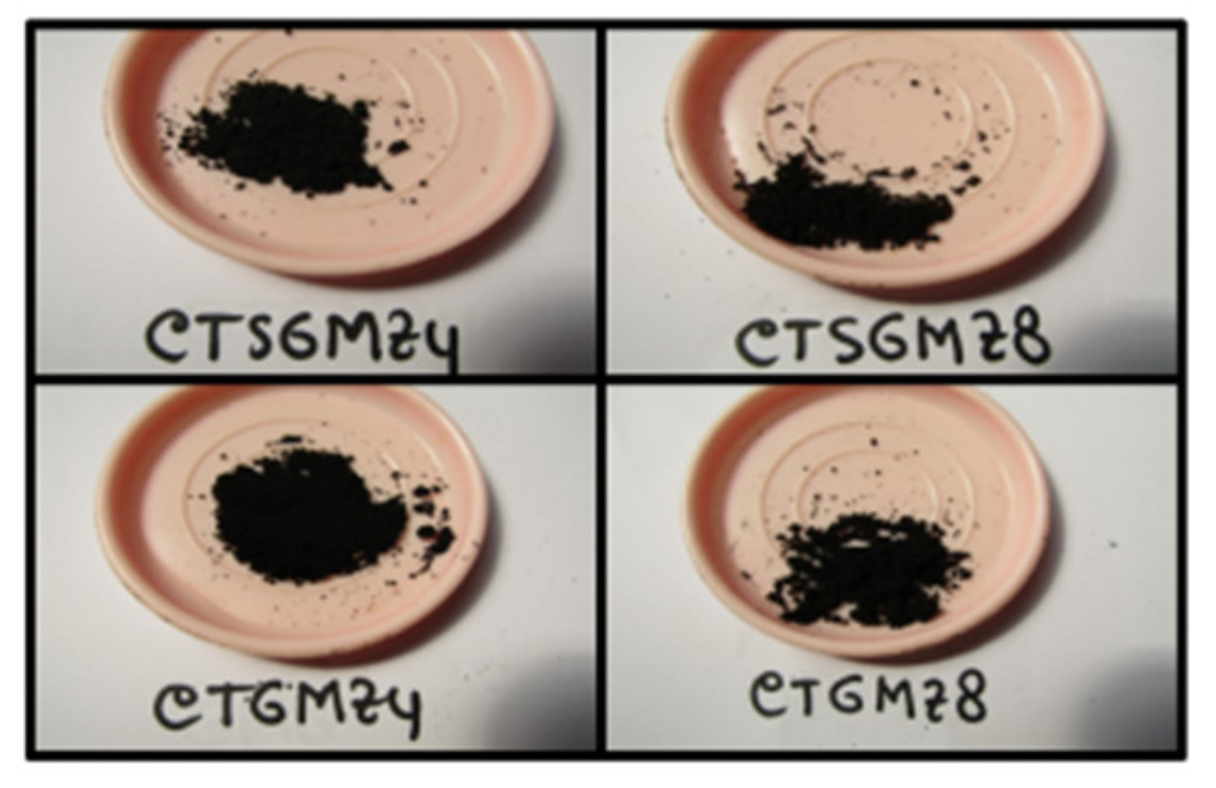
  • Rice husk with ZnCl2 activator (Z)—CTGMZ4, CTGMZ8;
  • Sawdust with ZnCl2 activator (Z)—CTSGMZ4, CTSGMZ8.
The steps in synthesis of ZnO/CNS and MCr2O4/CNS are presented in Figure 1. The earthenware and ceramics for pyrolysis and calcination, respectively, are shown in Figure 2. All those procedures of synthesis were conducted at home due to the COVID-19 pandemic.

2.2.2. Characterization

The ZnO/CNS products were characterized with FTIR spectrophotometry with FTIR spectrometer (SHIMADZU type Prestige 21; Duisburg, Germany), X-ray diffraction by using X-ray diffractometer (PANalitical type XPert PRO; Malvern, Germany), and dispersion test stability by observation using optic photography using the digital camera (CANON PowerShot SX430 IS; Wuxi, China) for 1 h each. The ZnCr2O4/CNS composite was characterized with X-ray diffraction and SEM-EDX (FEI type Inspect-S50; Hillboro, OR, USA).

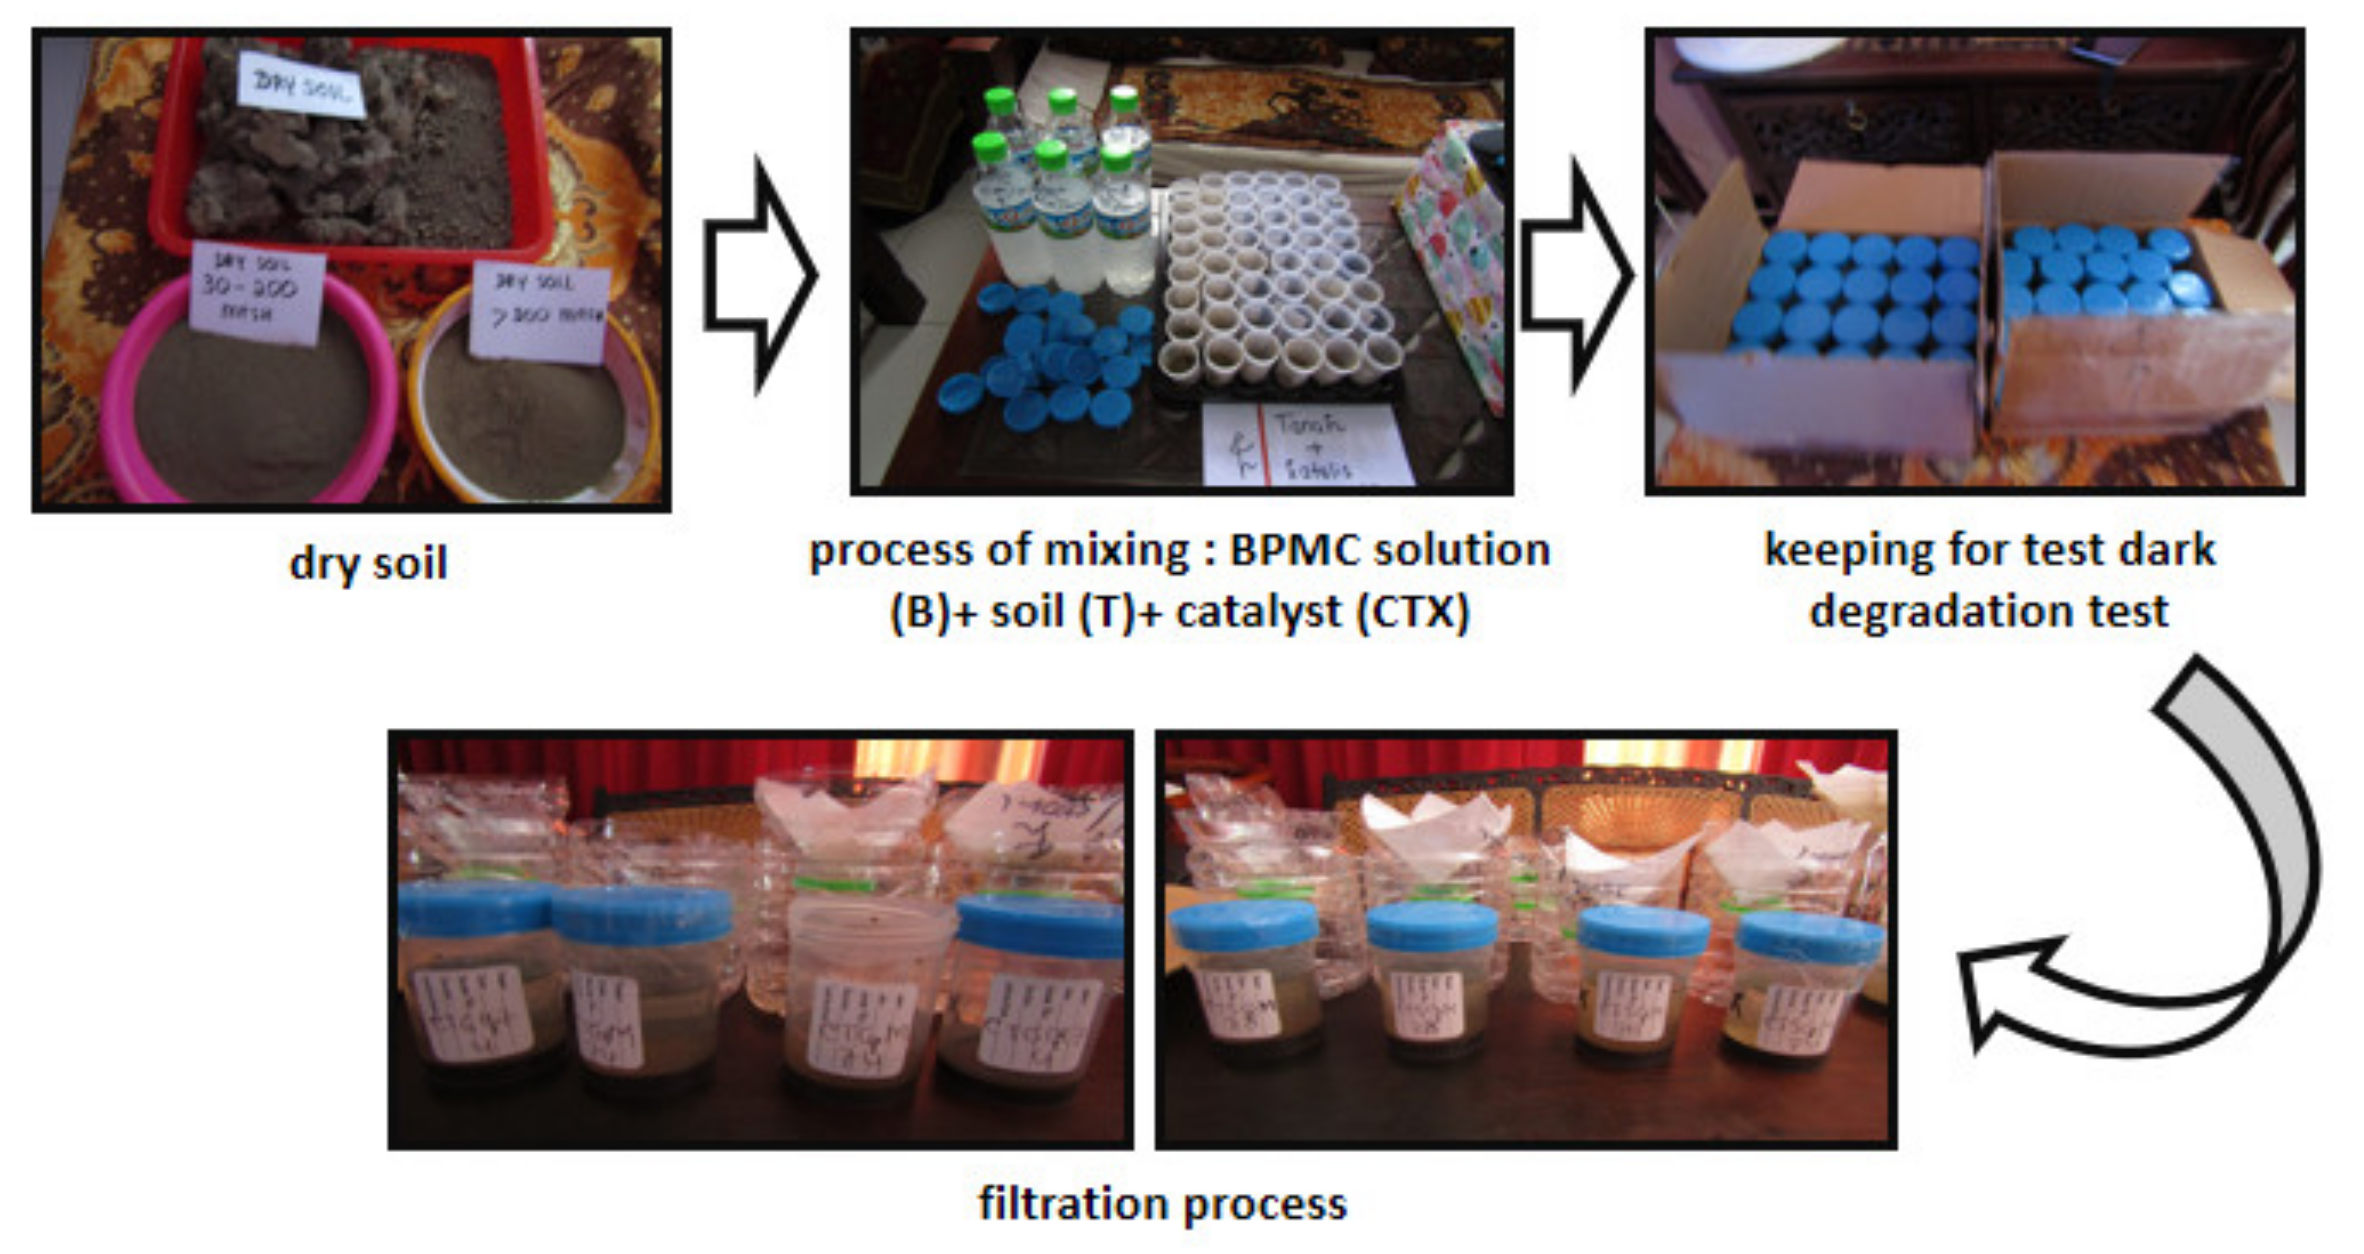
2.2.3. Application of Composite for Dark Degradation Reaction of Pesticide

Application test of composite was conducted in paddy soil media that had been dried at 200 °C for 5 h to deactivate bacteria in the soil which caused degradation reaction biologically. Particle size of the soil was conditioned at a range of >200 mesh. BPMC solution was prepared by dissolving 0.5 mL of the concentrated BPMC (500 g/L) to 500 mL using water. H2O2 solution (0.15%) was prepared by dissolving 25 mL of H2O2 (3%) to 500 mL using water. Dark degradation test of pesticide in the soil was conducted by procedures presented in Table 1 and Figure 3.
Activity of catalytic oxidation reaction can be calculated from difference of TOC in filtrate after treatment with composite–H2O2 and with soil only, as follows:
% degradation = [TOCBT − TOCCTX] × 100%/TOCBT

3. Results and Discussion

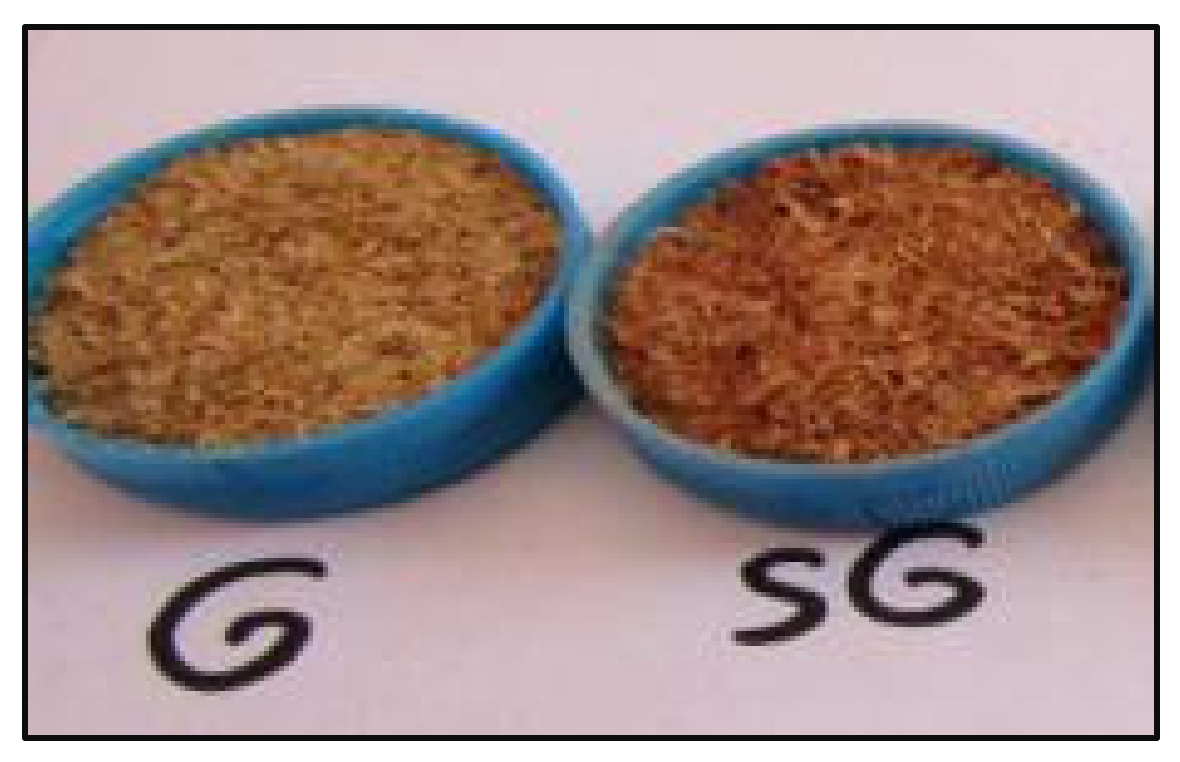
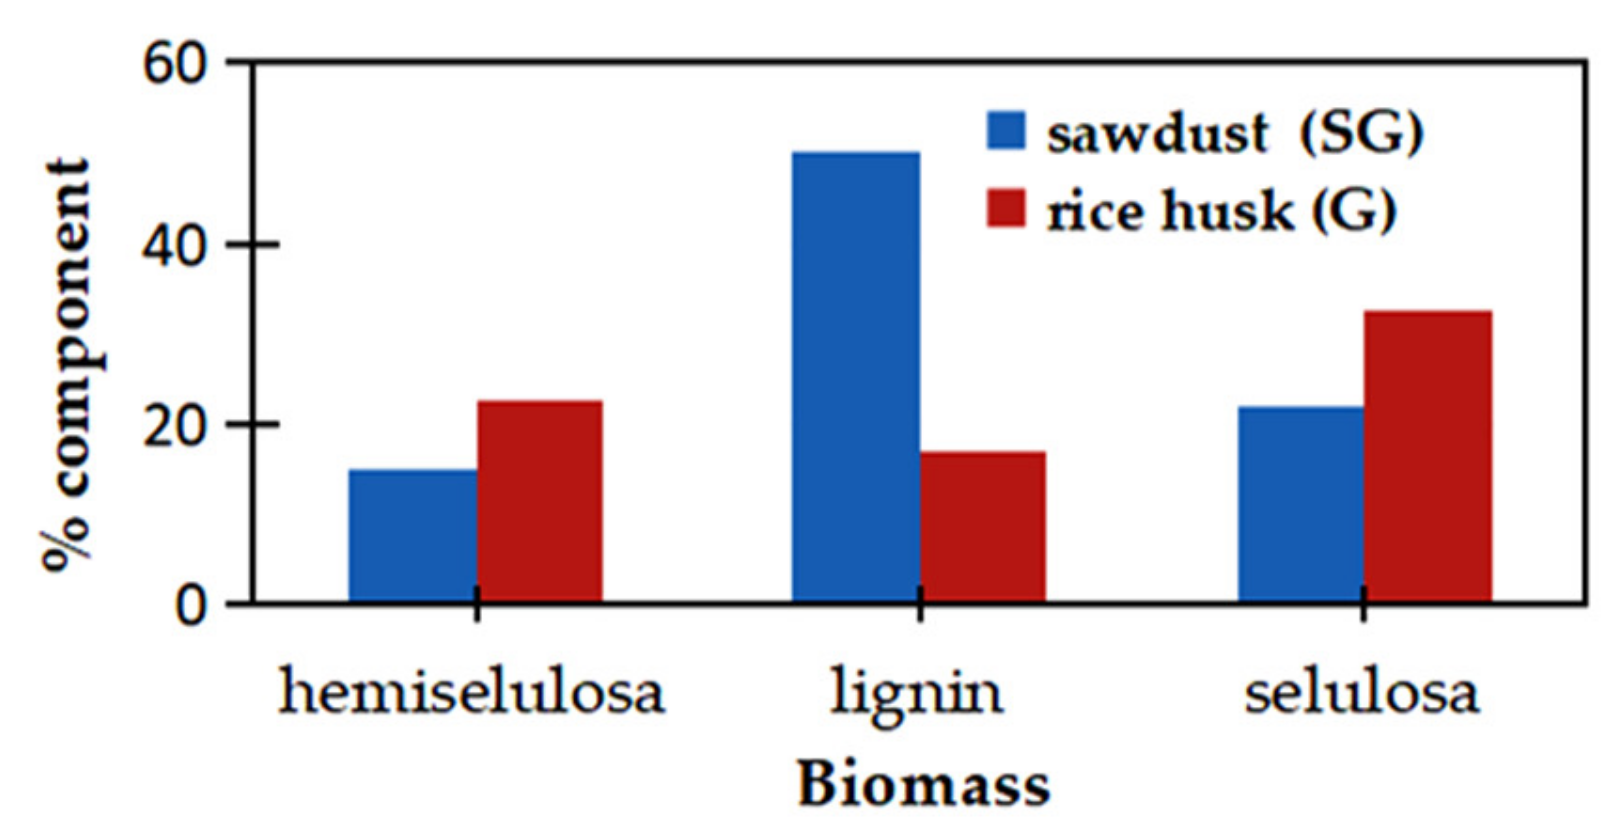
3.1. Synthesis of ZnO/CNS from Different Biomass

Nano composites of ZnO/CNS were synthesized from two kinds of biomass, including sawdust (SG) and rice husk(G). Both biomass pictures before pyrolysis are shown in Figure 4.
Based on chemical analysis by the analysis laboratory, Department of Chemistry, Brawijaya University, the components of biomass are shown in Figure 5. We can see from the Figure 5 that both biomass have the different distribution of lignocellulose components. Cellulose and lignin are the highest component in rice husk and sawdust, respectively. Lignin and cellulose have different chemical structures, especially connected to the number of hydroxide and aromatics structures.
Based on TGA analysis in other research toward each component individually, lignin has a wider range of degradation temperature (220–900 °C) than cellulose (315–400 °C) and hemicellulose (220–315 °C). The weight loss in thermal degradation for cellulose > hemicellulose > lignin [12]. Hemicellulose consists of various saccharides in random arrangement, many branches, and forms an amorphous structure. This condition makes its structure weak and very easy to degrade at relatively low temperatures. Cellulose has a long glucose polymer without branches and forms the good order structure. This structure is very strong so that it has the high thermal stability. Lignin totally has aromatic rings and various branches. This structure is strong and makes the lignin degradation occur in a wide temperature range [44]. This different thermal characteristics affects the characteristics of the carbons.
The pyrolysis reaction by microwave made the biomass material change to the activated carbon. This material transformation was proved by changing of both solid material color and morphology as shown from Figure 5 (biomass) to Figure 6 (the activated carbon). Those photographs of the carbons present the main products of pyrolysis, not the other microwave reaction such as burning reaction or oxidation reaction which should result the white inorganic ash and the gases of CO2 and H2O. In the completed microwave burning reaction with presence of ZnCl2, the white ZnO should be resulted as the ash. It is against the real products in this research which produced the black solids.
Stoichiometrically, the completed burning reactions of lignocellulose components to form gasses and ash which contained ZnO from activator can be predicted as follows:
Lignin: ZnCl2 + [C9H10O3(OCH3)]n → ZnO +10nCO2(g) +(13n − 2)H2O(g) + 2HCl(g)
Cellulose: ZnCl2 + [C6H10O5]n → ZnO + 6nCO2 (g) + (10n − 2)H2O(g) + 2HCl (g)
Hemicellulose: ZnCl2 + (C5H8O4)n → ZnO + 5nCO2 (g) + (8n − 2)H2O(g) + 2HCl (g)
Pyrolysis reaction of the biomass is defined as thermal decomposition of the biomass with uncompleted combustion in absence of air or very limited oxidizing agents [45]. In this research, no adjusting the inert condition for the pyrolysis process, for example by streaming of N2 gas. However, there is a little hole on the earthenware to prevent much contact with air. It means that the carbonization reaction lasts in limited oxygen. It is the reason why the product is the carbon, not the ash.
Mechanism of lignocellulosic pyrolysis includes dehydration, cracking, isomerization, dehydrogenation, aromatization, condensation reactions, and rearrangement [13]. ZnCl2 has the role as the template of pore and chemical activator [18]. As the chemical activator, ZnCl2 works as a dehydrating agent which accelerates the carbonization reaction and inhibits the formation of tar. The role as the dehydrating agent can work well when the activator as the melt. Precursor transfers H2O to the ZnCl2 to form hydrate and the ZnCl2 hydrate releases hydrate again by increasing the temperature [46]. The carbon product maintains the ZnO because no washing was conducted after pyrolysis. The complete stoichiometric pyrolysis reactions for each main component of lignocellulose to produce the carbon are predicted as follows:
Lignin: ZnCl2 + [C9H10O3(OCH3)]n → ZnO + xC + zH2O(g) + 2HCl (g)
Cellulose: ZnCl2 + [C6H10O5]n → ZnO + 6nC + (5n − 2)H2O(g) + 2HCl (g)
Hemicellulose: ZnCl2 + (C5H8O4)n → ZnO + 5nC + (5n − 2)H2O(g) + 2HCl (g)
Presence of ZnO and the carbon can be identified with XRD method because ZnO is crystal and the carbon is mixture of crystal and amorph.
The composite products are still mixture of nano particle and bulk particles, so that blending was applied to obtain the nano size of the composite. Mechanical force during blending process made solid particles collide each other and break to small sizes which were available to form dispersion system. The smaller size makes the attraction force among solid particle decrease and the attraction force between solid particles and H2O molecules increase to form solvation of solid particles by water molecules. The colloids which resulted from the blending process of the carbon and water are presented in Figure 7.
The colloid which is formed by solid particles and water is named as a sol [4]. The solid particles can be dispersed among water molecules due to attraction force between the solid particles and water molecules. There are two kinds of colloids based on the interaction of the dispersed phase and the dispersing phase, including lyophobic and lyophilic colloids. For the lyophilic colloids, colloidal particles have greater affinity toward the dispersion medium, and otherwise less affinity for the lyophobic one [5]. For the surface of the solid particles which are rich of oxy functional groups, hydrogen bonding is available between the solid particles and water molecules, but for almost no oxy functional groups, the induction force is the most possible between aromatics of graphene layers and H2O. The latter is weaker than the former.
Evaporation of the colloids produced nanocomposites which are presented in Figure 8. These products show appearance as the finer powders than before blending treatment (Figure 6). During evaporation, only H2O left the little pan but ZnO and the carbon CNS remained because ZnO has a high boiling temperature, much more than boiling point of water, and the carbon is reactive toward the water molecules to form the volatile substances in high temperature only. For example, activation of the carbon by steam is at 800 °C [47].
Calcination treatment toward the mixture of the intermediate product (ZnO/CNS) and some chemicals including KOH, ZnCl2, CrCl3.6H2O, and 1 drop of H2O resulted in the final products, MCr2O4/CNS, as presented in Figure 9.
The thermal reaction in calcination is predicted stoichiometrically as follows:
ZnO + xC + 2KOH + ZnCl2 + 2CrCl3.6H2O → ZnCr2O4 + (x − 2)C + 2KCl + ZnO + 6HCl(g) + CO2 (g) + 6H2O (g)
Based on the reaction equation, the side products in the final product in this research are KCl and ZnO. The KCl, ZnO, and ZnCr2O4 are crystals, so that their presence in the products can be identified using XRD method in Section 3.6.1.

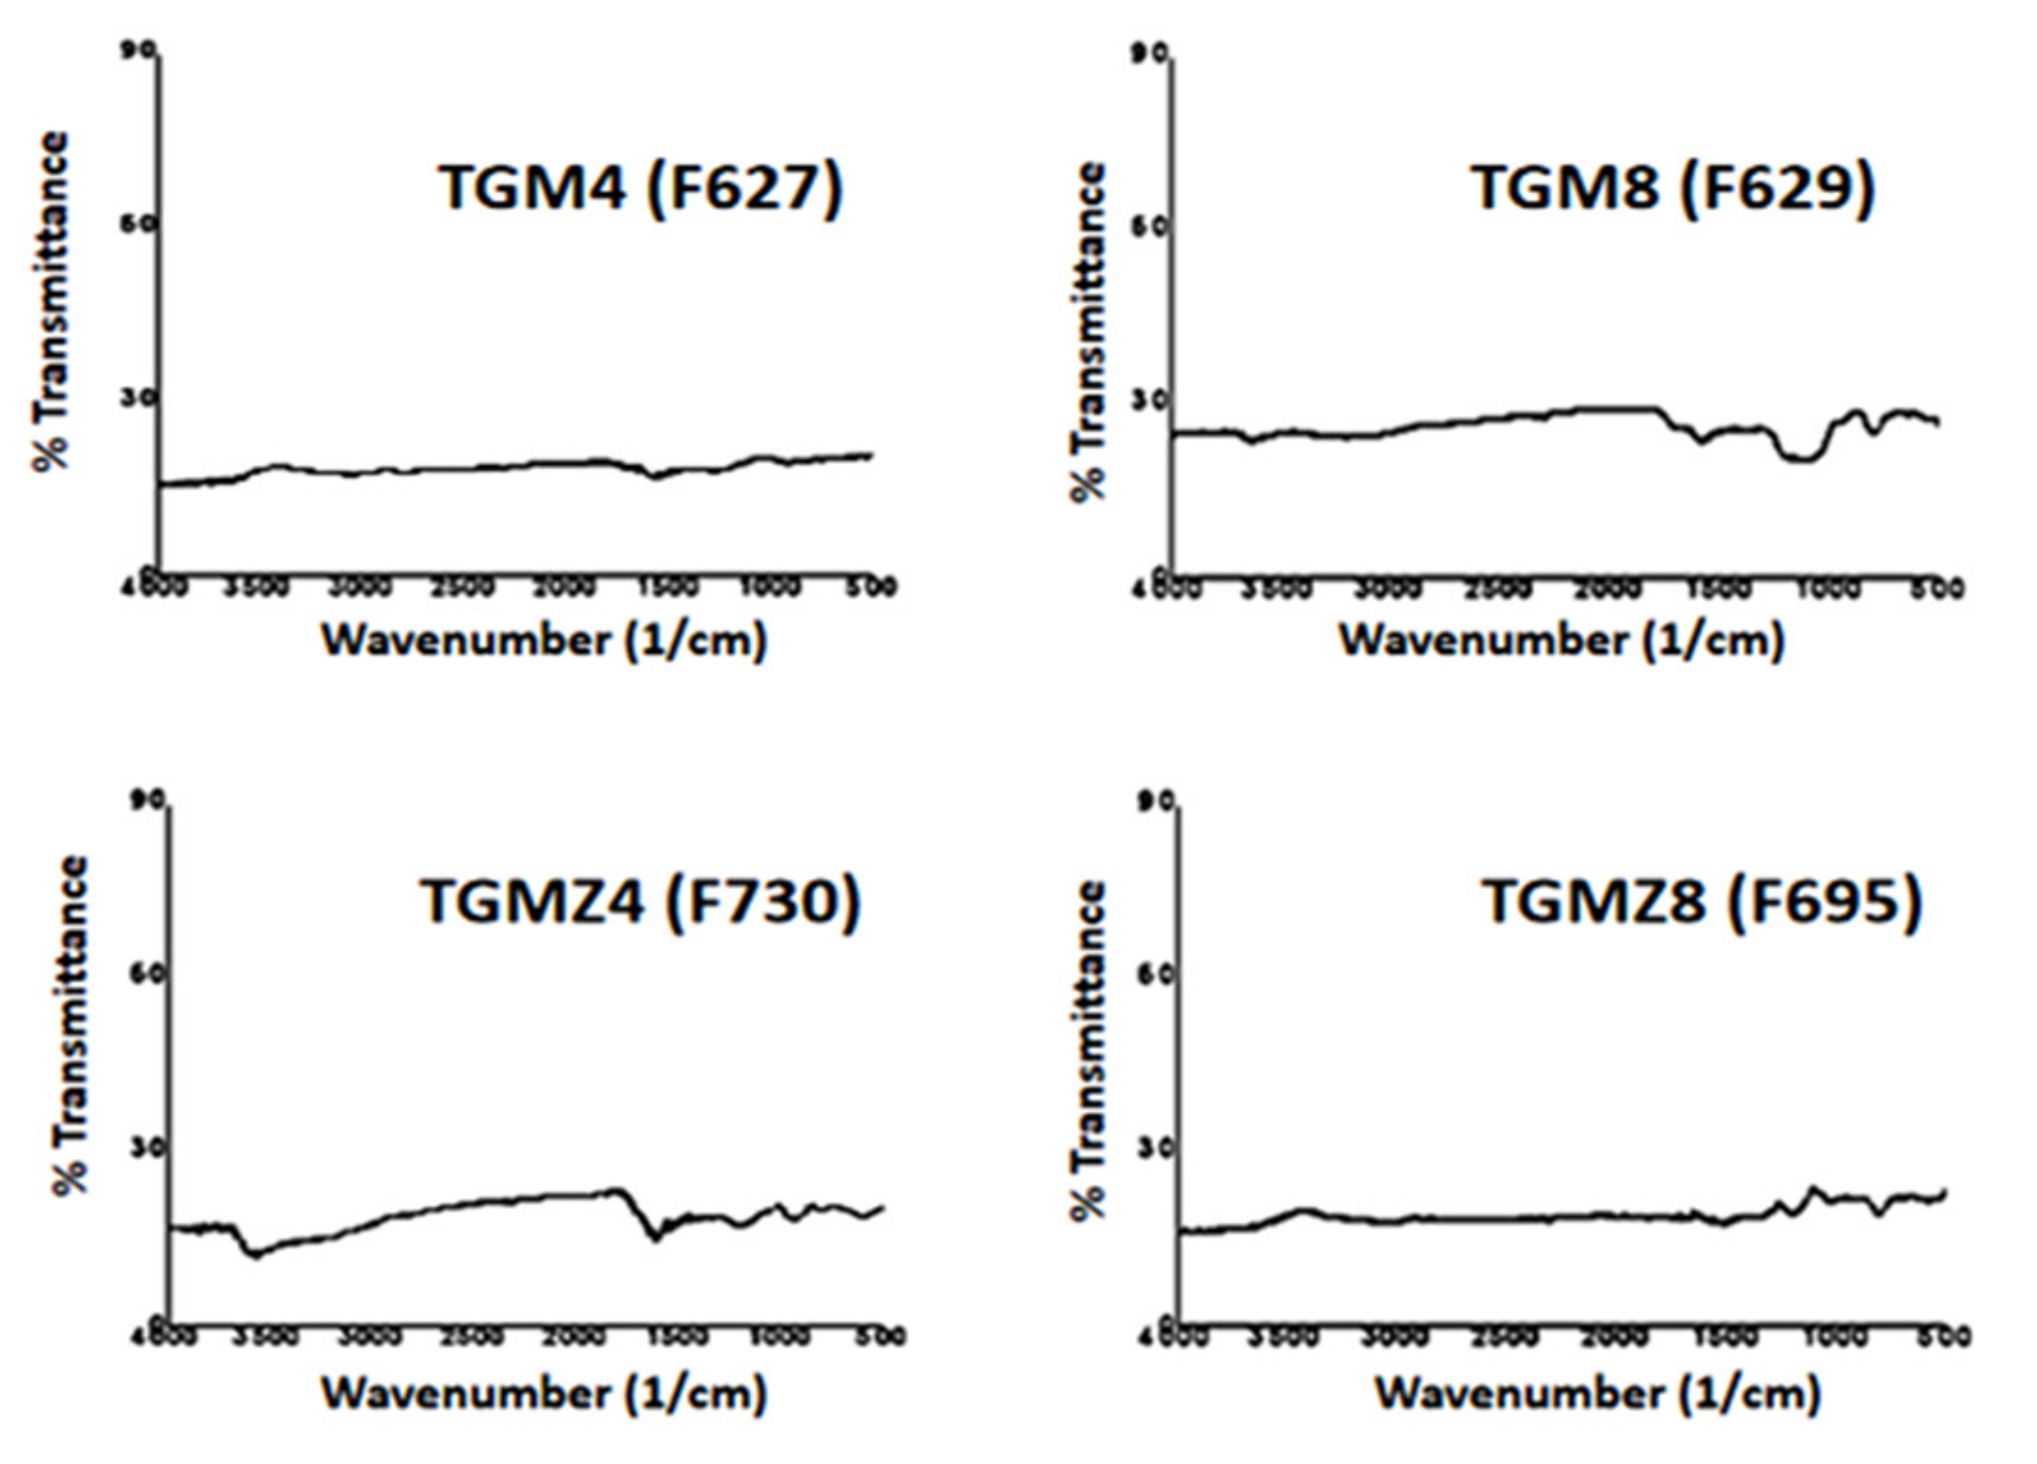
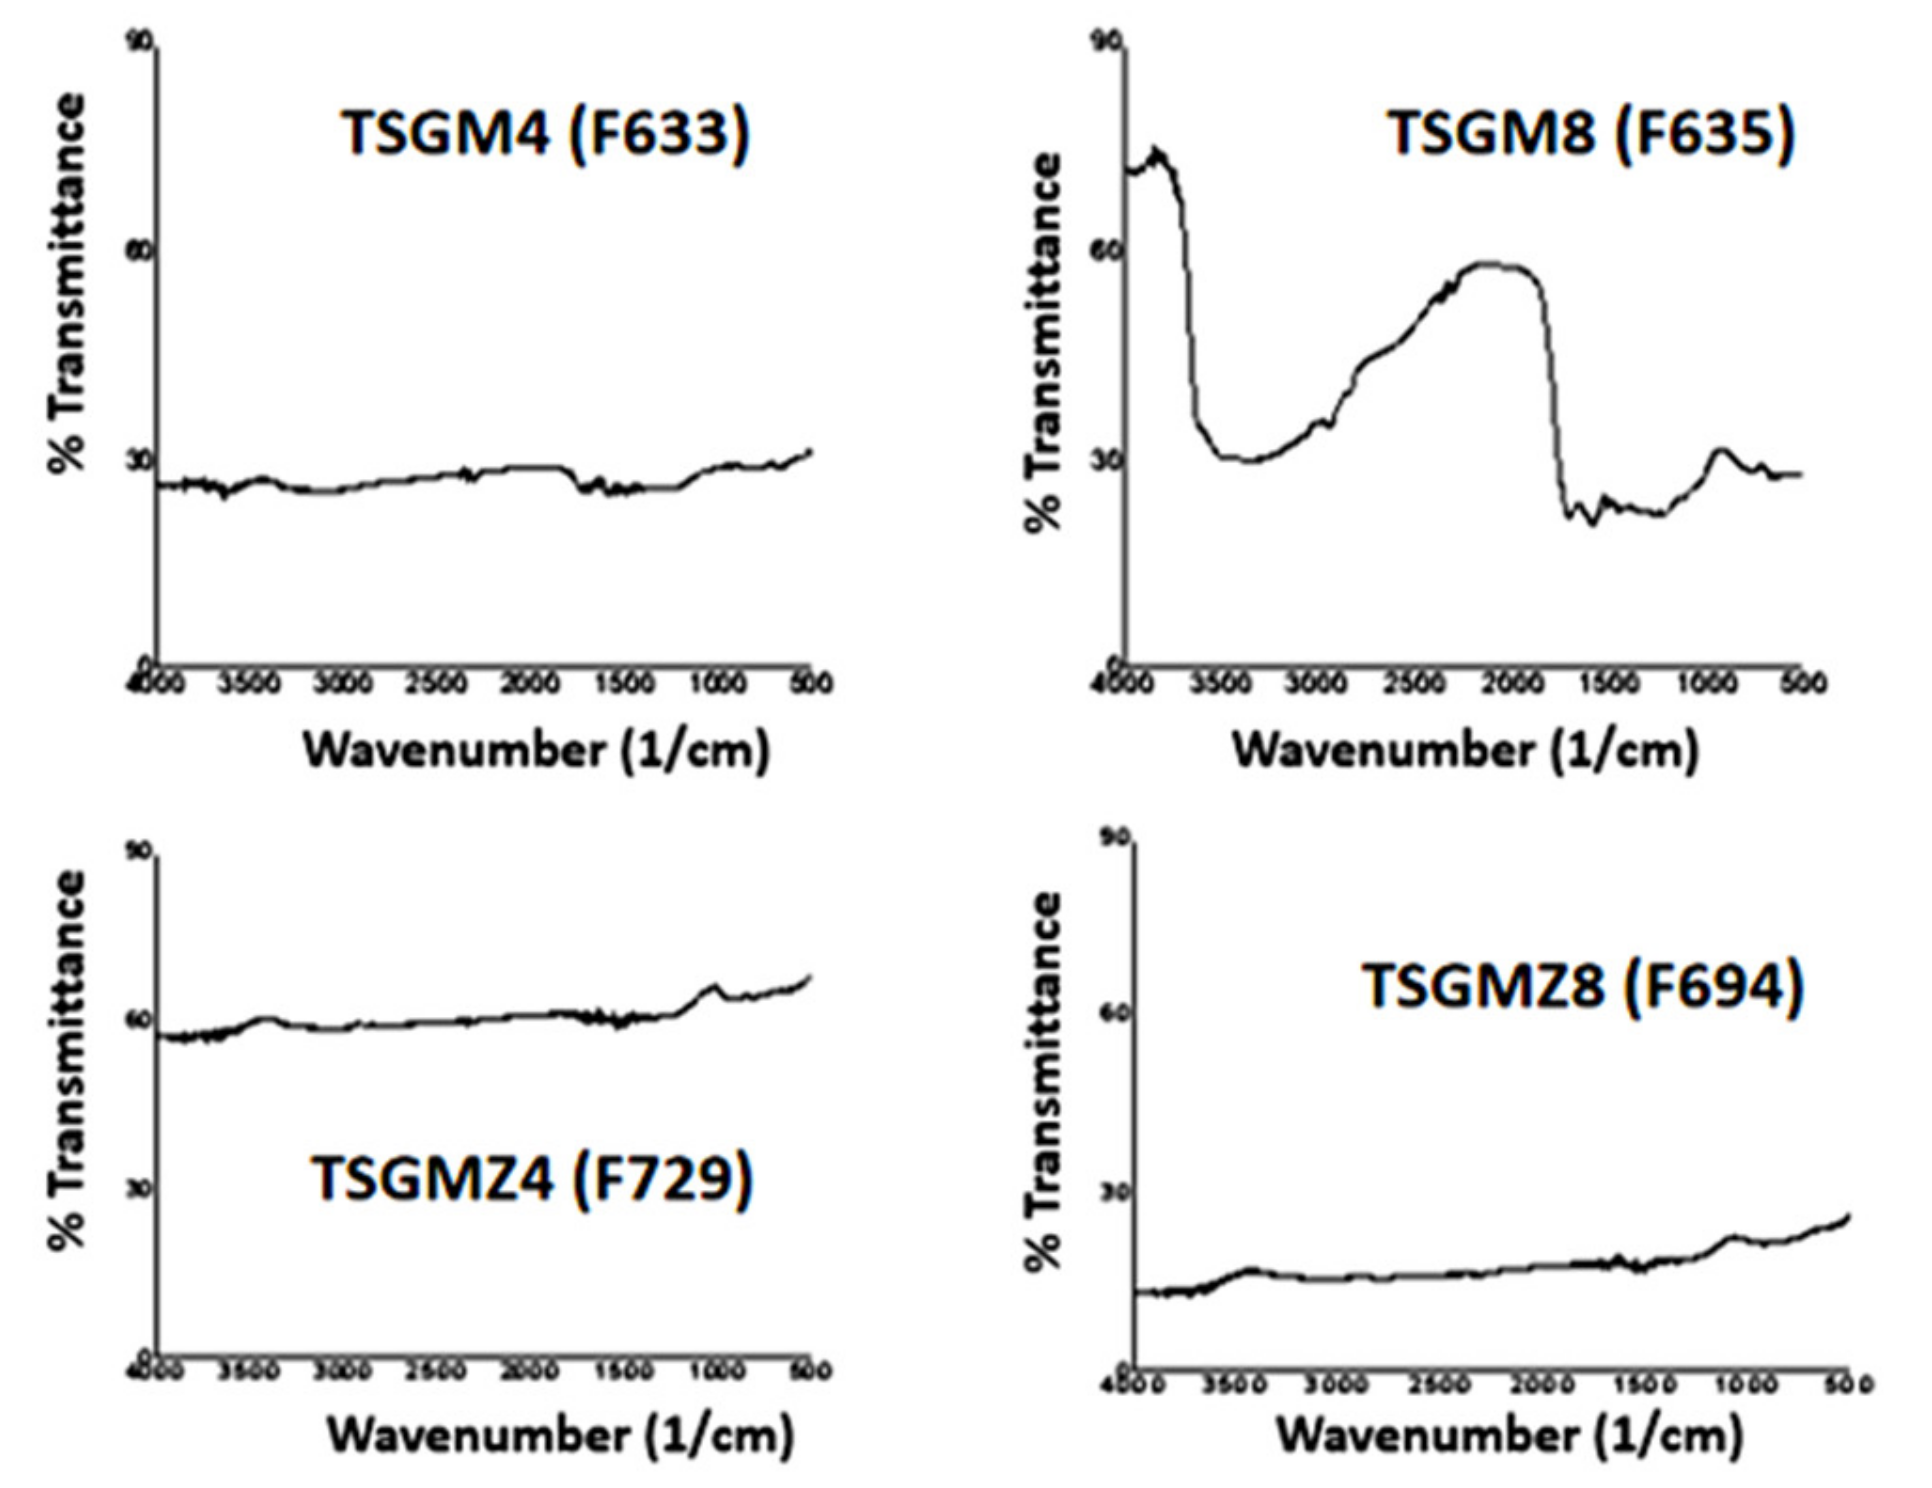
3.2. Influence of Biomass Type and Microwave Pyrolysis Parameters toward Functional Groups of the ZnO/CNS Composites

Nanocarbons (CNS) and composites (ZnO/CNS) have been synthesized from two different biomass at different microwave energy. Characterization of material by FTIR spectrometry is important to determine their functional groups. The only material which contain polar bond and generate dipole changing in their vibration which can be detected by FTIR spectrometer. The polar bond in the carbon is related to polar functional groups on surface of the carbon [48]. The FTIR spectra of the carbon usually related to C=C aromatic structures of the graphene layers, C-H aliphatic hydrocarbon as indicator of carbonization reaction achievement, and oxy functional groups (C=O, C-O, -OH) as a result of oxidation reaction in the process of pyrolysis or activation [49].
The FTIR spectra of the CNS, including TGM4, TGM8, TSGM4, and TSGM8 are shown in Figure 10 and Figure 11, respectively. All codes of samples in the brackets were from Central Laboratory Malang State of University, where the FTIR spectra of the samples were analyzed. The carbons without Z code are such because they are without ZnCl2 in pyrolysis. All those spectra show that the carbons which were obtained from both rice husk (G) and sawdust (SG) without ZnCl2 by pyrolysis at 800 W (TGM8 and TSGM8) have more peaks than at 400 W (TGM4 and TSGM4). It means that pyrolysis at 400 W gave more completed carbonization reaction than at 800 W. The microwave energy of 800 W gave higher temperature than 400 W. In fact, higher temperature of pyrolysis did not always increase carbonization reaction, depend on the used activator [50].
Biomass not only contains the organic substances which can be carbonized to produce the carbon, but also contain inorganic minerals [51,52]. Based on comparison of metal content in both biomass from different references [53,54], it is known that the rice husk contains higher Si and Mg than the sawdust at ratio of weight percentage of Si (14:3) and Mg (8:7). On the other hand, contents of Al, Fe, Ca, Zn are larger in the sawdust than in the rice husk, including in the weight percentage ratio of Al (14:11), Fe (8:3), Zn (38:1), and Ca (13:5). Silica was used as pore template of mesoporous carbon [55]. FeCl3, ZnCl2, MgCl2 were used as activator in pyrolysis of coffee ground [56]. The FeCl3 has a low boiling point of 316 °C. It means that effectivity of activation by FeCl3 lasts at lower temperature.
This difference of metal content was probably responsible for the different sharpness of CNS FTIR spectra which resulted from pyrolysis without ZnCl2 (TGM8 and TSGM8). By assumption that the Fe in the sawdust and the rice husk present as FeCl3, the sharper bands for the carbon of TSGM8 than TGM8, which both resulted from the same 800 W, probably are due to the FeCl3 evaporation at 800 W.
All composites (ZnO/CNS) which resulted from pyrolysis with ZnCl2 activator, including TGMZ4, TGMZ8, TSGMZ4, and TGMZ8, show relatively no peaks or very weak bands of FTIR spectra. It is a sign that the good carbonization reaction lasted. The ZnCl2 is a type of chemical activator which more effectively works at low temperature, especially at lower temperature than its boiling point to prevent evaporation. The boiling point of ZnCl2 is 732 °C [57]. This is why, at study of pyrolysis temperature, the lignin carbonization using ZnCl2 activator increased porosity of the carbon from 500 to 600 °C but decreased again at more than 600 °C [50]. The good microwave carbonization at 400 and 800 W by using ZnCl2 activator indicated that temperature at microwave energy of 800 W is lower than 732 °C so that it is still effective for activation by ZnCl2.

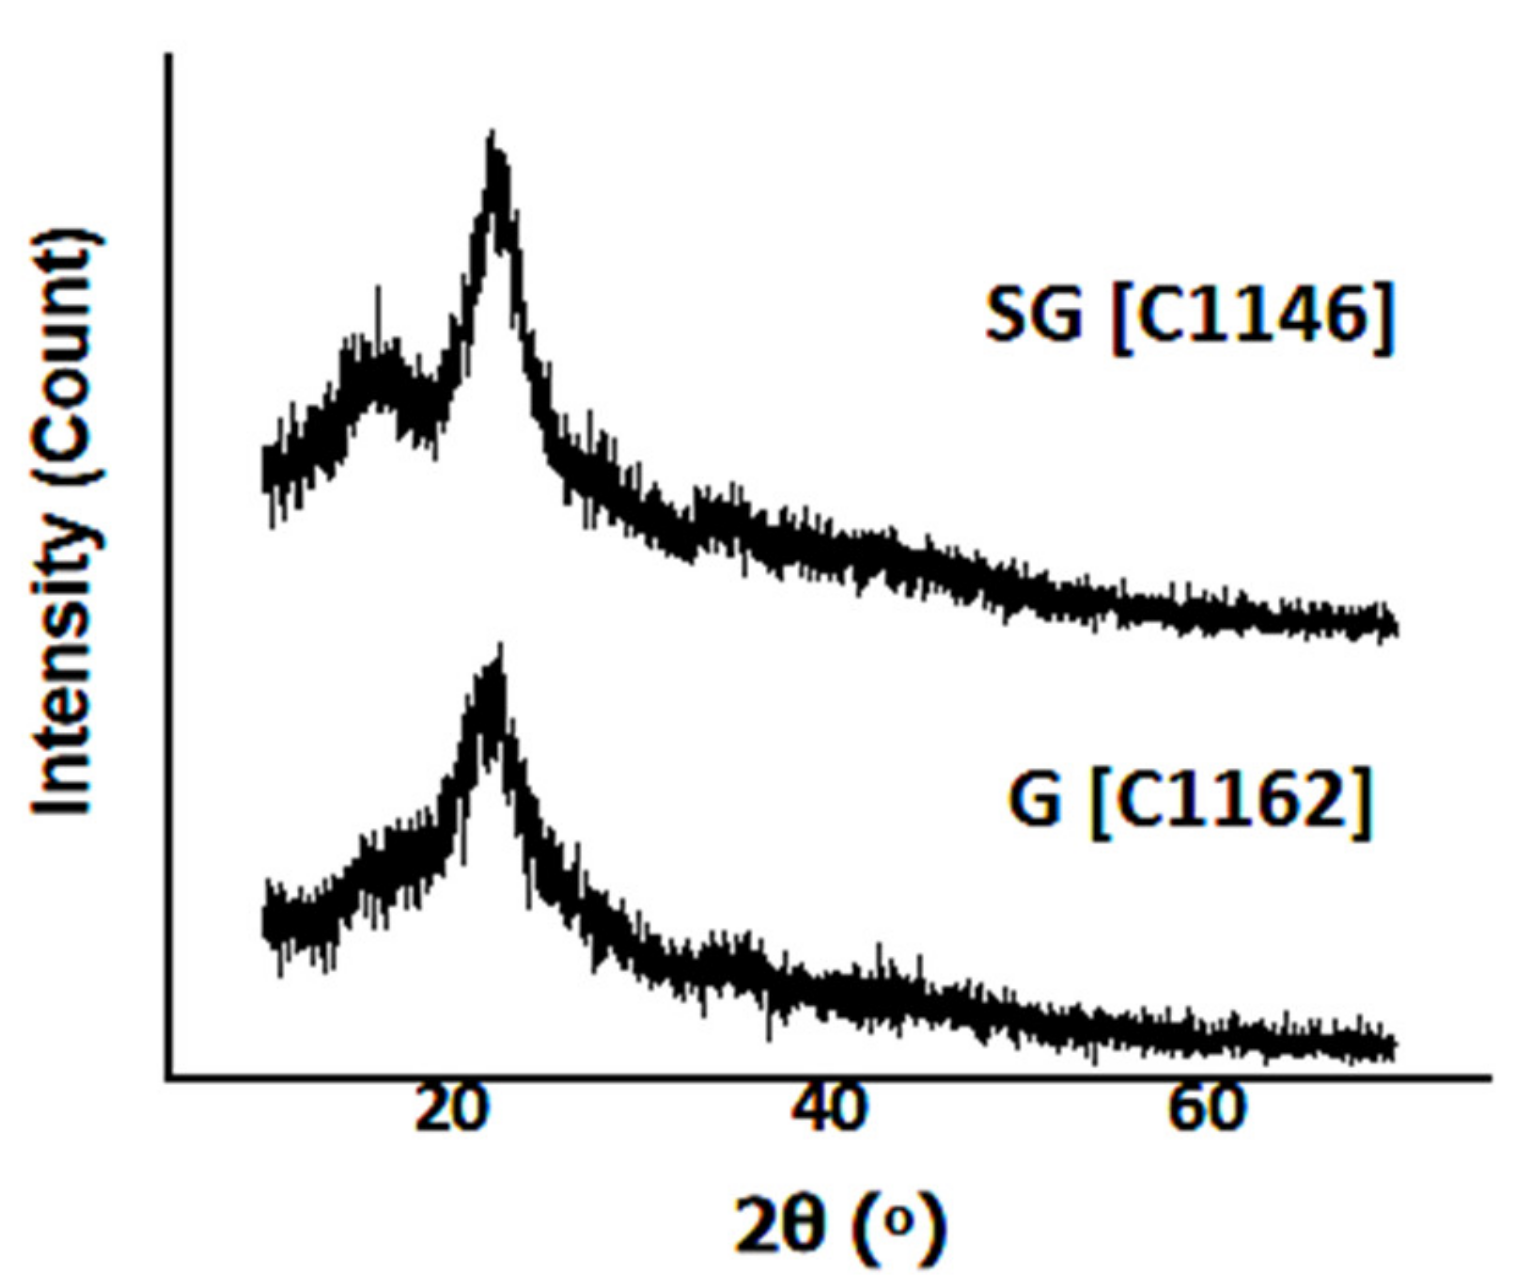
3.3. Influence of Biomass and Microwave Pyrolysis Parameters toward Structure of the ZnO/CNS

Crystal structure is one of important characteristics of a material. X-ray diffraction is good method to identify both carbon and oxide metal crystal structure. It is because each crystal structure consists of the lattice plans which contain ions or atoms. Both particles contain electrons which diffract X-ray [58]. Characterizations of the biomass and composites have been conducted by powder XRD method and their diffractograms are presented in Figure 12 and Figure 13, respectively. The codes in the bracket on diffractograms are codes of samples which were given by LSUM State University of Malang, the instrumental analysis laboratory where the biomass, the carbons, and the composites have been characterized using X-ray diffractometer. The diffractograms were re-made by origin program based on the raw data of X-ray diffractograms from LSUM.
Figure 12 shows the similar diffractogram patterns of sawdust (SG) and rice husk (G). Those patterns are similar patterns to cellulose nanofiber, which is isolated from biomass [59] and pure cellulose [60].
Although the biomass also contains lignin and hemicellulose (Figure 5), both components are amorphous so that they create broad peak of diffractograms. The peaks of the X-ray diffractograms are related to cellulose crystal component. Calculation of the crystallinity index of cellulose in each the biomass gives slightly different values as listed in Table 2. This calculation is based on Equation (1) in other research [59].
C I % = 1 I a m I 200 × 100 %
I200 is the maximum intensity of diffractogram which is related to the diffraction plane in which hkl = 200. The Iam is the diffractogram intensity at 18° 2θ degrees, related to amorphous structure.
Based on the calculation of the crystallinity index, both values are comparable with the crystallinity index of cellulose nanofiber which was isolated from bambusa rigida biomass [59]. However, the rice husk has a higher crystallinity index than the sawdust. It is due to higher content of cellulose in the rice husk than the sawdust, as shown in Figure 5.
After pyrolysis by microwave, the diffractograms of the CNS from rice husk [TGM8] and sawdust [TSGM8] in Figure 13 show the different patterns from the diffractogram of the biomass in Figure 12. Both are similar to the diffractogram of CNT from acetylene gas [61] and the diffractogram of the activated carbon from biomass. Wider peaks at about 25° and 43° can be indexed as (002) and (100/101), respectively [62].
Usage of ZnCl2 activator in pyrolysis process causes emergence of ZnO diffractogram pattern in both TGMZ8 and TSGMZ8. This matches the predicted chemical Equations (R4)–(R6) about the formation of the carbon and ZnO from pyrolysis reaction of each lignocellulose component. Higher power of microwave (800 W) causes higher intensities of diffractogram peaks, indicating higher crystallinity of ZnO. This emergence of ZnO peaks is caused by lower peaks of the carbon diffractograms. This is related to the carbon structure damage due to thermal activation of the carbon by ZnCl2.
Decreasing of X-ray diffractogram peaks indicate erosion of the carbon. It is presented by the X-ray diffractograms of CNS with or without ZnCl2 in Figure 13. The erosion is suffered more by the carbon from sawdust than from the rice husk. This difference of the structure damage is probably caused by the difference of lignocellulose component. The lignin and cellulose are the highest content in sawdust and rice husk, respectively. Both have different structure, especially aromatics and cyclic alkane, respectively. Formation of the carbon structure is more completed by the rice husk than by the sawdust because its structure makes it easier for thermal reaction and rearrangements to occur. The completeness of the structure is related to formation of the graphene layers and chemical interaction between the graphene.

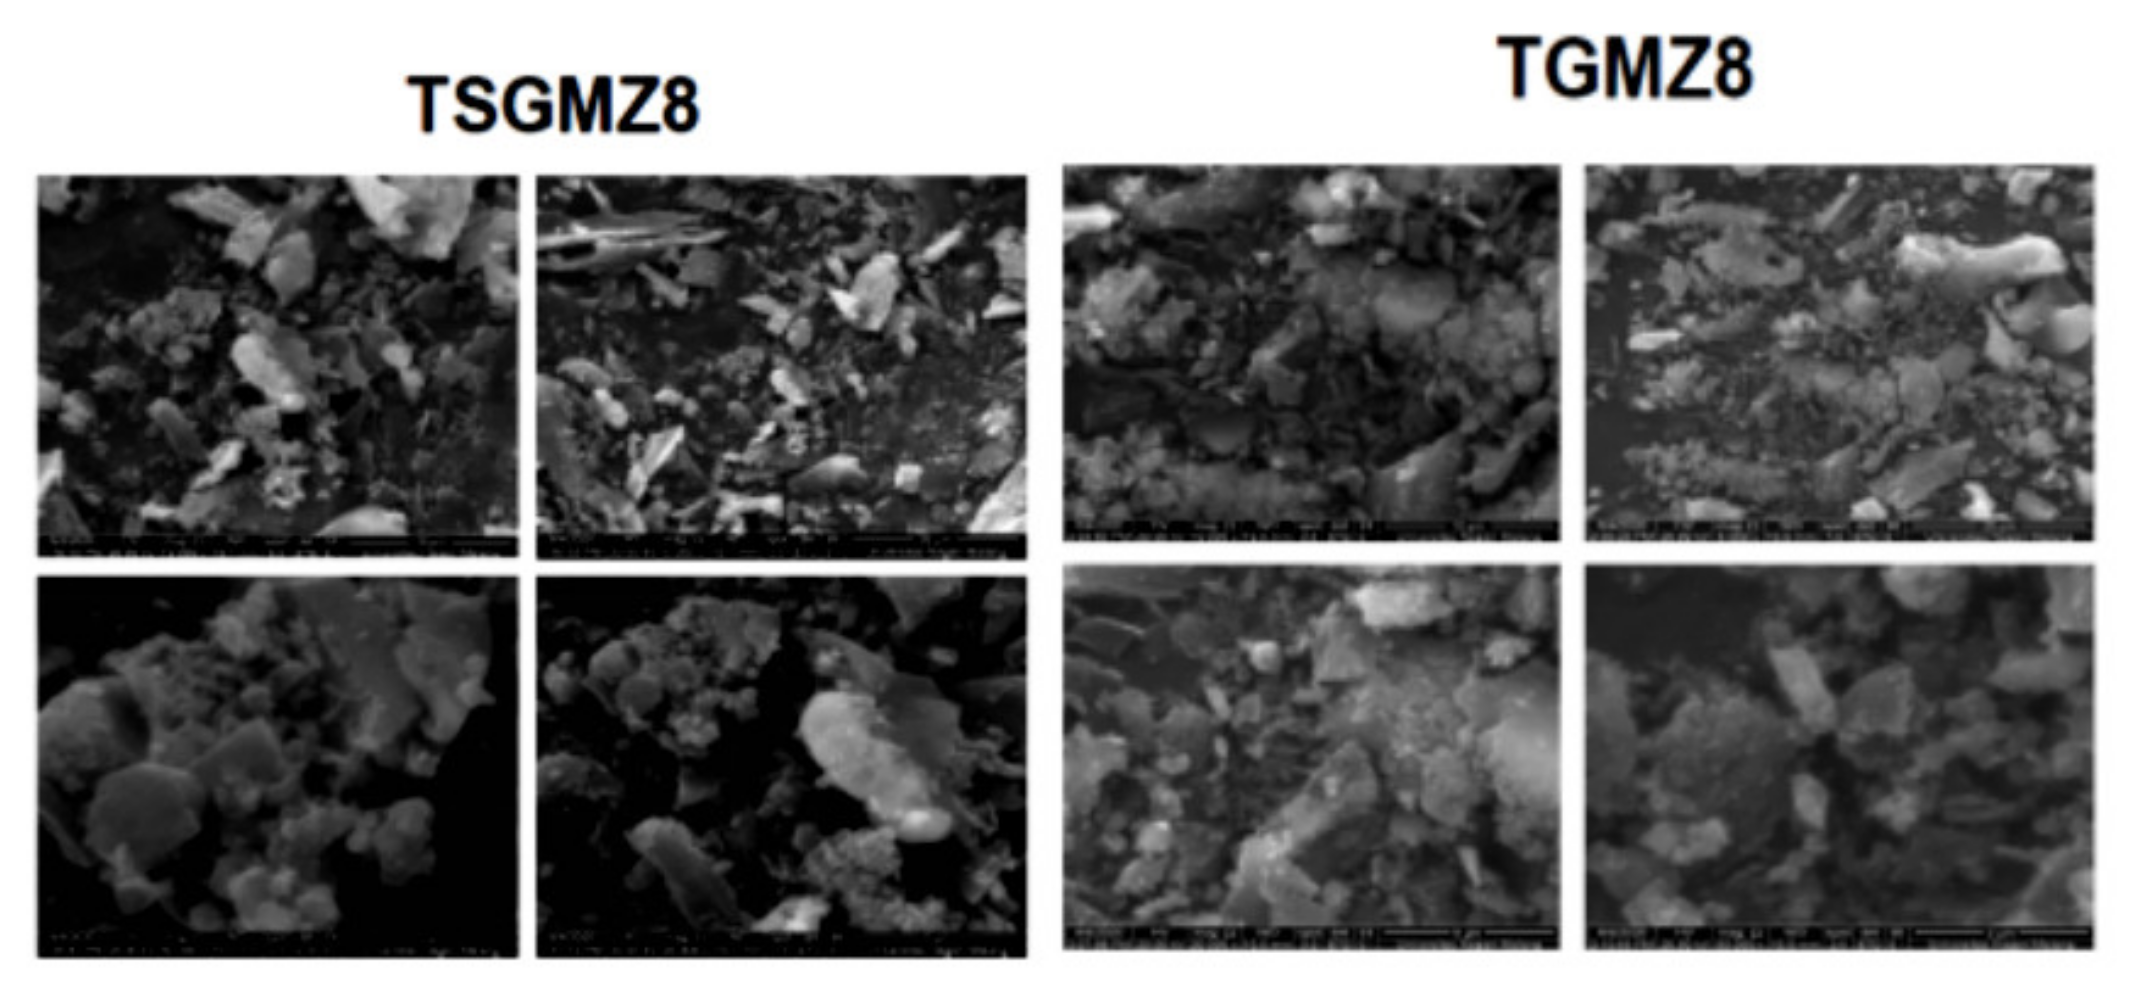
3.4. Influence of Biomass and Microwave Pyrolysis Parameters toward Morphology of the ZnO/CNS

Morphologies of ZnO/CNS composites from pyrolysis of both rice husk and sawdust have been characterized using SEM. The SEM is a useful instrument to identify both morphology and topography of a material. Interaction of material and primary electron beam produces secondary electrons and backscattered electrons in which signals are strengthened and recorded as the image on the monitor screen [63].
Their SEM images are presented in Figure 14. It generally shows that composite of ZnO/CNS from the rice husk (TGMZ8) has comparable particle size with the composite from sawdust (TSGMZ8). This comparable size shows that different distribution of lignocellulose component (Figure 5) gives no significant effect on the morphology and topography of the composites.

3.5. Influence of Biomass and Microwave Pyrolysis Parameters toward Stability of the ZnO/CNS Colloid

Nanofluid is fluids which contain nanoparticles with size of less than 100 nm which are dispersed in base fluids such as water [64]. The stability of the colloids after dispersing process using blending technique was studied. Observation was conducted every 30 min. Result of observation was presented in Figure 15 and Figure 16. Based on the remaining concentration of colloid during observation, the colloids of composites from pyrolysis without activator tend to be more stable than with the activator. The use of ZnCl2 activator causes content of ZnO in the product. This oxide improves attraction force of surface of particles so that aggregation lasts more quickly than without ZnO.
For the same without activator, the composite from rice husk at pyrolysis of 800 W is the most stable, whereas from sawdust, it is the opposite, i.e., pyrolysis at 400 W gave the most stabile colloid. Based on FTIR spectra, composites resulting from pyrolysis at 800 W are richer functional groups than those at 400 W. This functional groups can improve attraction force of particles and make easier the aggregation of particles, and finally decreases the stability of composites. This explanation is available for sawdust. On the other hand, for rice husk, the fact is the opposite: the colloid of the composite resulting from pyrolysis at 800 W is more stable. It is probably because the effect of minerals in rice husk (which did not evaporate in 400 W) toward attraction force of particles is bigger than the effect of functional groups of carbon resulting from pyrolysis at 800 W.

3.6. Characterization of the Final Product ZnCr2O4/CNS Composite by XRD and SEM-EDX

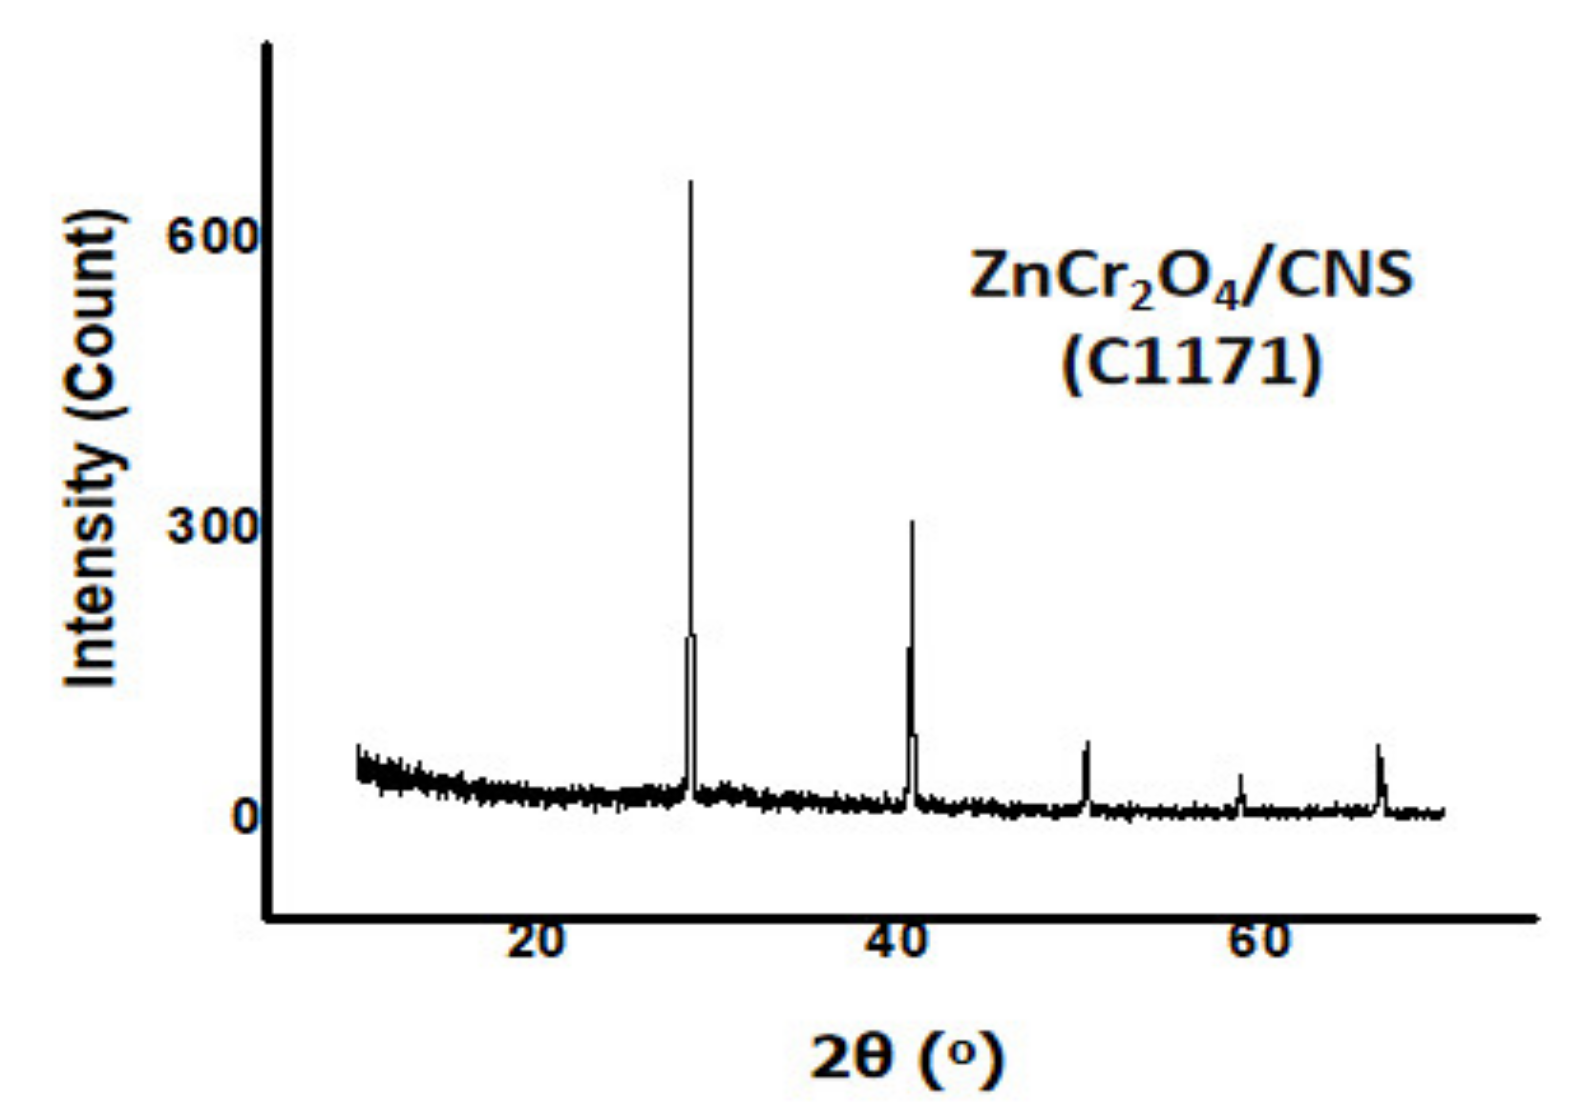
3.6.1. Characterization by XRD

The ZnO/CNS composite has been used for further synthesis of ZnCr2O4/CNS. Only one of two composites was characterized by X-ray diffractometer in this research. This is based on consideration from the previous research [5], which showed very similar patterns of X-ray diffractograms for spinel which were synthesized using different M2+ (Ni2+, Mn2+, Zn2+, Cu2+) and M3+(Fe3+, Cr3+). The X-ray diffractogram of the composite pyrolysis was measured in LSUM State University of Malang with code of sample in the bracket which was given by LSUM. The diffractogram was re-made by origin program based on the raw data of X-ray diffractogram from LSUM, as presented in Figure 17.
This research is about the synthesis of zinc chromite, ZnCr2O4. The ZnCr2O4 (zinc chromite) has a normal spinel structure; the Zn2+ cations occupy at tetrahedral sites and Cr(III) cations occupy at octahedral sites. [27]. The ZnFe2O4 also builds the normal spinel [65]. It means that Cr(III) and Fe(III) occupy the same octahedral sites where the cations make the coordination bonds with the oxygen.
Theoretically, the Fe(III) cation has the d5 orbital. When the Fe(III) makes coordination bond with O2−, this ligand has the potency to donate a lone pair to make a pi bond with the d5 orbital of Fe(III). This potency makes d5 of the Fe(III) become the high spin. If Fe(III) cation bonds with O2− in high spin, the cation radii of Cr(III) and Fe(III) are comparable, so that, consequently, the unit cell size of ZnCr2O4, d-spacing, and 2thetha are comparable to of the ZnFe2O4. It means that the positions of 2thetha for every peak of ZnCr2O4 is relatively the same with the position of 2thetha with ZnFe2O4.
In reality, based on result of synthesis in previous research using Cr(III) and Fe(III), with various M(II) including Mn2+, Zn2+, Ni2+, and Cu2+, all gave the very similar patterns of X-ray diffractograms [8]. It indicates that Fe(III) and O2− makes a coordination bond with high spin of the d5 orbital.
The crystal structure can be identified quickly by only using the three highest peaks of the standard [58]. To identify the final composites, some data of X-ray diffractograms were used, including ZnCr2O4 (AMCSD), Cr2O3 (AMCSD,) ZnO (AMCSD), and KCl (AMCSD). Based on data of standard from AMCSD, the highest peaks of the X-ray diffractograms are listed in Table 3.
The positions list of peaks in diffractogram of the composite product (Figure 16) as 2thetha(IR) are as follows: 28.35(100); 40.52(0.035); 50.20(10); 58.62(0.5); 66.39(62). Based on the comparation to data of the composite’s diffractogram and the highest peaks of the standard from AMCSD database, it is obtained that all main peaks of KCl confidently match with peaks of the composite.
There are some considerations and assumptions to make interpretation more than KC, as follows: (1) consideration that the highest peak in diffractogram of spinel sample can be not the highest in diffractogram of spinel standard (AMCSD) for the same substance, even regarding synthesis from the chemicals [66]; (2) assumption that the highest diffractogram peak may be not detected due to poor crystallinity of ZnCr2O4 compared to the high crystallinity of KCl, as consequence of the short time calcination (5 min) using microwave; (3) consideration that the analysis by EDX reported the presence of Cr, Zn, and O in the composite (Figure 18 and Figure 19); (4) consideration that the EDX analysis also reported that the final composite contained K and Na (Figure 18 and Figure 19). Both Na+ and K+ like to make coordination bonds with oxygen in octahedral structure. The Na+ also makes coordination in tetrahedral structure where the ionic radii of Na+ and K+ are 1.02 and 1.38 Å, respectively, in six coordination numbers. The Na+ also forms four coordination numbers with the ionic radii of 0.99 Å [67]. It means that K+ can substitute Cr(III) in octahedral sites and Na+ can substitute both Cr(III) and Zn2+ in octahedral and tetrahedral sites, respectively.
Based on those considerations and assumptions, it can create the interpretation that two highest peaks of standard ZnCr2O4 (AMCSD) is close to two peaks of the final composites, including 30.35 (standard), which is close to 28.35° (sample), and 63.15 (standard), which is close to 58.62° (sample). It means that the final product probably contains ZnCr2O4. Interpretation about presence of Cr2O3 become possible too in the final product when two peaks of Cr2O3 are close to two peaks of the final composite, including 33.65° (standard), which is close to 28.35° (sample), and 54.94° (standard), which is close to 50.20° (sample).
The shift of peak to lower 2thetha (higher d-spacing, larger unit cell) is probably due to other larger cations which come from the inorganic biomass or chemicals in calcination which substitute Zn(II) or Cr(III) in the ZnCr2O4 structure.
By using data of the highest peak of the final composite (FWHM = 0.1181° and 2θ = 28.3552°), the crystallite size of the final composite can be calculated using Scherer formula 2 [28,58]. The crystallite size of the final composite is 74.99 nm.
D = 0.9 λ β C o s θ
D is crystal size, λ is wavelength of X-ray, β is full width at half maximum of peak in radians (FWHM), θ is Bragg angle in radians.

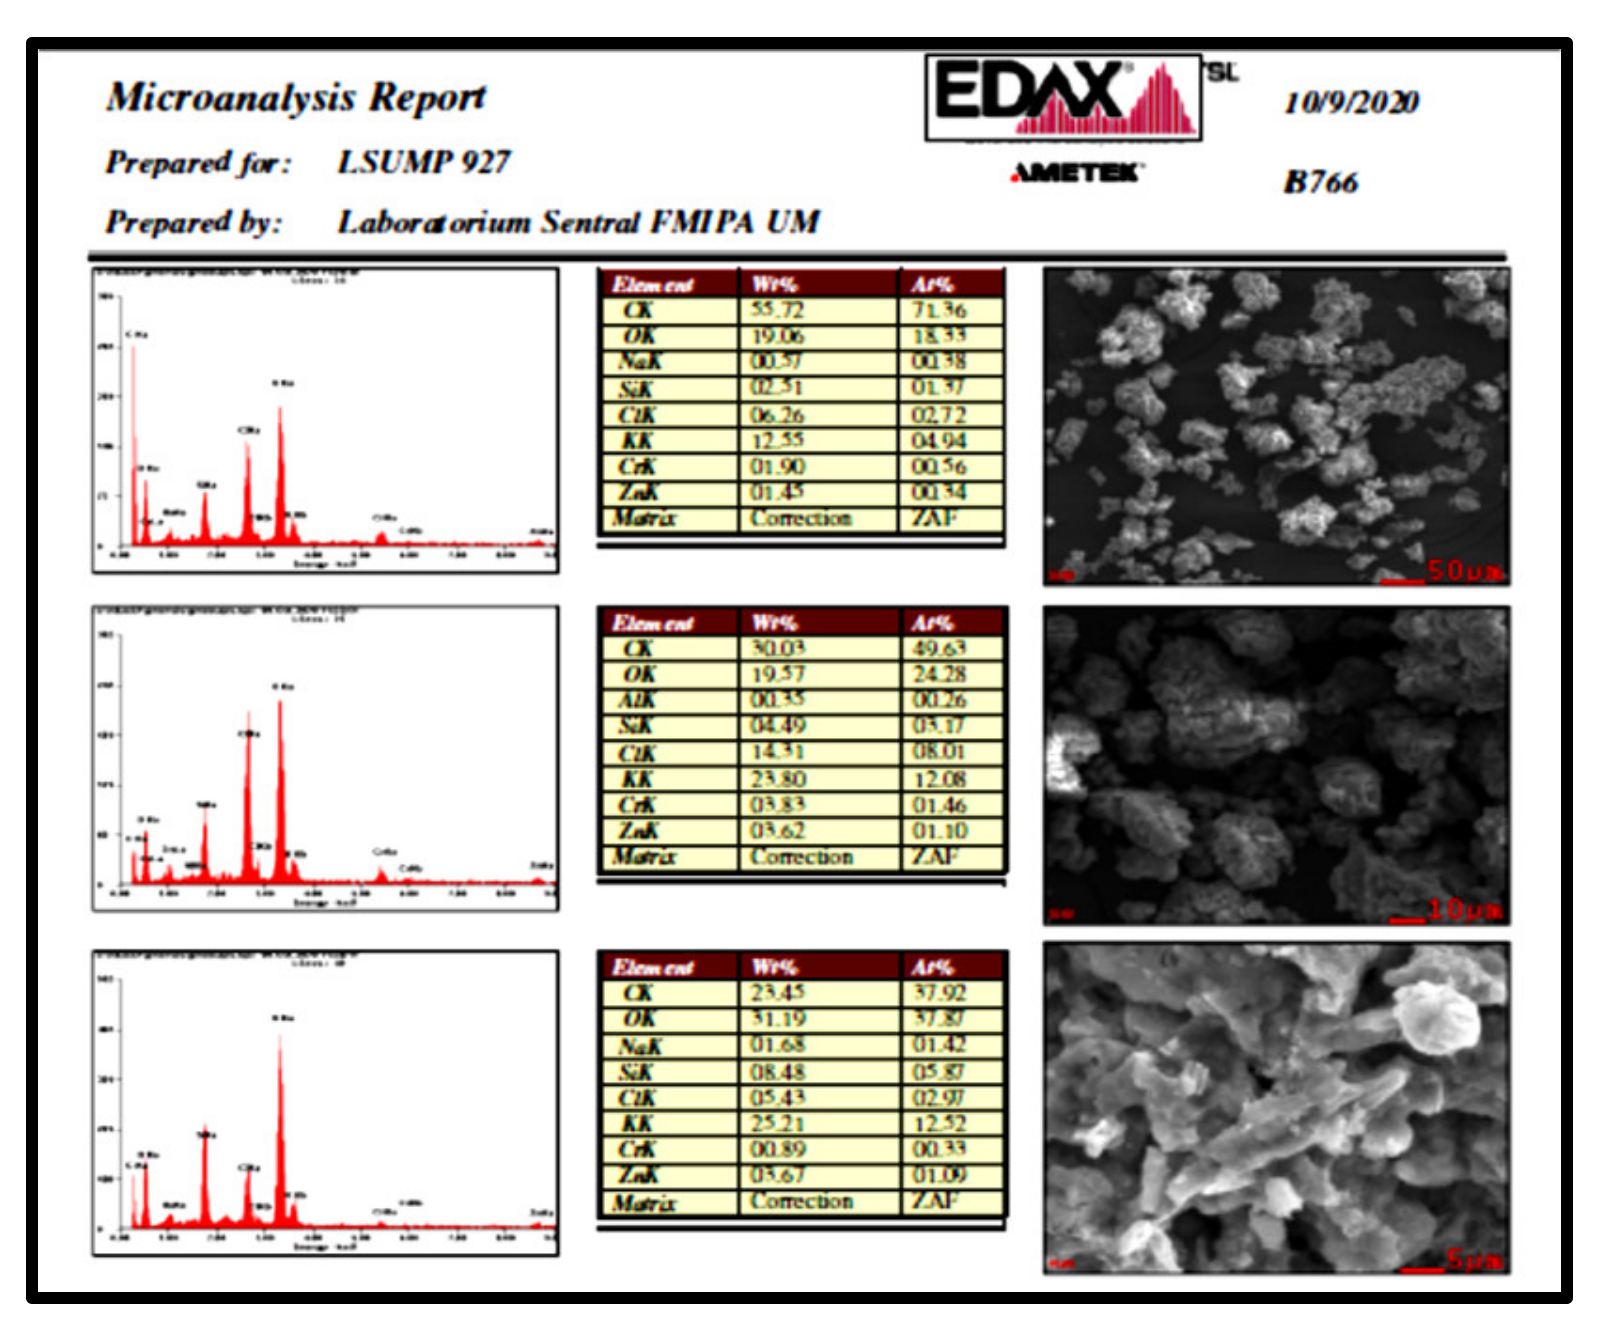
3.6.2. Characterization by SEM-EDX

Changing the final composite (ZnCr2O4/CNS) morphology compared to the intermediate composite (ZnO/CNS) morphology, characterization by SEM was conducted. The SEM image of the final composite is shown in Figure 18. It shows that the final composite has shape of irregular ball particles. It looks different from the SEM images of the intermediate composite (Figure 13), which looks more like stick particles. This changing of shape is caused by chemical reaction of the intermediate composite with some substances thermally. The chemical component of the composite was analyzed by EDX as presented in Figure 19. The chemical content of composite then was described as the bar chart in Figure 20.
The chart shows that besides Zn, Cr, and O, the composite also contains K, Cl, Si, and Na. The K and Cl are from the chemicals of KOH and ZnCl2. The Na and Si are related to inorganic components which have existed in the biomass naturally before the pyrolysis process. This matches the reaction Equation (R4) in calcination of the intermediate to produce the final product. This analysis also supports interpretation of X-ray diffractogram.

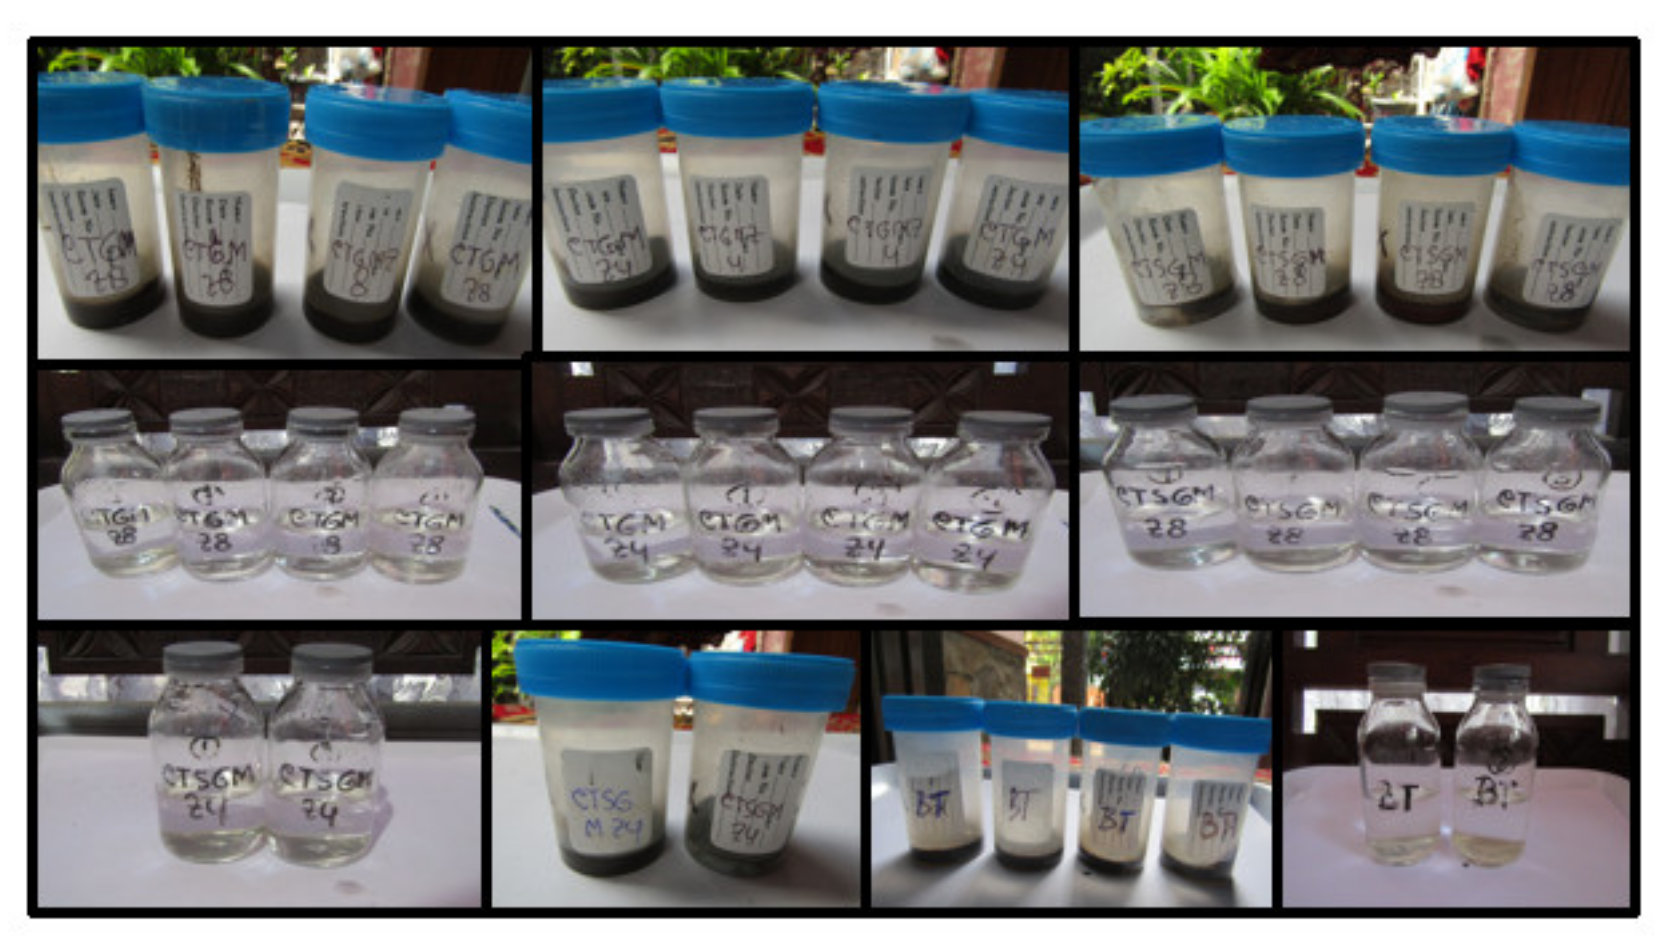
3.7. Application of ZnCr2O4 Composite for Dark Degradation of Pesticide in Soil

The composite of ZnCr2O4 has been used to catalyze dark degradation of pesticide in the soil. Some of the residues and the filtrates which were obtained from filtration after test of degradation are shown in Figure 21.
Principle of this degradation is oxidation reaction of pesticide by H2O2 by catalysis of ZnCr2O4. The reaction of catalyst and H2O2 resulted in radicals. These radicals are very reactive to oxidize BPMC pesticide. BPMC is chosen as the model because this pesticide type is used for paddy fields. The chemical degradation reaction of pesticide is predicted, by assumption, same with the catalytic reaction of DNA damage byH2O2 with the catalyst of Cr(III). In this case, Cr(III) reduces H2O2 to form radicals and Cr(III) is oxidized to form reactive Cr(IV) [68] as written in the reaction Equations (R8) and (R9):
Cr(III) + H2O2 → Cr(IV) + OH + OH-
.OH + C12H17NO2 + O2 → degradation product
If Cr(IV) can be oxidized to Cr(VI), the Cr(VI) can be reduced to Cr(III again by H2O2 because reduction reaction of Cr(VI) to Cr(III) by H2O2 can last spontaneously [69].
0.5 Cr2O72− + 7H+ + 2e ⮂ Cr3+ + 3.5 H2O         E° = +1.36 V
H2O2 ⮂ O2 + 2H+ + 2e         E° = −0.68 V
0.5 Cr2O72− + 7H+ + H2O2 ⮂ Cr3+ + 3.5 H2O + O2         E° = +0.68 V
In the dark, reaction is slower than with presence of sunrise, because the sunrise causes electron transfer from catalyst to H2O2 easier through transition of electron by absorption of electromagnetic radiation from the sunrise. It means that fact of reaction which is described in the real field will be better than application data of this research.
The percentage of catalytic degradation reaction of pesticide was obtained from difference of TOC of filtrate after treatment of BPMC solution with the presence of soil only and with presence of soil–H2O2–ZnCr2O4. The amount of H2O2 solution is the same for each sample, so that the data of catalytic degradation percentage describe the role of catalyst. Figure 22 shows that composite from sawdust has better performance than of rice husk. Based on the chemical content of biomass in Figure 5, both biomasses have different distribution of lignocellulose. This difference may give different characteristics of nanocarbon, especially connected to porosity and surface area. This characteristics of nanocarbon influence adsorption of pesticide and oxidation reaction on the surface of nanocarbon by catalyst of ZnCr2O4.

4. Conclusions

This research gives some information related to characteristics of composites and performance of catalyst in dark degradation reaction of pesticide. Based on functional groups, pyrolysis of both rice husk and sawdust using microwave resulted in a completed carbonization reaction, except at 800 W without ZnCl2. The intermediate composite (ZnO/CNS) from rice husk was more stable toward thermal than that from sawdust. The colloid of ZnO/CNS from sawdust tended to be more stable than from rice husk. Pyrolysis without ZnCl2 activator gave more stable colloid of ZnO/CNS than with ZnCl2. Based on morphology, sawdust and rice husk produced the comparable particle size of ZnO/CNS. XRD and EDX characterizations indicated the existence of ZnCr2O4/CNS for final composite with KCl and Cr2O3 as impurities. The final composite, ZnCr2O4/CNS, from sawdust gave catalytic performance better than from rice husk, including 2.5 times larger related to pyrolysis at 400 W and 1.6 times larger related to pyrolysis at 800 W.

Author Contributions

Conceptualization, T.S.; methodology, T.S.; software, T.S.; validation, T.S.; formal analysis, T.S.; investigation, T.S.; resources, T.S.; data curation, T.S.; writing—original draft preparation, T.S.; writing—review and editing, T.S.; visualization, T.S.; supervision, T.S.; project administration, T.S., D.P., Y.P.P.; funding acquisition, T.S. The main author has all responsibilities totally toward this manuscript. All authors have agreed to the published version of the manuscript.

Funding

This research was funded by “Hibah Doktor Lektor Kepala 2020” project (DIPA-023.17.2.677512/2020; contract number of 42UN10.F09/PNr.2020).

Data Availability Statement

Data is contained within the article.

Acknowledgments

We thank Brawijaya University for funding the “Hibah Doktor Lektor Kepala 2020” project (DIPA-023.17.2.677512/2020; contract number of 42UN10.F09/PNr.2020) and all the facilities for doing research.

Conflicts of Interest

The authors declare no conflict of interest.

References

  1. Subandi, M.; Chaidir, L.; Nurjanah, U. Keefektifan Insektisida BPMC dan Ekstrak Daun Suren terhadap Hama Wereng Batang Coklat (Nilaparvata lugens Stal.) dan Populasi Musuh Alami pada Padi Varietas Ciherang. J. Agrik. 2016, 27, 160–166. [Google Scholar] [CrossRef]
  2. Ardiwinata, A.N.; Nursyamsi, D. Residu Pestisida di Sentra Produksi Padi di Jawa Tengah. Pangan 2012, 21, 39–58. Available online: https://jurnalpangan.com/index.php/pangan/article/view/103/90 (accessed on 1 June 2021).
  3. Fitriadi, B.R.; Putri, A.C. Metode-Metode Pengurangan Residu Pestisida pada Hasil Pertanian. J. Rekayasa Kim. Lingkung. 2016, 11, 61–71. [Google Scholar] [CrossRef] [Green Version]
  4. Young, R.O. Colloids and Colloidal Systems in Human Health and Nutrition. Int. J. Complement. Altern. Med. 2016, 3, 1–8. [Google Scholar] [CrossRef]
  5. Sinko, P.J.; Singh, Y. Martin’s Physical Pharmacy and Pharmaceutical Sciences, 6th ed.; Physical, Chemical and Biopharmaceutical Principles in the Pharmaceutical Sciences; Wolters Kluwer Health, Lippincott Williams & Wilkins: Philadelphia, PA, USA, 2006; p. 1. Available online: https://innocentbalti.files.wordpress.com/2015/01/martins-physical-pharmacy-6th-ed-2011-dr-murtadha-alshareifi.pdf (accessed on 1 June 2021).
  6. Hielscher, T. Ultrasonic Production of Nano—Size Dispersions and Emulsions. In Proceedings of the ENS’05, Paris, France, 14–16 December 2005; Available online: https://arxiv.org/abs/0708.1831 (accessed on 1 June 2021).
  7. Milanovi, M.; Stijepovi, I.; Pavlovi, V.; Srdi, V. Functionalization of Zinc Ferrite Nanoparticles: Influence of Modification Procedure on Colloidal Stability. Process. Appl. Ceram. 2016, 10, 287–293. [Google Scholar] [CrossRef] [Green Version]
  8. Setianingsih, T.; Mutrofin, S. Sintesis Karbon Nanomaterial dari Limbah Biomassa yang Dimodifikasi MFe2O4 Secara Green Technology Sebagai Campuran Pupuk Cair Untuk Remediator Tanah Sawah dan Saluran Irigasi Tercemar Pesticida. In Laporan akhir HPU.; Universitas Brawijaya: Malang, Indonesia, 2019. [Google Scholar]
  9. Zaytseva, O.; Neumann, G. Carbon Nanomaterials: Production, Impact on Plant Development. Agric. Environ. Appl. Chem. Biol. Technol. Agric. 2016, 3, 1–26. [Google Scholar] [CrossRef] [Green Version]
  10. Lowell, S.; Shields, J.E.; Thomas, M.A.; Thommes, M. Characterization of Porous Solids and Powders: Surface Area, Pore Size and Density; Springer: Dordrecht, The Netherlands, 2004; Available online: https://3lib.net/book/2086739/44936e (accessed on 1 June 2021).
  11. Li, L.; Sun, Z.; Li, H.; Keener, T.C. Effects of activated carbon surface properties on theadsorption of volatile organic compounds. J. Air Waste Manag. Assoc. 2012, 62, 1196–1202. [Google Scholar] [CrossRef] [PubMed]
  12. Li, H.; Qu, Y.; Xu, J. Microwave-Assisted Conversion of Lignin. In Production of Biofuels and Chemicals with Microwave; Fang, Z., Smith, R.L., Jr., Qi, X., Eds.; Springer Science+Business Media Dordrecht: Berlin/Heidelberg, Germany, 2015. [Google Scholar] [CrossRef]
  13. Al Shra’ah, A.; Helleur, R. Microwave pyrolysis of cellulose at low temperature. J. Anal. Appl. Pyrolysis 2014, 105, 91–99. [Google Scholar] [CrossRef]
  14. Zhang, Y.; Chem, P.; Liu, S.; Peng, P.; Min, M.; Cheng, Y.; Anderson, E.; Zhou, N.; Fan, L.; Liu, L.; et al. Effects of Feedstock Characteristics on Microwave-assisted Pyrolisis—A Review. Bioresour. Technol. 2017, 230, 143–153. [Google Scholar] [CrossRef]
  15. Hoan, B.T.; Tam, P.D.; Pha, V.H. Green Synthesis of Highly Luminescent Carbon Quantum Dots from Lemon Juice. Hindawi J. Nanotechnol. 2019, 2019, 2852816. [Google Scholar] [CrossRef] [Green Version]
  16. Adewumi, G.A.; Revaprasadu, N.; Eloka-Eboka, A.C.; Inambao, F.L.; Gervas, C. A Facile Low-cost Synthesis of Carbon Nanosphere from Coconut Fibre. In Proceedings of the World Congress on Engineering and Computer Science (WCECS) 2017, San Francisco, CA, USA, 25–27 October 2017; Volume II. Available online: http://www.iaeng.org/publication/WCECS2017/WCECS2017_pp577-582.pdf (accessed on 1 June 2021).
  17. Schwenke, A.M.; Hoeppener, S.; Schubert, U.S. Synthesis and Modification of Carbon Nanomaterials Utilizing Microwave Heating. Adv. Mater. 2015, 27, 4113–4141. [Google Scholar] [CrossRef] [PubMed]
  18. Huang, Y.F.; Chiueh, P.T.; Shih, C.H.; Lo, S.L.; Sun, L.; Zhong, Y.; Qiu, C. Microwave Pyrolisis of Rice Straw to Produce Biochar as Adsorbent for CO2 Capture. Energy 2015, 84, 75–82. [Google Scholar] [CrossRef]
  19. Inyang, M.; Gao, B.; Zimmerman, A.; Zhang, M.; Chena, H. Synthesis, Characterization, and Dye Sorption Ability of Carbon Nanotube—Biochar Nanocomposites. Chem. Eng. J. 2014, 236, 39–46. [Google Scholar] [CrossRef]
  20. Liu, Y.; Liu, Y.; Park, M.; Park, S.J.; Zhang, Y.; Akanda, M.R.; Park, B.Y.; Kim, H.Y. Green Synthesis of Fluorescent Carbon Dots from Carrot Juice for In Vitro Cellular Imaging. Carbon Lett. 2017, 21, 61–67. [Google Scholar] [CrossRef] [Green Version]
  21. Pauzi, N.; Zain, N.M.; Yusof, N.A.A. Microwave-assisted Synthesis of ZnO Nanoparticles Stabilized with Gum Arabic: Effect of Microwave Irradiation Time on ZnO Nanoparticles Size and Morphology. Bull. Chem. React. Eng. Catal. 2019, 14, 182–188. [Google Scholar] [CrossRef] [Green Version]
  22. Mohammadi, S.Z.; Khorasani-Motlagh, M.; Jahani, S.; Yousefi, M. Synthesis and Characterization of α-Fe2O3 Nanoparticles by Microwave Method. Int. J. Nanosci. Nanotechnol. 2012, 8, 87–92. Available online: http://www.ijnnonline.net/article_3909_75ca9bcd50a49f70f707d5a9ef0848fc.pdf (accessed on 1 June 2021).
  23. Taylor, L.A.; Meek, T.T. Microwave Sintering of Lunar Soil: Properties, Theoy, and Practice. J. Aerosp. Eng. 2005, 18, 188–196. [Google Scholar] [CrossRef] [Green Version]
  24. Setianingsih, T.; Purwonugroho, D.; Prananto, Y.P.; Mutrofin, S. Sintesis Nanokarbon dan Komposit Nanokarbon dari Biomassa dengan Metode Pirolisis Fasa Padat dengan Mirowave—Sonikasi untuk Remediator Lahan Tanah Pertanian Tercemar Pestisida. In Laporan akhir Hibah Doktor Lektor Kepala; Universitas Brawijaya: Malang, Indonesia, 2020. [Google Scholar]
  25. Dippong, T.; Andrea, E.; Cadar, O. Review Recent Advances in Synthesis and Applications of MFe2O4 (M = Co, Cu, Mn, Ni, Zn) Nanoparticles. Nanomaterials 2021, 11, 1560. [Google Scholar] [CrossRef]
  26. Mayedwa, N.; Mulaudzi-Masuku, T.; Matinise, N.; Nkosi, M. Biosynthesis and characterization of multifunctional mixed oxides of ZnCr2O4/ZnCrO4 nanoparticulate from natural leaf extracts of Hibiscus Rosa Sinensis. Mater. Today Proc. 2021, 36, 309–312. [Google Scholar] [CrossRef]
  27. Song, H.; Laudenschleger, D.; Carey, J.J.; Ruland, H.; Nolan, M.; Muhler, M. Spinel-Structured ZnCr2O4 with Excess Zn Is the Active ZnO/Cr2O3 Catalyst for High-Temperature Methanol Synthesis. ACS Catal. 2017, 7, 7610–7622. [Google Scholar] [CrossRef]
  28. Kumar, V.; Chakra, C.H.S. Synthesis and Structural Characterization of ZnCr2O4 Nano Particles Prepared by Citrate-gel Auto Combustion Method. Asian J. Phys. Chem. Sci. 2017, 2, 1–7. [Google Scholar] [CrossRef] [Green Version]
  29. Dumitru, R.; Manea, F.; Păcurariu, C.; Lupa, L.; Pop, A.; Cioablă, A.; Surdu, A.; Ianculescu, A. Synthesis, Characterization of Nanosized ZnCr2O4 and Its Photocatalytic Performance in the Degradation of Humic Acid from Drinking Water. Catalysts 2018, 8, 210. [Google Scholar] [CrossRef] [Green Version]
  30. Kamarulzaman, N.; Kasim, M.F.; Rusdi, R. Band Gap Narrowing and Widening of ZnO Nanostructures and Doped Materials. Nanoscale Res. Lett. 2015, 10, 1–12. [Google Scholar] [CrossRef] [PubMed] [Green Version]
  31. Keihan, E.R.; Aliabadi, H.A.M.; Radinekiyan, F.; Sobhani, M.; Khalili, F.; Maleki, A.; Madanchi, H.; Mahdavi, M.; Shalan, A.E. Investigation of the biological activity, mechanical properties and wound healing application of a novel scaffold based on lignin–agarose hydrogel and silk fibroin embedded zinc chromite nanoparticles. RSC Adv. 2021, 11, 17914–17923. [Google Scholar] [CrossRef]
  32. Assem, L.; Zhu, H. Chromium, Toxicological Overview; Cranfield University: Bedford, UK, 2007; pp. 1–14. Available online: https://assets.publishing.service.gov.uk/government/uploads/system/uploads/attachment_data/file/338694/Chromium_toxicological_overview.pdf (accessed on 1 June 2021).
  33. Sun, H.; Brocato, J.; Costa, M. Oral Chromium Exposure and Toxicity. Curr. Environ. Health Rep. 2015, 2, 295–303. [Google Scholar] [CrossRef] [PubMed] [Green Version]
  34. Singh, K.; Maignan, A.; Simon, C.; Martin, C. FeCr2O4 and CoCr2O4 spinels: Multiferroicity in the collinear magnetic state? Appl. Phys. Lett. 2011, 99, 1–3. [Google Scholar] [CrossRef]
  35. Bielicka, A.; Bojanowska, I.; Wiśniewski, A. Two Faces of Chromium—Pollutant and Bioelement. Pol. J. Environ. Stud. 2005, 14, 5–10. Available online: http://www.pjoes.com/Two-Faces-of-Chromium-Pollutant-and-Bioelement,87721,0,2.html (accessed on 1 June 2021).
  36. Chen, Y.; Wu, H.; Sun, P.; Liu, J.; Qiao, S.; Zhang, D.; Zhang, Z. Remediation of Chromium-Contaminated Soil Based on Bacillus cereus WHX-1 Immobilized on Biochar: Cr(VI) Transformation and Functional Microbial Enrichment. Front. Microbiol. 2021, 12, 1–10. [Google Scholar] [CrossRef]
  37. Srivastava, D.; Tiwari, M.; Dutta, P.; Singh, P.; Chawda, K.; Kumari, M.; Chakrabarty, D. Chromium Stress in Plants: Toxicity, Tolerance and Phytoremediation. Sustainability 2021, 13, 4629. [Google Scholar] [CrossRef]
  38. Panda, S.K.; Choudhury, S. Chromium stress in plant. Braz. J. Plant Physiol. 2005, 17, 95–102. [Google Scholar] [CrossRef]
  39. Shanker, A.K.; Cervantes, C.; Loza-Tavera, H.; Avudainayagam, S. Chromium toxicity in plants. Environ. Int. 2005, 31, 739–753. [Google Scholar] [CrossRef]
  40. WHO Regional Office for Europe. Chromium. In Air Quality Guidelines, 2nd ed.; WHO Regional Office for Europe: Copenhagen, Denmark, 2000; pp. 1–4. Available online: http://www.euro.who.int/document/e71922.pdf (accessed on 1 June 2021).
  41. DesMarias, T.L.; Costa, M. Mechanisms of chromium-induced toxicity. Curr. Opin. Toxicol. 2019, 14, 1–7. [Google Scholar] [CrossRef]
  42. Triyanto, K.B.T. Manfaat Hidrogen Peroksida (H2O2) Bagi Tanaman, Kabar Tani.com, 2016, 18/11/2016. Available online: https://kabartani.com/manfaat-hidrogen-perok (accessed on 1 June 2021).
  43. Hany, R.C.R. Efektivitas Pemberian Hidrogen Peroksida terhadap Kualitas Media, Kelangsungan Hidup dan Pertumbuhan Benih Ikan Patin Pangasius sp. Skripsi, Departemen Budidaya Perairan, Fakultas Perikanan dan Ilmu Kelautan, IPB, Bogor. 2014. Available online: https://repository.ipb.ac.id/handle/123456789/74423 (accessed on 1 June 2021).
  44. Yang, H.; Yan, R.; Chen, H.; Lee, D.H.; Zheng, C. Characteristics of Hemicellulose, Cellulose, and Lignin Pyrolysis. Fuel 2007, 86, 1781–1788. [Google Scholar] [CrossRef]
  45. Balat, M. Experimental Study on Pyrolysis of Black Alder Wood. Energy Explor. Exploit. 2008, 26, 209–220. [Google Scholar] [CrossRef] [Green Version]
  46. Marsh, H.; Reinoso, F.R. Activated Carbon; Elsevier Sci.: Alpharetta, GA, USA, 2006. [Google Scholar]
  47. Bergna, D.; Varila, T.; Romar, H.; Lassi, U. Comparison of the Properties of Activated Carbons Produced in One-Stage andTwo-Stage Processes. C J. Carbon Res. 2018, 4, 41. [Google Scholar] [CrossRef] [Green Version]
  48. Setianingsih, T.; dan Prananto, Y.P. Spektroskopi Inframerah Untuk Material Anorganik; UB Press: Malang, Indonesia, 2020; pp. 82–90. [Google Scholar]
  49. Bakti, A.I.; Gareso, P.L. Characterization of Active Carbon Prepared From Coconuts Shells Using FTIR, XRD and SEM Techniques. J. Ilm. Pendidik. Fis. Al-Biruni 2018, 7, 33. [Google Scholar] [CrossRef] [Green Version]
  50. Hayashi, J.; Kazehaya, A.; Muroyama, K.; Watkinson, A.P. Preparation of activated carbon from lignin by chemical activation. Carbon 2000, 38, 1873–1878. [Google Scholar] [CrossRef]
  51. Lomboan, F.O.; Kumaat, E.J.; Windah, R.S. Pengujian Kuat Tekan Mortar dan Beton Ringan Dengan Menggunakan AgregatRingan Batu Apung Dan Abu Sekam Padi Sebagai Substitusi Parsial Semen. J. Sipil Statik 2016, 4, 271–278. Available online: https://ejournal.unsrat.ac.id/index.php/jss/article/view/11918/11507 (accessed on 1 June 2021).
  52. Lukmandaru, G.; Hidayah, R.N. Studi Mutu Kayu Jati di Hutan Rakyat Gunungkidul. VI. Kadar Zat Anorganik dan Keasaman. J. Ilmu Kehutan. 2017, 10, 63–75. [Google Scholar] [CrossRef] [Green Version]
  53. Ummah, H.; Suriamihardja, D.A.; Selintung, M.; Wahab, A.W. Analysis of Chemical Composition of Rice Husk Used as Absorber Plates Sea Water into Clean Water. ARPN J. Eng. Appl. Sci. 2015, 10, 6046–6050. Available online: http://digilib.unhas.ac.id/uploaded_files/temporary/DigitalCollection/YzdkNDNjZjU5OTYwYThjZTM2YzYyNzllYzFkNzE0MjYzNmQ4NWE0Ng==.pdf (accessed on 1 June 2021).
  54. Ghani, W.A.W.A.K.; da Silva, G.; Alias, A.B. Physico-chemical characterizations of sawdust-derived biochar as potential solid fuels. Malays. J. Anal. Sci. 2014, 18, 724–729. Available online: http://www.ukm.my/mjas/v18_n3/Wan%20Azlina_18_3_30.pdf (accessed on 1 June 2021).
  55. Li, S.; Zhu, H.; Xi, G.; Lin, Q.; Wang, C.; Wu, Q.; Wang, Z. Synthesis and characterization of mesoporous carbon spheres. Mater. Sci. Pol. 2019, 37, 585–589. [Google Scholar] [CrossRef] [Green Version]
  56. Rufford, T.E.; Hulicova-Jurcakova, D.; Zhu, Z.; Lu, G.Q. A comparative study of chemical treatment by FeCl3, MgCl2, and ZnCl2 on microstructure, surface chemistry, and double-layer capacitance of carbons from waste biomass. J. Mater. Res. 2010, 25, 1451–1459. [Google Scholar] [CrossRef]
  57. Windolz, M.; Budavari, S.; Blumeti, R.F.; Otterbein, E.S. The Merc Index: An Encyclopedia of Chemicals, Drugs, and Biologicals, 10th ed.; Merck & Co, Inc.: Kenilworth, NJ, USA, 1983. [Google Scholar]
  58. Setianingsih, T.; Sutarno, M. Prinsip Dasar dan Aplikasi Metode Difraksi Sinar-X untuk Karakterisasi Material; UB Press, Universitas Brawijaya: Malang, Indonesia, 2018. [Google Scholar]
  59. He, W.; Jiang, S.; Zhang, Q.; Pan, M. Isolation and Characterization of Cellulose Nanofiber from Bambusa Rigida. BioResources 2013, 8, 5678–5689. Available online: https://ojs.cnr.ncsu.edu/index.php/BioRes/article/view/BioRes_08_4_5678_He_Nanofiber_Bambusa/2364 (accessed on 1 June 2021). [CrossRef] [Green Version]
  60. Tsaneva, V.N.; Kwapinski, W.; Teng, X.; Glowacki, B.A. Assessment of the Structural Evolution of Carbons from Microwave Plasma Natural Gas Reforming and Biomass Pyrolisis Using Raman Spectroscopy. Carbon 2014, 80, 617–628. [Google Scholar] [CrossRef]
  61. Tyagi, S.; Verma, P.; Baskey, H.B.; Agarwala, R.C.; Agarwala, V.; Shami, T.C. Microwave Absorption Study of Carbon Nano Tube Dispersed Hard/Soft Ferrite Nanocomposite. Ceram. Int. 2012, 38, 4561–4571. [Google Scholar] [CrossRef]
  62. Lei, H.; Wang, Y.; Huo, J. Porous graphitic carbon materials prepared from cornstarch with the assistance of microwaveirradiation. Microporous Mesoporous Mater. 2015, 210, 39–45. [Google Scholar] [CrossRef]
  63. Setianingsih, T. Mikroskop Elektron Transmisi: Teori dan Aplikasinya untuk Karakterisasi Material; UB Press: Malang, Indonesia, 2017; pp. 6–7. [Google Scholar]
  64. Mahbubul, M.; Chong, T.H.; Khaleduzzaman, S.S.; Shahrul, I.M.; Saidur, R.; Long, B.D.; Amalina, M.A. Effect of Ultrasonication Duration on Colloidal Structure and Viscosity of Alumina−Water Nanofluid I. Ind. Eng. Chem. Res. 2014, 53, 6677–6684. [Google Scholar] [CrossRef]
  65. Kirankumar, V.S.; Sumathi, S. A Review on Photodegradation of Organic Pollutants Using Spinel Oxide. Mater. Today Chem. 2020, 18, 1–15. [Google Scholar] [CrossRef]
  66. Venkataramana, C.; Botsa, S.M.; Shyamala, P.; Muralikrishna, R. Photocatalytic degradation of polyethylene plastics by NiAl2O4 spinels-synthesis and characterization. Chemosphere 2021, 265, 1–8. [Google Scholar] [CrossRef] [PubMed]
  67. Shriver, D.F.; Atkins, P.W.; Langford, C.H. Inorganic Chemistry; Oxford University Press: Oxford, MI, USA, 1990. [Google Scholar]
  68. Tsou, T.; Yang, J. Formation of Reactive Oxygen Species and DNA Strand Breakage During Interaction of Chromium(III) and Hydrogen Peroxide in Vitro: Evidence for a Chromium(III)-mediated Fenton-like Reaction. Chem. Biol. Interact. 1996, 02, 133–153. [Google Scholar] [CrossRef]
  69. Cotton, F.A.; Wilkinson, G. Kimia Anorganik Dasar; Suharto, S., Translator; UI Press: Jakarta, Indonesia, 1989; pp. 23–26. [Google Scholar]
Figure 1. Steps in the synthesis of intermediate (ZnO/CNS) and final products using microwave (MCr2O4/CNS).
Chemengineering 05 00058 g001
Figure 2. Earthenware for pyrolysis and ceramics ware for calcination by microwave.
Chemengineering 05 00058 g002
Figure 3. Process of pesticide (BPMC) dark degradation test.
Chemengineering 05 00058 g003
Figure 4. Biomass of rice husk (G) and sawdust (SG).
Chemengineering 05 00058 g004
Figure 5. Component of lignocellulose in sawdust and rice husk.
Chemengineering 05 00058 g005
Figure 6. Activated carbon from pyrolysis of sawdust (SG) and rice husk (G) without and with ZnCl2 (Z) at various microwave energy of 400, 600, 800 °C.
Chemengineering 05 00058 g006
Figure 7. Concentrated colloid of CNS (code without Z) and ZnS/CNS (code with Z) which were prepared from pyrolysis of sawdust (SG) and rice husk (G).
Chemengineering 05 00058 g007
Figure 8. Products of CNS (code without Z) and ZnO/CNS nanocomposites (code with Z) which were resulted from evaporation of the colloids of the carbon prepared from sawdust (SG) and rice husk (G).
Chemengineering 05 00058 g008
Figure 9. The final composites (ZnCr2O4/CNS) which resulted from pyrolysis at 400 W (code 4) and 800 W (code 8) with activator of ZnCl2 (Z) and calcination at 600 W using microwave.
Chemengineering 05 00058 g009
Figure 10. FTIR spectra of CNS (without Z) and ZnO/CNS (with Z) which were prepared at 400 W (code 4) and 800 W (code 8) from biomass of rice husk (G).
Chemengineering 05 00058 g010
Figure 11. FTIR spectra of CNS (without Z) and ZnO/CNS (with Z) which were prepared at 400 W (code 4) and 800 W (code 8) from biomass of sawdust (SG).
Chemengineering 05 00058 g011
Figure 12. Diffractograms of sawdust (SG) and rice husk (G) biomass.
Chemengineering 05 00058 g012
Figure 13. X-ray diffractograms of CNS (without code of Z) and ZnO/CNS composites (with code of Z).
Chemengineering 05 00058 g013
Figure 14. Morphologies of ZnO/CNS (TGMZ8 and TSGMZ8) from sawdust (SG) and rice husk (G) by pyrolysis using microwave at 800 W (code = 8) and ZnCl2 activator (Z).
Chemengineering 05 00058 g014
Figure 15. Colloid stability of CNS from pyrolysis of the rice husk (G) without ZnCl2 (without Z) and ZnO/CNS from pyrolysis of rice husk (G) with ZnCl2 (with Z).
Chemengineering 05 00058 g015
Figure 16. Colloid stability of CNS from pyrolysis of sawdust (SG) without ZnCl2 (SMG) and ZnO/CNS from pyrolysis of sawdust (SG) with ZnCl2 (SGMZ).
Chemengineering 05 00058 g016
Figure 17. X-ray diffractogram of ZnCr2O4/CNS composite.
Chemengineering 05 00058 g017
Figure 18. SEM image of ZnCr2O4/CNS composite from pyrolysis of rice husk.
Chemengineering 05 00058 g018
Figure 19. Chemical component of CTGMZ8 composite by SEM-EDX.
Chemengineering 05 00058 g019
Figure 20. Chemical content analysis of ZnCr2O4 composite by EDX.
Chemengineering 05 00058 g020
Figure 21. Residues and filtrates after test of pesticide degradation.
Chemengineering 05 00058 g021
Figure 22. Dark degradation reaction of BPMC pesticide through oxidation reaction by H2O2 with catalyst of ZnCr2O4.
Chemengineering 05 00058 g022
Table 1. Procedure of ZnCr2O4/CNS application in dark degradation of pesticide.
No.PurposeCodeExperimentIndicator
1.Adsorption test of pesticide by the thermal deactivated soilBTA 5 g of dry soil + 25 mL of BPMC solution (0.5 g/L) + 10 mL water, kept in the dark for 5 days.TOC
2.Degradation test of pesticide by catalytic oxidation reaction with H2O2–ZnCr2O4CTGMZXA 5 g of dry soil + 25 mL of BPMC solution (0.5 g/L) + 10 mL of H2O2 solution (0.15%) + 0.1 g of composite, kept in the dark for 5 days.TOC
Table 2. Crystallinity index of cellulose.
BiomassI200IamCI (%)
Sawdust (SG)4.31.662.8
Rice husk (G)2.71.063.0
Table 3. Three highest peak data of standard diffractograms from AMCSD.
Substance2θ(IR)2θ(IR)2θ(IR)
ZnO31.00(53)34.47(40)36.29(100)
ZnCr2O430.35(43)35.75(100)63.15(38)
Cr2O333.65(100)36.27(93)54.94(85)
KCl28.39(100)40.58(63)50.26(20)
Publisher’s Note: MDPI stays neutral with regard to jurisdictional claims in published maps and institutional affiliations.

