Greenhouse Gas Sensors Fabricated with New Materials for Climatic Usage: A Review


School of Chemistry and Materials Science, Rochester Institute of Technology, Rochester, NY 14623, USA
*
Author to whom correspondence should be addressed.
ChemEngineering 2018, 2(3), 38; https://doi.org/10.3390/chemengineering2030038
Submission received: 29 June 2018
/
Revised: 20 July 2018
/
Accepted: 9 August 2018
/
Published: 24 August 2018
(This article belongs to the Special Issue Carbon-Based Materials and Their Electrochemical Applications)
Abstract
:With the increasing utilization of fossil fuels in today’s technological world, the atmosphere’s concentration of greenhouse gases is increasing and needs to be controlled. In order to achieve this goal, it is imperative to have sensors that can provide data on the greenhouse gases in the environment. The recent literature contains a few publications that detail the use of new methods and materials for sensing these gases. The first part of this review is focused on the possible effects of greenhouse gases in the atmosphere, and the second part surveys the developments of sensors for greenhouse gases with coverage on carbon nano-materials and composites directed towards sensing gases like CO2, CH4, and NOx. With carbon dioxide measurements, due consideration is given to the dissolved carbon dioxide gas in water (moisture). The density functional calculations project that Pd-doped single-walled carbon nanotubes are ideal for the development of NOx sensors. The current trend is to make sensors using 3D printing or inkjet printing in order to allow for the achievement of ppb levels of sensitivity that have not been realized before. This review is to elaborate on the need for the development of greenhouse gas sensors for climatic usage by using selected examples.
1. Introduction
The entire world desires an atmosphere that provides clean air and has reduced levels of carbon dioxide, nitrous oxide, methane, ozone, and fluorocarbons, which contribute to global disturbances. These gases are called greenhouse effect gases. The atmosphere now faces two problems that contribute to the increased greenhouse effect gases. The first is the rapid deforestation caused by forest fires and land requirements for developmental purposes. The other is the use of fossil fuels for a variety of purposes. Fossil fuels generate gases that contribute to the greenhouse gas effect. The real concern is in the state of the global climate for the generations ahead. The United Nations (UN) has proclaimed several steps to mitigate greenhouse gas emissions. By this effort, it has reduced the burning of 64,000 kilotons of wood and reduced the release of 118,000 tons of CO2 into the environment (http://www.undp.org/content/undp/en/home/ourwork/climate-and-disaster-resilience/climate-change/mitigating-greenhouse-gas-emissions.html). By encouraging the use of renewable sources of energy, several wind farms and solar panels have been developed to reduce greenhouse effect gases.
Among the greenhouse gases involved in environmental disturbances, carbon dioxide, nitrogen oxides, and methane are given utmost importance, as the concentrations of these gases change more than the others, thus requiring immediate attention. Hence, this review is devoted to these gases. The climatic conditions are influenced by greenhouse gases [1,2]. This study is not aimed at correlating the gas levels to climate changes, although indirect relationships have been established, and hopefully this article will stimulate an interest in evolving such correlations.
Weather and climatic conditions are often considered important in our day-to-day life and, as a result, we hear/learn of these environmental conditions through the radio and TV. These channels often give us information such the temperature, wind speed, rain, snow, ice conditions, UV index, cloud cover, humidity, dew point, and barometric pressure, as shown in Figure 1. The weather channel seldom gives the CO2, CH4, N2O, or O3 levels. This may be because of the non-availability of data and the methodology needed to be adapted to measure the concentrations of greenhouse gases. In 2012, a network of three tall tower stations was set up to obtain the long-term background levels of CO2, CH4, and NOX in the United Kingdom. The results obtained from the network showed that the greenhouse gases were increasing in mole fractions. The CO2 and CH4 concentrations showed nighttime maxima and daytime minima [3].
1.1. Status of Greenhouse Gases
The concentrations of greenhouse effect gases in the environment have been periodically monitored by several agencies, and in this section we review the concentrations of these gases in the environment with a view to developing sensors.
1.1.1. Status of Carbon Dioxide Gas
The carbon dioxide level in the atmosphere is currently reported to be at about 400 ppm, compared to a low value of about 200 ppm in 800,000 BC (Figure 2). This reveals a rapid growth of the carbon dioxide levels in the atmosphere. This increase is attributed to fuel combustion, forest fires, volcanic eruption, and volatile organic compounds. The obvious choice to overcome this problem is to reduce the use of fossil fuels, increase the use of nonpolluting fuels, begin forest conservation efforts, and stop volcanoes from erupting [1,2]. The effectiveness of the measures to be taken requires sensors to monitor the carbon dioxide levels in the atmosphere. This has resulted in the evolution of gravimetric sensors. These sensors fall into the category of micro-to-nano electromechanical systems that are based on chemical, electrical conductivity, optical, magnetic, acoustic, capacitive, or ultrasonic properties. The active material response to the exposed gas is revealed by the sensor’s physicochemical interactions.
1.1.2. Status of Methane
Methane is another important gas contributing to the greenhouse gas effect. Its increase is greatly changing the climatic condition. It absorbs the sun’s heat and warms the atmosphere. It is 84 times more potent than carbon dioxide in this activity. It is produced by the natural decomposition of rice paddies, marshes, the guts of animals, the rotting of rubbish and the distribution of fossil fuels like coal, oil, or gas. The use of alternatives to natural gas such as hydrogen in a variety of living conditions [4] could certainly reduce the contribution of this gas towards the greenhouse gas effect. Methane gas in the atmosphere has not been a serious concern, as it was increasing by 0.5 parts per billion per year until the year 2000. The current statistics show that it increased by 12.5 parts per billion in 2014. The methane mole fraction (ppb) is expected to reach about 1850 by 2018, and was approximately 1780 in the year 2000 (https://www.washingtonpost.com/news/energy-environment/wp/2016/12/11/atmospheric-levels-of-methane-a-powerful-greenhouse-gas-are-spiking-scientists-report/?utm_term=.4a77e6472f2c). A recently published review [5] demonstrated that a sensor developed for carbon dioxide should consider its response to methane in the atmosphere. Figure 3 shows the simulated effect of methane interference in the measurement of carbon dioxide gas. The error in measurement of carbon dioxide concentration is indicated in the Figure for different concentration ratios of carbon dioxide to methane.
The effect of methane and carbon dioxide gases on the environment was recently analyzed by Charnay et al. [6] using a 3D climate carbon model, and their results showed a change in the global albedo from 0.40 to 0.23 depending on the relative proportions of carbon dioxide and methane levels. The global temperature was estimated by using the albedo value to increase from −11.5 °C to 65 °C. This model predicts that a carbon dioxide level of 1 bar could produce hot climates at a low land fraction and cloud feedback. For the Earth to reach the high temperature requires carbon dioxide in the atmosphere to be 1 bar at 3.8 Ga.
1.1.3. Status of NOx
Nitrogen oxides have a pronounced influence in the environment. They are responsible for producing yellow-brown smog, often called photochemical smog. The sources for nitrogen oxides are automobile exhaust and fuel burning (including bio-diesel). It is to be controlled at 0.03 ppm over a one-year period for human health and environmental factors. Levels are currently estimated to be at 325 ppb in the environment (https://www.epa.gov/climate-indicators/climate-change-indicators-atmospheric-concentrations-greenhouse-gases).
1.1.4. Status of Fluorocarbons
The fluorocarbons are innumerable, and they can be divided into two classes: one class acting on the ozone layer that reduces the ultraviolet rays reaching the Earth, and another class having environmental effects. The first-class compounds are methyl chloroform, halon-1211, CFC-12, HCFC-22, and HCFC-141b. The other class includes sulfur hexafluoride, HFC-23, HFC-134a, PFC-14, PFC-16, and nitrogen trifluoride. The ozone-depleting fluorocarbons, except for methyl chloroform, are either increasing or reaching a constant value. Their levels range from about 5 to 400 parts per thousand (ppt) in the atmosphere (https://www.epa.gov/climate-indicators/climate-change-indicators-atmospheric-concentrations-greenhouse-gases). Since fluorocarbons are not at the concentration levels of CO2 or CH4, they will not be considered here.
1.2. Sensors for Greenhouse Gases
Since the importance of the influence of greenhouse gases on the environment was understood, several different sensors have been developed and are well-reviewed in the literature [7,8,9,10,11,12]. Figure 4 describes the six different types of sensors used in the measurement of greenhouse gases.
Type 1 sensors generally have a nonmetallic substrate on which the active material is deposited and kept in either ambient or selected experimental conditions (e.g., inert atmosphere) in the measuring chamber. The change in resistance of the active material is measured as a function of concentration of the greenhouse gas. The successive measurement requires flushing the measuring chamber. The type 2 sensor is a field effect transistor having active material placed between the source and drain. The source, drain, and gate electrodes are connected to a potentiostat. The drain current is measured as a function of greenhouse gas concentration. The type 3 sensor is a modification of the type 2 sensor, in that the voltage is plotted as a function of greenhouse gas concentration. The type 4 sensor depicts the general scheme for electromagnetic interaction with the greenhouse gas. The photons used in these measurements are generally in the energy range of 104–10−2 kcal. Type 5 sensors utilize a piezo electric crystal carrying interdigitized electrodes. The active material is placed between digitized electrodes. The radio frequency (Rf) shift is measured with different greenhouse gas concentrations. This type of sensor is also called a SAW (surface acoustic wave) sensor. The type 6 sensor is a micromechanical sensor using a cantilever beam which has a coating of an active material. The resonant frequency of the cantilever beam is measured as a function of the greenhouse gas concentration. This review contains examples of all six different sensor types.
Conventional instrumental analysis such as optical spectroscopy, Fourier transform infrared spectroscopy (FTIR), semiconducting devices, mass spectroscopy, and Raman spectroscopy were used to analyze the greenhouse gases. These techniques will continue to be used, as they provide the advantages of selectivity and sensitivity. With the discovery of new nanomaterials, several less-expensive methods such as using resistance measurement (Type 1 sensor), field effect transistor (Types 2 and 3 sensors), optoacoustic (Type 4 sensor), wireless measurements (Type 5 sensor; surface acoustic wave (SAW)) and micromechanical measurements (Type 6) have recently been developed. These new methods and new research oriented towards new materials have provided speed and accuracy in the measurement of greenhouse gases.
2. Carbon Dioxide Sensors
Carbon dioxide gas is safe for humans up to 5000 ppm, and is dangerous when it reaches concentrations of 40,000 ppm. A short-term exposure of 30,000 ppm is bearable (http://www.cdc.gov/niosh/idlh/intridl4.html) [13,14]. The level of carbon dioxide in the atmosphere is changing every year. The present level of carbon dioxide in the atmosphere is over 400 ppm. The presence of it in the atmosphere affects the albedo value of the Earth in reflecting the solar radiation and is currently estimated at 0.39. While the planet Mercury has an albedo value of 0.1 (receives the maximum amount of sunlight), the planet Venus has a value 0.84 [4]. The temperature of the Venus is estimated at 462 °C, with carbon dioxide levels in the atmosphere amounting to 96.5%. Based on these facts, the need for limiting carbon dioxide in the Earth’s atmosphere is of the utmost importance. Hence, a good and reliable sensor for carbon dioxide is required to monitor the atmospheric carbon dioxide. A variety of sensors have been developed based on optical absorption, change in semiconducting property, electrical resistance, amperometry, and field effect transistors. The semiconducting materials used in these sensors operate at high temperatures (>200 °C). The optical detectors use either fiber optics methods with sophisticated instrumentation or conventional infrared detectors. The electrical methods have been successfully used for the detection of carbon dioxide in biomedical applications.
The main thrust in this decade has been to find new materials that enable easy detection and determination. Gravimetric sensors have been of great interest in this category. The infrared sensors are developed using a combination of a wavelength filter and a detector. This technology can reach a detection limit of 10 ppm of CO2, with an upper limit of 10,000 ppm [15,16,17,18]. Mayrwögera et al. [15] proposed a Fabry–Perot-based bolometer using a glass plate as a simple infrared filter for carbon dioxide determination (Type 4 sensor). Figure 5 shows the analyte that is mixed with nitrogen for analysis.
The interference coming from water vapor in the measurement of carbon dioxide concentration was removed by using a glass filter, as shown in Figure 6.
Several conducting polymer-based resistive sensors have been developed for the detection of carbon dioxide. Doping polyaniline (PANI) has been shown to play a role in the detection of CO2 [18,19,20]. The working range of the CO2 sensor has been reported as 102–104 ppm. Figure 7 shows the conductivity change with the concentration of CO2. The conductivity decreases when carbon dioxide is adsorbed on the sensor material (PANI; Type 1 sensor). The sensor performance has been shown to depend on whether it has an emeraldine base or sulfonated polymer as its active material. Both of them respond to carbon dioxide, but the emeraldine base’s response to lower ppm levels has been reported to be negligible.
The carbon dioxide concentrations in the atmosphere and the corresponding pH are controlled by the humidity in the atmosphere. The dissolved carbon dioxide is in equilibrium with other species [19,20], and Table 1 shows the calculated concentrations of the equilibrating species.
The true concentration of CO2 in the atmosphere can be evaluated by taking the concentrations in Table 1 into consideration, as there is equilibrium between CO2 and the protonated species as
CO2 + H2O = H2CO3 → HCO3− + H+.
An infrared fiber optic optical spark plug sensor was used for measuring CO2 and water. As both the molecules are infrared-active with strong overlap, the spark plug was kept close to the electrodes for the in-cylinder measurement of CO2 and gaseous water (Type 4 sensor). A tungsten halide lamp with two infrared detectors having different optical band pass filter was used. The test was carried out using a spark-ignited engine [21]. Air quality monitoring sensors using a cluster of metal oxide (MOX;MiCS-5525) [22] or electrochemical sensors were used for the analysis of a mixture of nitrogen monoxide and carbon dioxide. The measurements were used to assess the practicality of the carbon dioxide sensor for a data quality objective with 25% uncertainty [23]. Table 2 shows the sensors used for data acquisition. Figure 8 shows the carbon dioxide levels obtained from the sensor with linear regression analysis.
It was shown that the predicted values were lower compared to calibration. When an electrochemical sensor was used for the measurement of CO2, the interference of ozone was encountered and was removed by linear/multi linear regression [23,24].
Carbon nanotube (CNT)-based sensors have been developed for carbon dioxide gas utilizing the principle of physicochemical adsorption of the gas by the carbon nanotubes. Two types of sensors have been developed based on this principle. One type is based on resistance change upon adsorption of the gas on the active material, and the other is dependent on the adsorption of the gas on the active material having effects on transistor properties such as the voltage or current in the field effect transistor [13] (Types 2 and 3 sensors). The adsorption of carbon dioxide gas produces an increase in resistance that is attributed to an increase in the energy barrier for electron movement, as shown in Figure 9.
A number of reports directed towards measuring CO2 using a chemoresistive method with CNTs have been reported in the literature [13,15]. Trans et al. [25] have fabricated a field effect transistor using carbon nanotubes (NTFET) whose sensitivity was examined by Star et al. [26,27,28]. A prototype sensor chip was packaged for measuring the carbon dioxide level using a computer. Figure 10 shows the response of the sensor for carbon dioxide in breath analysis. The reproducibility in the response to successive injections of the gas was established by these measurements. The NTFET board containing the field effect transistor [29,30] is shown in Figure 11. The reproducibility of the pulses shows the feasibility of its usage for successive measurements.
The sensor monitors the %CO2 that can be detected by the NTFET, which can be used conveniently in several locations, such as in hospitals and on-site by paramedics. Being a noninvasive and disposable device, it can be used in the monitoring of greenhouse gas for about 6 h. The performance of the NTFET in measuring the concentration of CO2 in the presence of moisture has also been carried out. It had a tolerance up to 80% RH (relative humidity). Sensors made with CNTs for gases generally have the following advantages: (a) room-temperature operation; (b) facile property adjustment; (c) high sensitivity and response time; (d) easy device fabrication; (e) low selectivity; and (f) long time instability [10,31,32,33,34,35,36,37,38,39].
The low selectivity and long time instability have been an active area of investigation in the past decade, and several new composites of carbon nanotubes have been recommended for gas detection. Chen et al. [19] have reported that cleaning the carbon nanotubes with ultraviolet light resulted in a dramatically enhanced performance. The mechanism by which ultra violet light enhances the performance has not been explored in this work. Presumably it makes the surface active by the oxidation of amorphous carbon or defect centers in the nanotubes. A quantum mechanical investigation of carbon dioxide adsorption on S-functionalized boron nitride and aluminum nitride (AlN) nanotubes has shown it to be exothermic, opening the prospects of developing a thermal sensor for carbon dioxide [40]. The adsorption of carbon dioxide on AlN nanocages and nanosheets has also been investigated using density functional calculations [41,42], with emphasis on chirality. Amine-functionalized TiO2 has been used to capture the carbon dioxide from flue gases, and is amenable for the development of a gas sensor. The presence of moisture has been demonstrated to have a significant effect on adsorption/desorption processes [43].
A nano thin film functionalized chemiresistor sensor operating at room temperature (Type 1 sensor) has been reported for the detection of carbon dioxide in the range of 50−500 ppm [44]. The sensor had negligible interference from ammonia, carbon monoxide, methane, and nitrogen dioxide. The sensing of carbon dioxide using a wireless network [13,45,46,47] (Type 5 sensor) uses analyte-induced changes such as in mass, elasticity, or complex permittivity [48]. The diverse temperature requirements in this class of carbon network are shown in Figure 12.
A SAW (surface acoustic wave) sensor using random copolymer Teflon AF2400 (Figure 13) prepared from tetrafluoroethylene and 2,2-bis(trifluoromethyl)-4,5-difluoro-1,3-dioxole showed variations in carbon dioxide detection depending on the amount of water present. The phase shift changes with carbon dioxide level are shown in Figure 14, showing a phase shift of about 1.14°/ppm of CO2.
The permittivity and conductivity of multiwalled carbon nanotubes has been used for the detection of carbon dioxide [48]. The incorporation of a SiO2 matrix along with the incorporation of a wireless inductor-capacitor resonator in the sensor showed a decrease in the effective permittivity (see Figure 15). The analyte induced changes in complex permittivity (εr’ − j εr’’), where εr’ and εr’’ are the real and imaginary parts of the complex permittivity are measured in this approach. The imaginary permittivity of the sensing material is directly proportional to its conductivity. A hysteresis-free operation of the sensor is remarkable and advantageous for fast measurements.
The sensor operates through a dipole–dipole interaction mechanism as shown below (Figure 16A). The functionalized multiwalled carbon nanotubes (MWCNTs) have a partial negative charge to which the analyte is bridged through its partial positive charge end, as shown in the above illustration [10]. The optical sensing of carbon dioxide has been reported using different types of membranes [38]. As an offshoot of carbon nanotubes, the discovery of graphene by Novoselov and Geim in 2004 has opened up new sensors based on carbon [39]. In one approach, 3 μL of a 1 mg/mL graphene oxide solution was spin-coated on silicon fingers of 3 μm width. The graphene resistive sensor’s response in the concentration range of 0–1500 ppm was measured [49,50,51,52]. Figure 16B provides the resistance response with carbon dioxide concentration at ppm levels.
The initial resistance measurement of the sensor was carried out in nitrogen atmosphere (RN2). The change in resistance [46] of the sensor when carbon dioxide gas was injected (Rx) was used in the construction of the graph in Figure 16. Recently, a miniature resistive carbon dioxide sensor has been reported that operates in the concentration range of 50–50,000 ppm. A photoacoustic spectroscopic method has been developed for the simultaneous determination of carbon dioxide and methane gases [52] with high precision and a large dynamic range.
A new silicon substrate micro sensor has been developed [5] using a composite made of carbon nanotube and Baytron-P that senses carbon dioxide at 22 °C. The sensor was constructed with a Si chip by depositing the composite between two gold electrodes. Two identical Si chips were connected in a parallel configuration (Figure 17) to reduce the initial resistance of the sensor. The resistance of the sensor decreased proportionally upon exposure to the concentration of carbon dioxide.
The sensor showed a semiconducting behavior with a negative temperature coefficient (Type 1 sensor). The response time of the sensor was about 40 s. Fourier transform infrared spectroscopy showed peaks for the nanocomposite at 1056 cm−1, 1195 cm−1, 1296 cm−1, 1635 cm−1, 2083 cm−1, 2345 cm−1, and 3278 cm−1. The carbon dioxide adsorption on the composite resulted in the polystyrene sulfonate absorption band shifting from 1195 cm−1 to 1176 cm−1, suggesting a phase separation occurring in the nanocomposite that resulted in the increased conductivity.
Metal oxide semiconductor (MOS) films, nanowires, nanocage, powder, and microspheres have been investigated [53,54,55,56,57,58,59,60,61,62,63,64,65,66,67,68,69] for carbon dioxide sensing. The sensors developed using this approach operate at a temperature range of 200–700 °C and can detect concentrations in the range of 100–10,000 ppm with a response time falling in the range of 3 s to 9.5 h. The recovery times are also in the range 4–700 s. The performance of an MOS sensor depends on its morphology and composition. The results obtained here have shown that the grain size significantly influences the performance sensitivity (Types 2 and 3 sensors).
Poly (ionic liquid)-wrapped single-walled carbon nanotubes have been found to be sensitive for carbon dioxide detection at low concentrations of CO2 (500 ppt) [67,68,69,70,71,72]. The chemiresistive dynamic response of the carbon nanotubes is shown in Figure 18 (Type 1 sensor), where the mechanism for sensing is based on the interaction between BF4 anion and CO2. The charge transfer interaction between BF4- and CO2 is depicted in Figure 18E.
An impressive type 4 sensor for CO2 has been reported using optical fiber coated with a metal oxide-zeolitic imidazole framework (ZIF)-8 MOF [69].
A high sensitivity for CO2 with negligible response for gases such as H2, N2, O2, and CO has been reported. The percentage transmission of 242 nm radiation has been monitored as a function of CO2 concentration, as shown in Figure 19b. The linear change in the transmission of radiation with concentration with very little interference from other gases provides reliability for usage in the field.
Table 3 gives a list of sensor materials and their responses.
Solid-State Electrochemical Sensor
There have been attempts to develop a solid-sate electrochemical sensor for carbon dioxide [71]. Mason et al. [71] developed solid-state reference measuring electrodes and a beta alumina electrolyte substrate with a provision for heating, and made measurements at a temperature of 530 °C. At this temperature, the carbon dioxide sensing was found to be selective from other gases. A novel electrochemical sensor using a ceramic-type component of Na-β/β″ alumina and a reference electrode of glass sealed elemental Na has been developed for measuring CO2 gas in the temperature range of 300 to 600 °C [72] with a response time of seconds to minutes.
3. NOx Gas Sensors
Faraday rotation spectroscopy has been proposed for NO2 determination (Type 4 sensor) [67,68,69,70,71,72,73]. It uses a widely tunable external cavity quantum cascade laser (EC-QCL) and operates mode-hop free between 1600 cm−1 to 1650 cm−1 and allows Q-branch transition of NO2 at 1613.2 cm−1. A detection limit of 95 ppt has been reported. Meyyappan et al. [73] used a simple casting of single-walled carbon nanotubes on an interdigitated electrode for the detection of NO2 ranging from sub-ppm to 44 ppb. The response time of the sensor was on the order of seconds.
Among the sensors reported in the literature, there are a few sensors reaching the lowest detection limits of 0.01–0.5 ppb (Table 4). The ZnO [74,75,76], In2O3 [77], and WO3 [78,79] sensors showing variable response times fall into this category of low detection limits. A sensor developed with reduced graphene oxide–Cu2O nanowire interestingly reached the lowest detection concentration of 0.064 ppm [79,80,81,82,83,84].
Nitrous oxide (N2O) is released into the atmosphere from chemical plants producing nitric acid and polymers (https://www.eia.gov/environment/emissions/ghg_report/ghg_nitrous.cfm). N2O is a colorless toxic pollutant gas with a slightly sweet odor. It is widely used as an anesthetic and analgesic agent in the clinical field, and also as a propellant for pressurized containers in the food industry. It is neither flammable nor explosive. One molecule of N2O has the same greenhouse warming power as 300 molecules of carbon dioxide. Two-thirds of anthropogenic N2O emissions arise from agricultural soils [86], where N2O is formed as part of the bacterial denitrification pathway, in which soil and marine bacteria use oxidized nitrogen compounds as terminal electron acceptors for anaerobic respiration [87]. Once that N2O molecule reaches the upper atmosphere, it can stay there for more than 100 years before getting destroyed naturally. Even though nitrous oxide is a moderately undisruptive substance unlike pollutants known as NOx, it has recently been reported to participate in the depletion of the ozone layer in the stratosphere (https://www.eia.gov/environment/emissions/ghg_report/ghg_nitrous.cfm). So, it is crucial to control and convert N2O to a harmless gas by catalytic surface reactions.
Yoosefian [88] performed density functional studies on the adsorption behavior of nitrous oxide (N2O) onto intrinsic carbon nanotube (CNT) and Pd-doped (5,5) single-walled carbon nanotube (Pd-CNT). Pd dopant facilitates the adsorption of N2O on the otherwise inert nanotube, as observed from the adsorption energies and global reactivity descriptor values. The adsorption energy of N2O on CNT was investigated in three orientations: vertical (VC) and horizontal (HC) to the nanotube axis, and the nitrogen atom toward the C–C bond (NC). The full optimized structures are indicated in Figure 20.
The adsorption of N2O changes the electronic conductivity of Pd-CNT, which is attractive for developing the sensor. Recently, heterojunction sensors have been constructed with SnO2/SnS2, operating at 80 °C (Type 1), sensitive to NO2 concentrations in the range of 1–8 ppm [89,90,91,92,93,94,95,96]. The response of the sensor to other analytes is shown in Figure 21.
Table 5 gives the relative performances of different sensors for NO2.
In comparison to these sensors, several N2O gas sensors have been developed using metal oxides. Table 6 gives the performance of N2O sensors (Type 1). These oxide sensors operate at high temperatures in the region of 300–600 °C.
4. Methane Sensors
A number of detectors [97,98,99,100,101,102,103,104,105] have been developed in the last couple of decades for the detection of methane, mainly to detect the leakage of natural gas as the combination of methane and air constitutes an explosive mixture. These detectors are based on optical fiber sensing [98,99,100], resistive change [98,99,100,101,102,103] using graphene–polyaniline composite, cataluminescence [104], and refractive index [105,106]. The lower detection limit that can be reached with these methods is about 10 ppm [98,99,100]. A theoretical calculation of methane adsorption on graphene has been investigated, and it shows an opening of the band structure of graphene upon adsorption [106]. It predicts that the adsorption energy of defected graphene is increased with the number of layers. A low-cost sensor has been developed [107] using a metal oxide that has suitability for detecting methane leaks. The detection of the sensor is in the range of 0.8–2.7 ppm. It is ideally suited for the environmental analysis of methane.
Humayun et al. [108,109] fabricated a highly sensitive, low-cost, and energy-efficient distributed methane (CH4) sensor system (DMSS) comprising a metal oxide nanocrystals (MONC)-functionalized MWCNT-based CH4 chemiresistor sensor (Type 1 sensor). The sensor could sense below 10 ppm of CH4 in dry air at room temperature. They developed a Gaussian plume triangulation algorithm for the DMSS by which if a geometric model of the surrounding environment is given, then the algorithm can precisely detect and localize a CH4 leak as well as estimate its mass emission rate. To facilitate faster leak detection, a control algorithm based on the UV-accelerated recovery was developed.
A methane chemiresistive sensor was fabricated using multiwalled carbon nanotubes/metal oxide nano particles that showed a detection limit of 10 ppm. The sensor response to methane and water vapor was measured in this work, showing that the sensor was inactive to water. A modulation spectroscopy sensor (Type 4) using a multi-pass cell with a detection sensitivity of 1.2 ppb has recently been reported for methane [109,110]. Using this sensor, the concentration of methane in ambient air was determined to be about 2.01 ppm. With this concentration of methane in the atmosphere referring to Figure 3, the percentage error in CO2 measurement will be about 4% unless the CO2 selected sensor is not influenced by methane gas.
5. Modern Technology Using 3D and Ink Jet Printing of Gas Sensors
With rapid developments in finding active materials suitable for greenhouse gas sensors, there is need for consideration of the cost of making these devices. In this context, the 3D-printing of the active material would be of interest. High-quality 3D-printed desk-top devices have been produced at a low cost without conventional micromechanical systems. Taylor and Velásquez-García [111] have reported a novel electrospray printed nanostructured graphene oxide for gas detection. A number of gases were examined in this work with a variety of detection limits. For CO2, the detection limit was set at 1000 ppm. The preliminary reports opened up opportunities to modify the spray printing for extension to lower detection limits. Rieu et al. [112] developed an ink jet-printed SnO2 gas sensor on a plastic substrate. Both the gas-sensitive layer and the heating transducer were ink jet-printed. This method of making the sensor compares well with sol-gel tin oxide film. The following detection limits have been reported for CO and NO2 (Table 7) The limit of detection fell far above the other methods discussed in the earlier sections. Furthermore, the operating temperature of the sensor was in the range of 200–300 °C (Table 7). Sulfonated graphene was used for detecting NO2 at room temperature by Liua et al. [113]. Sulfonated graphene and SnO2 particles are combined to form the active material of the sensor. The process involves the direct deposition of SnO2 nanoparticles on reduced graphene oxide. A high performance and a good sensitivity were achieved by this active material. A detection limit of 1 ppm of NO2 was reached with this sensor. The room-temperature detection using sulfonated graphene opens up opportunities for developing other greenhouse gas sensors. A screen-printed piezoelectric microcantilever (Type 6 sensor) has been used to detect and determine NO2 and CO gases using oxygen plasma-treated multiwalled carbon nanotubes as the sensitive layer [114]. Figure 22 shows the response of the cantilever for the two gases, with both positive and negative shifts in resonant frequency, attributed to stress and mass effects at different analyte concentrations.
The sensor’s response to NO2 was remarkable at ppb levels. A new generation of sensors for greenhouse gases utilizing 3D printing and ink jet printing is to be expected in the future, and are being researched in the literature [114,115,116,117,118,119]. Although some of the analytes described in this section do not fall into the class of greenhouse gases, they provide the pathway for the development of new greenhouse gas sensors through ink jet printing. With this technology, the sensors will have high reproducibility, sensitivity, and low cost. A 3D-printed CO2 sensor was constructed with a double layer of PEDOT/PSS (poly(3,4-ethylenedioxythiophene)/polystyrene sulfonate) and graphene on interdigitated electrodes that was made by inkjet printing using conductive silver nanoparticles. The sensor works on the principle illustrated for type 1 and has sensitivity of 45 μohm/ppm [117]. Figure 23 shows the different layers in the sensor and the interdigitated fingers.
The sensor’s responses at two different temperatures are given in Figure 24.
3D inkjet printing has provided an economical manufacturing technique for the CO2 sensor [118]. It uses a colloidal dispersion in the printing ink and is composed of La0.8Sr0.2MnO3 (LSM)(Y2O3)0.08(ZrO2)0.92(YSZ). It uses an electrochemical cell Ni-YSZ|YSZ|YSZ-LSM|LSM, with YSZ (yittria stabilized zirconia) as electrolyte sintered to a Ni-yittria stabilized zirconia (Ni-YSZ). The carbon dioxide reaction in the electrochemical fuel cell is
CO2 + 2e− → CO + ½O2.
The inkjet 3D printing performance is dependent on the formation and ejection of droplets. Its propagation depends on acoustic pressure waves in the fluid held in the chamber behind the printing nozzle and in the YSZ-LSM LSM ((La1−xSrx)1−yMnO3) sensor. The droplets time interval is shown in Figure 25. The colloidal LSM dispersions are stabilized using electrostatic dispersants which are commercially available from different manufacturers, as shown in Table 8.
The performance of the fuel cell is linked to the concentration of CO2, and it is in the initial stages of development. As discussed in the previous section on carbon dioxide, a pH electrode can be used as a CO2 sensor. A large-scale layer-by-layer ink jet printing of flexible iridium oxide for a hydrogen ion sensor (Figure 26) has been reported [119]. The sensor’s active material is iridium oxide, which interacts with the analyte.
A flexible tin oxide gas sensor was developed by an inkjet printing process. Here the active material was tin oxide, printed on gold deposited in a digitated electrode spacing of 500 and 200 μm. Carbon monoxide was the analyte, and the measurements were done at 300 °C in the concentration range of 20–200 ppm [120].
A type 3 sensor for CO2 was recently been reported [121] using a sodium ion conducting solid electrolyte having a floating gate passivated by an insulator stack and a control gate made of an interdigitated field gate (Figure 27). The sensing material, (3-aminopropyl) triethoxysilane (APTES), was added by inkjet printing. The sensor operated at 160 °C in the concentration range of 125–325 ppm.
Inkjet printing technology has very high commercial value, and the developments have been rapidly pursued for long-term testing. Inkjet-printed graphene sensors (Type 1) for nitrogen oxide gas and inkjet printed platinum decorated tungsten oxide nanoparticles on silicon substrate for gas sensing (Type 1) have been reported [122,123]. The methodologies reported in these publications are interesting, and may be extendable to greenhouse gases in the future [124,125,126].
6. Outlook and Conclusions
The recent reports of monitoring greenhouse effect gases have conclusively shown that CO2 levels in the atmosphere have been steadily increasing. The UN reports have consistently been promoting the use of renewable energies for controlling the atmospheric conditions. The atmospheric conditions need to be steadily monitored, and for this purpose we need to have reliable measurements of the greenhouse effect gases. The acquisition of the data requires the development of cheap, robust, and accurate sensors. Although the area of sensors has been growing rapidly, sensors directed towards the greenhouse effect gases using nano materials have been recent. This survey of the greenhouse effect gas sensors suggests that there has been active interest in developing gas sensing technologies. The first part of the paper projects the progressive increase in the concentrations of greenhouse gases in the atmosphere and its consequences. The second part discusses the developments in the areas of carbon dioxide, nitrogen oxide, and methane sensors using carbon nanotubes and polymer composites. A few reports on using graphene, which is a material having large surface area relative to carbon nanotubes, with high electrical and thermal conductivities, opens opportunities for developing novel greenhouse gas sensors. The current trend is to use 3D printing or ink jet printing in making the sensor devices. This survey of greenhouse gas sensors shows that so far the developments have been based on discovering new active materials and examining their characteristics limited to either pure gases with limited interferences. There are very few sensors that would respond to only one greenhouse gas. This short review is to focus on the need to have reliable sensors for greenhouse gases in every city or town for a periodical review of their concentrations.
Author Contributions
K.S.V.S was the originator of this manuscript for presentation at the World Climatic Change in Italy and was involved in conceptualization, preparation, methodology and outlining of the original draft. K.S.V.S and N.N.N.A were involved in resources, preparation and analysis. All authors approved the final version of the paper.
Funding
K.S.V.S thanks the National Science Foundation, USA for financial support.
Acknowledgments
This paper was presented at the World conference on Climatic Changes in Rome (Italy) during 19–21 October 2017. One of the authors (K.S.V.S.) thanks the National Science Foundation for financial support.
Conflicts of Interest
The authors declare no conflicts of interest.
References
- Cozzi, L. Energy and Air Pollution, World Energy Outlook Special Report OECD/IEA; International Energy Agency: Paris, France, 2016; pp. 17–56. [Google Scholar]
- Cole, S.; Ellen, E. New NASA Satellite Maps Show Human Fingerprint on Global Air Quality; National Aeronautical Space Administration NASA: Washington, DC, USA, 2015.
- Stanley, K.M.; Grant, A.; O’Doherty, S.; Young, D.; Manning, A.J.; Stavert, A.R.; Spain, T.G.; Salameh, P.K.; Harth, C.M.; Simmonds, P.G.; et al. Greenhouse gas measurements from a UK network of tall towers: Technical description and first results. Atmos. Meas. Technol. 2018, 11, 1437–1458. [Google Scholar] [CrossRef]
- Santhanam, K.S.V.; Press, R.; Miri, M.; Bailey, A.; Takacs, G.A. Introduction to Hydrogen Technology, 2nd ed.; Wiley: Hoboken, NJ, USA, 2017. [Google Scholar]
- Onley, D.; Fuller, L.; Santhanam, K.S.V. A greenhouse gas silicon microchip sensor using a conducting composite with single walled carbon nanotubes. Sens. Actuators B Chem. 2014, 191, 545–552. [Google Scholar]
- Charnay, B.; Le Hir, G.; Fluteau, F.; Forget, F.; Catling, D.C. A warm or a cold early Earth? New insights from a 3-D climate-carbon model. Earth Planet. Sci. Lett. 2017, 474, 97–109. [Google Scholar] [CrossRef] [Green Version]
- Zhou, X.; Lee, S.; Xu, Z.; Yoon, Y. Recent Progress on the Development of Chemosensors for Gases. Chem. Rev. 2015, 115, 7944–8000. [Google Scholar] [CrossRef] [PubMed]
- Von Schneidemesser, E.; Monks, P.S.; Allan, J.D.; Bruhwiler, L.; Forster, P.; Fowler, D.; Lauer, A.; Morgan, W.T.; Paasonen, P.; Righi, M.; et al. Chemistry and the Linkages between Air Quality and Climate Change. Chem. Rev. 2015, 115, 3856–3897. [Google Scholar] [CrossRef] [PubMed]
- Oertel, C.; Matschullat, J.; Zurbaa, K.; Zimmermanna, F.; Erasmi, S. Greenhouse gas emissions from soils—A review. Chem. Erde 2016, 76, 327–352. [Google Scholar] [CrossRef]
- Ong, K.G.; Grimes, C.A. A Carbon Nanotube-based Sensor for CO2 Monitoring. Sensors 2001, 1, 193–205. [Google Scholar] [CrossRef]
- Mao, S.; Lu, G.; Chen, J. Nanocarbon-based gas sensors: Progress and challenges. J. Mater. Chem. A 2014, 2, 5573–5579. [Google Scholar] [CrossRef]
- Wu, J.; Tao, K.; Zhang, J.; Guo, Y.; Miao, J.; Norford, L. Chemically functionalized 3D graphene hydrogel for high performance gas sensing. J. Mater. Chem. A 2016, 4, 8130–8140. [Google Scholar] [CrossRef]
- Mittal, M.; Kumar, A. Carbon nanotube (CNT) gas sensors for emissions from fossil fuel burning. Sens. Actuators B Chem. 2014, 203, 349–362. [Google Scholar] [CrossRef]
- NIOSH Pocket Guide to Chemical hazards, Department of Health and Human Services, Centers for Disease Control and Prevention National Institute for Occupational Safety and Health. DHHS (NIOSH) Publication No. 2005-149; September 2007. Available online: https://www.cdc.gov/niosh/npg/ (accessed on 14 August 2018).
- Mayrwögera, J.; Reichlb, W.; Krutzlerc, C.; Jakobya, B. Measuring CO2 concentration with a Fabry-Perot based bolometer using a glass plate as simple infrared filter. Sens. Actuators B Chem. 2012, 170, 143–147. [Google Scholar] [CrossRef]
- Llobet, E. Gas sensors using carbon nanomaterials: A review. Sens. Actuators B Chem. 2013, 179, 32–45. [Google Scholar] [CrossRef]
- Zanolli, Z.; Leghrib, R.; Felten, A.; Pireaux, J.J.; Llobet, E.; Charlier, J.C. Gas Sensing with Au-Decorated Carbon Nanotubes. ACS Nano 2011, 5, 4592–4599. [Google Scholar] [CrossRef] [PubMed]
- Irimia-Vladu, M.; Fergus, J.W. Suitability of emeraldine base polyaniline-PVA composite film for carbon dioxide sensing. Synth. Met. 2006, 156, 1401–1407. [Google Scholar] [CrossRef]
- Chen, T.; Wei, L.; Zhou, Z.; Shi, D.; Wang, J.; Zhao, J.; Yu, Y.; Wang, Y.; Zhang, Y. Highly enhanced gas sensing in single-walled carbon nanotube-based thin-film transistor sensors by ultraviolet light irradiation. Nanoscale Res. Lett. 2012, 7, 644. [Google Scholar] [CrossRef] [PubMed] [Green Version]
- Chen, X.; Wong, C.K.Y.; Yuan, C.A.; Zhang, G. Impact of the functional group on the working range of polyaniline as carbon dioxide sensors. Sens. Actuators B Chem. 2012, 175, 15–21. [Google Scholar] [CrossRef]
- Grosch, A.; Wackerbarth, H.; Thiele, O.; Bergc, T.; Beckmann, L. Infrared spectroscopic concentration measurements of carbon dioxide and gaseous water in harsh environments with a fiber optical sensor by using the HITEMP database. J. Quant. Spectrosc. Radiat. Transfer 2014, 133, 106–116. [Google Scholar] [CrossRef]
- Masson, N.; Piedrahita, R.; Hannigan, M. Approach for quantification of metal oxide type semiconductor gas sensors used for ambient air quality monitoring. Sens. Actuators B Chem. 2015, 208, 339–345. [Google Scholar] [CrossRef]
- Spinelle, S.; Gerboles, M.; Villani, M.G.; Aleixandre, M.; Bonavitacola, F. Field calibration of a cluster of low-cost commercially available sensors for air quality monitoring. Part B: NO, CO and CO2. Sens. Actuators B Chem. 2017, 238, 706–715. [Google Scholar] [CrossRef]
- Spinelle, L.; Gerboles, M.; Villani, M.G.; Aleixandre, M.; Bonavitacola, F. Field calibration of a cluster of low-cost available sensors for air quality monitoring. Part A: Ozone and nitrogen dioxide. Sens. Actuators B Chem. 2015, 215, 249–257. [Google Scholar] [CrossRef]
- Tans, S.J.; Verschueren, A.R.M.; Dekker, C. Room-temperature transistor based on a single carbon nanotube. Nature 1998, 393, 49–55. [Google Scholar] [CrossRef]
- Star, A.; Han, T.R.; Gabriel, J.C.P.; Bradley, K.; Gruner, G. Interaction of Aromatic Compounds with Carbon Nanotubes: Correlation to the Hammett Parameter of the Substituent and Measured Carbon Nanotube FET Response. Nano Lett. 2003, 3, 1421–1423. [Google Scholar] [CrossRef]
- Star, A.; Gabriel, J.-C.P.; Bradley, K.; Grüner, G. Electronic Detection of Specific Protein Binding Using Nanotube FET Devices. Nano Lett. 2003, 3, 459–463. [Google Scholar] [CrossRef]
- Star, A.; Joshi, V.; Thomas, D.; Niemann, J.; Gabriel, J.C.P.; Valcke, C. Nanoelectronic CO2 Breath Sensors; Nano Science and Technology Institute: Bangalore, India, 2005; Volume 1, ISBN 0-9767985-0-6. Available online: www.nsti.org (accessed on 14 August 2018).
- Bard, A.J.; Faulkner, L.R. Electrochemical Methods; Wiley: Hoboken, NJ, USA, 2000. [Google Scholar]
- Star, A.; Han, T.R.; Joshi, V.; Gabriel, J.C.P.; Gruner, G. Nanoelectronic Carbon Dioxide Sensors. Adv. Mater. 2004, 16, 2049–2052. [Google Scholar] [CrossRef]
- Bai, H.; Shi, G. Gas Sensors Based on Conducting Polymers. Sensors 2007, 7, 267–307. [Google Scholar] [CrossRef] [Green Version]
- Biaggi-Labiosa, A.; Sola, F.; Lebron-Colon, M.; Evans, L.J.; Xu, J.C.; Hunter, G.W.; Berger, G.M.; Gonzalez, J.M. A novel methane sensor based on porous SnO2 nanorods: room temperature to high temperature detection. Nanotechnology 2012, 23, 455504. [Google Scholar] [CrossRef] [PubMed]
- Firouzi, A.; Sobri, S.; Yasin, F.M.; Ahmadun, F. Fabrication of Gas Sensors based on Carbon Nanotube for CH4 and CO2 Detection. IPCBEE 2011, 2, 166. [Google Scholar]
- Wang, Y.; Chyu, M.K.; Wang, Q. Passive wireless surface acoustic wave CO2 sensor with carbon nanotube nanocomposite as an interface layer. Sens. Actuators A Phys. 2014, 220, 44. [Google Scholar] [CrossRef]
- Elhaes, H.; Fakhry, A.; Ibrahim, M. Carbon Nano materials as gas sensors. Mater. Today 2016, 3, 2490. [Google Scholar] [CrossRef]
- Zaporotskova, I.V.; Boroznina, N.P.; Parkhomenko, Y.N.; Kozhitov, L.V. Carbon nanotubes: Sensor properties. A review. Mod. Electron. Mater. 2016, 2, 95–105. [Google Scholar] [CrossRef]
- Leghrib, R.; Dufour, T.; Demoisson, F.; Claessens, N.; Reniers, F.; Llobet, E. Gas sensing properties of multiwall carbon nanotubes decorated with rhodium nanoparticles. Sens. Actuator B Chem. 2011, 160, 974–980. [Google Scholar] [CrossRef] [Green Version]
- Aguayo-López, M.L.; Capitán-Vallvey, L.F.; Fernández-Ramos, M.D. Optical sensor for carbon dioxide gas determination, characterization and improvements. Talanta 2014, 126, 196–201. [Google Scholar] [CrossRef] [PubMed]
- Geim, A.K.; Novoselov, K.S. The rise of graphene. Nat. Mater. 2007, 6, 183–191. [Google Scholar] [CrossRef] [PubMed]
- Najaf, M. Adsorption of carbon dioxide (CO2) at S functionalized boron nitride (BN) and aluminum nitride (AlN) nanotubes (9, 0): A quantum chemical investigation. Appl. Surf. Sci. 2016, 384, 380–385. [Google Scholar] [CrossRef]
- Soltani, A.; Taghartapeh, M.R.; Ramezani, M.; Lemeski, E.T.; Abroudi, M.; Mighani, H. A theoretical study of the adsorption behavior of N2O on single-walled AlN and AlP nanotubes. Superlattices Microstruct. 2013, 58, 178–190. [Google Scholar] [CrossRef]
- Esrafili, D.M.; Nurazar, N.R.; Nematollahi, P. Ambient carbon dioxide capture by different dimensional AlN nanostructures: A comparative DFT study. Superlattices Microstruct. 2016, 96, 170. [Google Scholar] [CrossRef]
- Songa, F.; Zhaoa, Y.; Caob, Y.; Dinga, J.; Bua, Y.; Zhonga, Q. Capture of carbon dioxide from flue gases by amine-functionalized TiO2 nanotubes. Appl. Surf. Sci. 2013, 268, 124–128. [Google Scholar] [CrossRef]
- Srinives, S.; Sarkar, T.; Hernandez, R.; Mulchandani, A. A miniature chemiresistor sensor for carbon dioxide. Anal. Chim. Acta 2015, 874, 54–58. [Google Scholar] [CrossRef] [PubMed]
- Mitrokotsa, A.; Douligeris, C. Auerbach Publications; CRC Press: Boca Raton, FL, USA, 2009; pp. 511–515. [Google Scholar]
- Sayago, I.; Fernández, M.J.; Fontecha, J.L.; Horrillo, M.C.; Vera, C.; Bustero, I.O. New sensitive layers for surface acoustic wave gas sensors based on polymer and carbon nanotube composites. Procedia Eng. 2011, 25, 256–259. [Google Scholar] [CrossRef]
- Wang, W.; Lee, K.; Kim, T.; Park, I.; Yang, S. A novel wireless, passive CO2 sensor incorporating a surface acoustic wave reflective delay line. Smart Mater. Struct. 2007, 16, 1382. [Google Scholar] [CrossRef]
- Potyrailo, A.R.; Surman, C.; Nagraj, N.; Burns, A. Materials and Transducers toward Selective Wireless Gas Sensing. Chem. Rev. 2011, 111, 7315–7354. [Google Scholar] [CrossRef] [PubMed]
- Hafiza, S.M.; Ritikosa, R.; Whitchera, T.J.; Razibb, M.D.N.; Bienb, D.C.S.; Nakajimac, H.; Saisopac, T.; Songsiriritthigul, P.; Huanga, N.M.; Rahman, S.A. A practical carbon dioxide gas sensor using room-temperature hydrogen plasma reduced graphene oxide. Sens. Actuator B Chem. 2014, 193, 692–700. [Google Scholar] [CrossRef]
- Yoon, H.J.; Jun, D.H.; Yang, J.H.; Zhou, Z.; Yang, S.S.; Cheng, M.M. Carbon dioxide gas sensor using a graphene sheet. Sens. Actuators B Chem. 2011, 157, 312. [Google Scholar] [CrossRef]
- Protich, Z.; Wong, P.; Santhanam, K.S.V. Composite of Zinc Using Graphene Quantum Dot Bath: A Prospective Material for Energy Storage. ACS Sustain. Chem. Eng. 2016, 4, 6177–6185. [Google Scholar] [CrossRef]
- Knobelspiesa, S.; Bierera, B.; Pereza, A.O.; Wöllensteina, J.; Kneera, J.; Palzera, S. Low-cost gas sensing system for the reliable and precise measurement of methane, carbon dioxide and hydrogen sulfide in natural gas and biomethane. Sens. Actuators B Chem. 2016, 236, 885–892. [Google Scholar] [CrossRef]
- Trung, D.D.; Toan, L.D.; Hong, H.S.; Lam, T.D.; Trung, T.; Hieu, N.V. Selective detection of carbon dioxide using LaOCl-functionalized SnO2 nanowires for air-quality monitoring. Talanta 2012, 88, 152–159. [Google Scholar] [CrossRef] [PubMed]
- Herrán, J.; Mandayo, G.G.; Ayerdi, I.; Castaño, E. On the structural characterization of BaTiO3–CuO as CO2 sensing material. Sens. Actuators B Chem. 2008, 133, 315–320. [Google Scholar] [CrossRef]
- Herrán, J.; Mandayo, G.G.; Castaño, E. Proceedings of VI International Workshop on Semiconductor Gas Sensors—SGS 2008. Thin Solid Films 2009, 517, 6192–6197. [Google Scholar]
- Chapelle, A.; Oudrhiri-Hassani, F.; Presmanes, L.; Barnabé, A.; Tailhades, P. CO2 sensing properties of semiconducting copper oxide and spinel ferrite nanocomposite thin film. Appl. Surf. Sci. 2010, 256, 4715–4719. [Google Scholar] [CrossRef] [Green Version]
- Fan, K.; Qin, H.; Wang, L.; Ju, L.; Hu, J. CO2 gas sensors based on La1−xSrxFeO3 nanocrystalline powders. Sens. Actuators B Chem. 2013, 177, 265–269. [Google Scholar] [CrossRef]
- Michel, C.R.; López-Contreras, N.L.; Martínez-Preciado, A.H. Gas sensing properties of Gd2O3 microspheres prepared in aqueous media containing pectin. Sens. Actuators B Chem. 2013, 177, 390–396. [Google Scholar] [CrossRef]
- Jinesh, K.B.; Dam, V.A.T.; Swerts, J.; de Nooijer, C.; van Elshocht, S.; Brongersma, S.H.; Crego-Calama, M. Room-temperature CO2 sensing using metal–insulator–semiconductor capacitors comprising atomic-layer-deposited La2O3 thin films. Sens. Actuators B Chem. 2011, 156, 276–282. [Google Scholar] [CrossRef]
- Michel, C.R.; Contreras, N.L.L.; López-Alvarez, M.A.; Martínez-Preciado, A.H.A. Gas selectivity of nanostructured ZnSb2O6 synthesized by a colloidal method. Sens. Actuators B Chem. 2012, 171, 686–690. [Google Scholar] [CrossRef]
- Comini, E. Metal oxide nanowire chemical sensors: innovation and quality of life. Mater. Today 2013, 179, 32–45. [Google Scholar] [CrossRef]
- Waghuley, S.A.; Yenorkar, S.M.; Yawale, S.S.; Yawale, S.P. Application of chemically synthesized conducting polymer-polypyrrole as a carbon dioxide gas sensor. Sens. Actuators B Chem. 2008, 128, 366–373. [Google Scholar] [CrossRef]
- Ishizu, K.; Takei, Y.; Honda, M.; Noda, K.; Inaba, A.; Itoh, T.; Maeda, R.; Matsumoto, K.; Shimoyama, I. Carbon dioxide gas sensor with ionic gel. In Proceedings of the 17th International Conference on Solid-State Sensors, Actuators and Microsystems, Barcelona, Spain, 16–20 June 2013; pp. 1633–1635. [Google Scholar]
- Smith, A.D.; Elgammal, K.; Fan, X.; Lemme, M.C.; Delin, A.; Rasander, M.; Bergqvist, L.; Schroder, S.; Fischer, A.C.; Niklaus, F.; et al. Graphene-based CO2 sensing and its cross-sensitivity with humidity. RSC Adv. 2017, 7, 22329–22339. [Google Scholar] [CrossRef]
- Chen, G.; Paronyan, T.M.; Harutyunyan, A.R. Sub-ppt gas detection with pristine grapheme. Appl. Phys. Lett. 2012, 101, 053119. [Google Scholar] [CrossRef]
- Singh, E.; Meyyappan, M.; Nalwa, H.S. Flexible Graphene-Based Wearable Gas and Chemical Sensors. ACS Appl. Mater. Interfaces 2017, 9, 34544–34586. [Google Scholar] [CrossRef] [PubMed]
- Li, Y.; Li, G.; Wang, X.; Zhu, Z.; Ma, H.; Zhang, T.; Jin, J. Poly(ionic liquid)-wrapped single-walled carbon nanotubes for sub-ppb detection of CO2. Chem. Commun. 2012, 48, 8222–8224. [Google Scholar] [CrossRef] [PubMed]
- Michel, C.R.; Martínez-Preciado, A.H.; Contreras, N.L.L. Gas sensing properties of Nd2O3 nanostructured microspheres. Sens. Actuators B Chem. 2013, 184, 8–14. [Google Scholar] [CrossRef]
- Kim, K.J.; Lu, P.; Culp, J.T.; Ohodnicki, P.R. Metal-Organic Framework Thin Film Coated Optical Fiber Sensors: A Novel Waveguide-Based Chemical Sensing Platform. ACS Sens. 2018, 3, 386–394. [Google Scholar] [CrossRef] [PubMed]
- Liu, K.; Lewicki, R.; Tittel, K.F. Development of mid-infrared nitrogen dioxide sensor based on Faraday rotation spectroscopy. Sens. Actuators B Chem. 2016, 237, 887–893. [Google Scholar] [CrossRef]
- Mason, L.W.; Oh, S.; Joseph, J.P. Development and testing of a solid-state CO2 gas sensor for use in reduced-pressure environments. Sens. Actuators 1995, 24–25, 407–411. [Google Scholar] [CrossRef]
- Schwandt, C.; VasantKumar, R.; Hills, M.P. Solid state electrochemical gas sensor for the quantitative determination of carbon dioxide. Sens. Actuators B Chem. 2018, 265, 27–34. [Google Scholar] [CrossRef]
- Li, J.; Lu, Y.; Ye, Q.; Cinke, M.; Han, J.; Meyyappan, M. Carbon Nanotube Sensors for Gas and Organic Vapor Detection. Nano Lett. 2003, 3, 929–933. [Google Scholar] [CrossRef]
- Andringa, A.M.; Meijboom, J.R.; Smits, E.C.P.; Mathijssen, S.G.J.; Blom, P.W.M.; de Leeuw, D.M. Gate-Bias Controlled Charge Trapping as a Mechanism for NO2 Detection with Field-Effect Transistors. Adv. Funct. Mater. 2011, 21, 100–107. [Google Scholar] [CrossRef]
- Öztürk, S.; Kılınç, N.; Öztürk, Z.Z. Fabrication of ZnO nanorods for NO2 sensor applications: Effect of dimensions and electrode position. J. Alloy. Compd. 2013, 581, 196–201. [Google Scholar] [CrossRef]
- Firouzi, A.; Sobri, S.; Yasin, F.M.; Ahmadun, F.I.R. Synthesis of carbon nanotubes by chemical vapour deposition and their application for CO2 and CH4 detection. IPCBEE 2011, 2, 165–168. [Google Scholar]
- Hyodo, T.; Inoue, H.; Motomura, H.; Matsuo, K.; Hashishin, T.; Tamaki, J.; Shimizu, Y.; Egashira, M. NO2 sensing properties of macroporous In2O3-based powders fabricated by utilizing ultrasonic spray pyrolysis employing polymethylmethacrylate microspheres as a template. Sens. Actuators B Chem. 2010, 151, 265–273. [Google Scholar] [CrossRef]
- Kim, S.J.; Hwang, I.S.; Choi, J.K.; Lee, J.H. Gas sensing characteristics of WO3 nanoplates prepared by acidification method. Thin Solid Films 2011, 519, 2020–2024. [Google Scholar] [CrossRef]
- Lee, C.Y.; Kim, S.J.; Hwang, I.S.; Lee, J.H. Glucose-mediated hydrothermal synthesis and gas sensing characteristics of WO3 hollow microspheres. Sens. Actuators B Chem. 2009, 142, 236–242. [Google Scholar] [CrossRef]
- Deng, S.; Tjoa, V.; Fan, H.M.; Tan, H.R.; Sayle, D.C.; Olivo, M.; Mhaisalkar, S.; Wei, J.; Sow, C.H.J. Reduced Graphene Oxide Conjugated Cu2O Nanowire Mesocrystals for High-Performance NO2 Gas Sensor. J. Am. Chem. Soc. 2012, 134, 4905–4917. [Google Scholar] [CrossRef] [PubMed]
- Naik, A.J.T.; Warwick, M.E.A.; Moniz, S.J.A.; Blackman, C.S.; Parkin, I.P.; Binions, R. Nanostructured tungsten oxide gas sensors prepared by electric field assisted aerosol assisted chemical vapour deposition. J. Mater. Chem. A 2013, 1, 1827–1833. [Google Scholar] [CrossRef]
- Tian, Y.C.; Sun, L.; Lü, R.; Zhou, W.; Shi, K.; Kan, K.; Wang, J.; Fu, H. Growth of small sized CeO2 particles in the interlayers of expanded graphite for high-performance room temperature NOx gas sensors. J. Mater. Chem. A 2013, 1, 12742–12749. [Google Scholar]
- Liu, X.; Parisi, J.; Sun, X.; Lei, Y. Solid-state gas sensors for high temperature applications—A review. J. Mater. Chem. A 2014, 2, 9919–9943. [Google Scholar] [CrossRef]
- Yuan, W.; Shi, G. Graphene-based gas sensors. J. Mater. Chem. A 2013, 1, 10078–10091. [Google Scholar] [CrossRef]
- Maeng, S.; Kim, S.W.; Lee, D.H.; Moon, S.E.; Kim, K.C.; Maiti, A. SnO2 Nanoslab as NO2 Sensor: Identification of the NO2 Sensing Mechanism on a SnO2 Surface. ACS Appl. Mater. Interfaces 2014, 6, 358. [Google Scholar] [CrossRef] [PubMed]
- Thomson, A.J.; Giannopoulos, G.; Pretty, J.; Baggs, E.M.; Richardson, D.J. Biological sources and sinks of nitrous oxide and strategies to mitigate emissions. Philos. Trans. R. Soc. Lond. B Biol. Sci. 2012, 367, 1157–1168. [Google Scholar] [CrossRef] [PubMed] [Green Version]
- Tavares, P.; Pereira, A.S.; Moura, J.J.G. Metalloenzymes of the denitrification pathway. J. Inorg. Biochem. 2006, 100, 2087–2100. [Google Scholar] [CrossRef] [PubMed]
- Yoosefian, M. Powerful greenhouse gas nitrous oxide adsorption onto intrinsic and Pd doped Single walled carbon nanotube. Appl. Surf. Sci. 2017, 392, 225–230. [Google Scholar] [CrossRef]
- Gu, D.; Li, X.; Zhao, Y.; Wang, J. Enhanced NO2 sensing of SnO2/SnS2 heterojunction based sensor. Sens. Actuators B Chem. 2017, 244, 67–76. [Google Scholar] [CrossRef]
- Lee, J.-H.; Katoch, A.; Choi, S.-W.; Kim, J.-H.; Kim, H.W.; Kim, S.S. Extraordinary Improvement of Gas-Sensing Performances in SnO2 Nanofibers Due to Creation of Local p–n Heterojunctions by Loading Reduced Graphene Oxide Nanosheets. ACS Appl. Mater. Interfaces 2015, 7, 3101–3109. [Google Scholar] [CrossRef] [PubMed]
- Park, S.; An, S.; Mun, Y.; Lee, C. UV-Enhanced NO2 Gas Sensing Properties of SnO2-Core/ZnO-Shell Nanowires at Room Temperature. ACS Appl. Mater. Interfaces 2013, 5, 4285–4292. [Google Scholar] [CrossRef] [PubMed]
- Liu, S.; Yu, B.; Zhang, H.; Fei, T.; Zhang, T. Enhancing NO2 gas sensing performances at room temperature based on reduced graphene oxide-ZnO nanoparticles hybrids. Sens. Actuators B Chem. 2014, 202, 272–278. [Google Scholar] [CrossRef]
- Shubhda, S.; Kiran, J.; Singh, V.N.; Sukhvir, S.; Vijayan, N.; Nita, D. Faster response of NO2 sensing in graphene-WO3 nanocomposites. Nanotechnology 2012, 23, 205501. [Google Scholar]
- Valentini, L.; Armentano, I.; Kenny, J.M.; Cantalini, C.; Lozzi, L.; Santucci, S. Sensors for sub-ppm NO2 gas detection based on carbon nanotube thin films. Appl. Phys. Lett. 2003, 82, 961–963. [Google Scholar] [CrossRef]
- Pan, X.; Zhao, X.; Chen, J.; Bermak, A.; Fan, Z. A fast-response/recovery ZnO hierarchical nanostructure based gas sensor with ultra-high room-temperature output response. Sens. Actuators B Chem. 2015, 206, 764–771. [Google Scholar] [CrossRef]
- Emission of Greenhouse Gases in the US. Available online: https://www.eia.gov/environment/emissions/ghg_report/ghg_nitrous.cfm (accessed on 14 August 2018).
- Eugster, W.; Kling, G.W. Performance of a low-cost methane sensor for ambient concentration measurements in preliminary studies. Atmos. Meas. Tech. 2012, 2, 1925–1934. [Google Scholar] [CrossRef]
- Tao, C.; Li, X.; Yang, J.; Shi, Y. Optical fiber sensing element based on luminescence quenching of silica nanowires modified with cryptophane-A for the detection of methane. Sens. Actuators B Chem. 2011, 156, 553–558. [Google Scholar] [CrossRef]
- Wu, Z.; Chen, X.; Zhu, S.; Zhou, Z.; Yao, Y.; Quan, W.; Liu, B. Room Temperature Methane Sensor Based on Graphene Nanosheets/Polyaniline Nanocomposite Thin Film. IEEE Sens. 2013, 13, 777–782. [Google Scholar] [CrossRef]
- Roy, S.; Sarkar, C.K.; Bhattacharyya, P. A highly sensitive methane sensor with nickel alloy microheater on micromachined Si substrate. Solid-State Electron. 2012, 76, 84–90. [Google Scholar] [CrossRef]
- Haridas, D.; Gupta, V. Enhanced response characteristics of SnO2 thin film based sensors loaded with Pd clusters for methane detection. Sens. Actuators B Chem. 2012, 166–167, 156–164. [Google Scholar] [CrossRef]
- Prasad, A.K.; Amirthapandian, S.; Dhara, S.; Dash, S.; Murali, N.; Tyagi, A.K. Novel single phase vanadium dioxide nanostructured films for methane sensing near room temperature. Sens. Actuators B Chem. 2014, 191, 252–256. [Google Scholar] [CrossRef] [Green Version]
- Vuong, N.M.; Hieu, N.M.; Hieu, H.N.; Yi, H.; Kim, D.; Han, Y.S.; Kim, M. Ni2O3-decorated SnO2 particulate films for methane gas sensors. Sens. Actuators B Chem. 2014, 192, 327–333. [Google Scholar] [CrossRef]
- Gong, G.; Zhu, H. Development of highly sensitive sensor system for methane utilizing cataluminescence. Luminescence 2015, 31, 183–189. [Google Scholar] [CrossRef] [PubMed]
- Zhang, Y.N.; Zhao, Y.; Wang, Q. Measurement of methane concentration with cryptophane E infiltrated photonic crystal microcavity. Sens. Actuators B Chem. 2015, 209, 431–437. [Google Scholar] [CrossRef]
- Yang, D.; Yang, N.; Ni, J.; Xiao, J.; Jiang, J.; Liang, Q.; Ren, T.; Chen, X. First-principles approach to design and evaluation of graphene as methane sensors. Mater. Des. 2017, 119, 401. [Google Scholar] [CrossRef]
- Van den Bossche, M.; Rose, N.T.; De Wekker, S.F.J. Potential of a low-cost gas sensor for atmospheric methane monitoring. Sens. Actuators B Chem. 2017, 238, 501–509. [Google Scholar] [CrossRef]
- Humayun, M.T.; Divan, R.; Stan, L.; Rosenmann, D.; Gosztola, D.; Paul, L.G.; Solomon, A.; Paprotny, I. Ubiquitous low-cost functionalized multi-walled carbon nanotube sensors for distributed methane leak detection. IEEE Sens. J. 2016, 16, 8692–8699. [Google Scholar] [CrossRef]
- Humayun, M.T.; Divan, R.; Liu, Y.; Gundel, L.; Solomon, P.; Paprotny, I. Novel chemoresistive CH4 sensor with 10 ppm sensitivity based on multiwalled carbon nanotubes functionalized with SnO2 nanocrystals. J. Vac. Sci. Technol. A Vac. Surf. Films 2016, 34, 01A131. [Google Scholar] [CrossRef]
- Xia, J.B.; Zhu, F.; Zhang, S.; Kolomenskii, A.; Schuessler, H. A ppb level sensitive sensor for atmospheric methane detection. Infrared Phys. Technol. 2017, 86, 194–201. [Google Scholar] [CrossRef]
- Taylor, P.; Velásquez-García, L.F. Electrospray-printed nanostructured graphene oxide gas sensors. Nanotechnology 2015, 26, 505301. [Google Scholar] [CrossRef] [PubMed] [Green Version]
- Rieu, M.; Camara, M.; Tournier, G.; Viricelle, J.P.; Pijolat, C.; de Rooij, N.F.; Briand, D. Fully inkjet printed SnO2 gas sensor on plastic substrate. Sens. Actuators B Chem. 2016, 236, 1091–1097. [Google Scholar] [CrossRef]
- Liua, L.S.; Wanga, Z.; Zhanga, Y.; Li, J.; Zhang, T. Sulfonated graphene anchored with tin oxide nanoparticles for detection of nitrogen dioxide at room temperature with enhanced sensing performances. Sens. Actuators B Chem. 2016, 228, 134–143. [Google Scholar] [CrossRef]
- Clément, P.; Perez, E.D.; Gonzalez, O.; Calaviaa, R.; Lucat, C.; Llobet, E.; Debéda, H. Gas discrimination using screen-printed piezoelectric cantilevers coated with carbon nanotubes. Sens. Actuators B Chem. 2016, 237, 1056–1065. [Google Scholar] [CrossRef]
- Molina-Lopez, F.; Briand, D.; de Rooij, N.F. Inkjet and microcontact printing of functional materials on foil for the fabrication of pixel-like capacitive vapor microsensors. Org. Electron. 2015, 16, 139–147. [Google Scholar] [CrossRef]
- Kida, T.; Nishiyama, A.; Yuasa, M.; Shimanoe, K.; Yamazoe, N. Highly sensitive NO2 sensors using lamellar-structured WO3 particles prepared by an acidification method. Sens. Actuators B Chem. 2009, 135, 568–574. [Google Scholar] [CrossRef]
- Andò, B.; Baglio, S.; Pasquale, G.D.; Pollicino, A.; D’Agata, S.; Gugliuzzo, C.; Lombardo, C.; Re, G. An Inkjet Printed CO2 Gas Sensor. Procedia Eng. 2015, 120, 628–631. [Google Scholar] [CrossRef]
- Farandos, N.M.; Li, T.; Kelsall, G.H. 3-D inkjet-printed solid oxide electrochemical reactors. II. LSM—YSZ electrodes. Electrochim. Acta 2018, 270, 264–273. [Google Scholar] [CrossRef]
- Jonnathan, M.J.; Hidalgo-Acosta, C.; Costa, A.L.V.; Simirnov, B.E.; Hubert, F.C.S.; Giraul, H. Large-scale layer-by-layer inkjet printing of flexible iridium-oxide based pH sensors. J. Electroanal. Chem. 2018, 819, 384–390. [Google Scholar]
- Kassem, O.; Saadaoui, M.; Rieu, M.; Sao-Joao, S.; Viricelle, J.P. Synthesis and inkjet printing of sol–gel derived tin oxide. J. Mater. Sci. 2018, 53, 12750–12761. [Google Scholar] [CrossRef]
- Wu, M.; Shin, J.; Hong, Y.; Jang, D.; Jin, X.S.; Kwon, H.; Lee, J.H. An FET-type gas sensor with a sodium ion conducting solid electrolyte for CO2 detection. Sens. Actuators B Chem. 2018, 259, 1058–1065. [Google Scholar] [CrossRef]
- Schiattarella, C.; Polichetti, T.; Villani, F.; Loffredo, F.; Alfano, B.; Massera, E.; Miglietta, M.L.; Francia, G.D. Lecture Notes in Electrical Engineering. In Proceedings of the 3rd National Conference on Sensors, Rome, Italy, 23–25 February 2016; Ando, B., Baldini, F., Diatale, C., Marrazza, G., Sicilano, P., Eds.; Springer: Berlin, Germany, 2018; p. 431. [Google Scholar]
- Jarvinen, T.; Lorite, G.S.; Rautio, A.R.; Juhasz, K.L.; Kukovecz, A.; Konya, Z.; Kordas, K.; Toth, G. Portable cyber-physical system for indoor and outdoor gas sensing. Sens. Actuators B Chem. 2017, 252, 983–990. [Google Scholar] [CrossRef]
- Breedon, M.; Spizzirri, P.; Taylor, M.; Plessis, J.D.; McCulloch, D.; Zhu, J.; Yu, L.; Hu, Z.; Rix, C.; Wlodarski, W.; et al. Synthesis of Nanostructured Tungsten Oxide Thin Films: A Simple, Controllable, Inexpensive, Aqueous Sol−Gel Method. Cryst. Growth Des. 2010, 10, 430–439. [Google Scholar] [CrossRef]
- Park, S.; An, S.; Ko, H.; Jin, C.; Lee, C. Synthesis of Nanograined ZnO Nanowires and Their Enhanced Gas Sensing Properties. ACS Appl. Mater. Interfaces 2012, 4, 3650–3656. [Google Scholar] [CrossRef] [PubMed]
- Stanoiu, A.; Simion, C.E.; Diamandescu, L.; Tarabasanu-Mihaila, D.; Feder, M. NO2 sensing properties of Cr2O3 highlighted by work function investigations. Thin Solid Films 2012, 522, 395–400. [Google Scholar] [CrossRef]
Figure 1.
The weather conditions.

Figure 2.
Global atmospheric concentrations of carbon dioxide over time. Taken from: https://www.epa.gov/climate-indicators/climate-change-indicators-atmospheric-concentrations-greenhouse-gases.
Figure 2.
Global atmospheric concentrations of carbon dioxide over time. Taken from: https://www.epa.gov/climate-indicators/climate-change-indicators-atmospheric-concentrations-greenhouse-gases.

Figure 3.
Carbon dioxide sensor responses to different concentrations of methane. Y = Sensor response; Z = Concentration. Group 1 a: CO2 concentration, 390 ppm, b: Ratio of carbon dioxide/methane, c: methane concentration 1.8 ppm; Group 2 a: CO2 concentration, 390 ppm, b: Ratio of carbon dioxide/methane, c: methane concentration 4.25 ppm; Group 3 a: CO2 concentration, 390 ppm, b: Ratio of carbon dioxide/methane, c: methane concentration 18 ppm; Group 4 a: CO2 concentration, 390 ppm, b: Ratio of carbon dioxide/methane, c: methane concentration 40 ppm; Group 5 a: CO2 concentration, 390 ppm, b: Ratio of carbon dioxide/methane, c: methane concentration 80 ppm; Group 6 a: CO2 concentration, 390 ppm, b: Ratio of carbon dioxide/methane, c: methane concentration 100 ppm. Reproduced with permission from Reference [5]. Nonappearance of c in 1, 2 and 3 indicates negligible values.
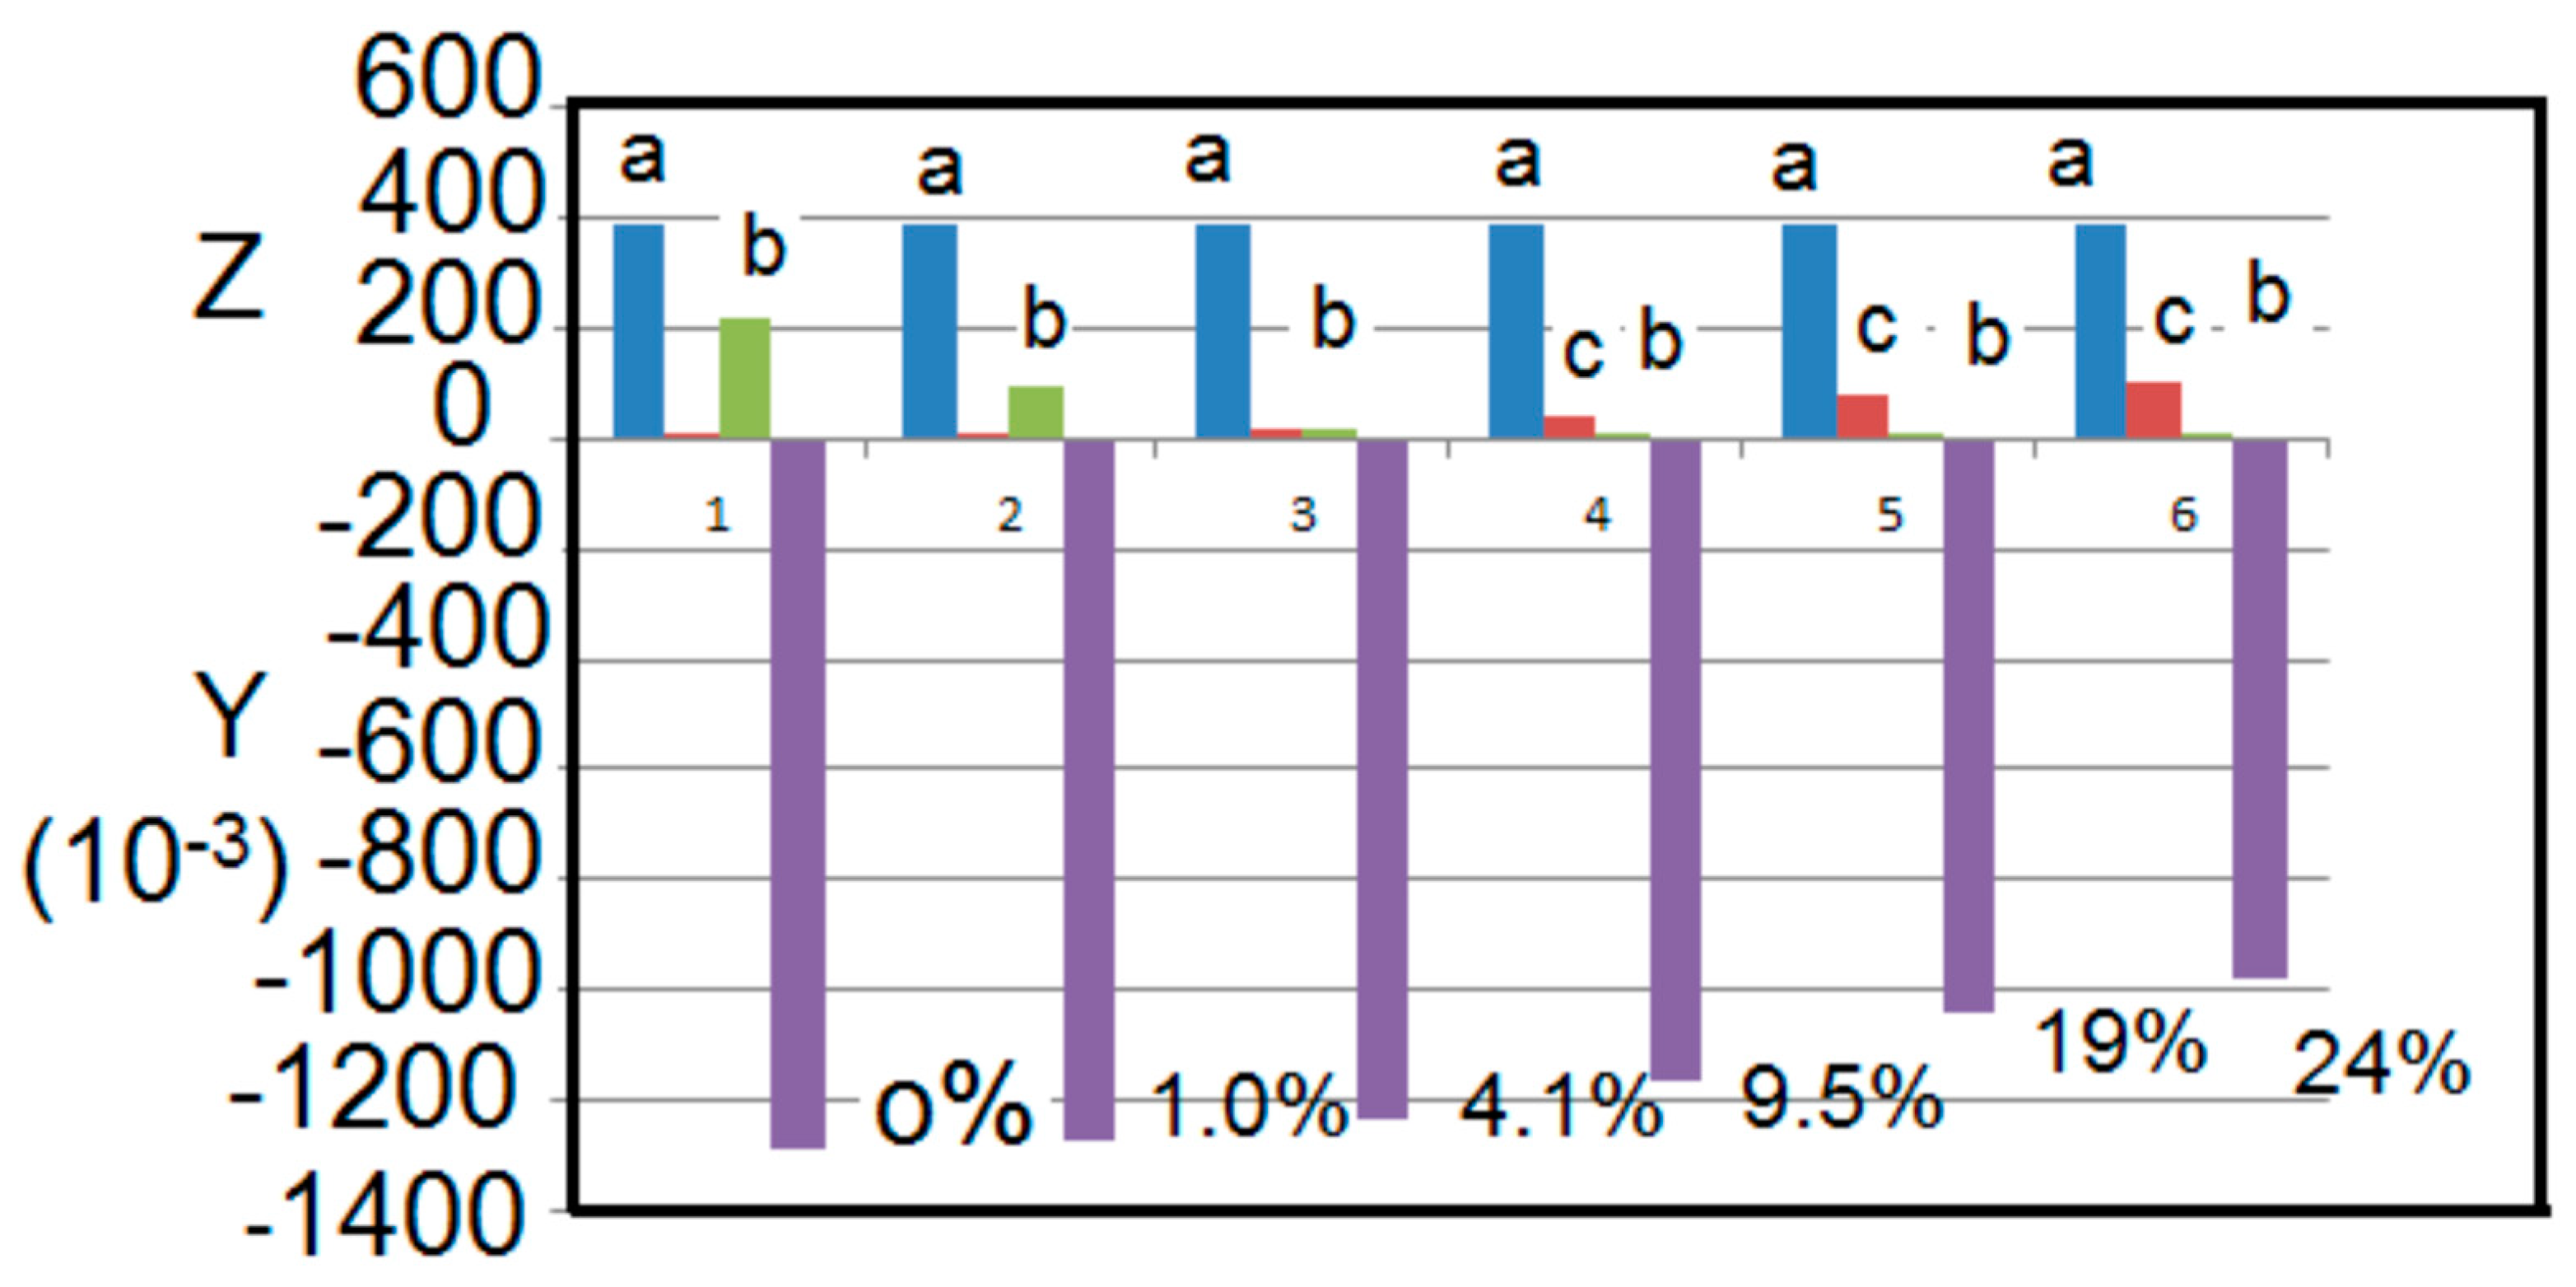
Figure 4.
Types of sensors developed for greenhouse gas measurements. M: digital multimeter; C: computer with software for monitoring the measuring multimeter; P: potentiostat (monitors the field effect transistor parameters); D: detector (e.g., photomultiplier or bolometer); GG: greenhouse gas; IDT: inter digitized electrode.
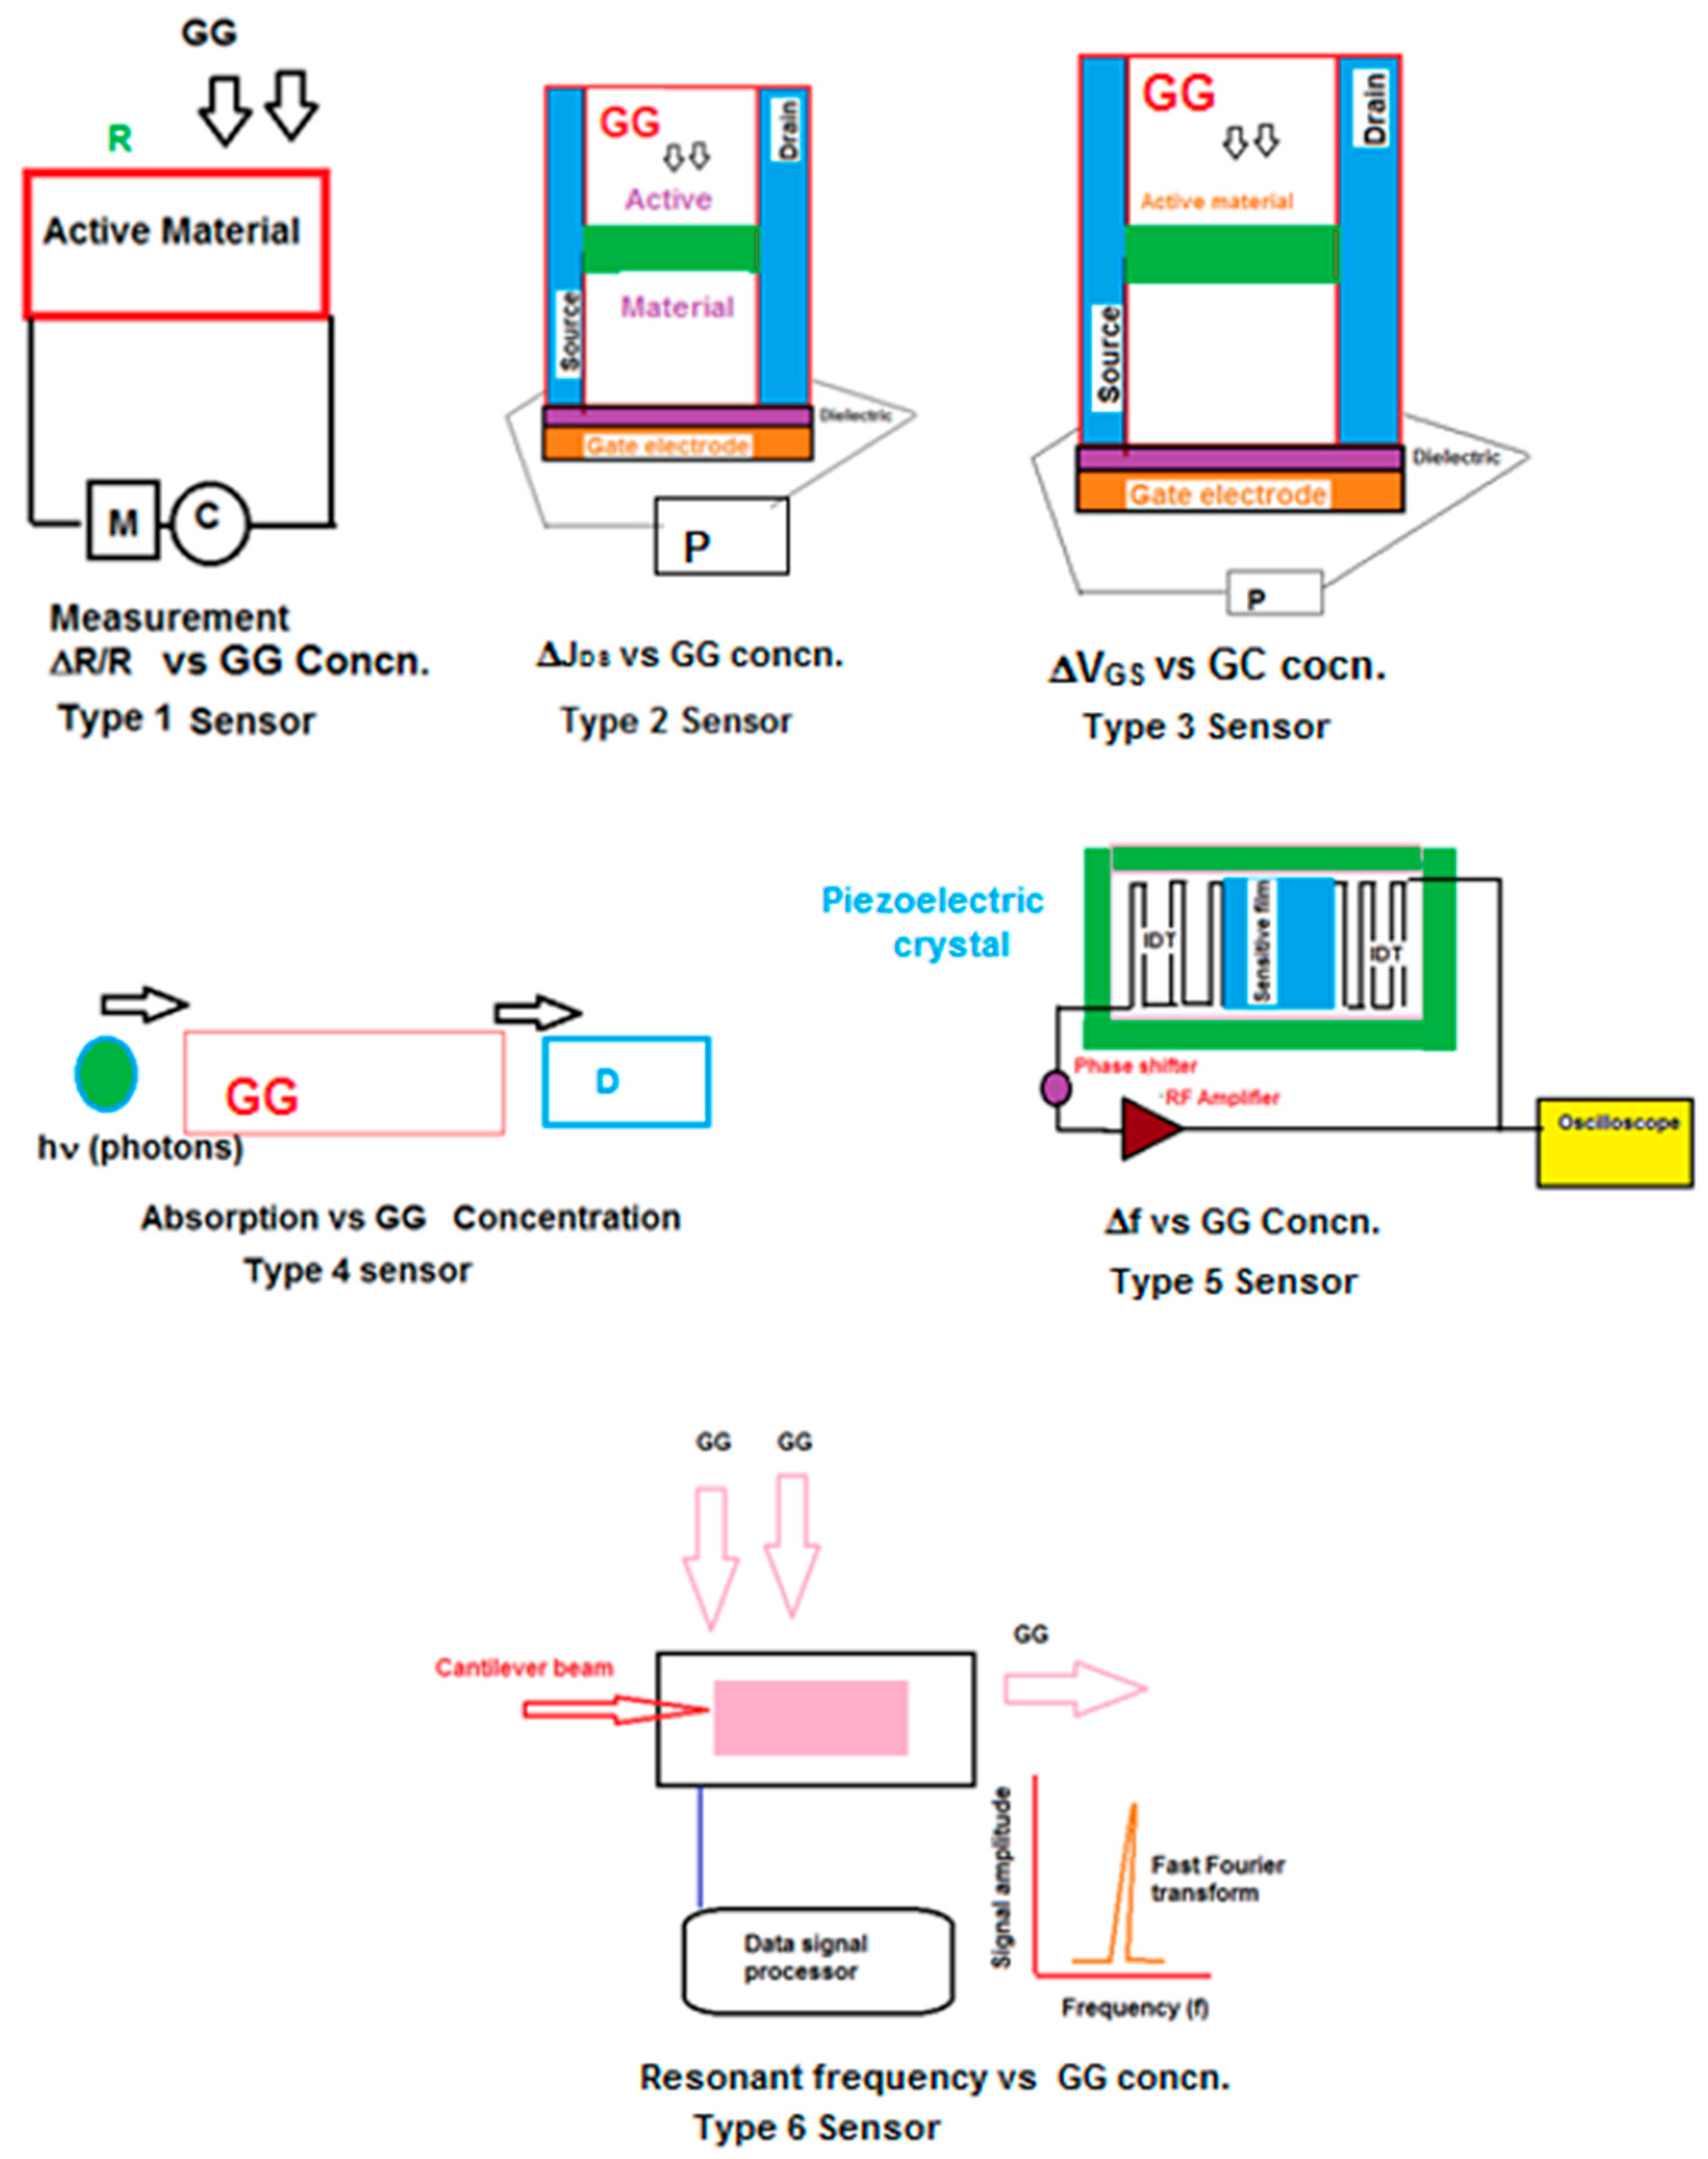
Figure 5.
The dielectric layer used for the measurement and the methodology. Ge is used as a dielectric layer. Reproduced with permission from Reference [15]. IR: infrared radiation.
Figure 5.
The dielectric layer used for the measurement and the methodology. Ge is used as a dielectric layer. Reproduced with permission from Reference [15]. IR: infrared radiation.

Figure 6.
Carbon dioxide determination using glass filters. Reproduced with permission from Reference [15].
Figure 6.
Carbon dioxide determination using glass filters. Reproduced with permission from Reference [15].
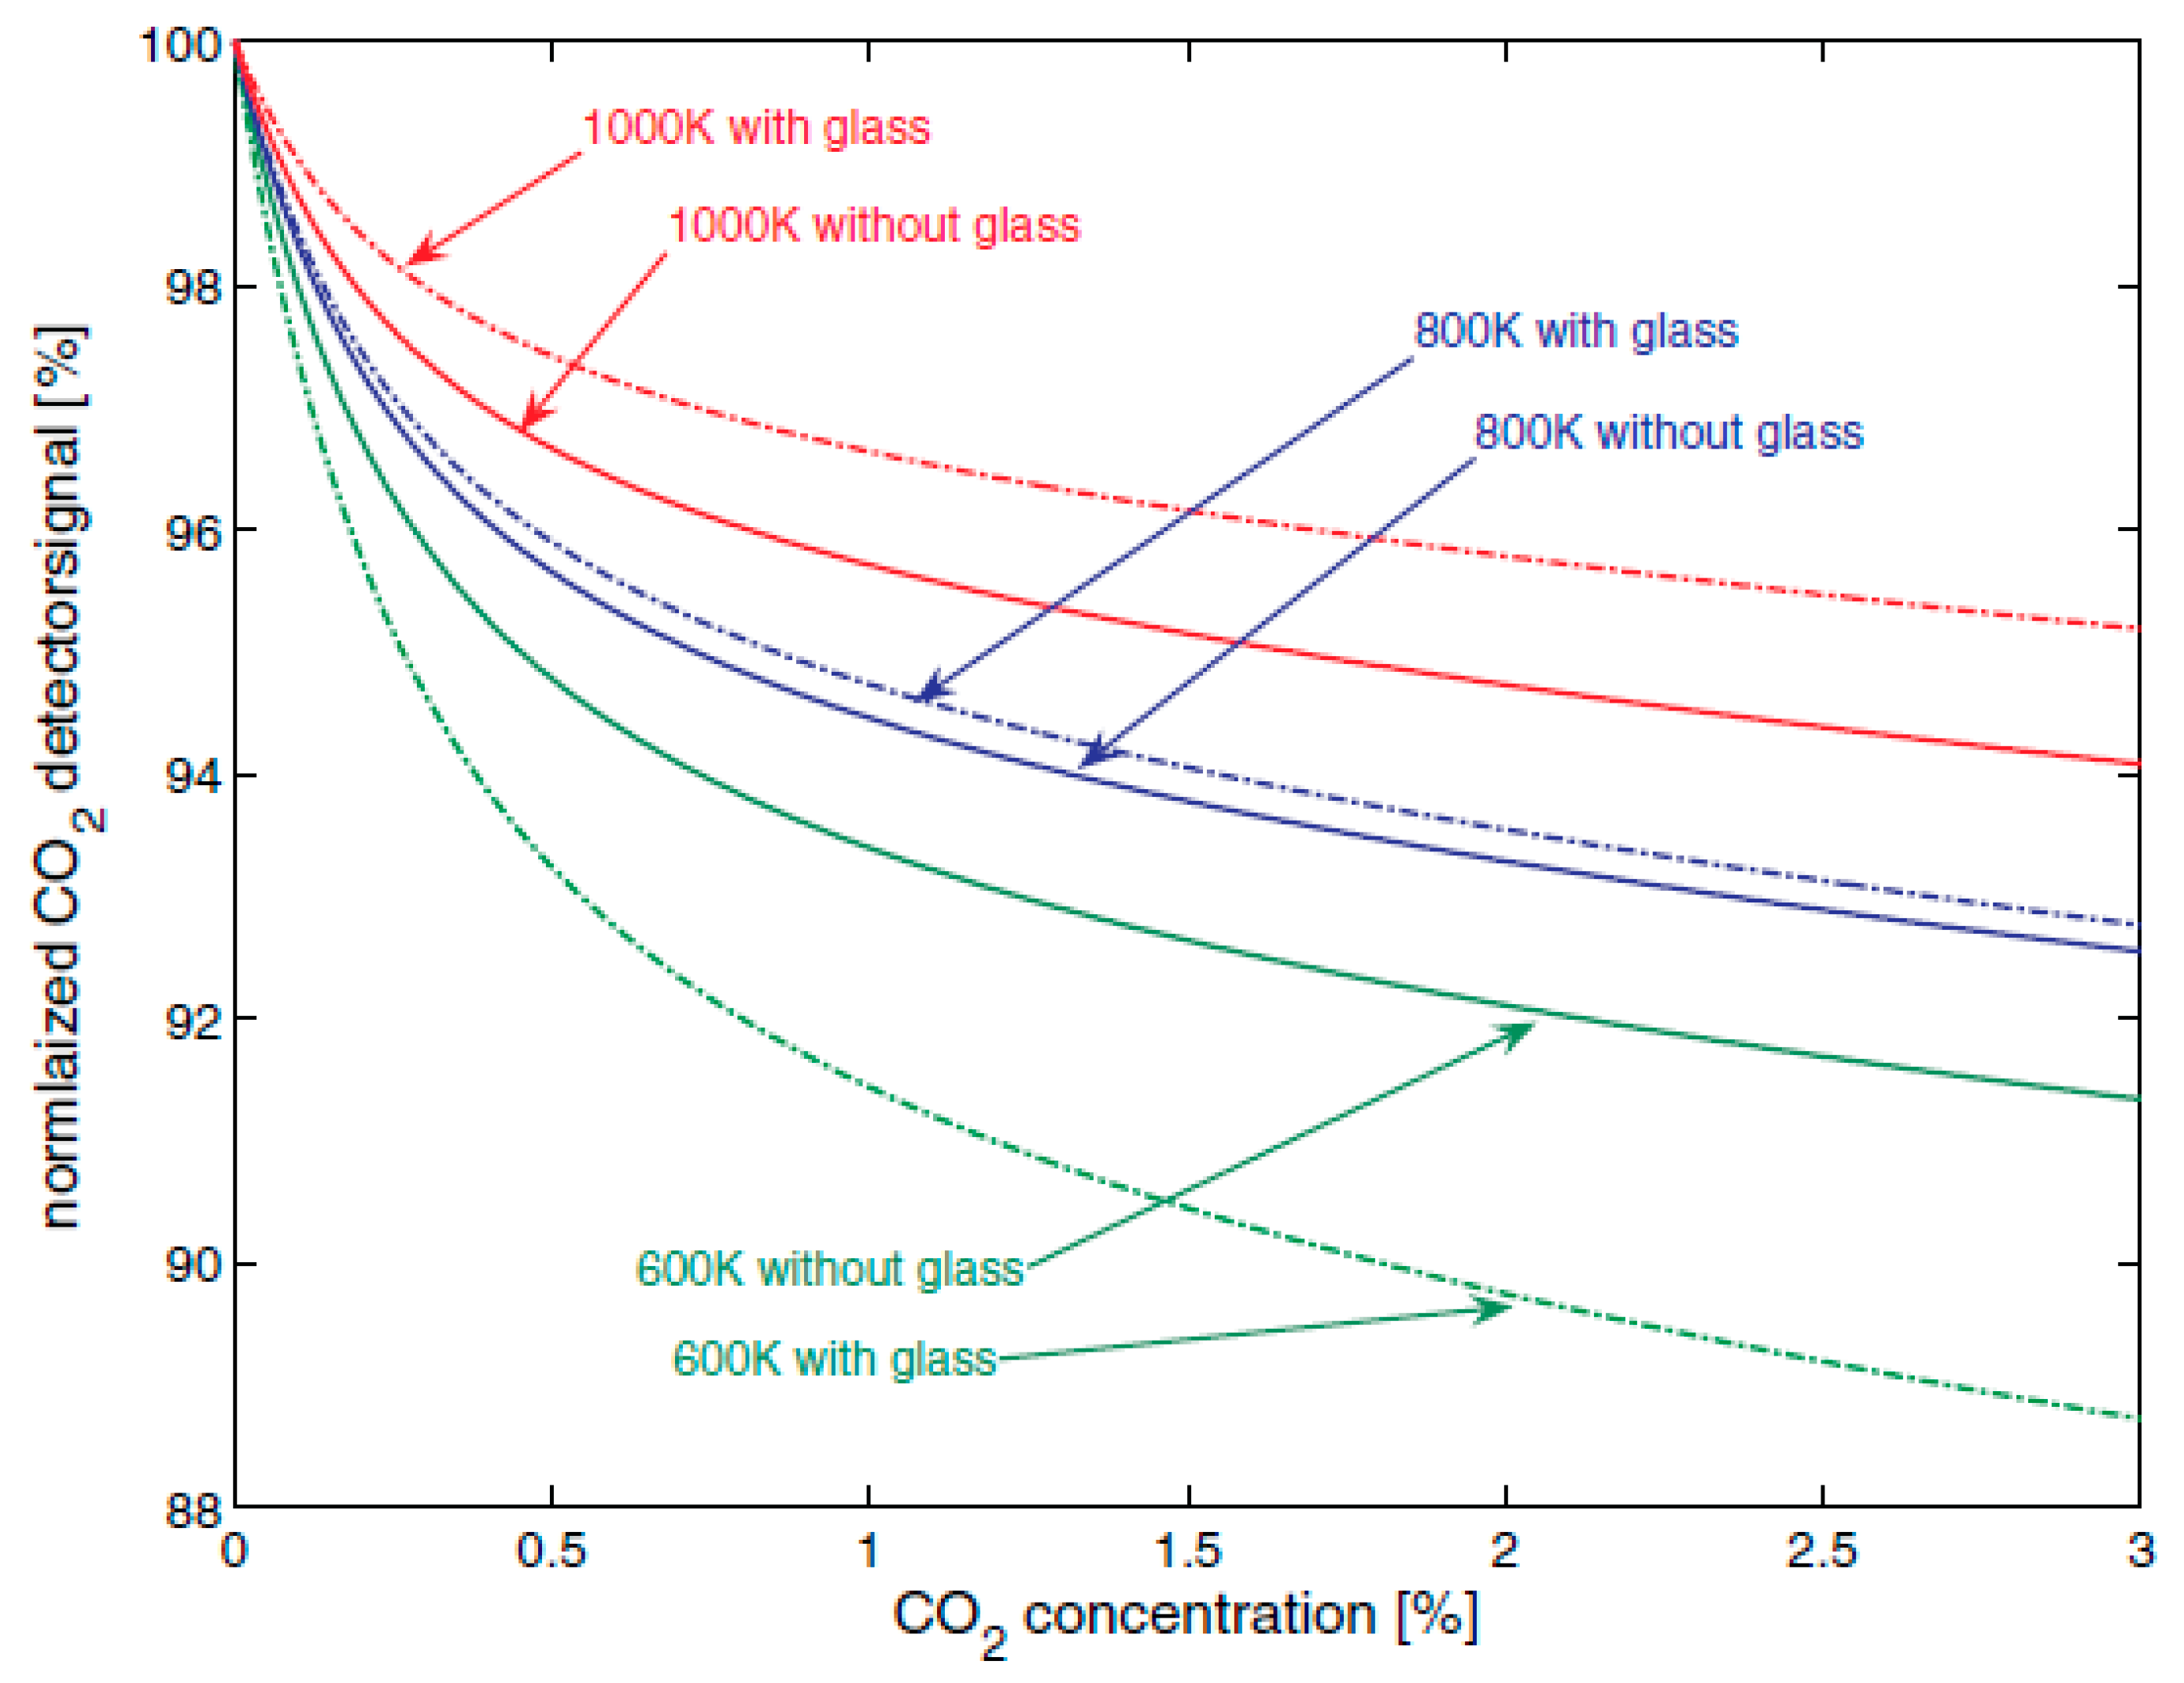
Figure 7.
Conductivity of sensor with concentration of carbon dioxide. Reproduced with permission from reference [19]. EB-PANI: emaraldine base polyaniline. NaSPANI: sodium sulfonated PANI.
Figure 7.
Conductivity of sensor with concentration of carbon dioxide. Reproduced with permission from reference [19]. EB-PANI: emaraldine base polyaniline. NaSPANI: sodium sulfonated PANI.
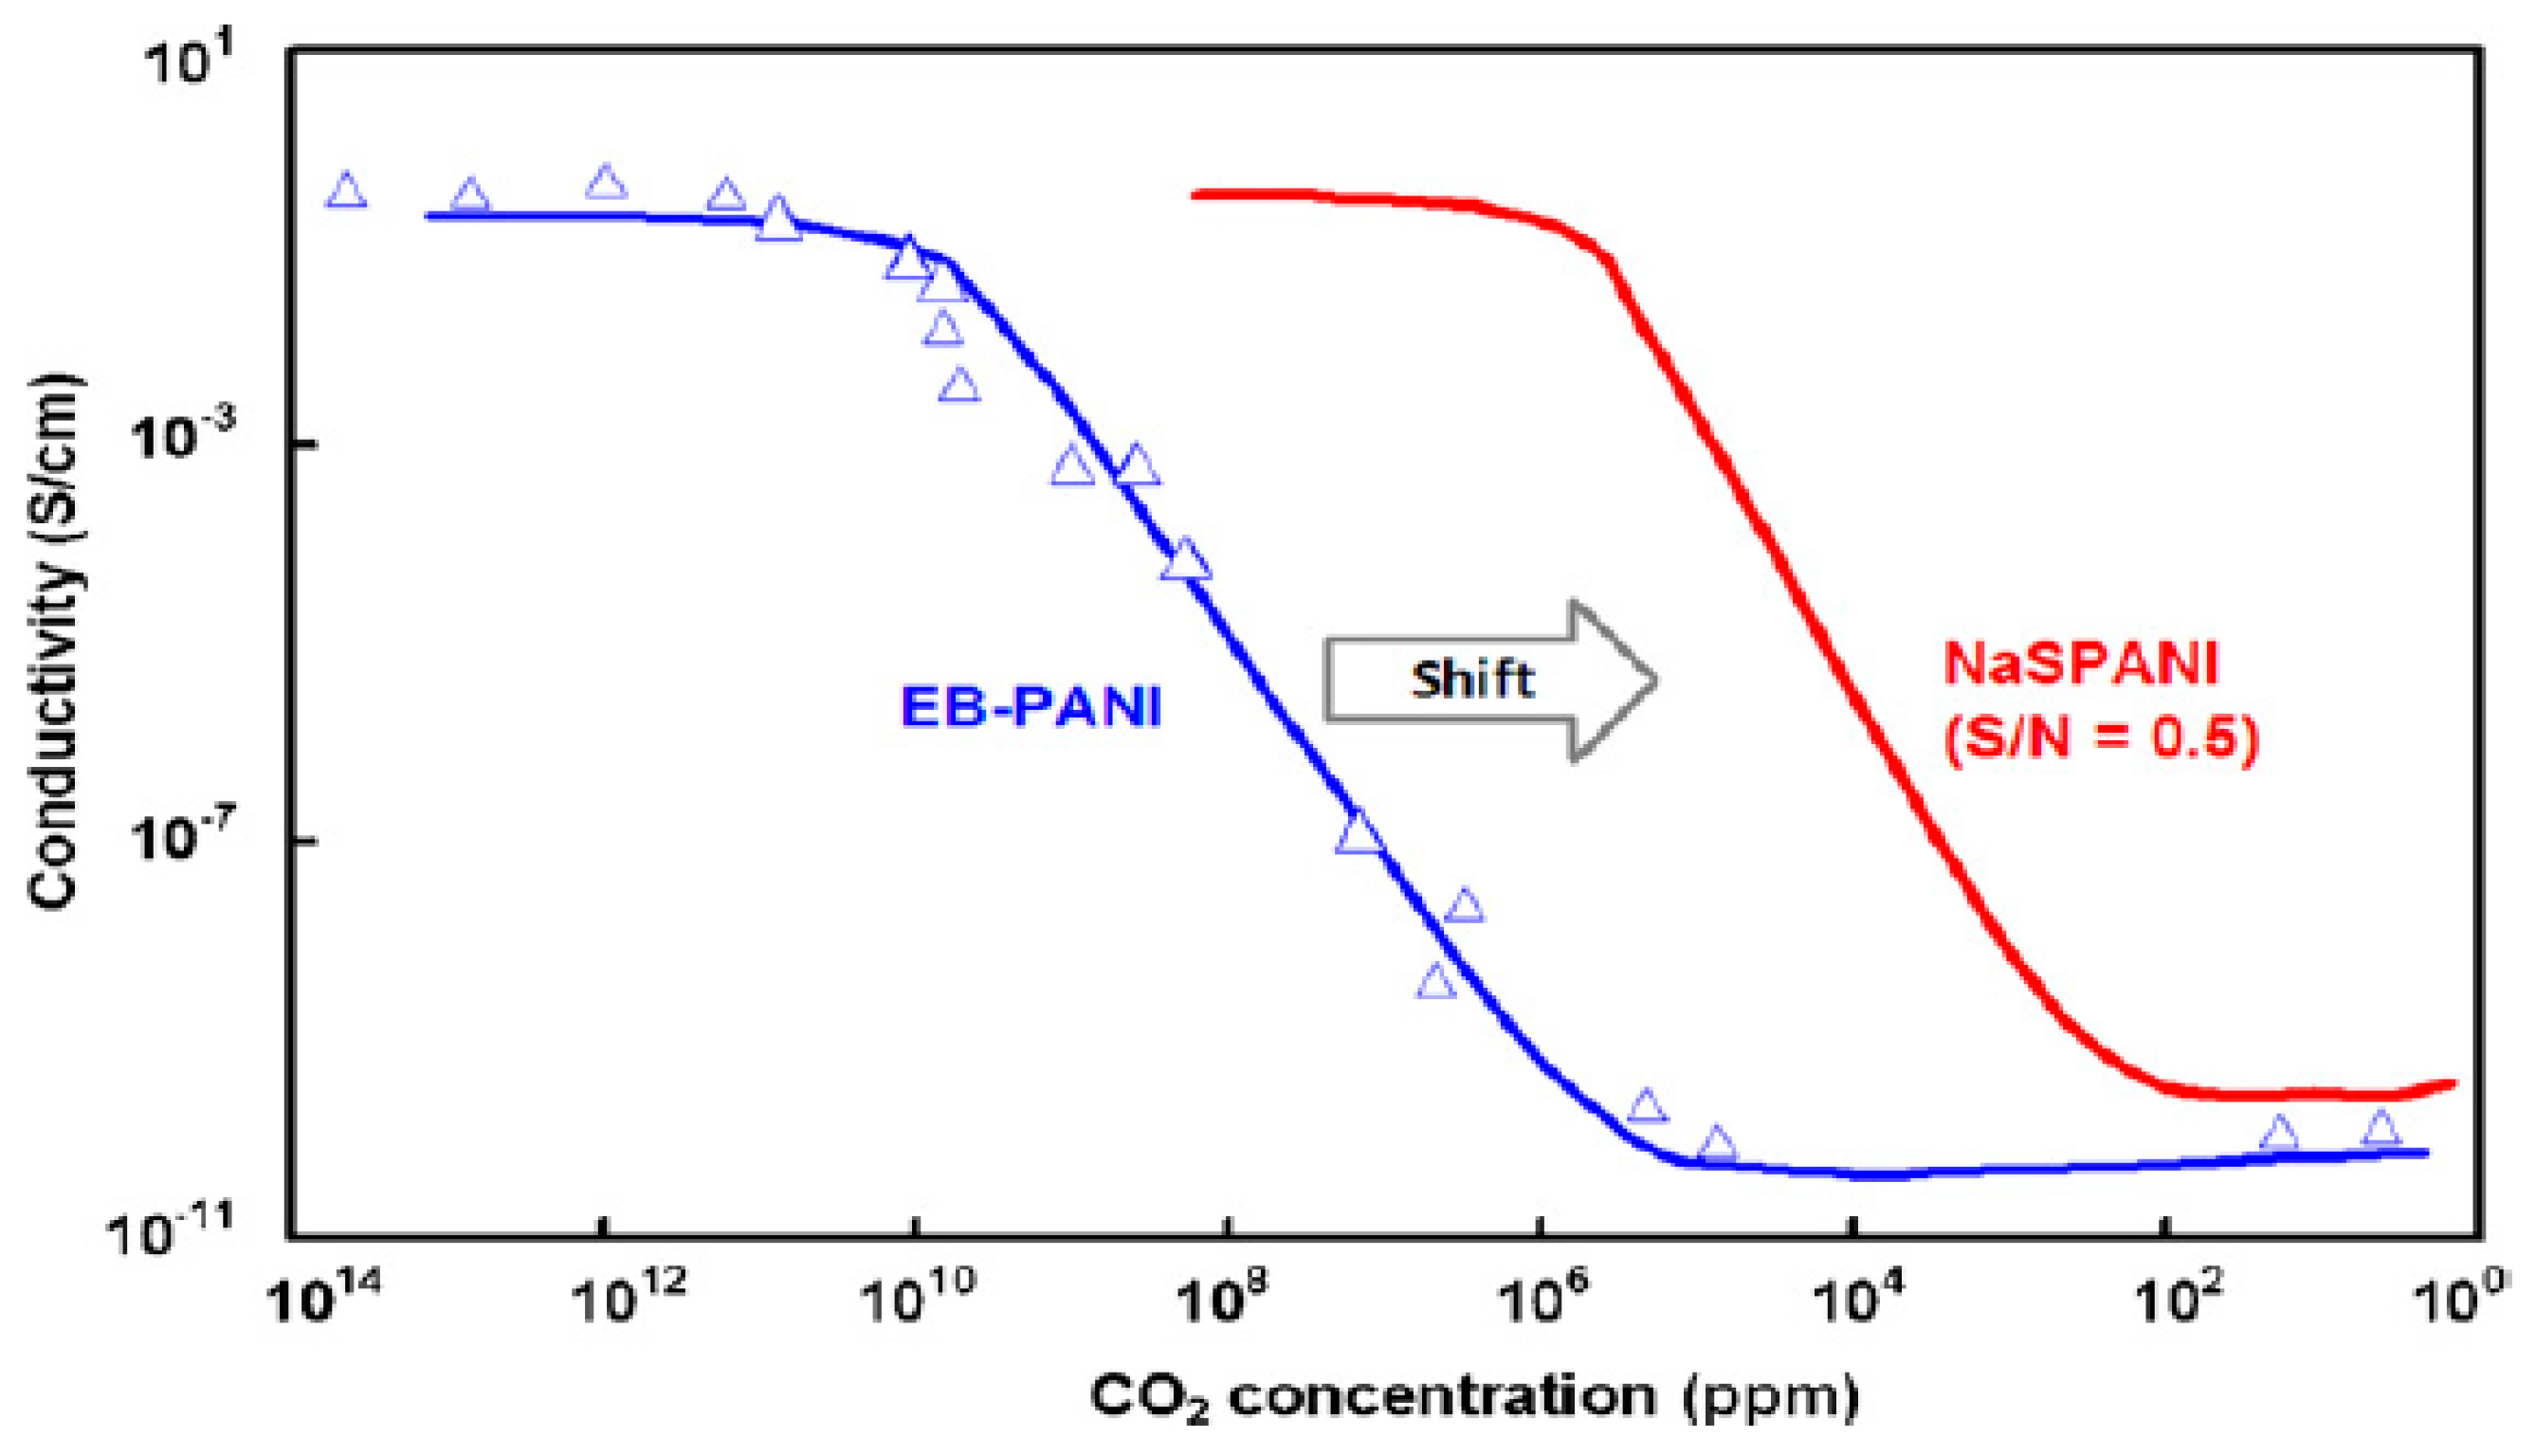
Figure 8.
Red points indicate measured data, and blue indicate simulated data. Reproduced with permission from Reference [23]. NDIR: non-dispersive infrared technology.
Figure 8.
Red points indicate measured data, and blue indicate simulated data. Reproduced with permission from Reference [23]. NDIR: non-dispersive infrared technology.
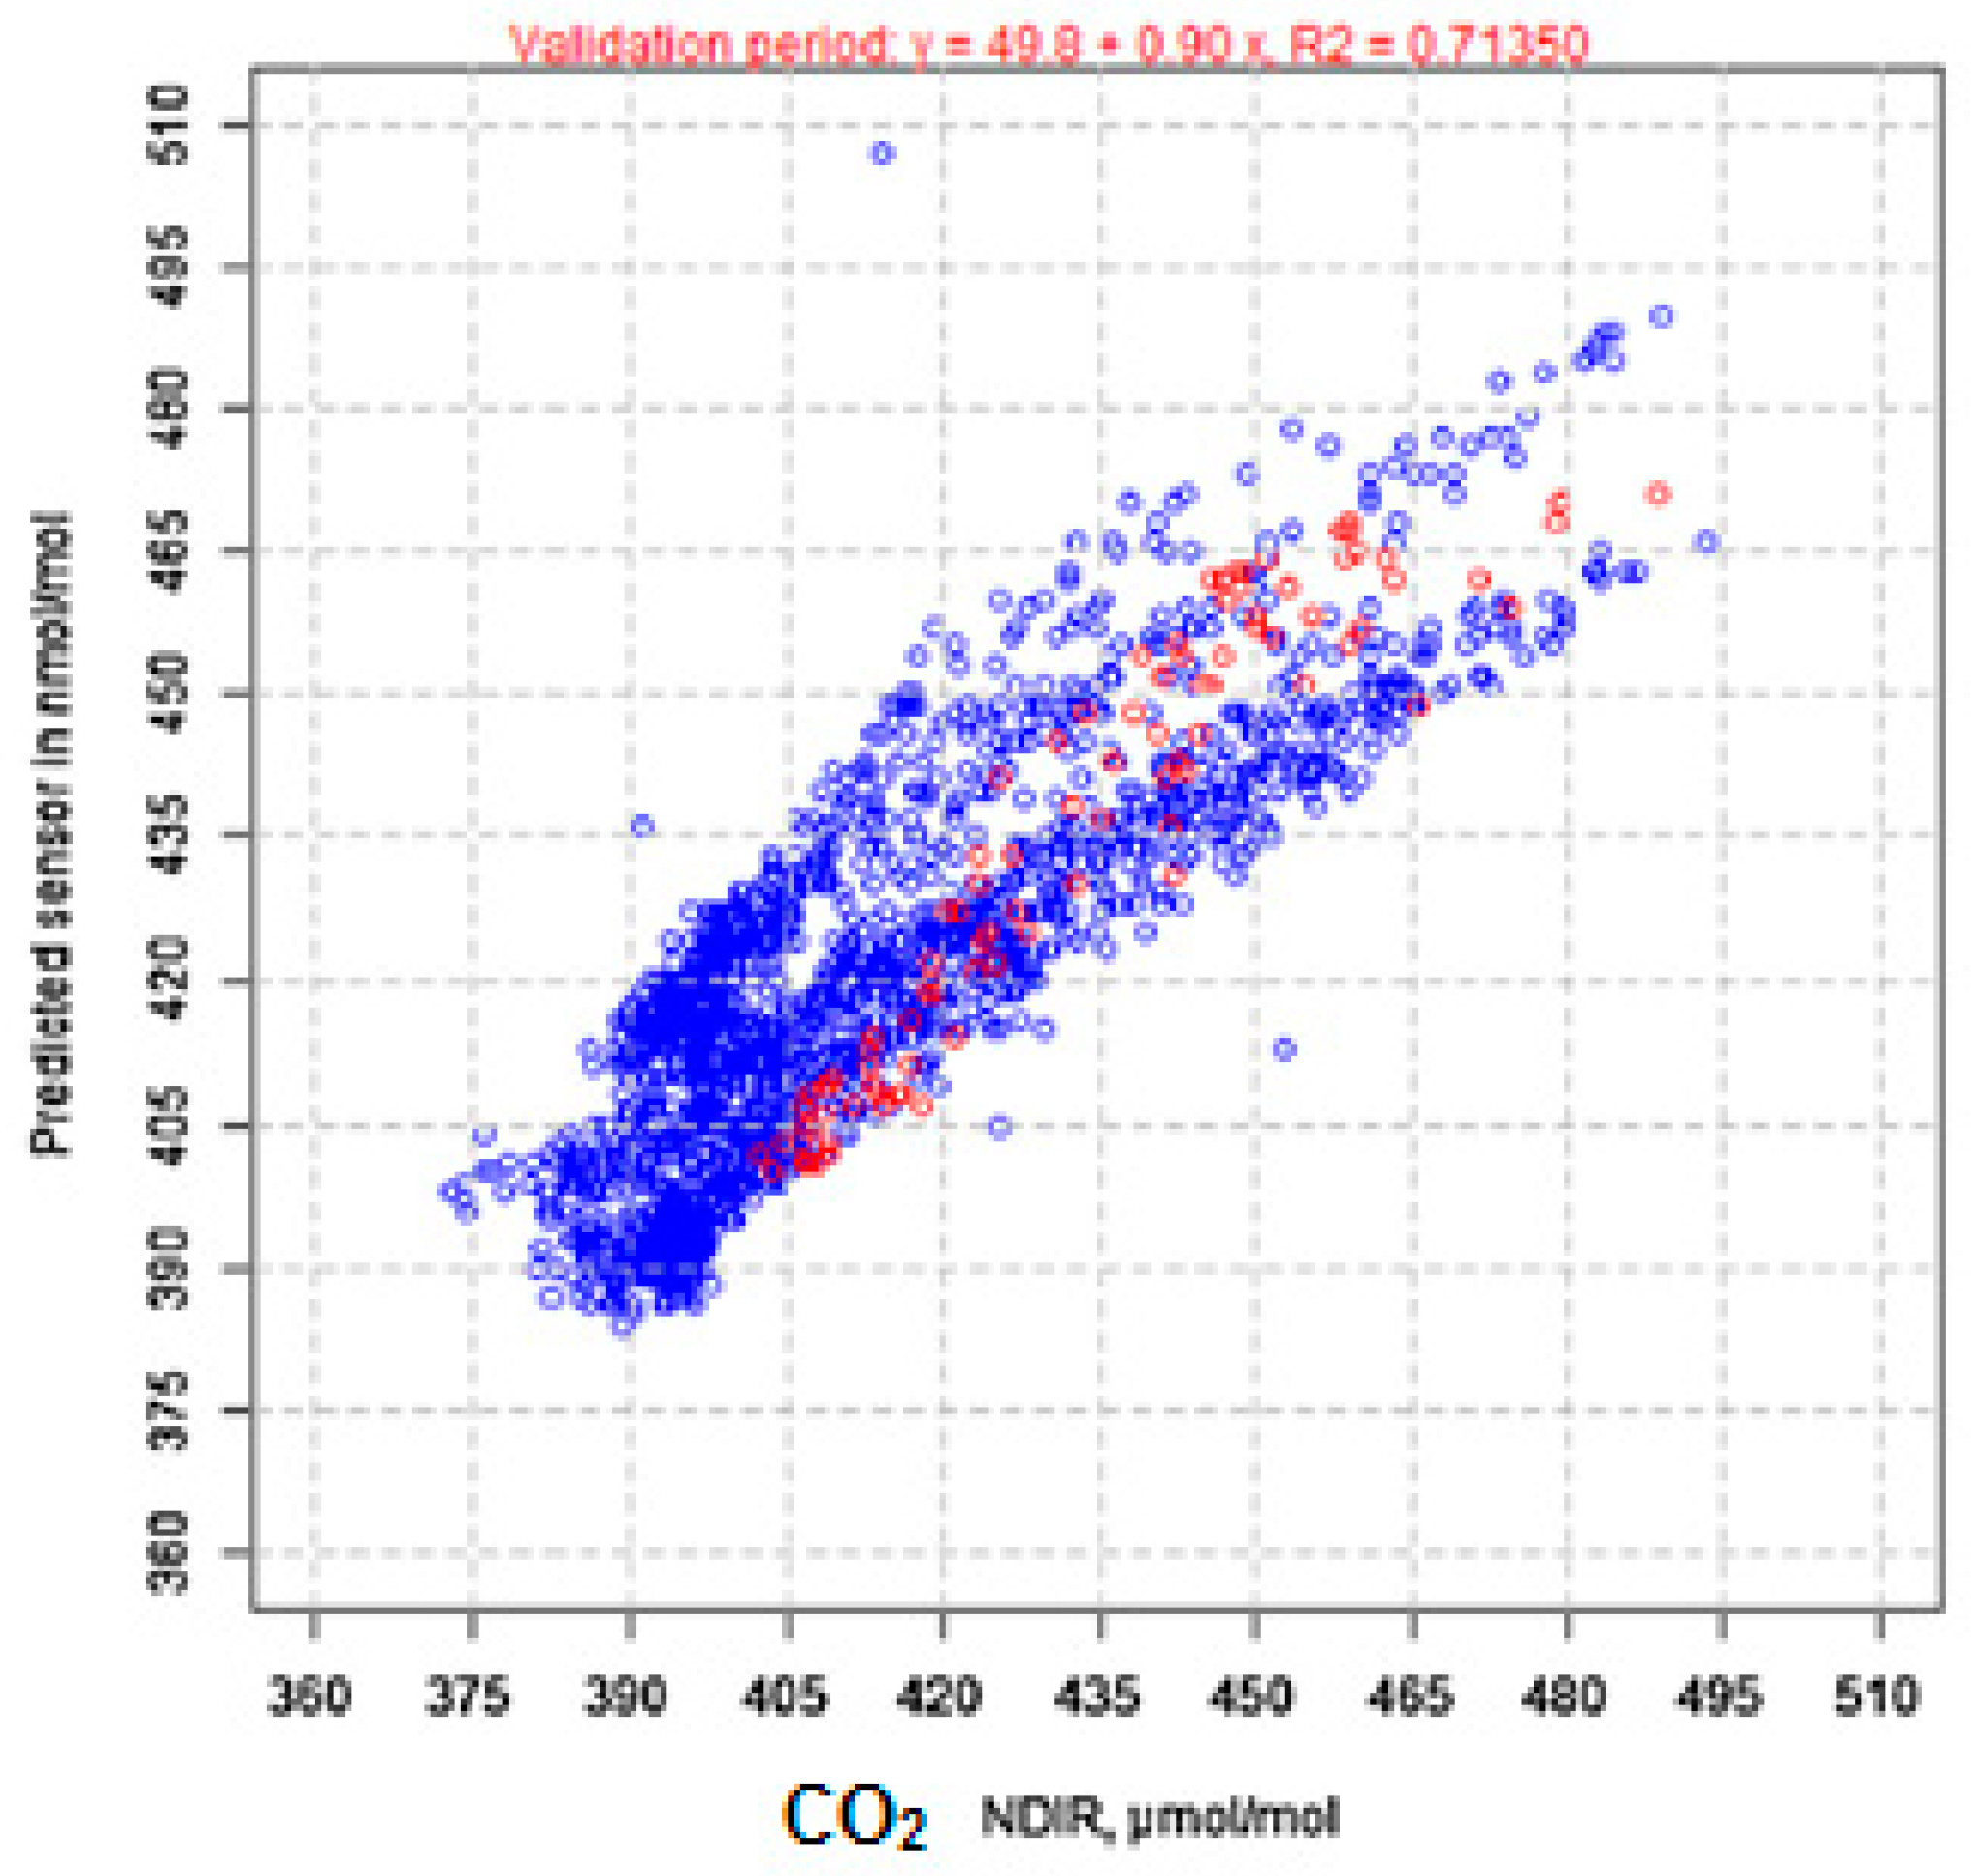
Figure 9.
Sensing mechanism for carbon dioxide molecule. Reproduced with permission from Reference [13]. CNT: carbon nanotube.
Figure 9.
Sensing mechanism for carbon dioxide molecule. Reproduced with permission from Reference [13]. CNT: carbon nanotube.
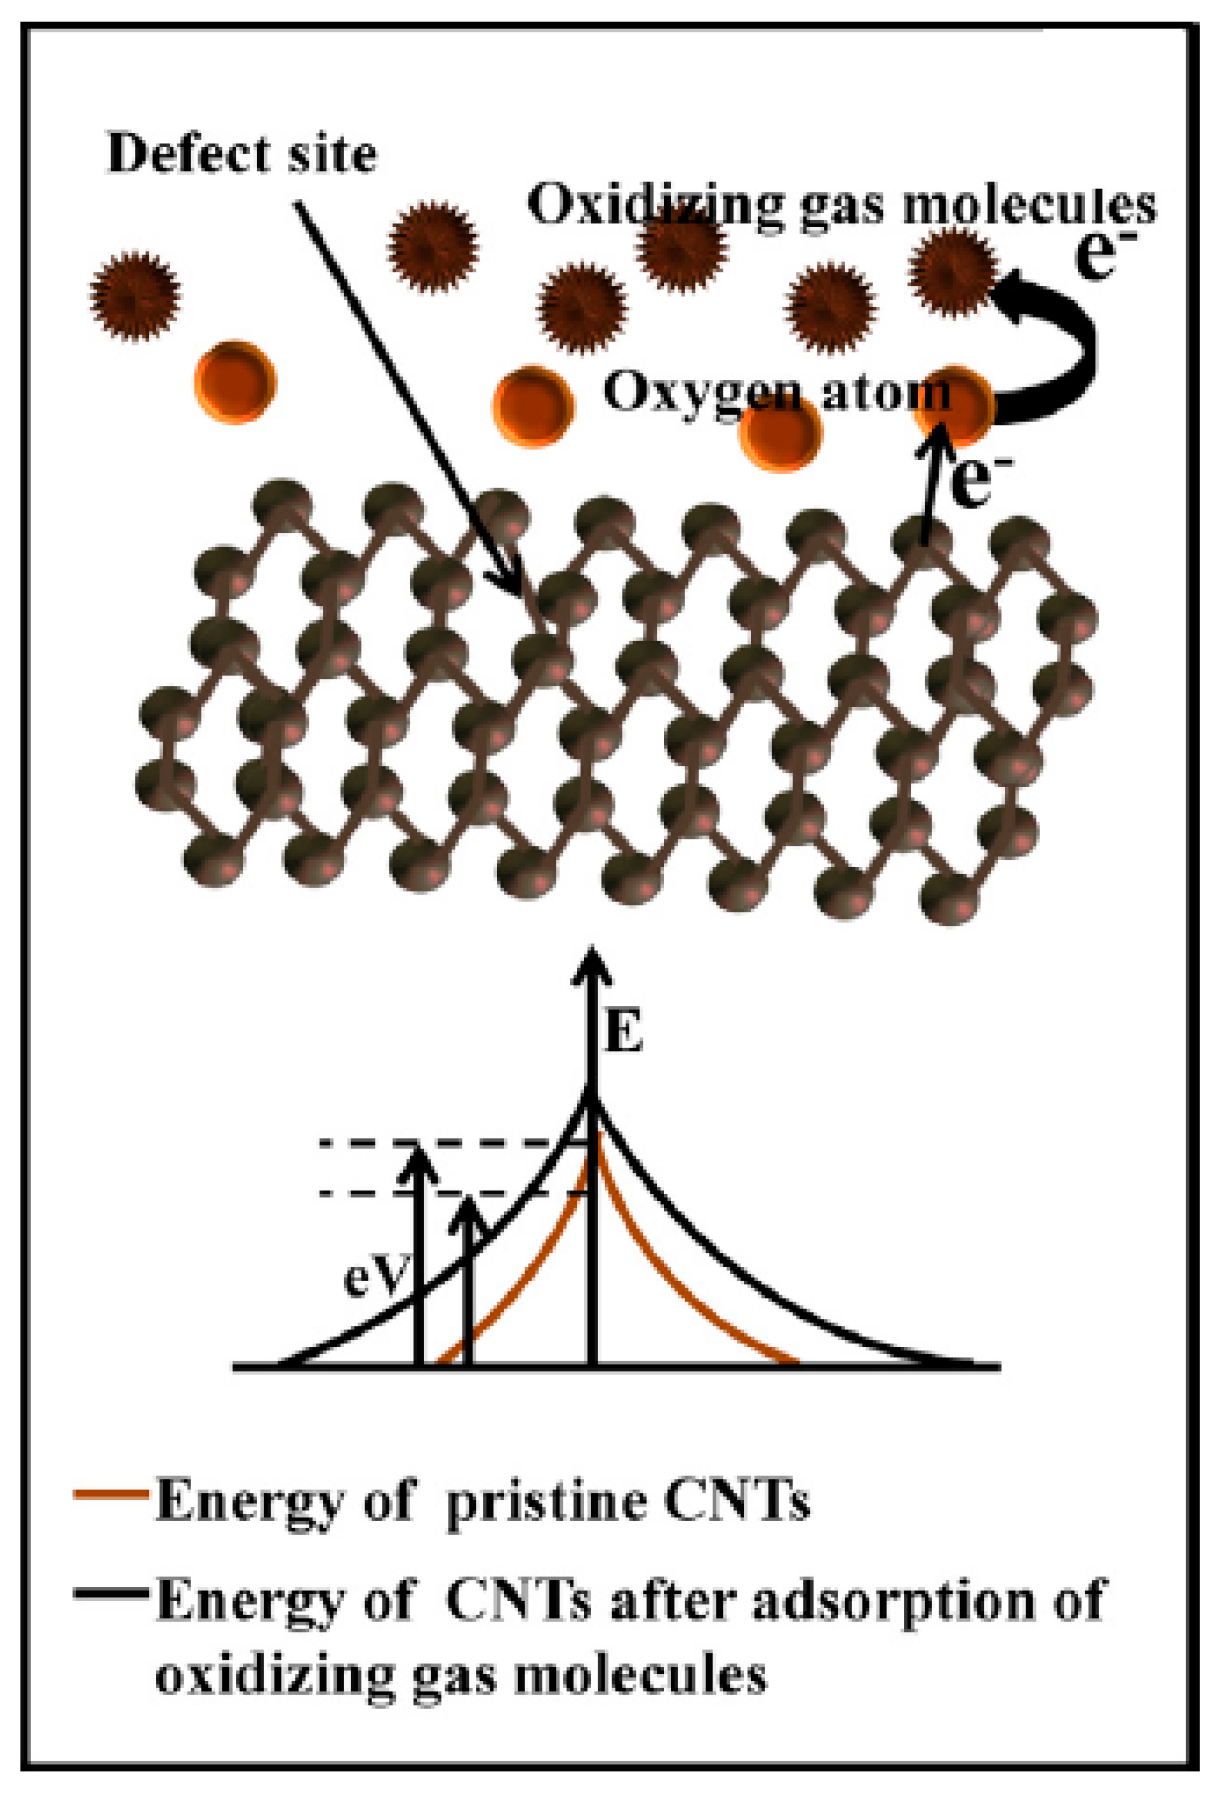
Figure 10.
Field effect transistor using carbon nanotubes (NTFET) sensor fabricated for carbon dioxide. Reproduced with permission from Reference [28].
Figure 10.
Field effect transistor using carbon nanotubes (NTFET) sensor fabricated for carbon dioxide. Reproduced with permission from Reference [28].
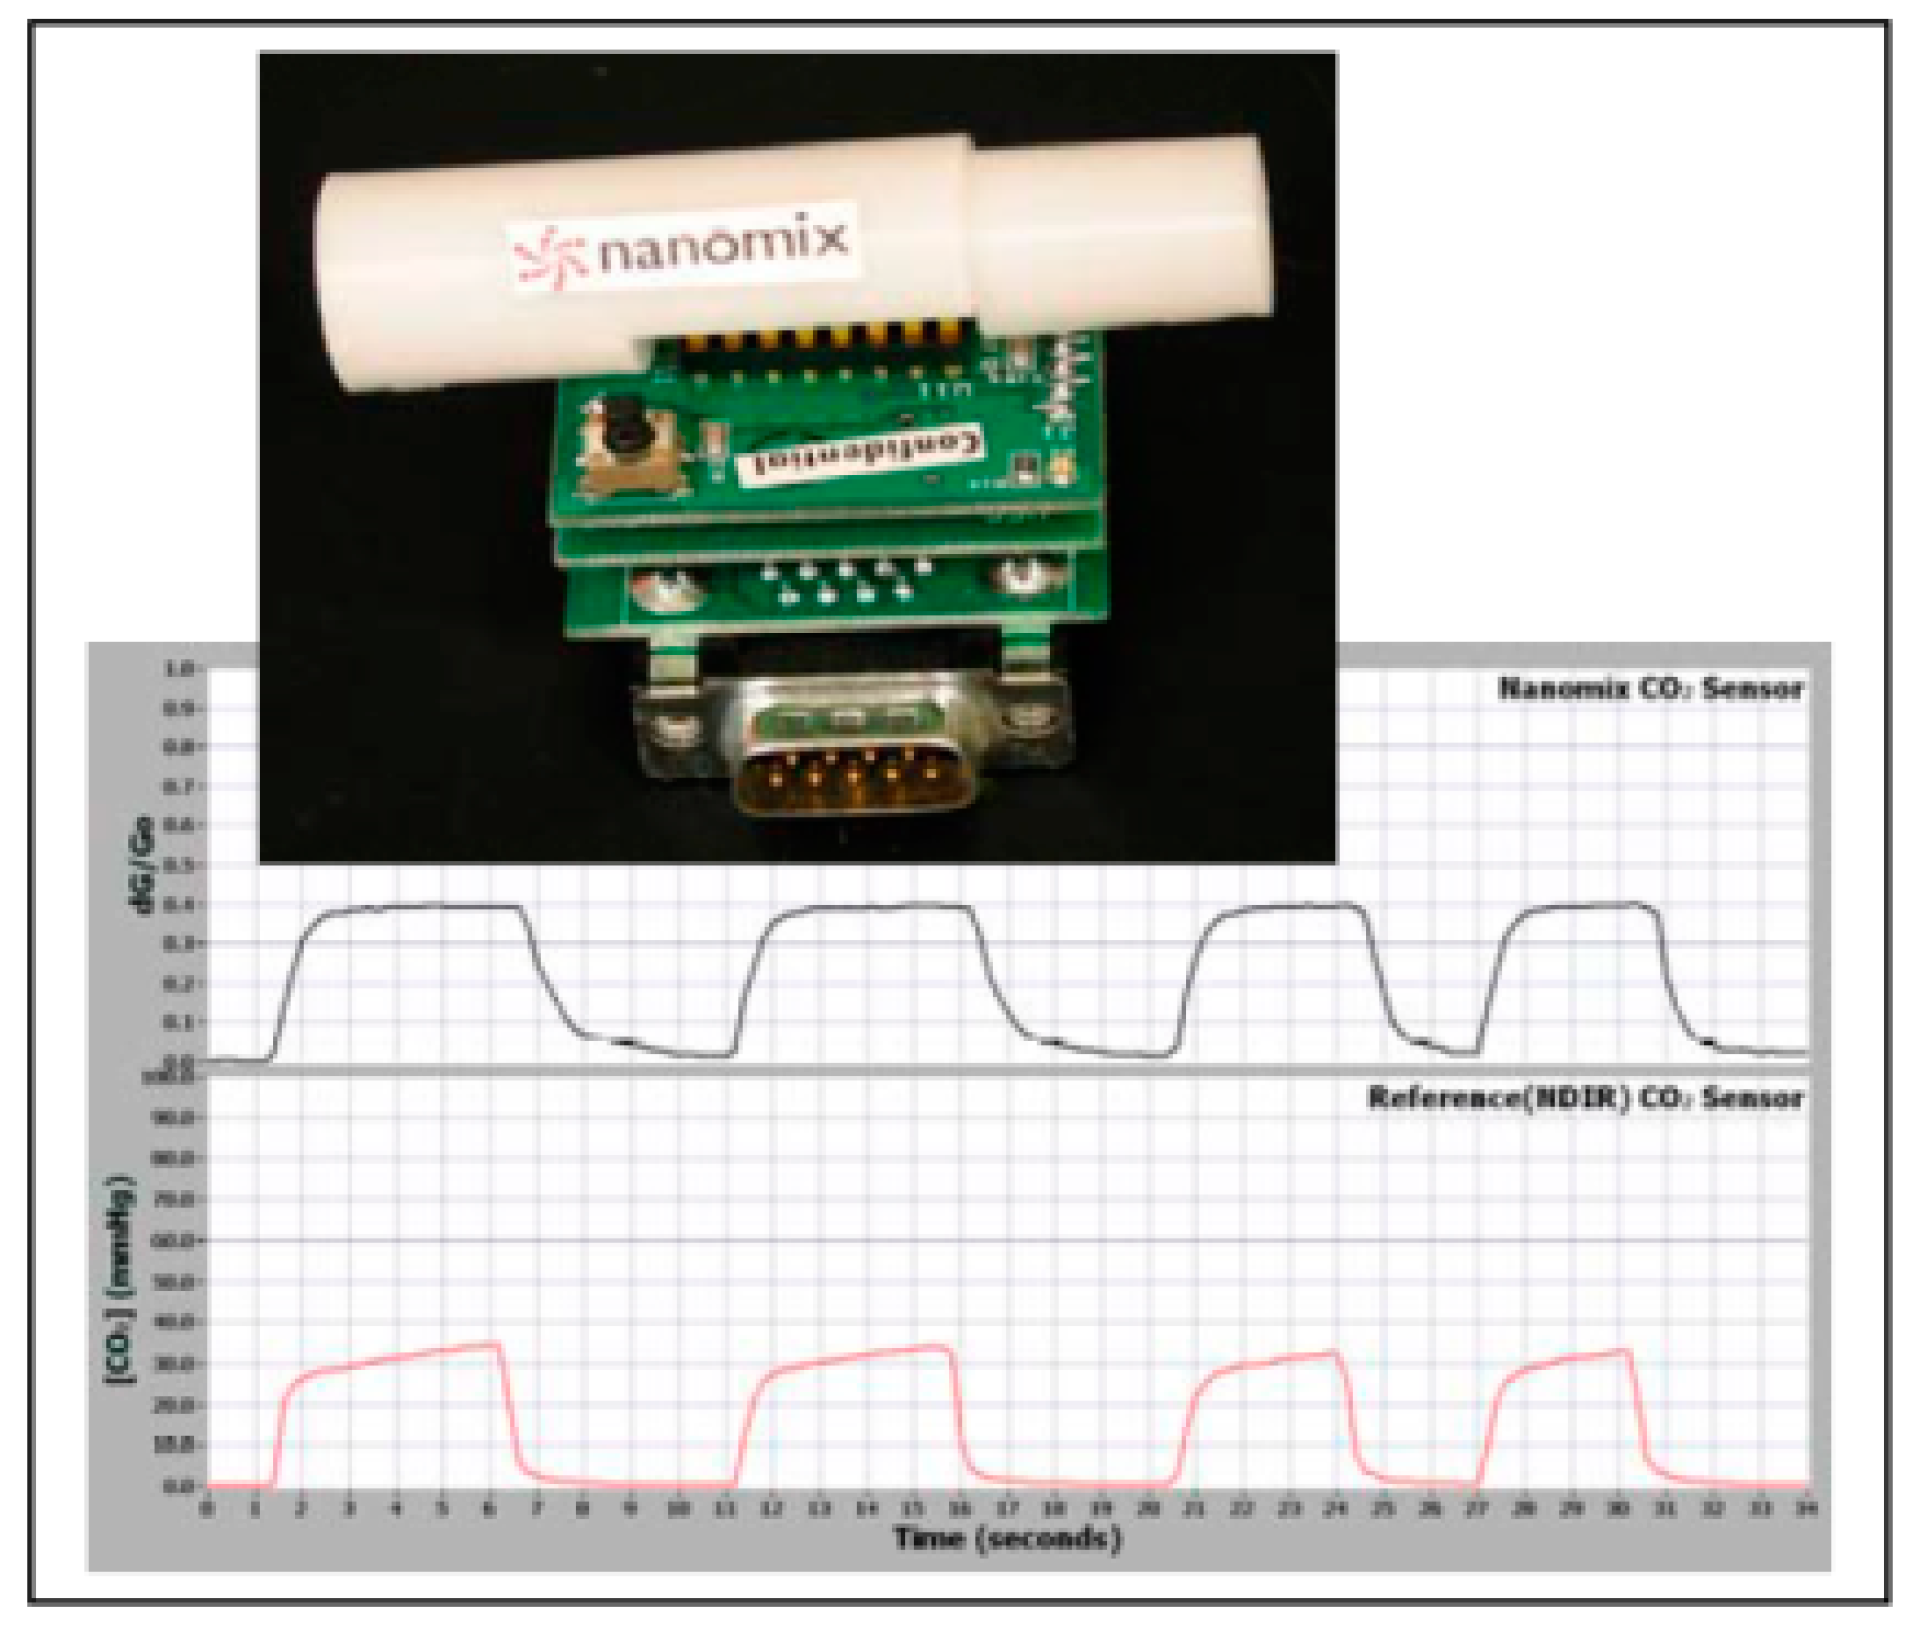
Figure 11.
(A) Functional test board (FTB) loaded with eight packaged die containing functionalized NTFET devices. (B) Mockup capnography device. Reproduced with permission from reference [28].
Figure 11.
(A) Functional test board (FTB) loaded with eight packaged die containing functionalized NTFET devices. (B) Mockup capnography device. Reproduced with permission from reference [28].

Figure 12.
The temperature of sensor operation in relative scale. Reproduced with permission from Reference [48].
Figure 12.
The temperature of sensor operation in relative scale. Reproduced with permission from Reference [48].

Figure 13.
The structure of Teflon AF2400.
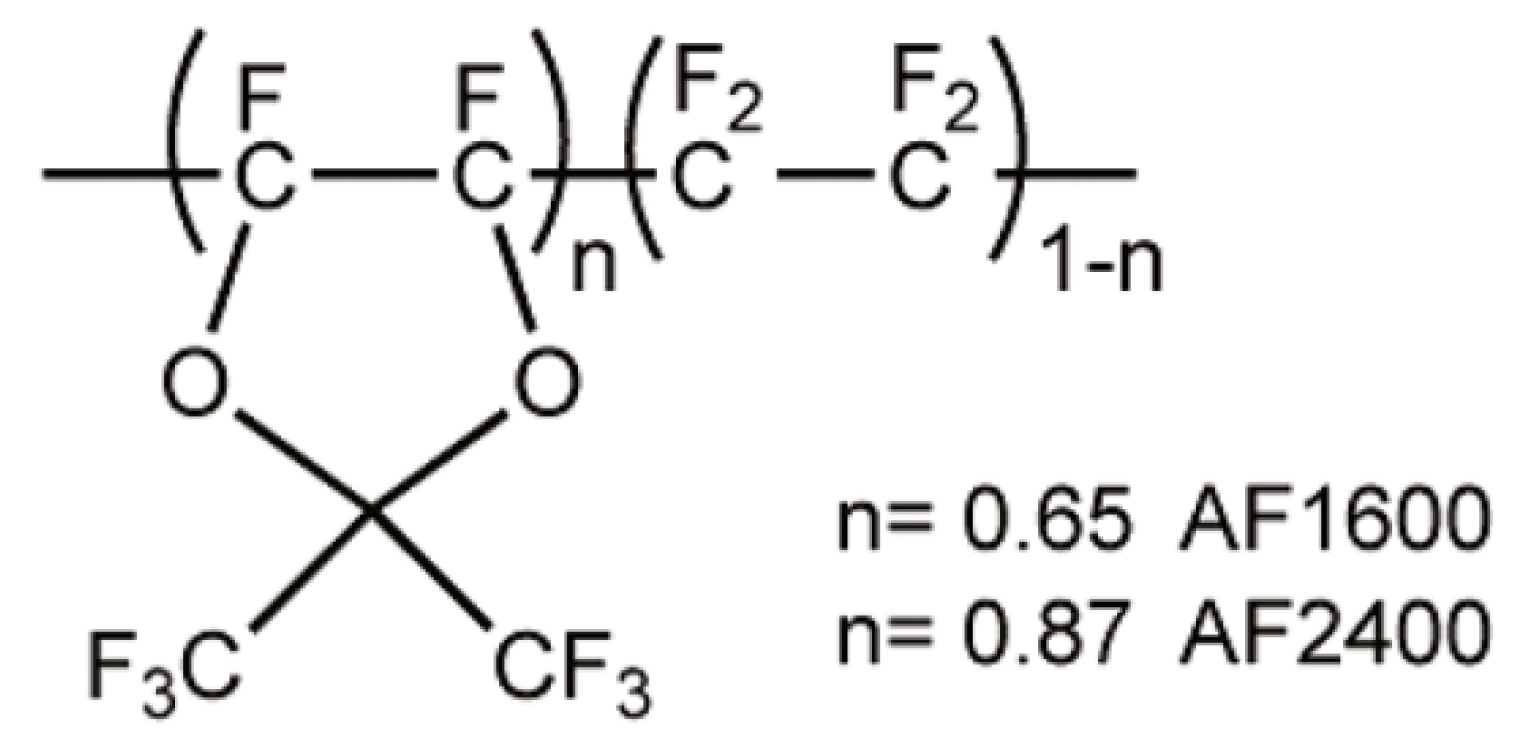
Figure 14.
Phase shift observed as a function of carbon dioxide concentration at different water levels (RH: relative humidity). Reproduced with permission from Reference [48].
Figure 14.
Phase shift observed as a function of carbon dioxide concentration at different water levels (RH: relative humidity). Reproduced with permission from Reference [48].
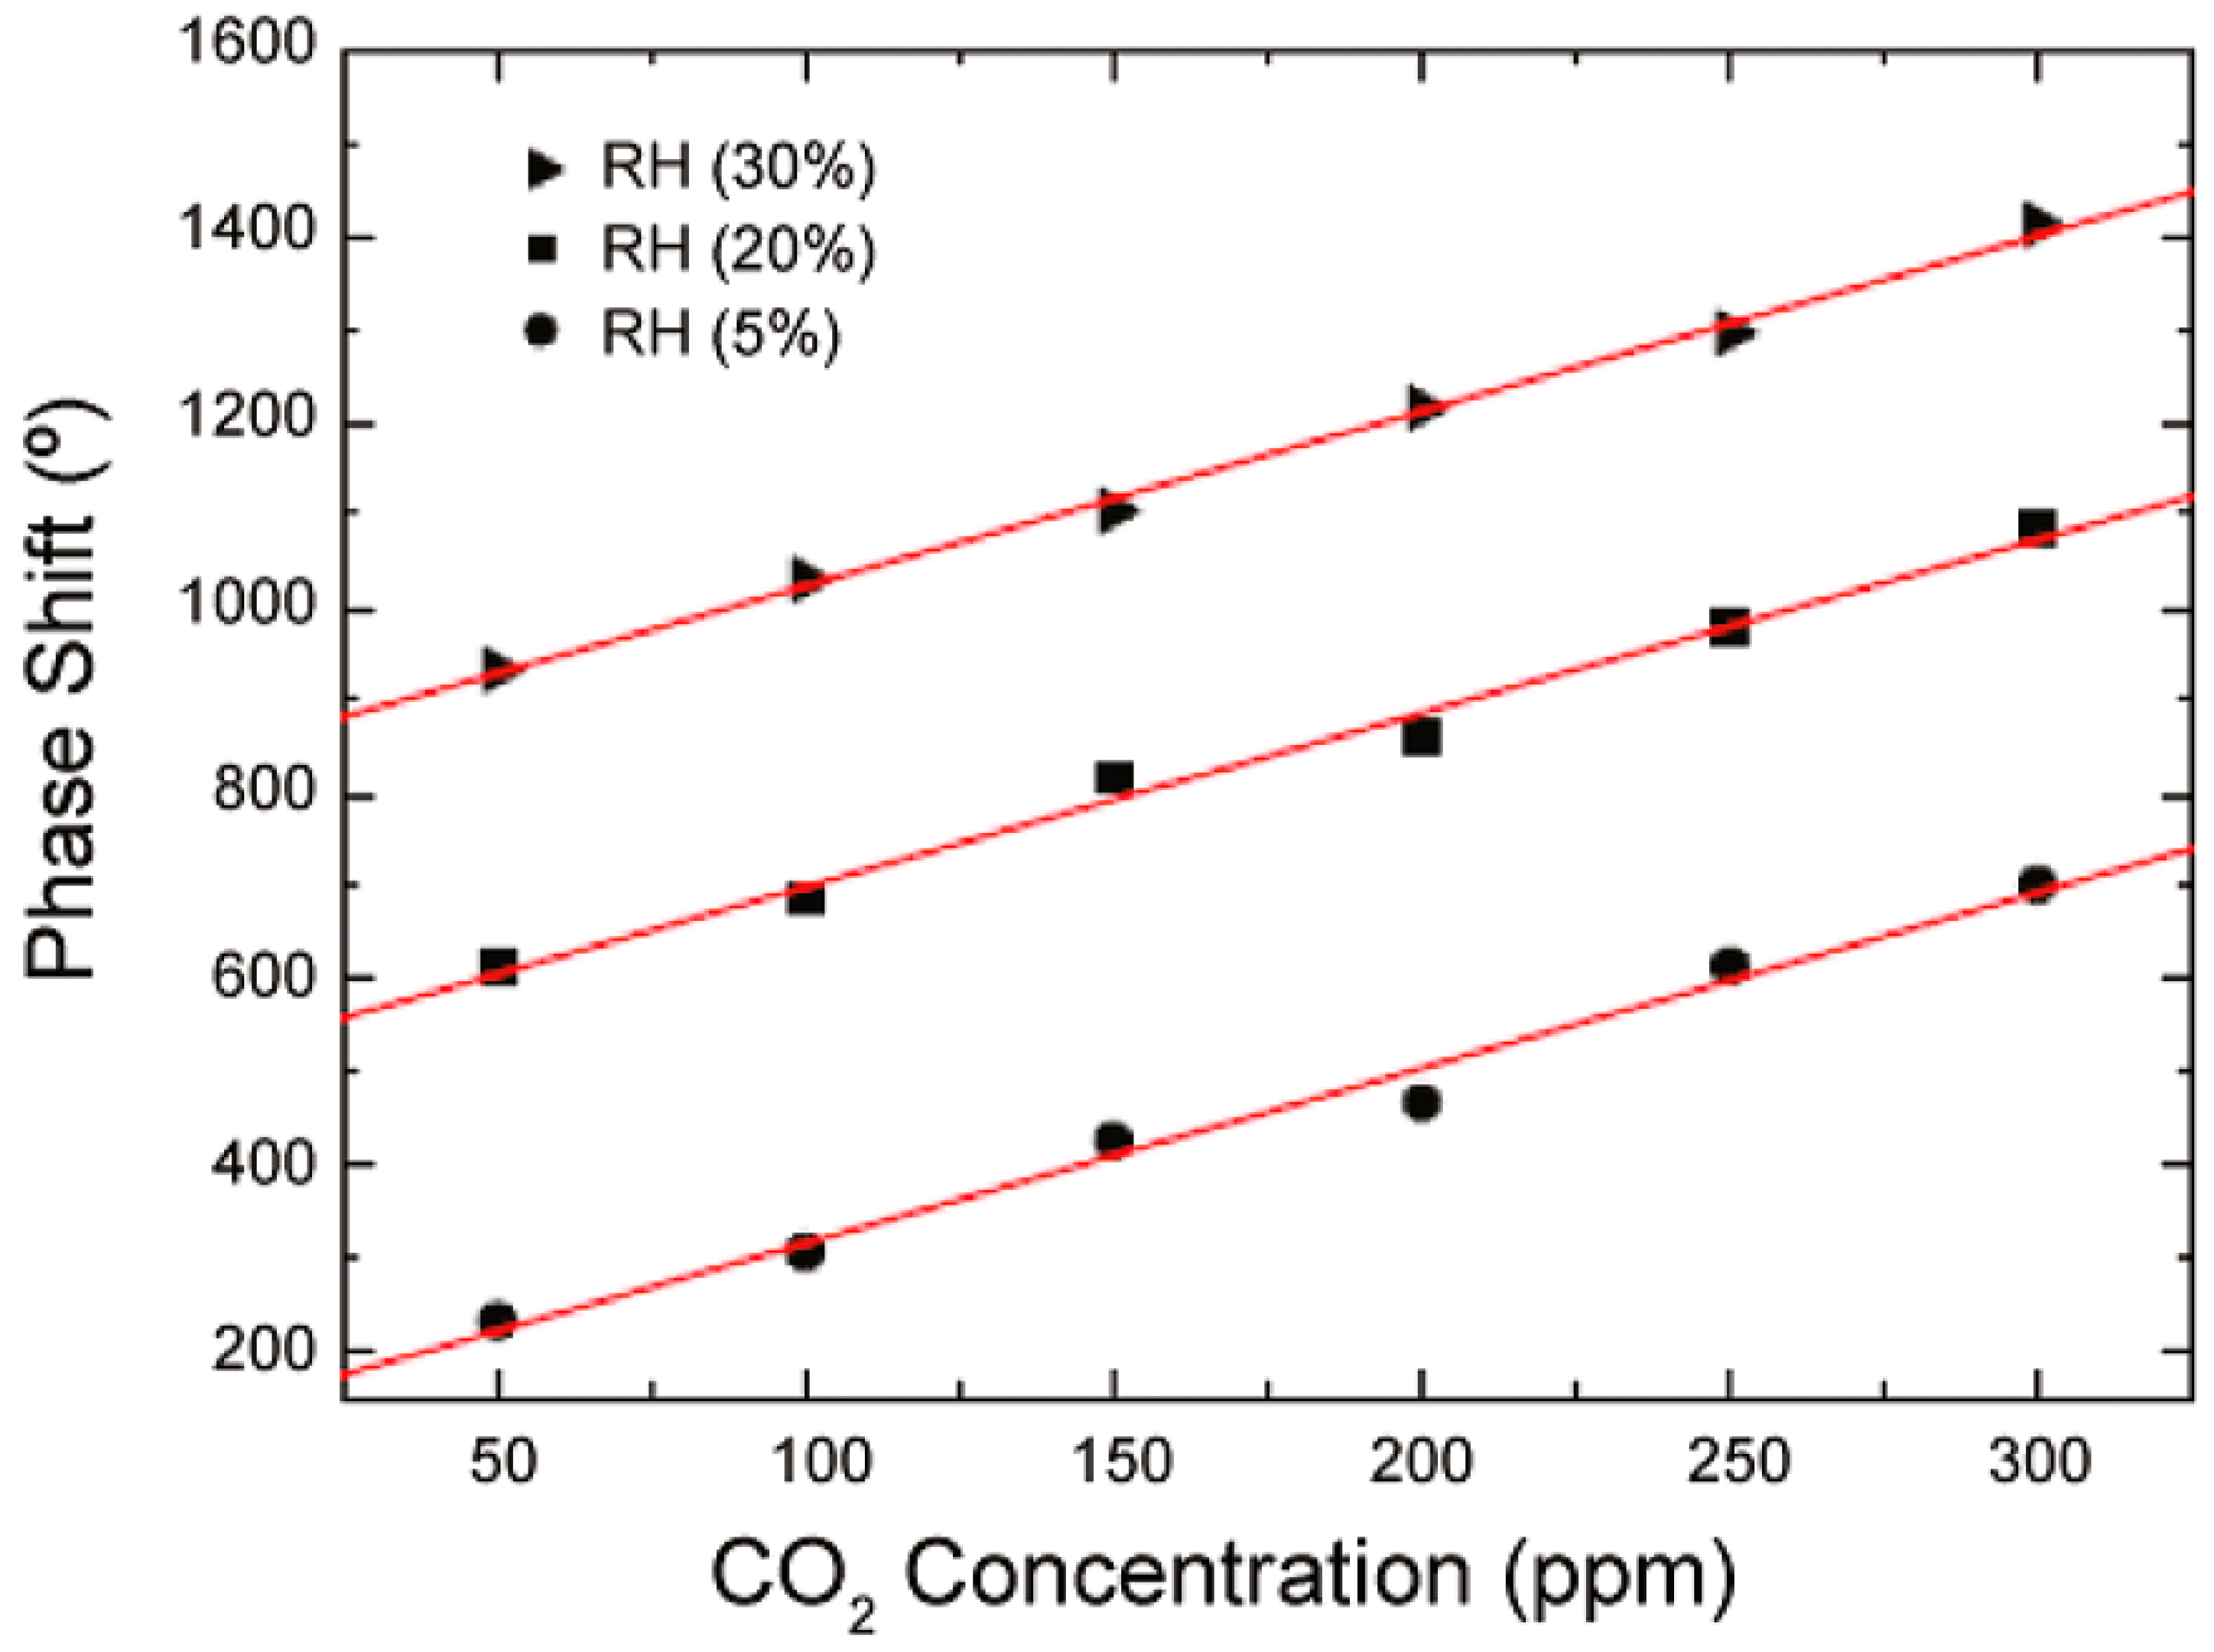
Figure 15.
Carbon dioxide sensor using a wireless transducer constructed with multiwalled carbon nanotube (MWCNT)-SiO2 film. Reproduced with permission from Reference [10].
Figure 15.
Carbon dioxide sensor using a wireless transducer constructed with multiwalled carbon nanotube (MWCNT)-SiO2 film. Reproduced with permission from Reference [10].
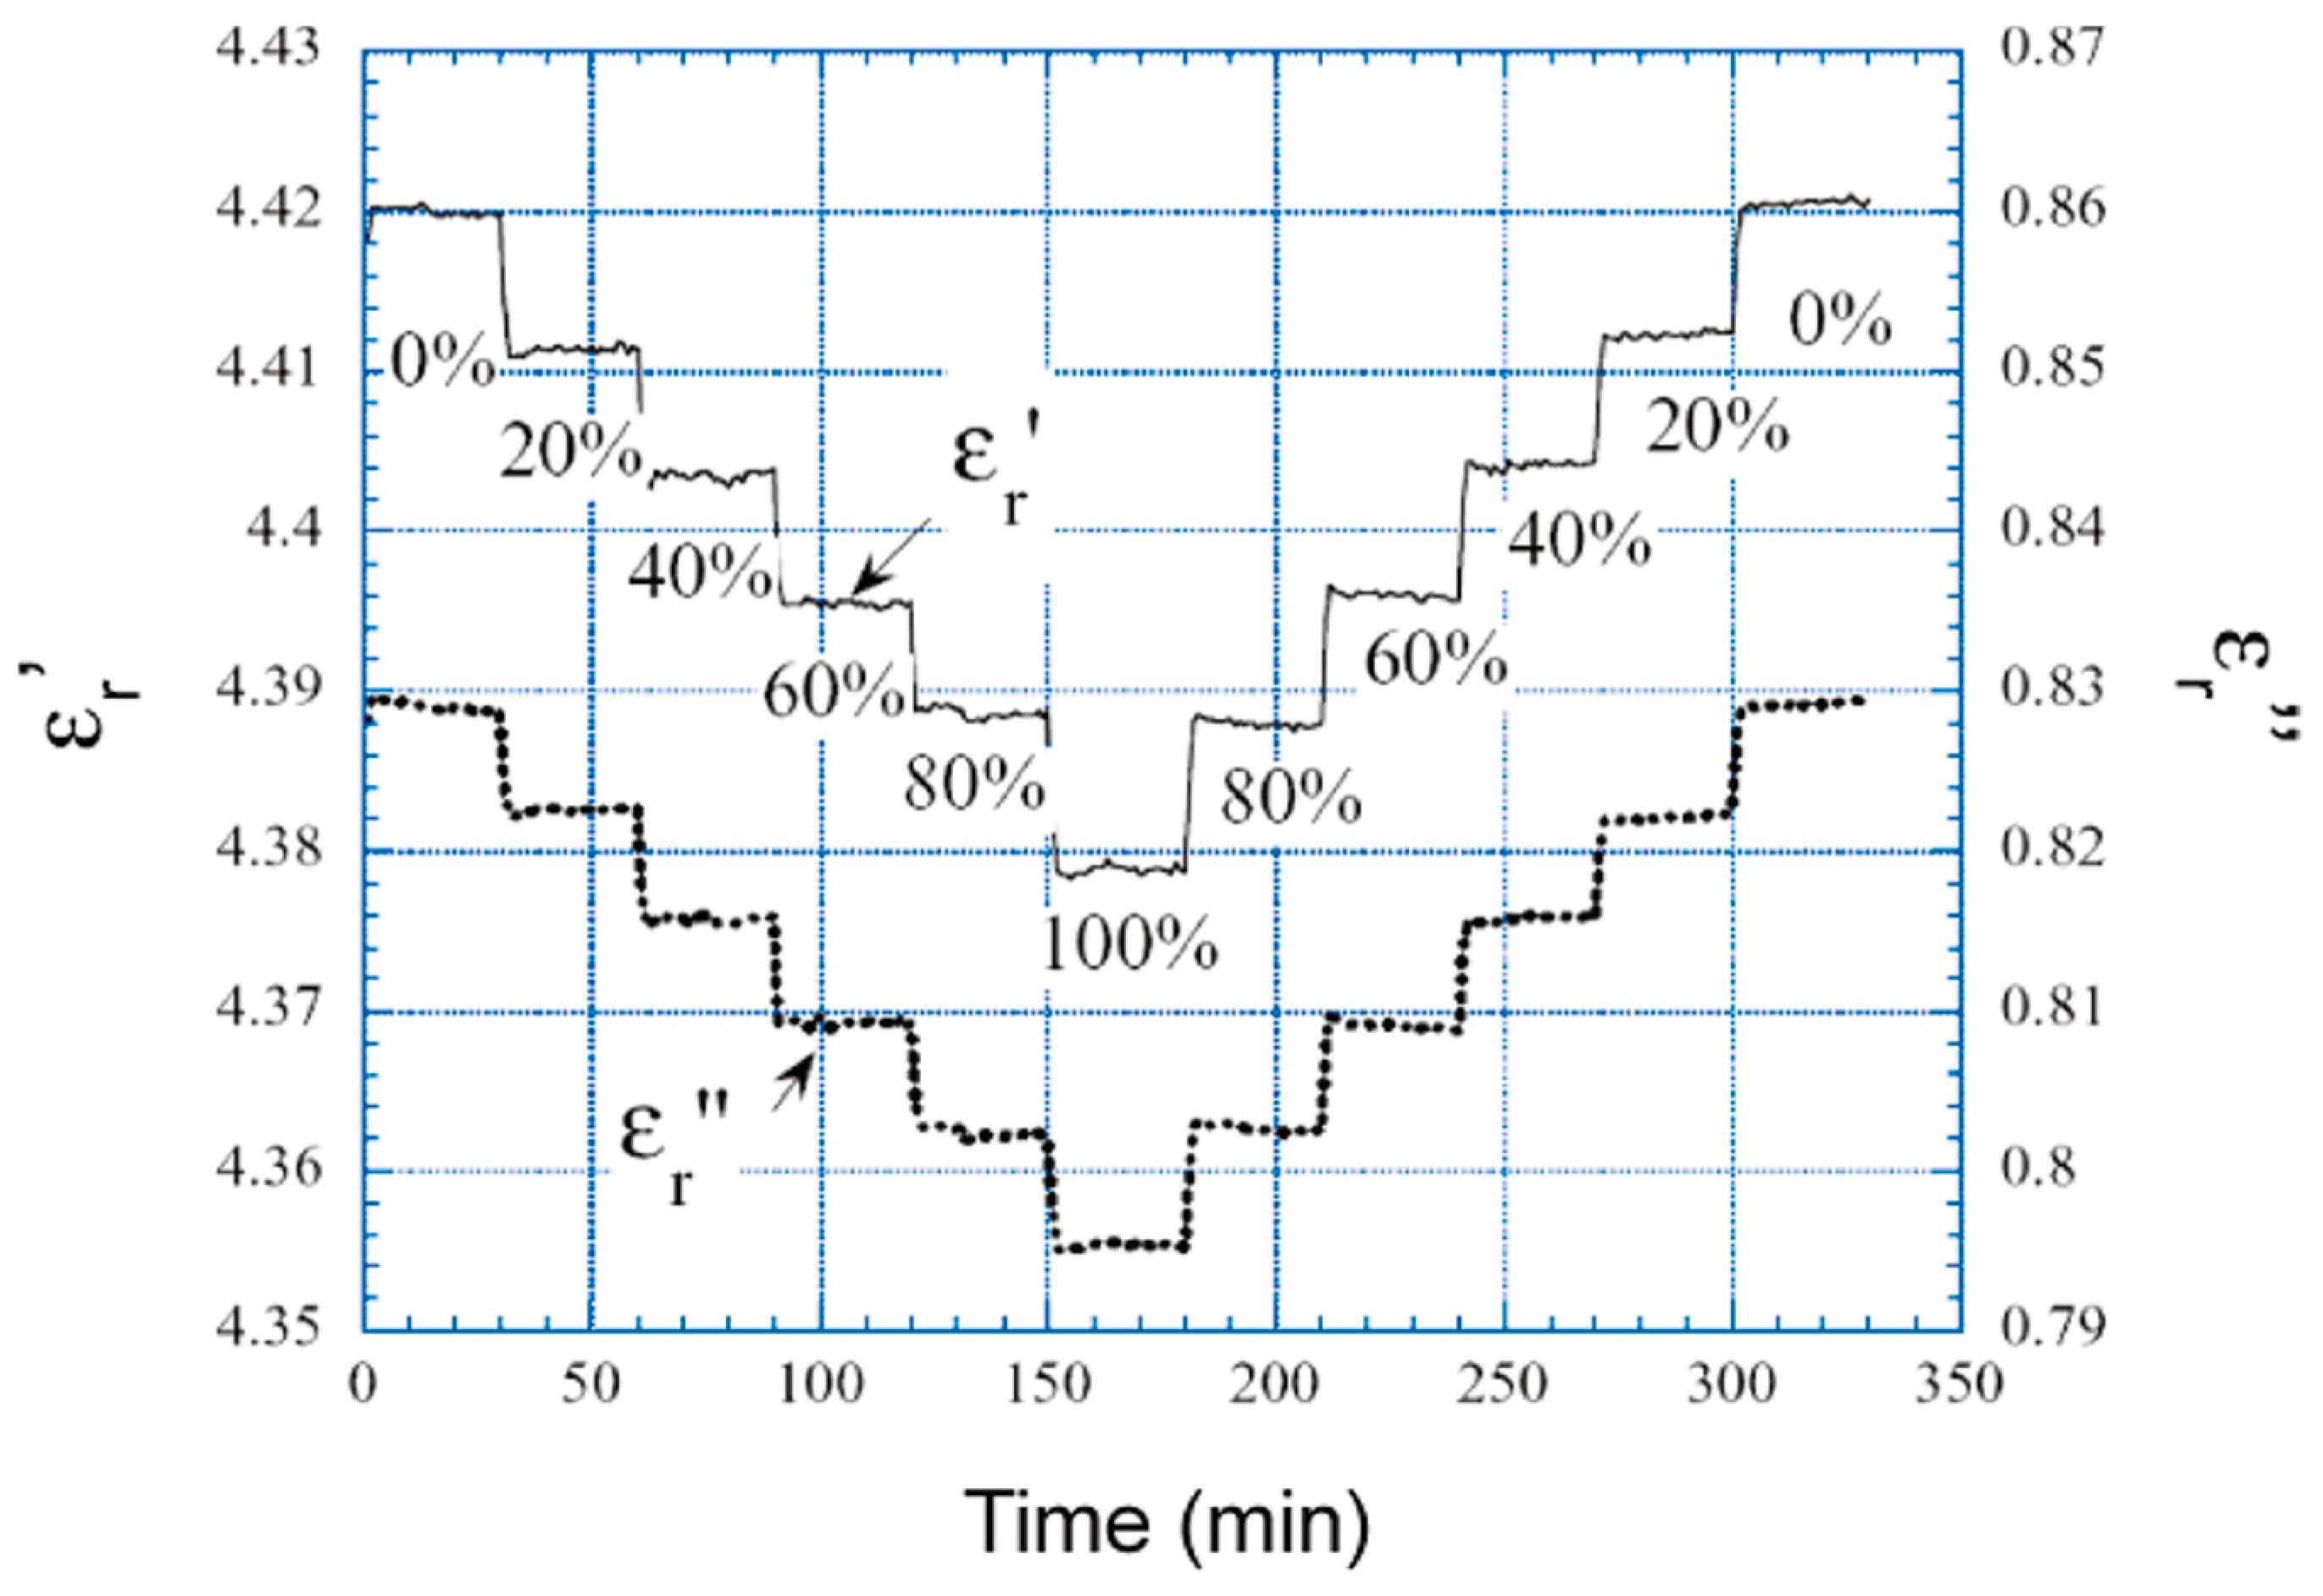
Figure 16.
(A) Dipole-dipole interaction mechanism. (B) Graphene resistive sensor. Reproduced with permission from reference [49]. rGO: reduced graphene oxide; GO: graphene oxide.
Figure 16.
(A) Dipole-dipole interaction mechanism. (B) Graphene resistive sensor. Reproduced with permission from reference [49]. rGO: reduced graphene oxide; GO: graphene oxide.
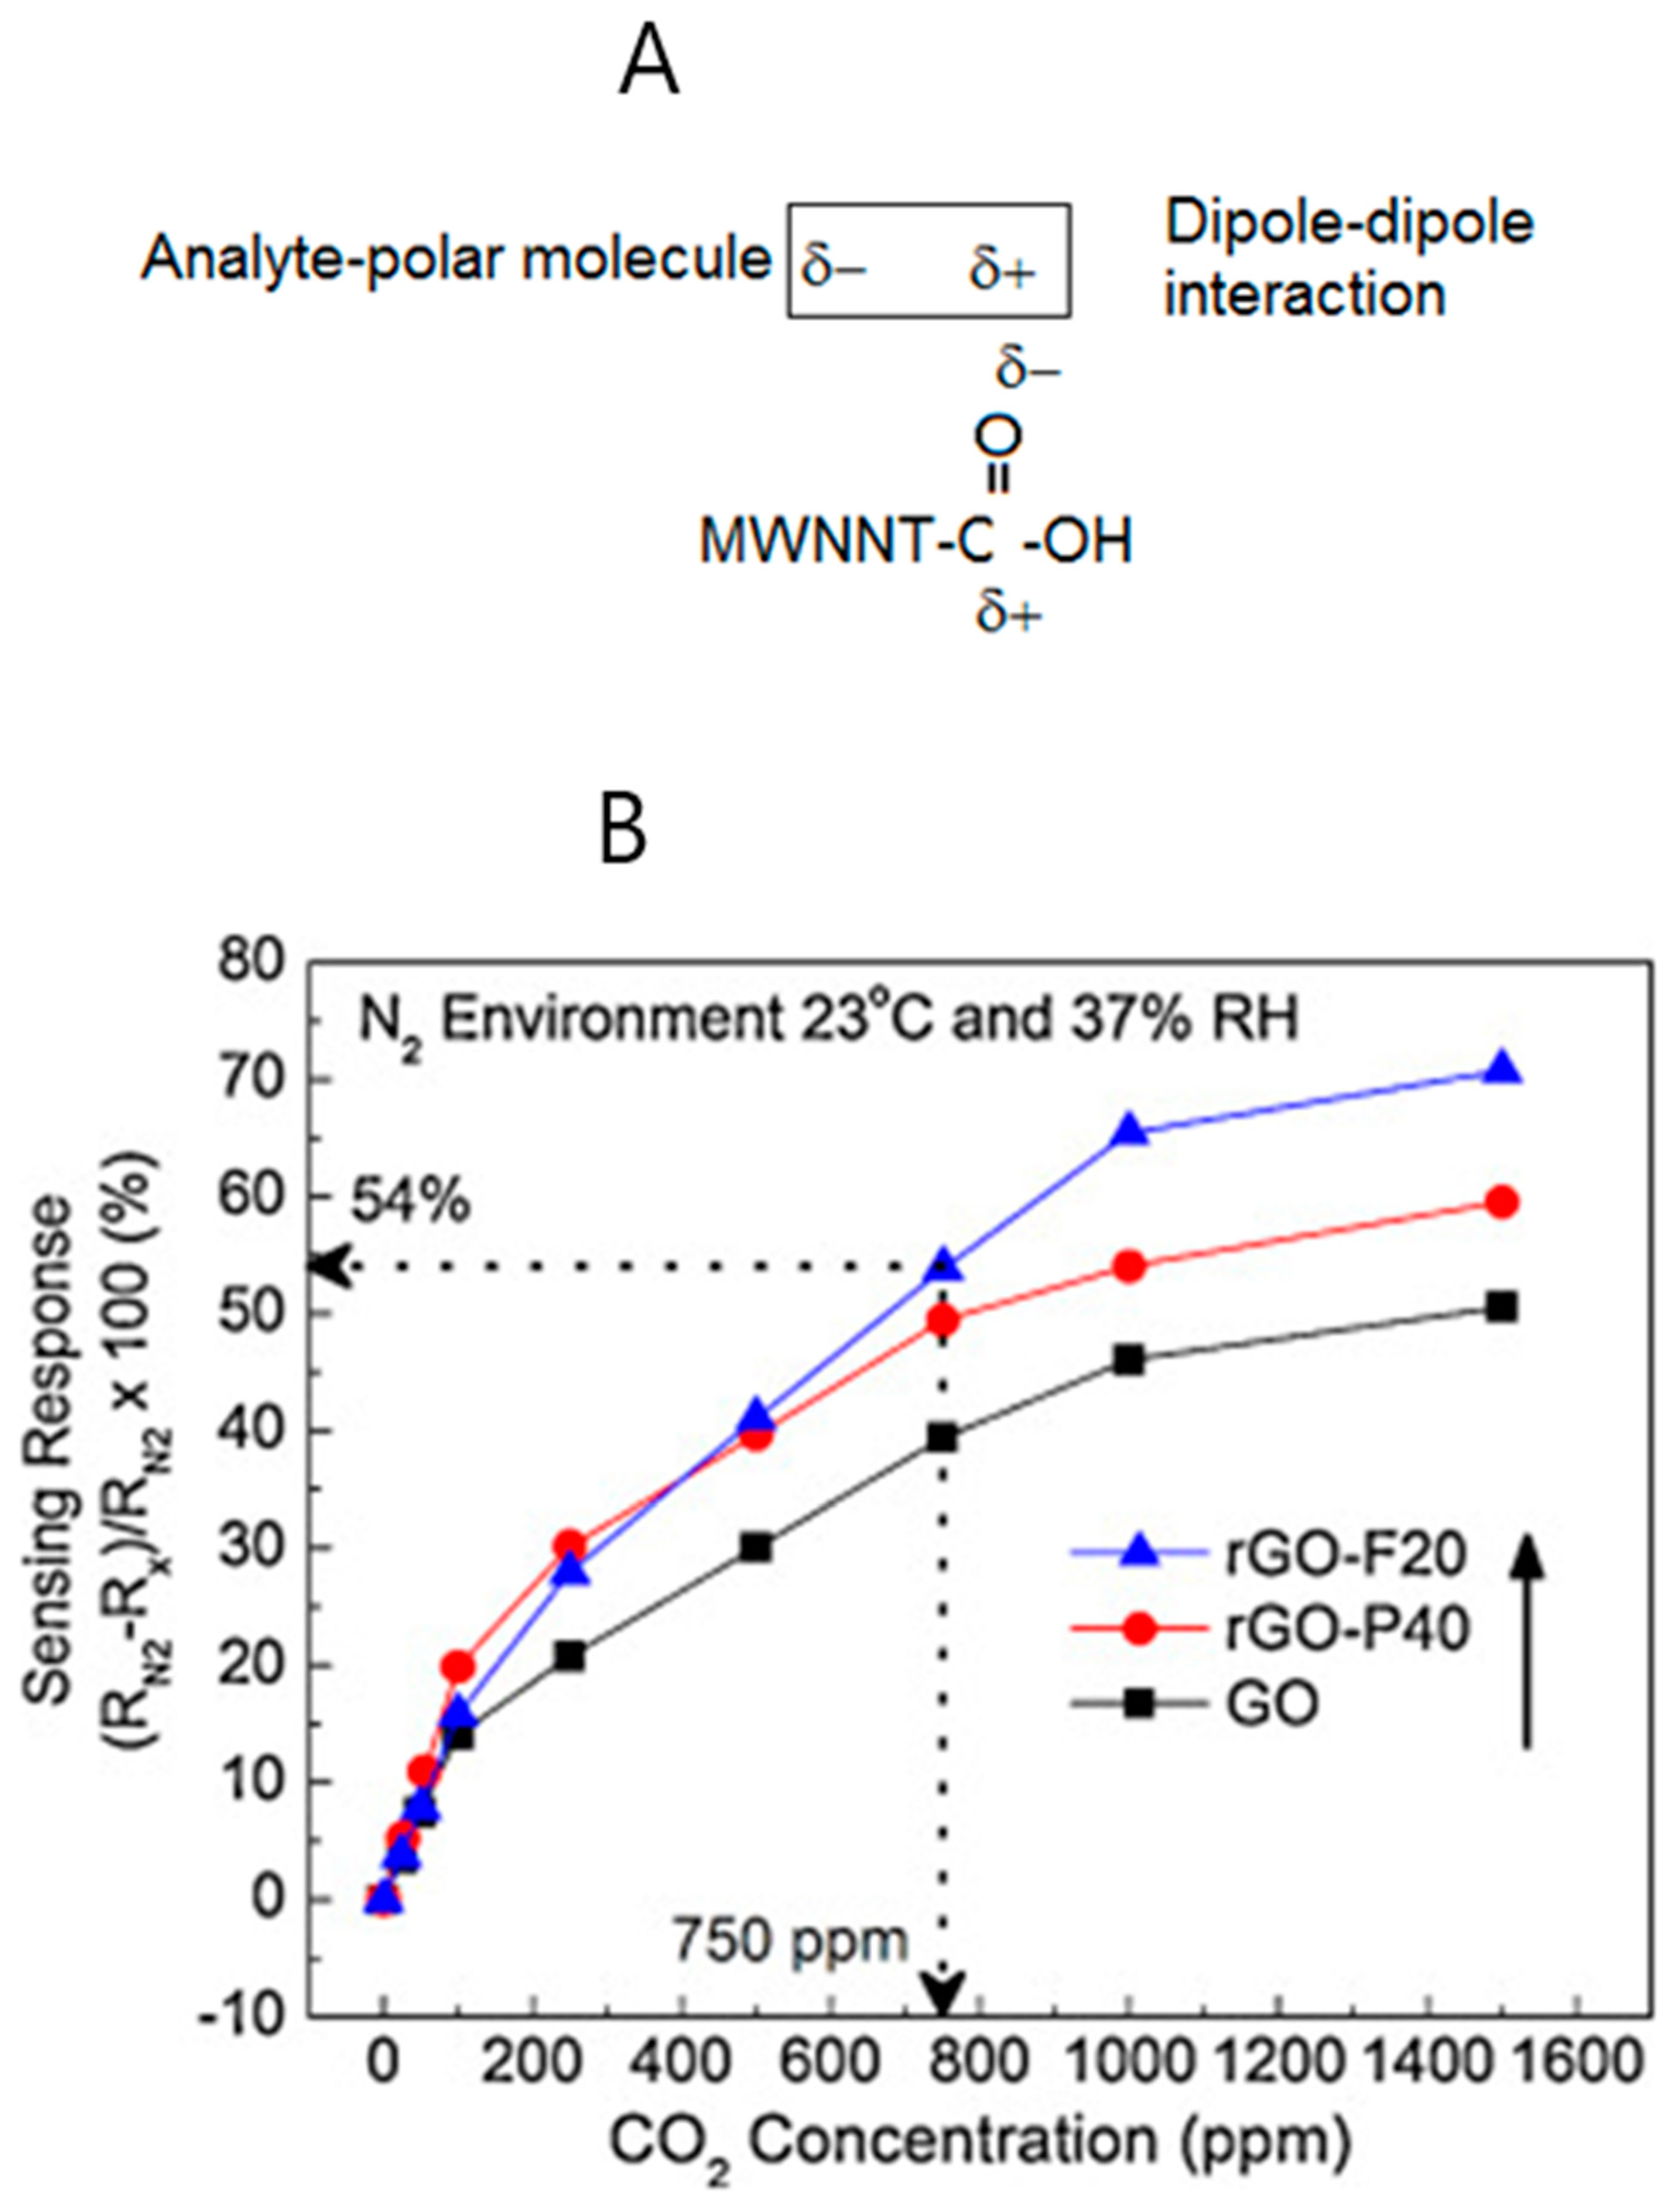
Figure 17.
Twin sensors in parallel configuration. (A) The arrangement of the sensors and the measurement details. (B) The equivalent circuit of the arrangement of the sensors (S1 and S2). (C) Sensor dimensions. Reproduced with permission from Reference [5].
Figure 17.
Twin sensors in parallel configuration. (A) The arrangement of the sensors and the measurement details. (B) The equivalent circuit of the arrangement of the sensors (S1 and S2). (C) Sensor dimensions. Reproduced with permission from Reference [5].
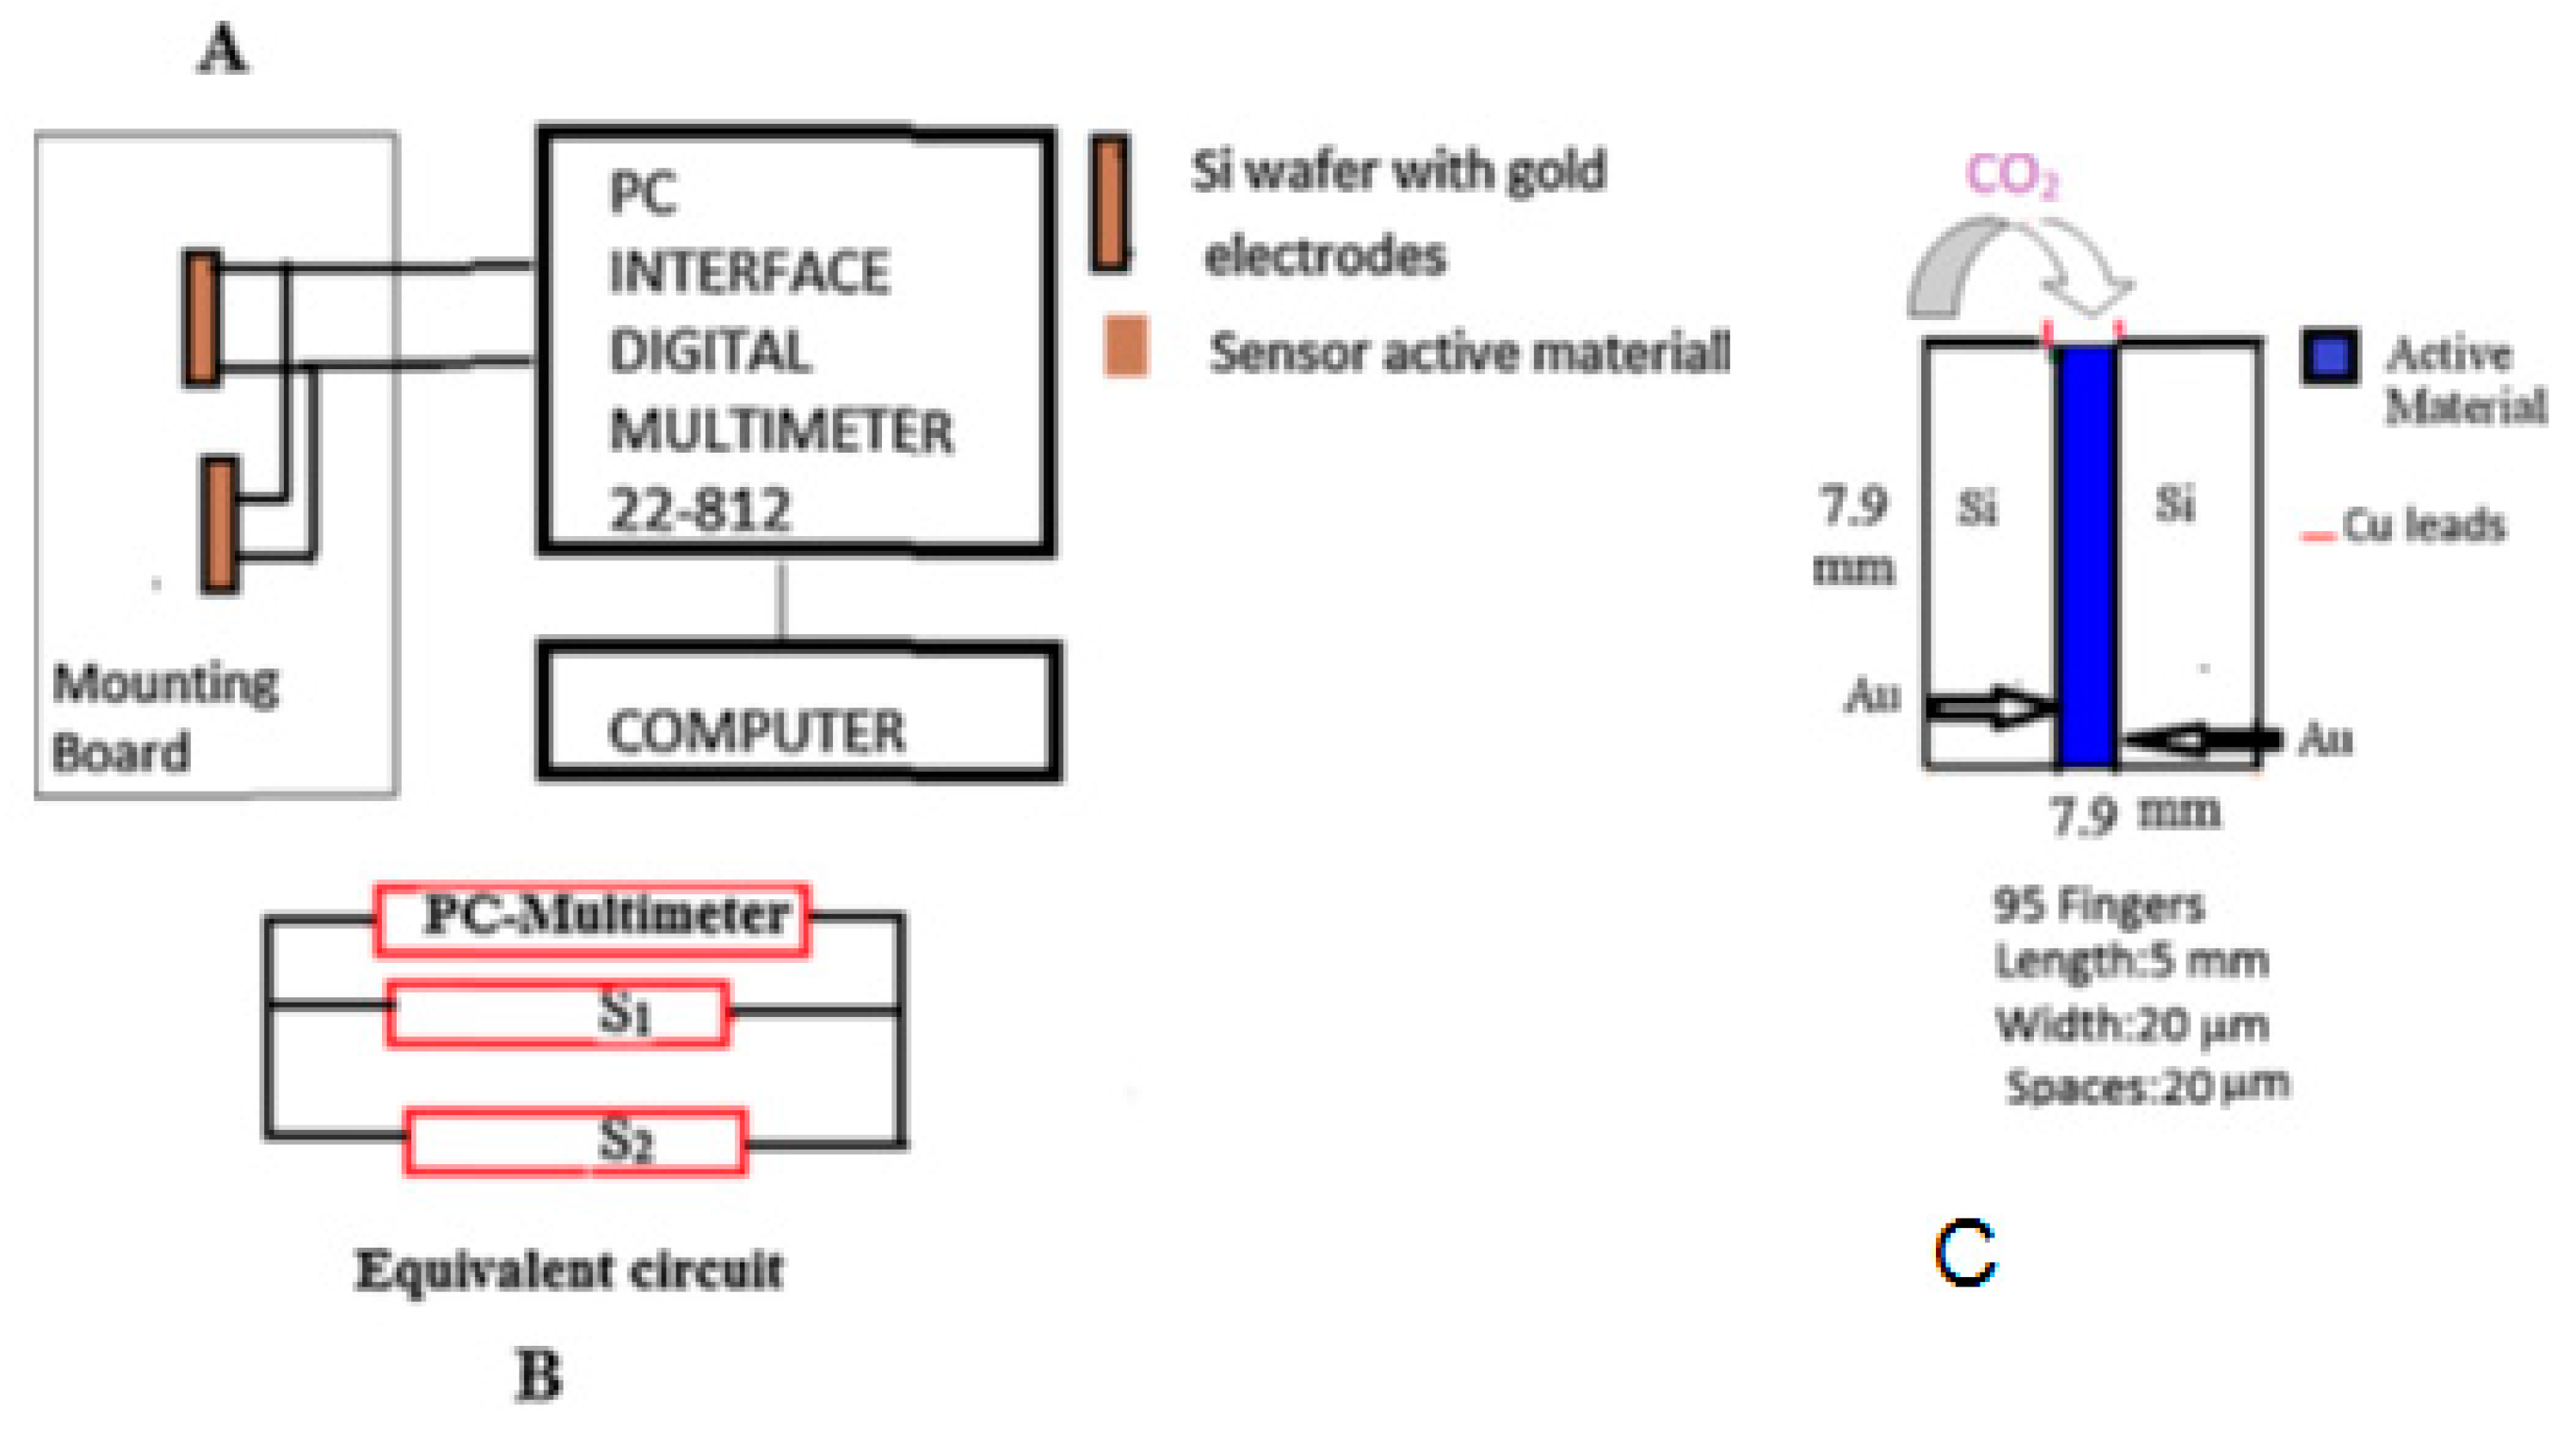
Figure 18.
(A) shows the response of pristine single walled carbon nanotubes (B) Change in resistance with respect to CO2 concentrations. (C) Successive injections of 1 ppm CO2 to the sensor. (D) Response of the sensor to: CO2 (10 ppm); CO2 (10 ppm) + relative humidity (42%); 100 ppm H2; 100 ppm CH4; 50 ppm ethanol; 10 ppm O2 and relative humidity (42%). (E) Sensor mechanism. Reproduced with permission from [67].
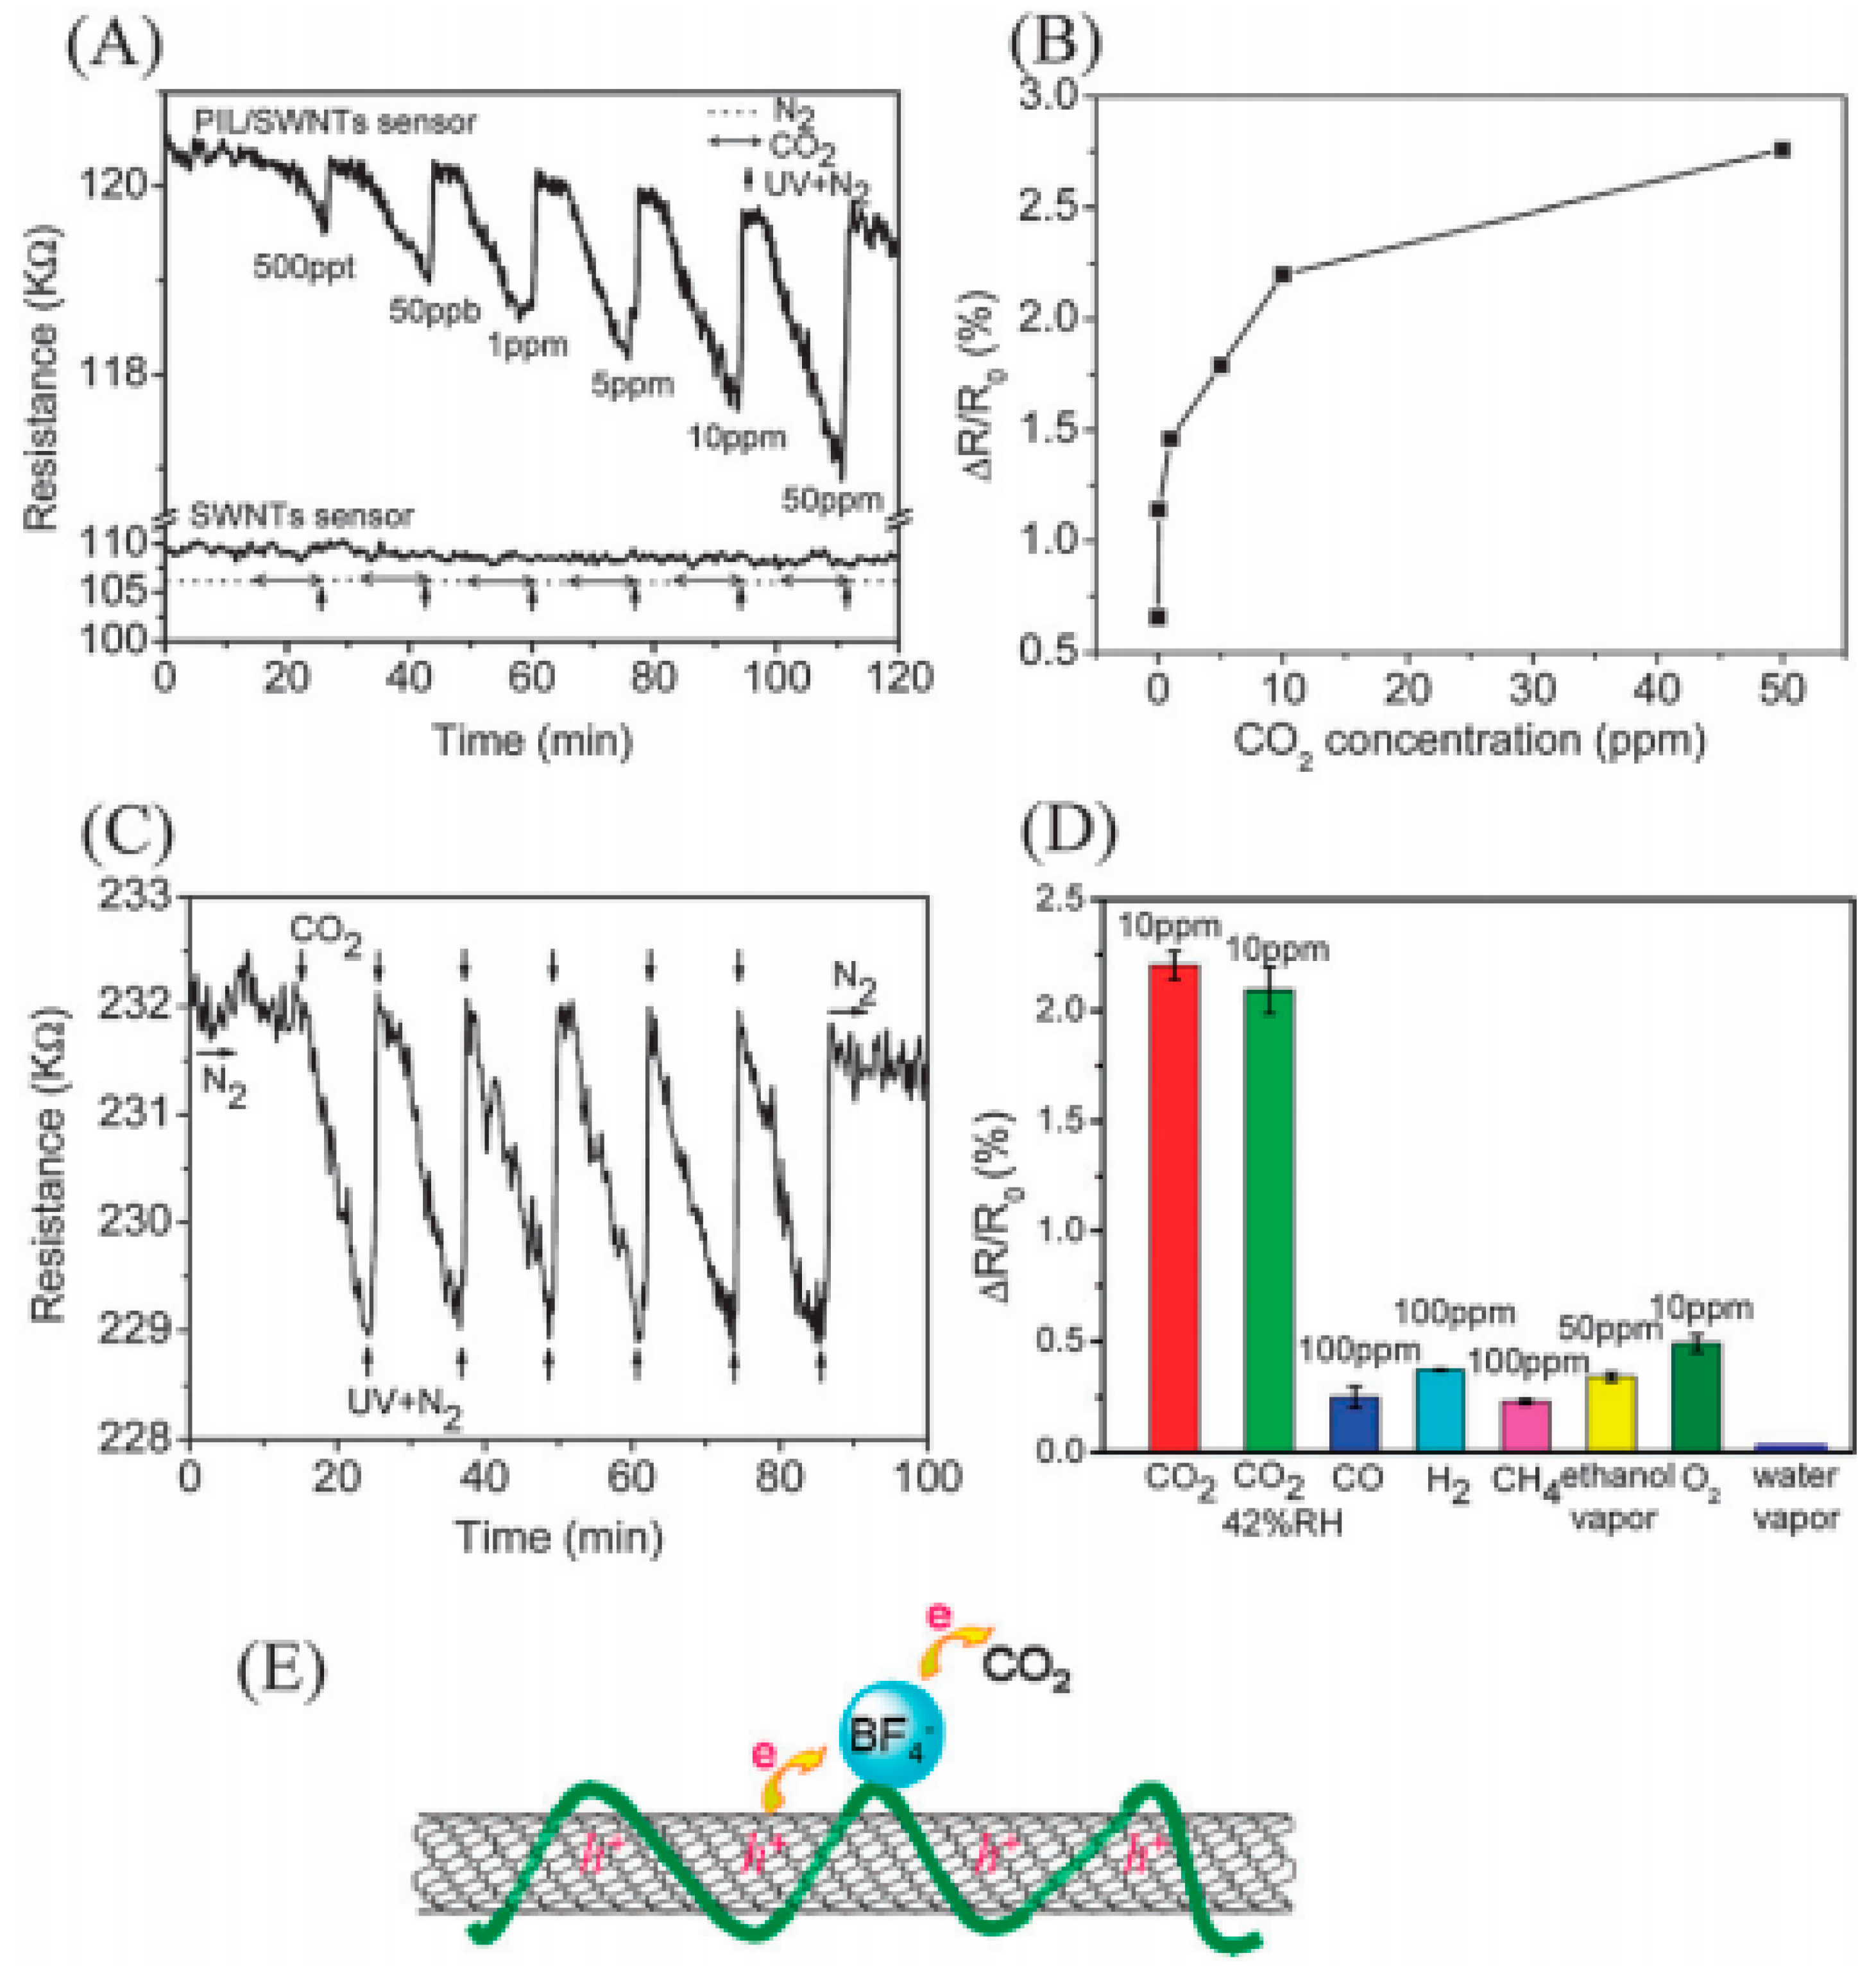
Figure 19.
(a) CO2 sensor with metal oxide-zeolitic imidazole framework on the optical fiber. Reproduced with permission from Reference [69]. (b) Performance characteristics of CO2 sensor giving percentage transmission and absorbance features. MOF: Metal organic framework. Reproduced with permission from Reference [69].
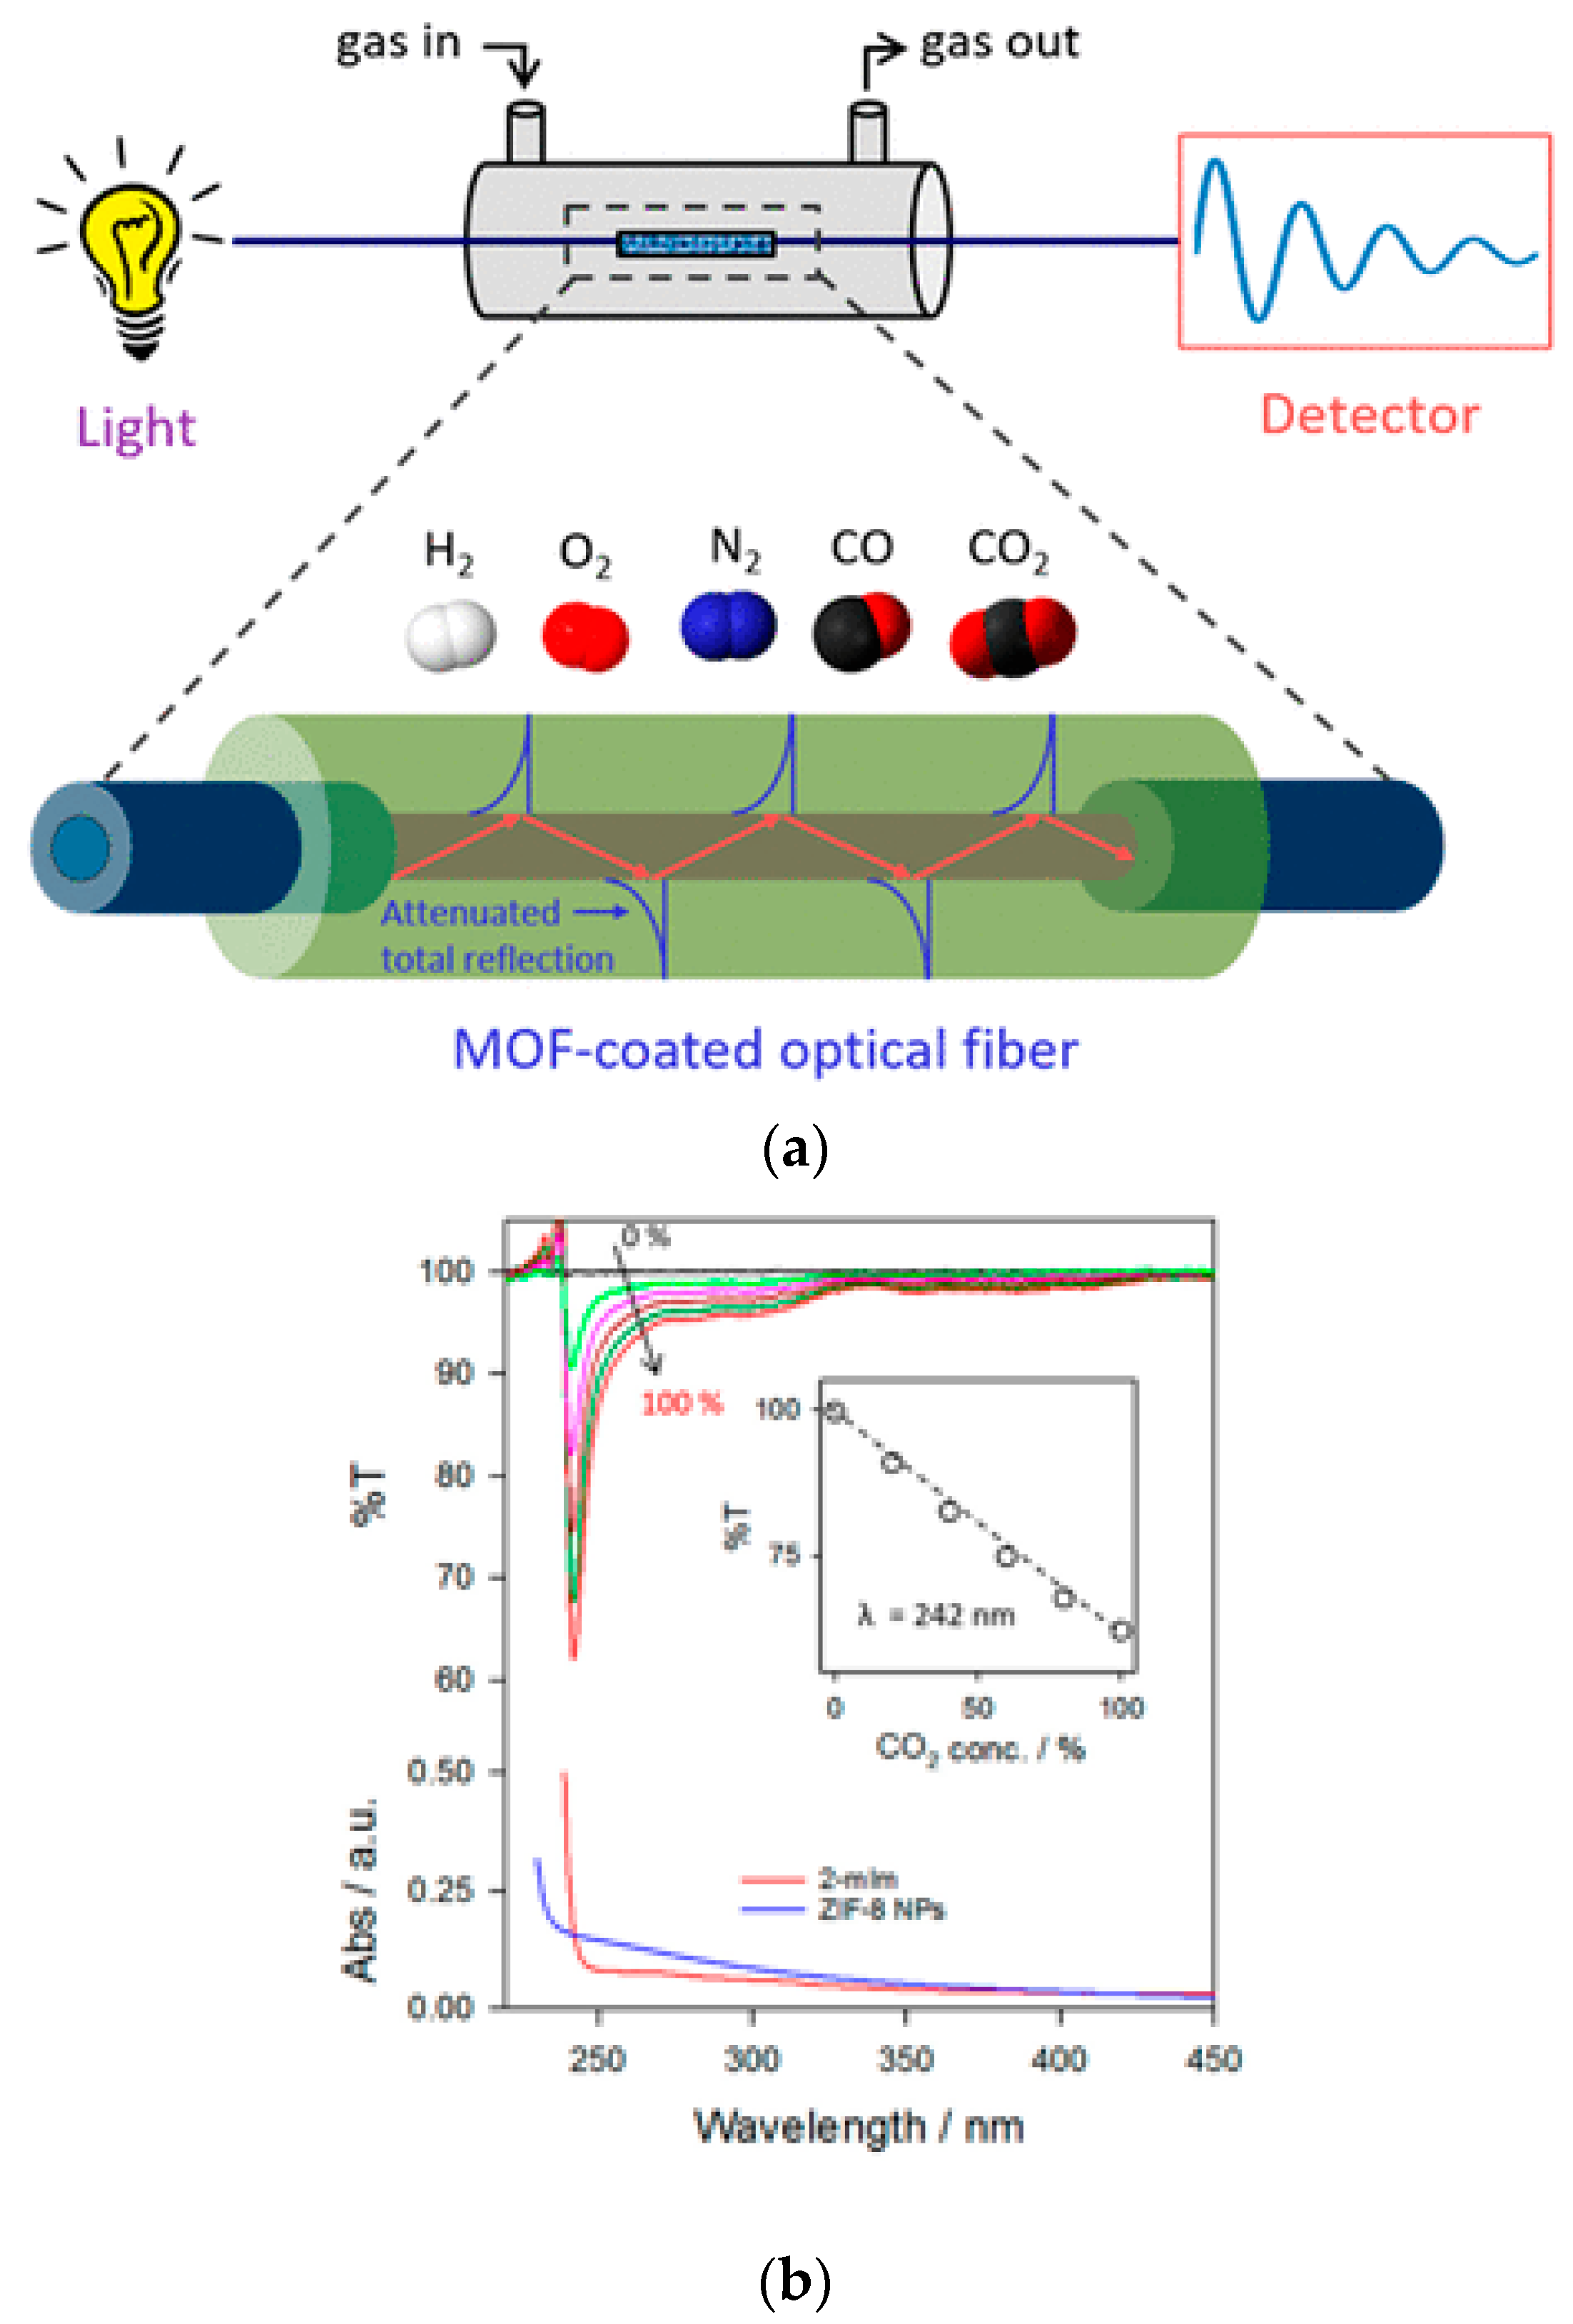
Figure 20.
The optimized structures of adsorbed N2O from three orientations on intrinsic CNT. (A) Vertical (VC) to the nanotube axis; (B) Horizontal (HC) to the nanotube axis; and (C) The nitrogen atom toward the C–C bond (NC). Reproduced with permission from Reference [88].
Figure 20.
The optimized structures of adsorbed N2O from three orientations on intrinsic CNT. (A) Vertical (VC) to the nanotube axis; (B) Horizontal (HC) to the nanotube axis; and (C) The nitrogen atom toward the C–C bond (NC). Reproduced with permission from Reference [88].
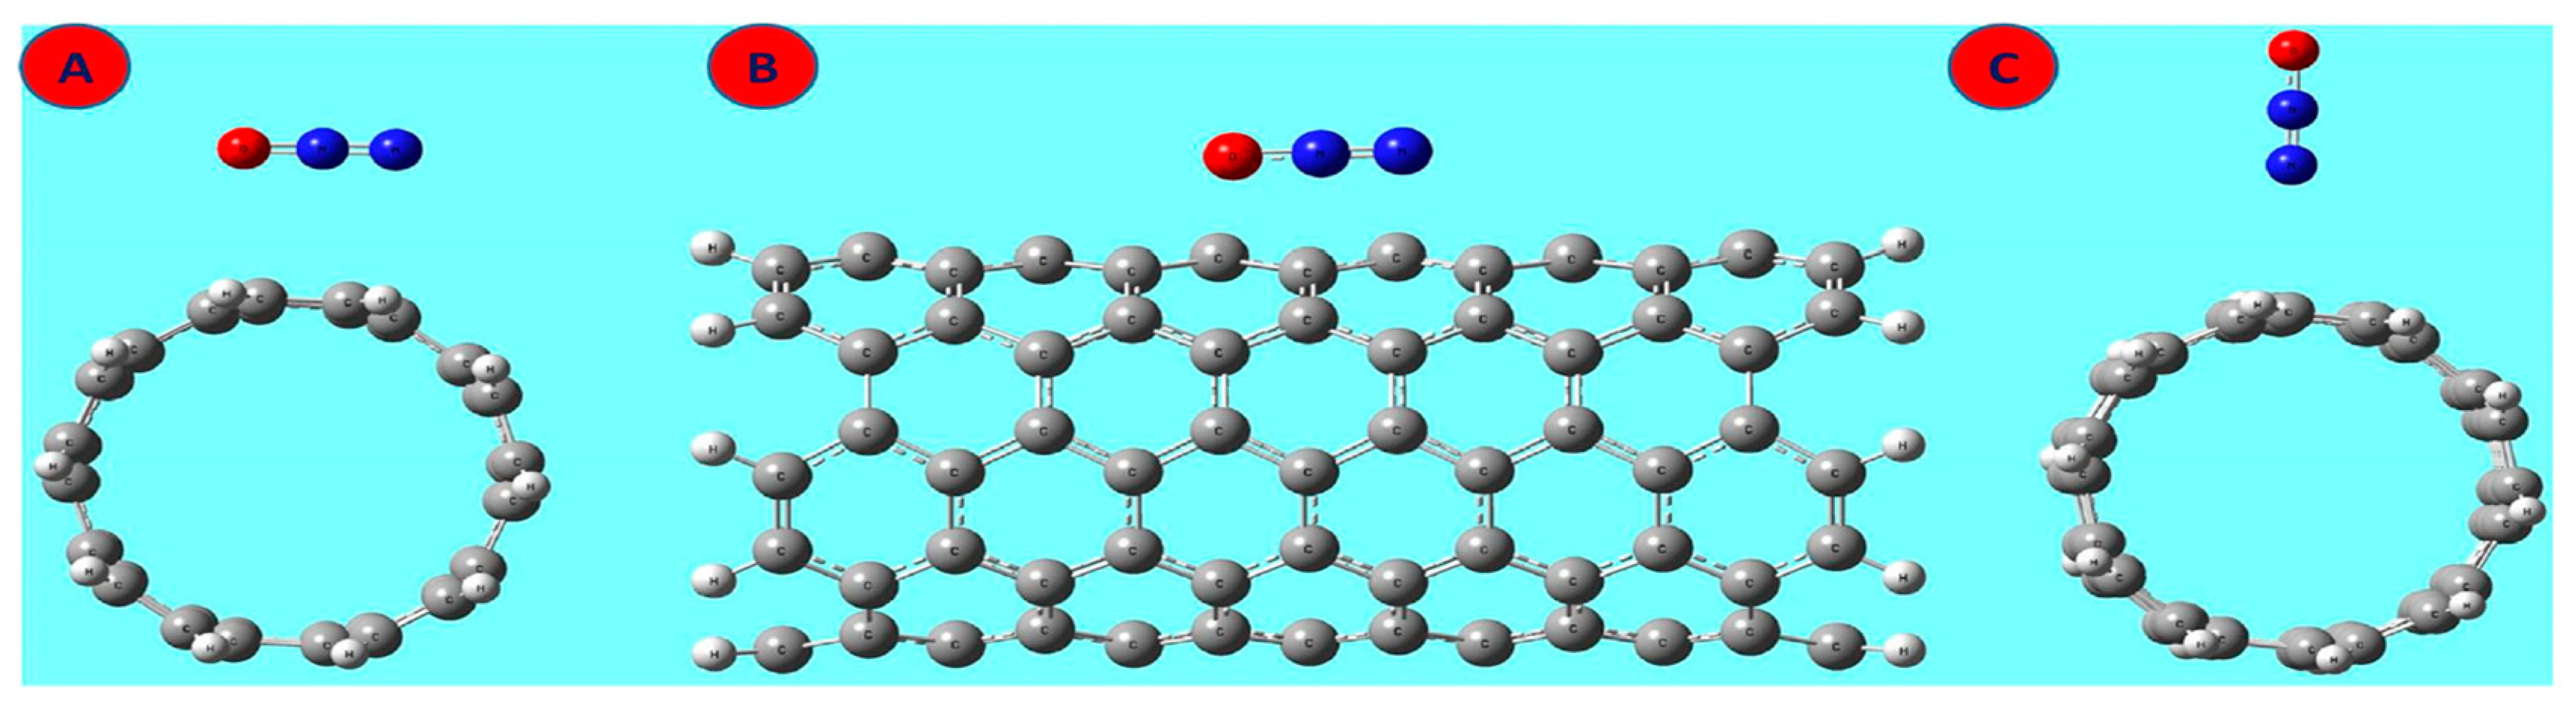
Figure 21.
Response of heterojunction sensor to different analytes. Hydrogen (H2), acetylene (C2H2), ethanol (C2H5OH), carbon dioxide (CO2), Nitrogen doxide (NO2). Reproduced with permission from reference [89].
Figure 21.
Response of heterojunction sensor to different analytes. Hydrogen (H2), acetylene (C2H2), ethanol (C2H5OH), carbon dioxide (CO2), Nitrogen doxide (NO2). Reproduced with permission from reference [89].
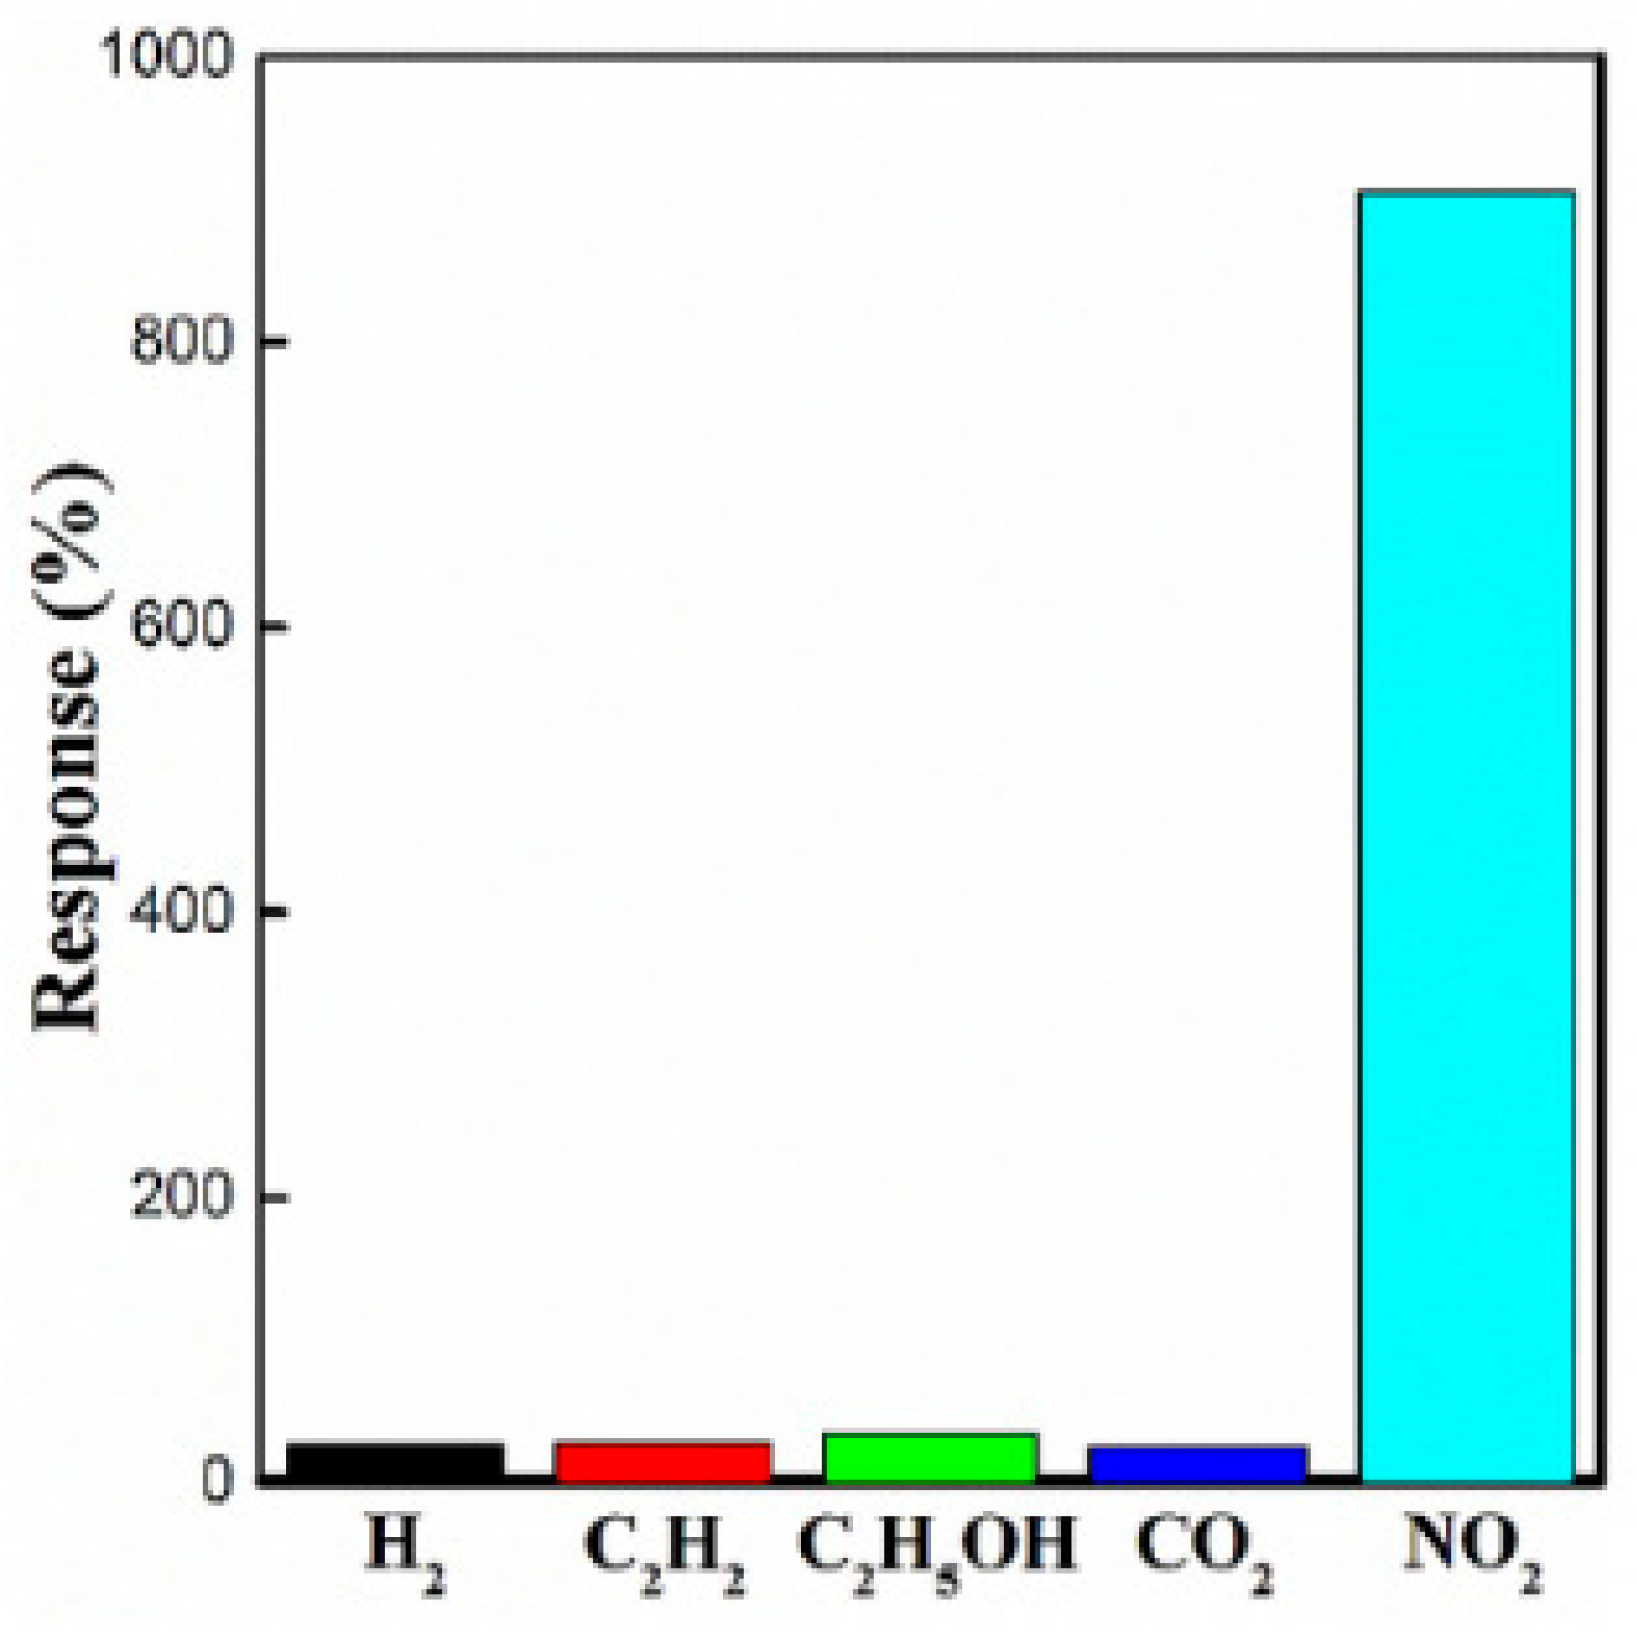
Figure 22.
Screen-printed cantilever with multiwalled carbon nanotube functionalized by oxygen-argon plasma as sensitive material. Reproduced with permission from Reference [114].
Figure 22.
Screen-printed cantilever with multiwalled carbon nanotube functionalized by oxygen-argon plasma as sensitive material. Reproduced with permission from Reference [114].

Figure 23.
(a) Device dimensions: 1.8 cm by 1 cm with a thickness of about 140 μm. IDT fingers: width (200 μm), length (6 mm), thickness (200 nm), track spacing (350 μm); (b) Schematic of the sensor structure PET: Polyethylene terephthalate. Reproduced with permission from Reference [117].
Figure 23.
(a) Device dimensions: 1.8 cm by 1 cm with a thickness of about 140 μm. IDT fingers: width (200 μm), length (6 mm), thickness (200 nm), track spacing (350 μm); (b) Schematic of the sensor structure PET: Polyethylene terephthalate. Reproduced with permission from Reference [117].

Figure 24.
An inkjet printed sensor response to CO2 gas at two different temperatures. Reproduced with permission from reference [117].
Figure 24.
An inkjet printed sensor response to CO2 gas at two different temperatures. Reproduced with permission from reference [117].
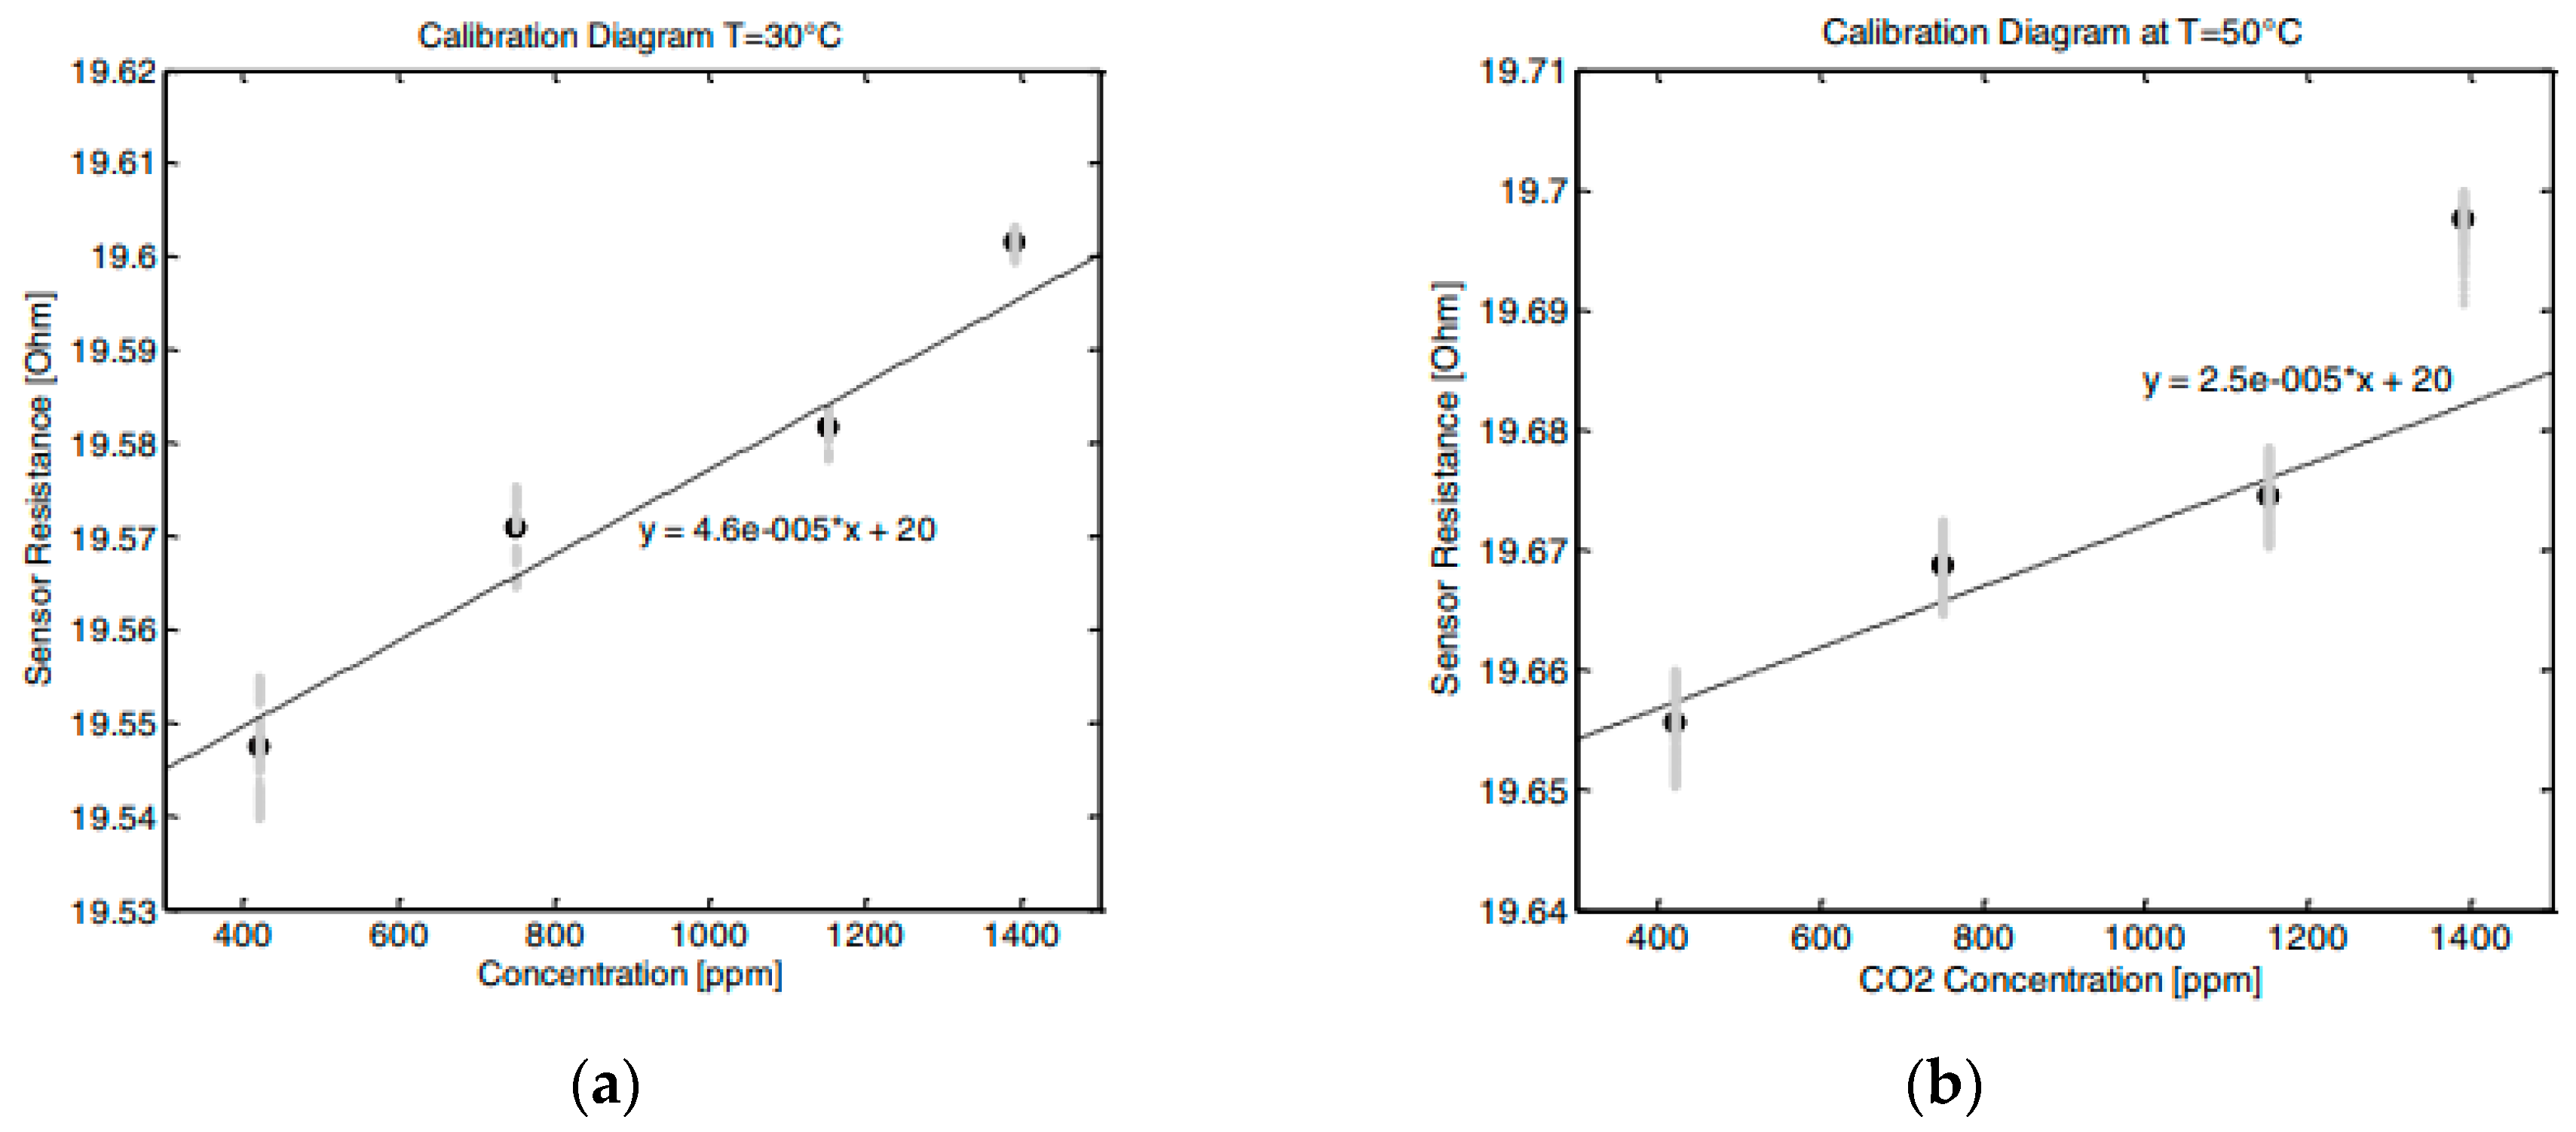
Figure 25.
(a) YSZ (Yttria-stabilized Zirconia) ink and (b) Butyl alcohol-based YSZ-LSM ((La1−xSrx)1−yMnO3 ink droplets from a single nozzle, with time intervals of 10 μs and 5 μs, respectively. The nozzle number (“3”) of the printhead is shown in (b). Reproduced with permission from Reference [118].

Figure 26.
Deposition of positively charged poly(diallydimethylammonium chloride) (PDDA, 20% wt. in water, medium molecular weight MW 200,000–350,000) and positively charged particles by inkjet printing. ITO: indium tin oxide glass; IrOx: iridium oxide; PET: polyethylene terepthalate. The feedback arrow indicates layer-by-layer deposition. Reproduced with permission from Reference [119].

Figure 27.
Type 3 inkjet-printed sensor for CO2 operating at 160 °C. ID: drain current. Responds to CO2 concentration. VD and VCG are drain and gate voltages. Reproduced with permission from Reference [121].
Figure 27.
Type 3 inkjet-printed sensor for CO2 operating at 160 °C. ID: drain current. Responds to CO2 concentration. VD and VCG are drain and gate voltages. Reproduced with permission from Reference [121].


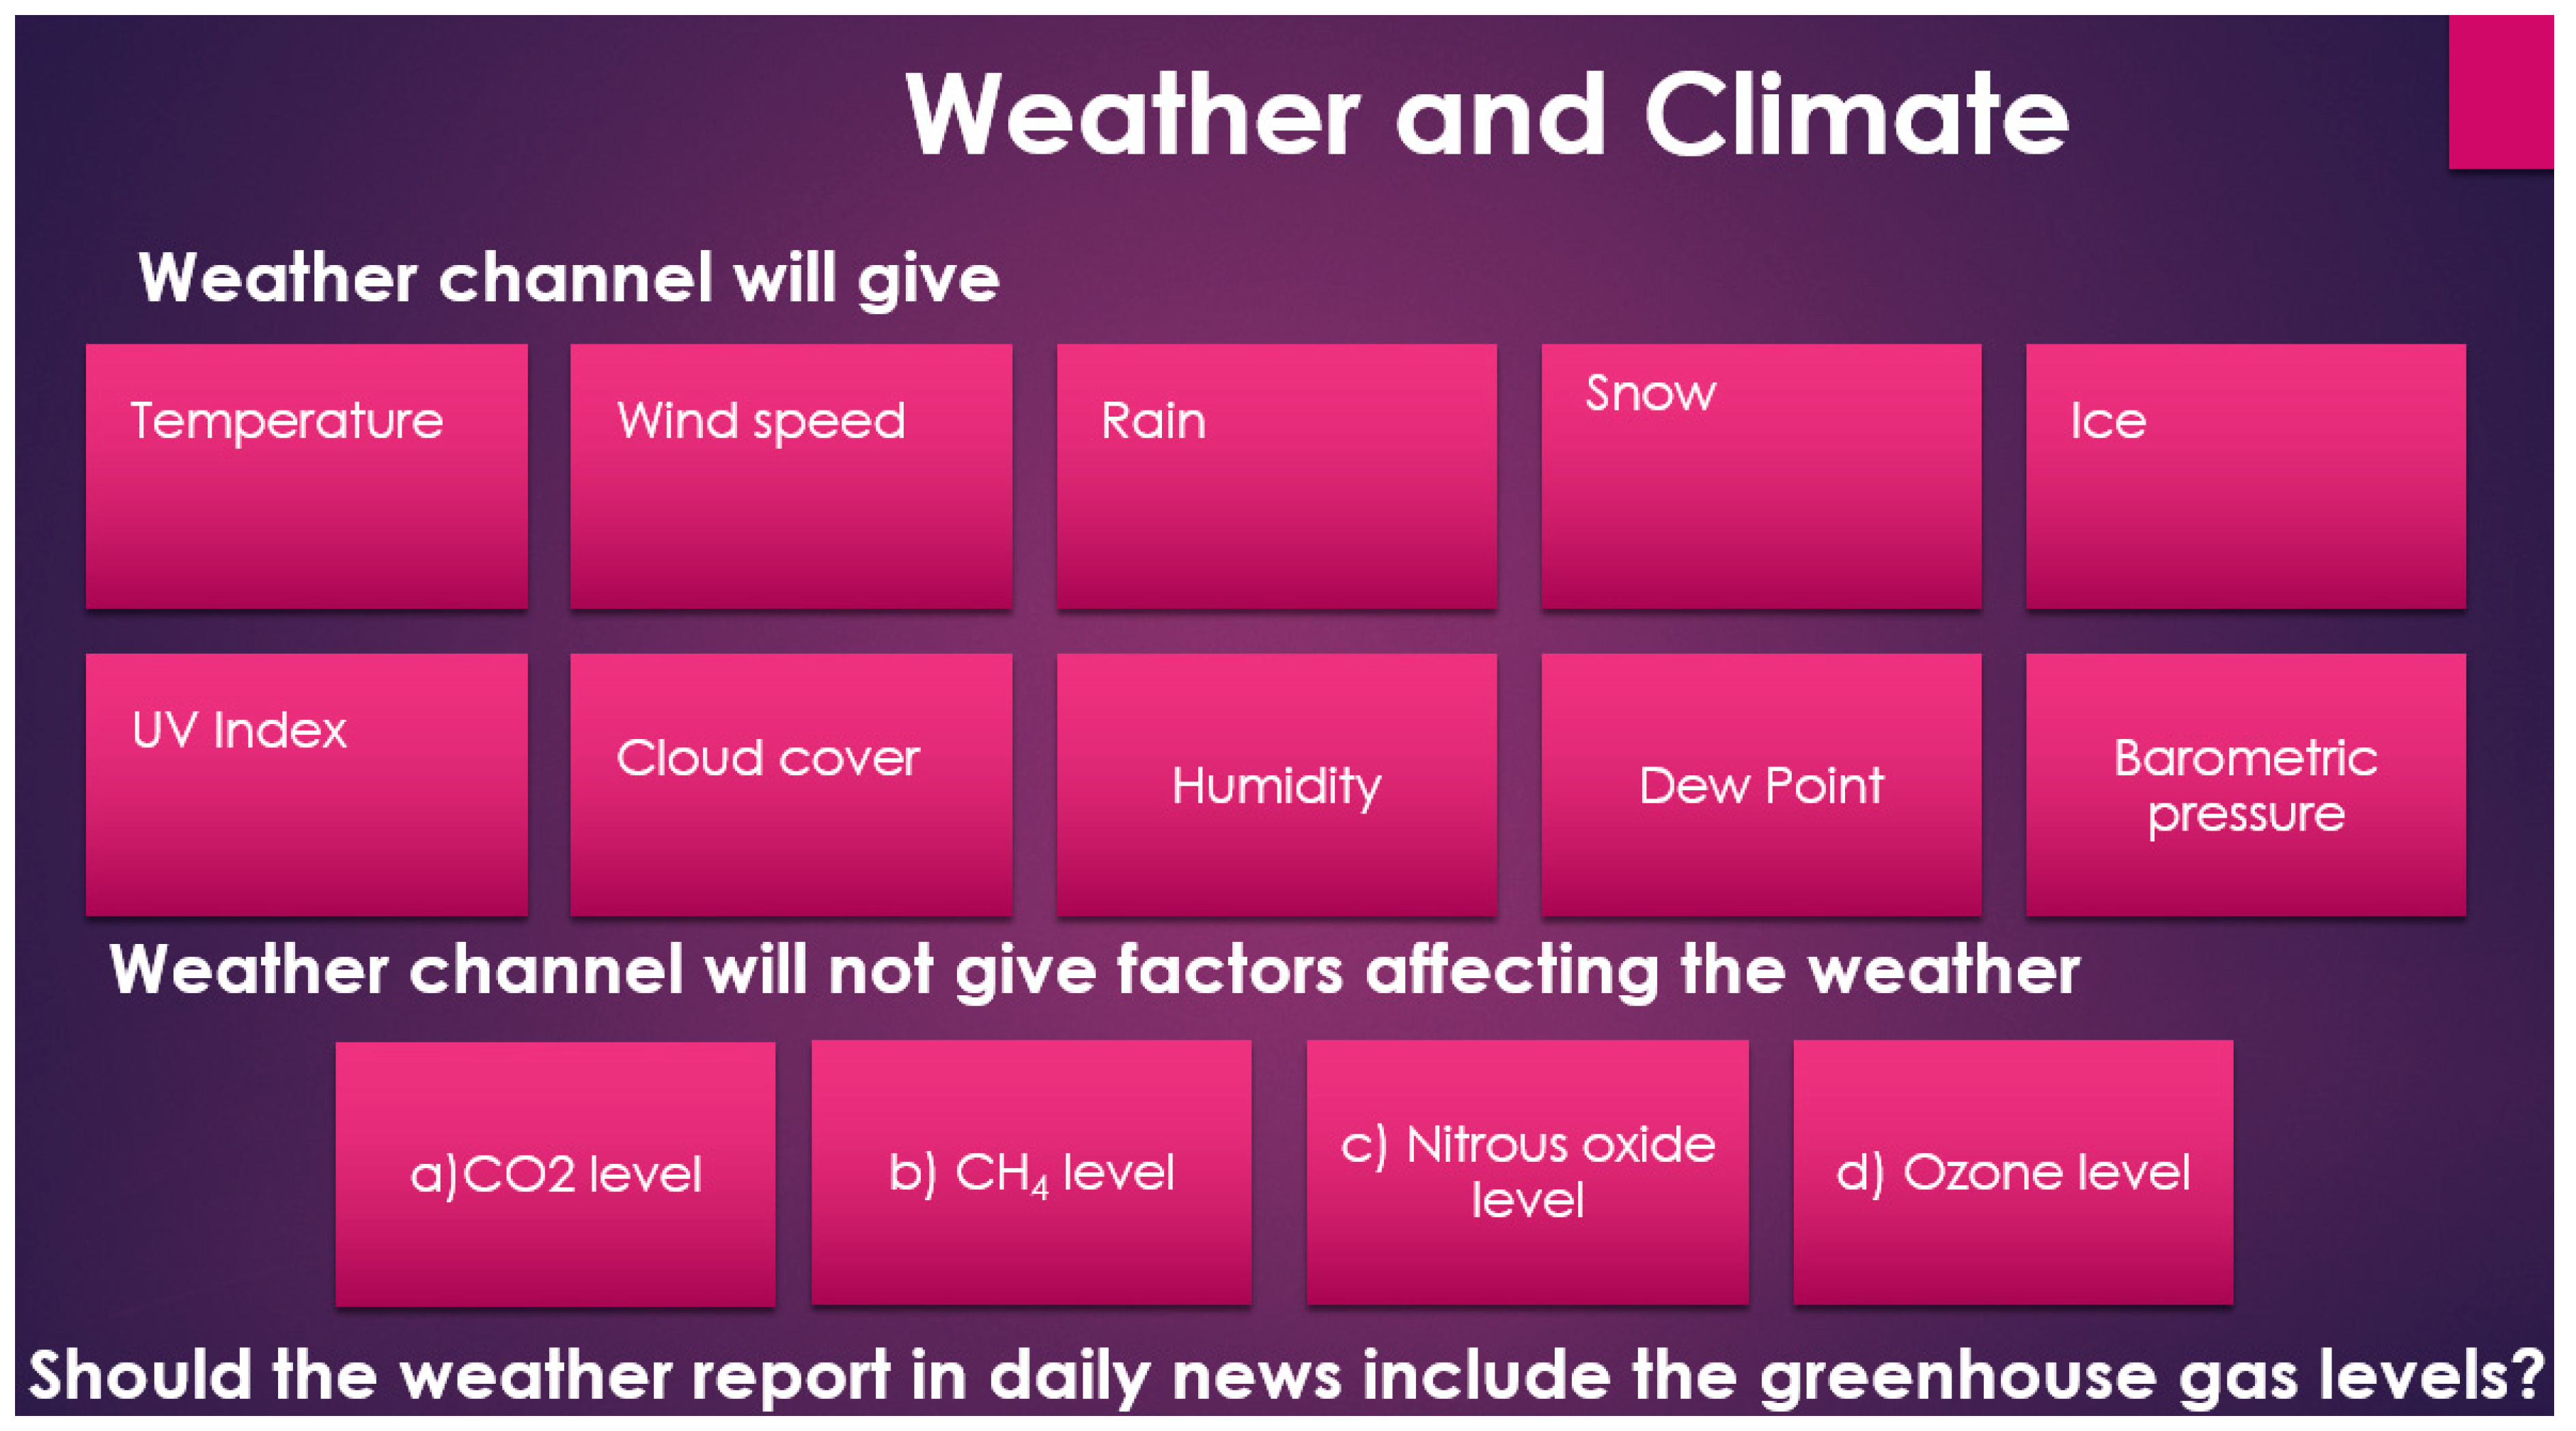
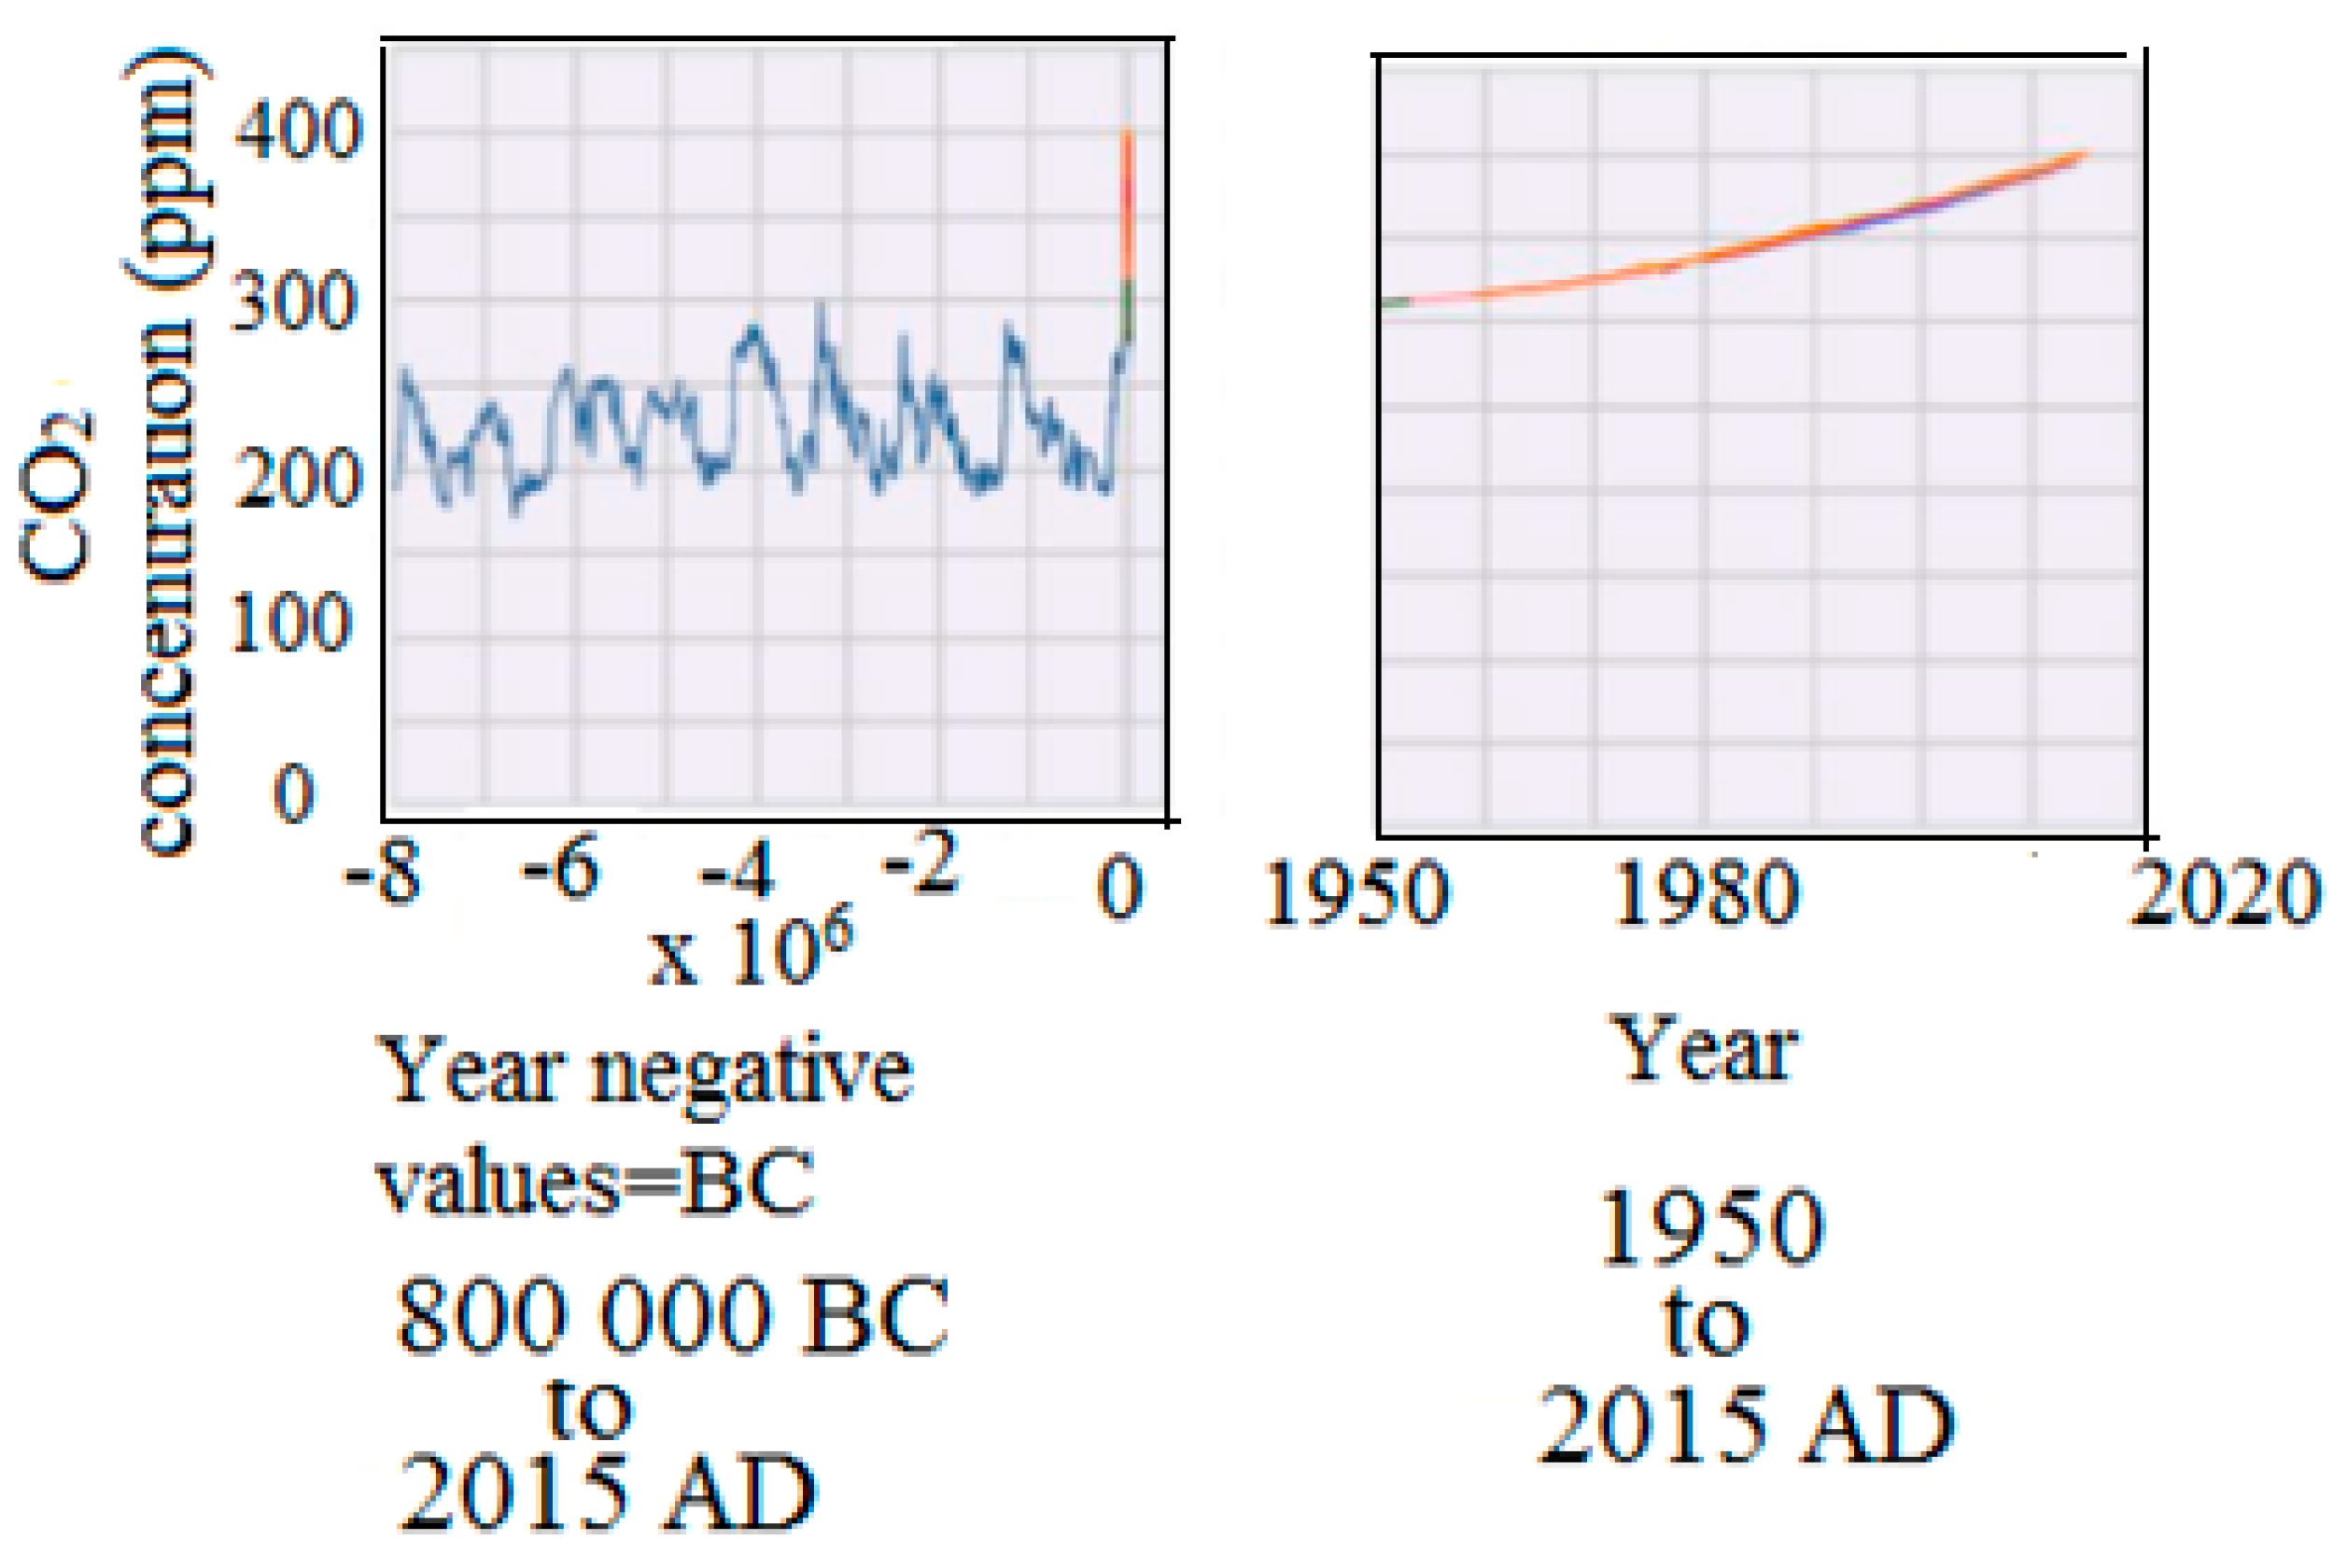
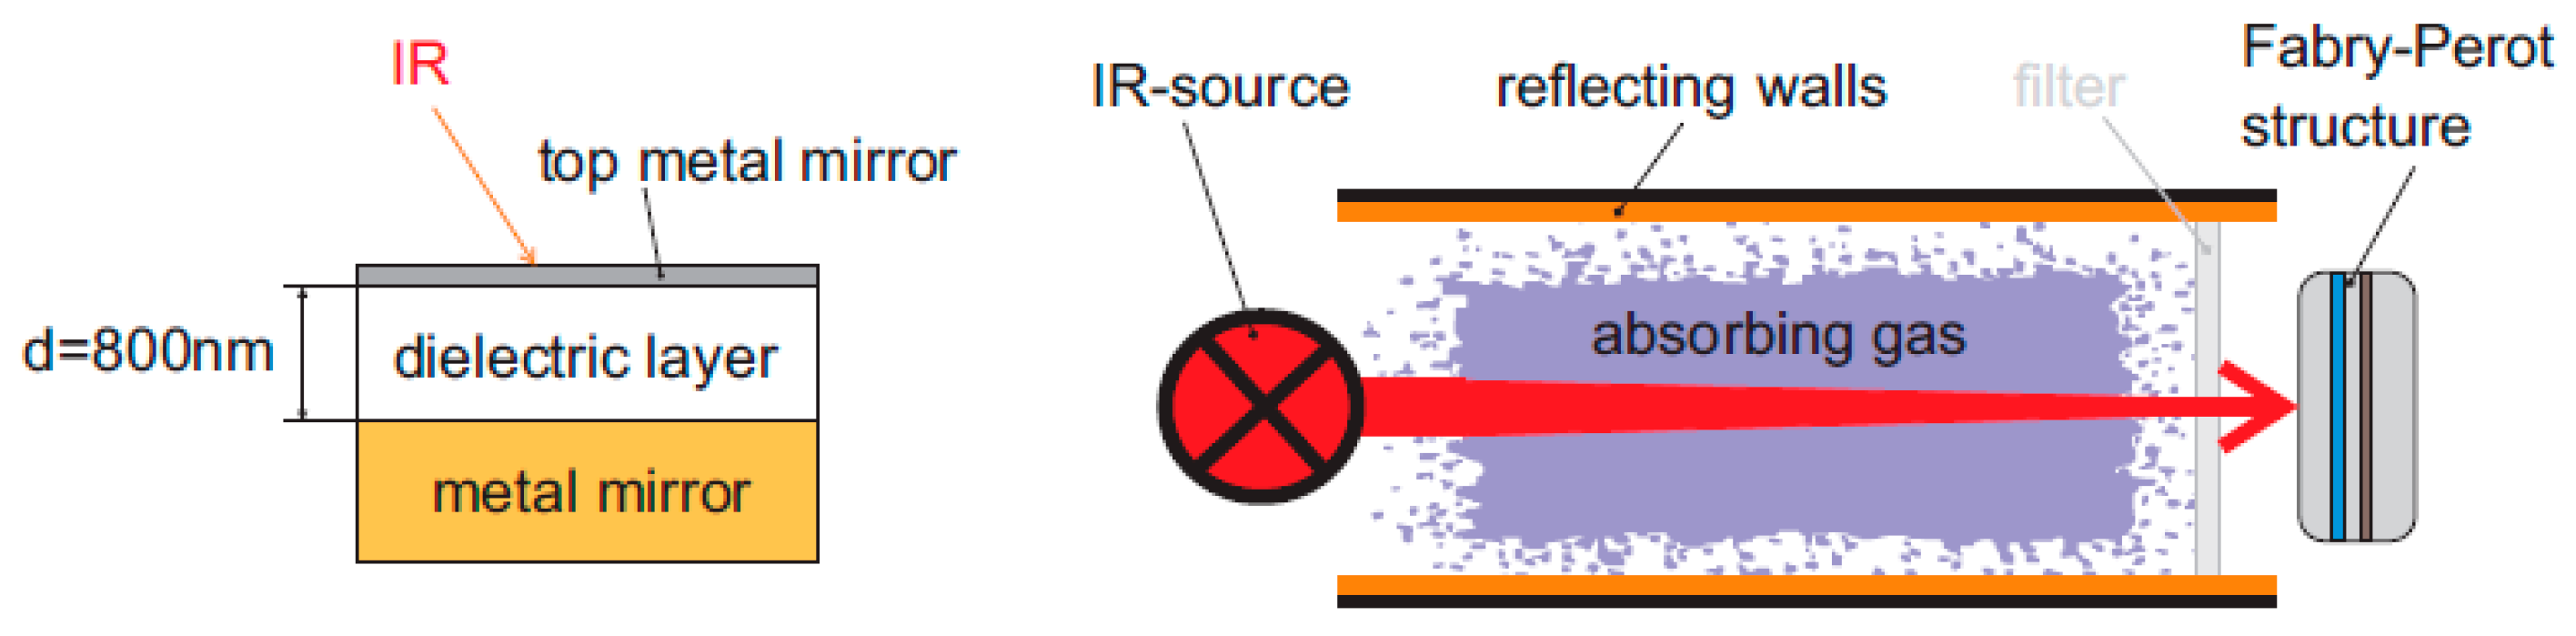
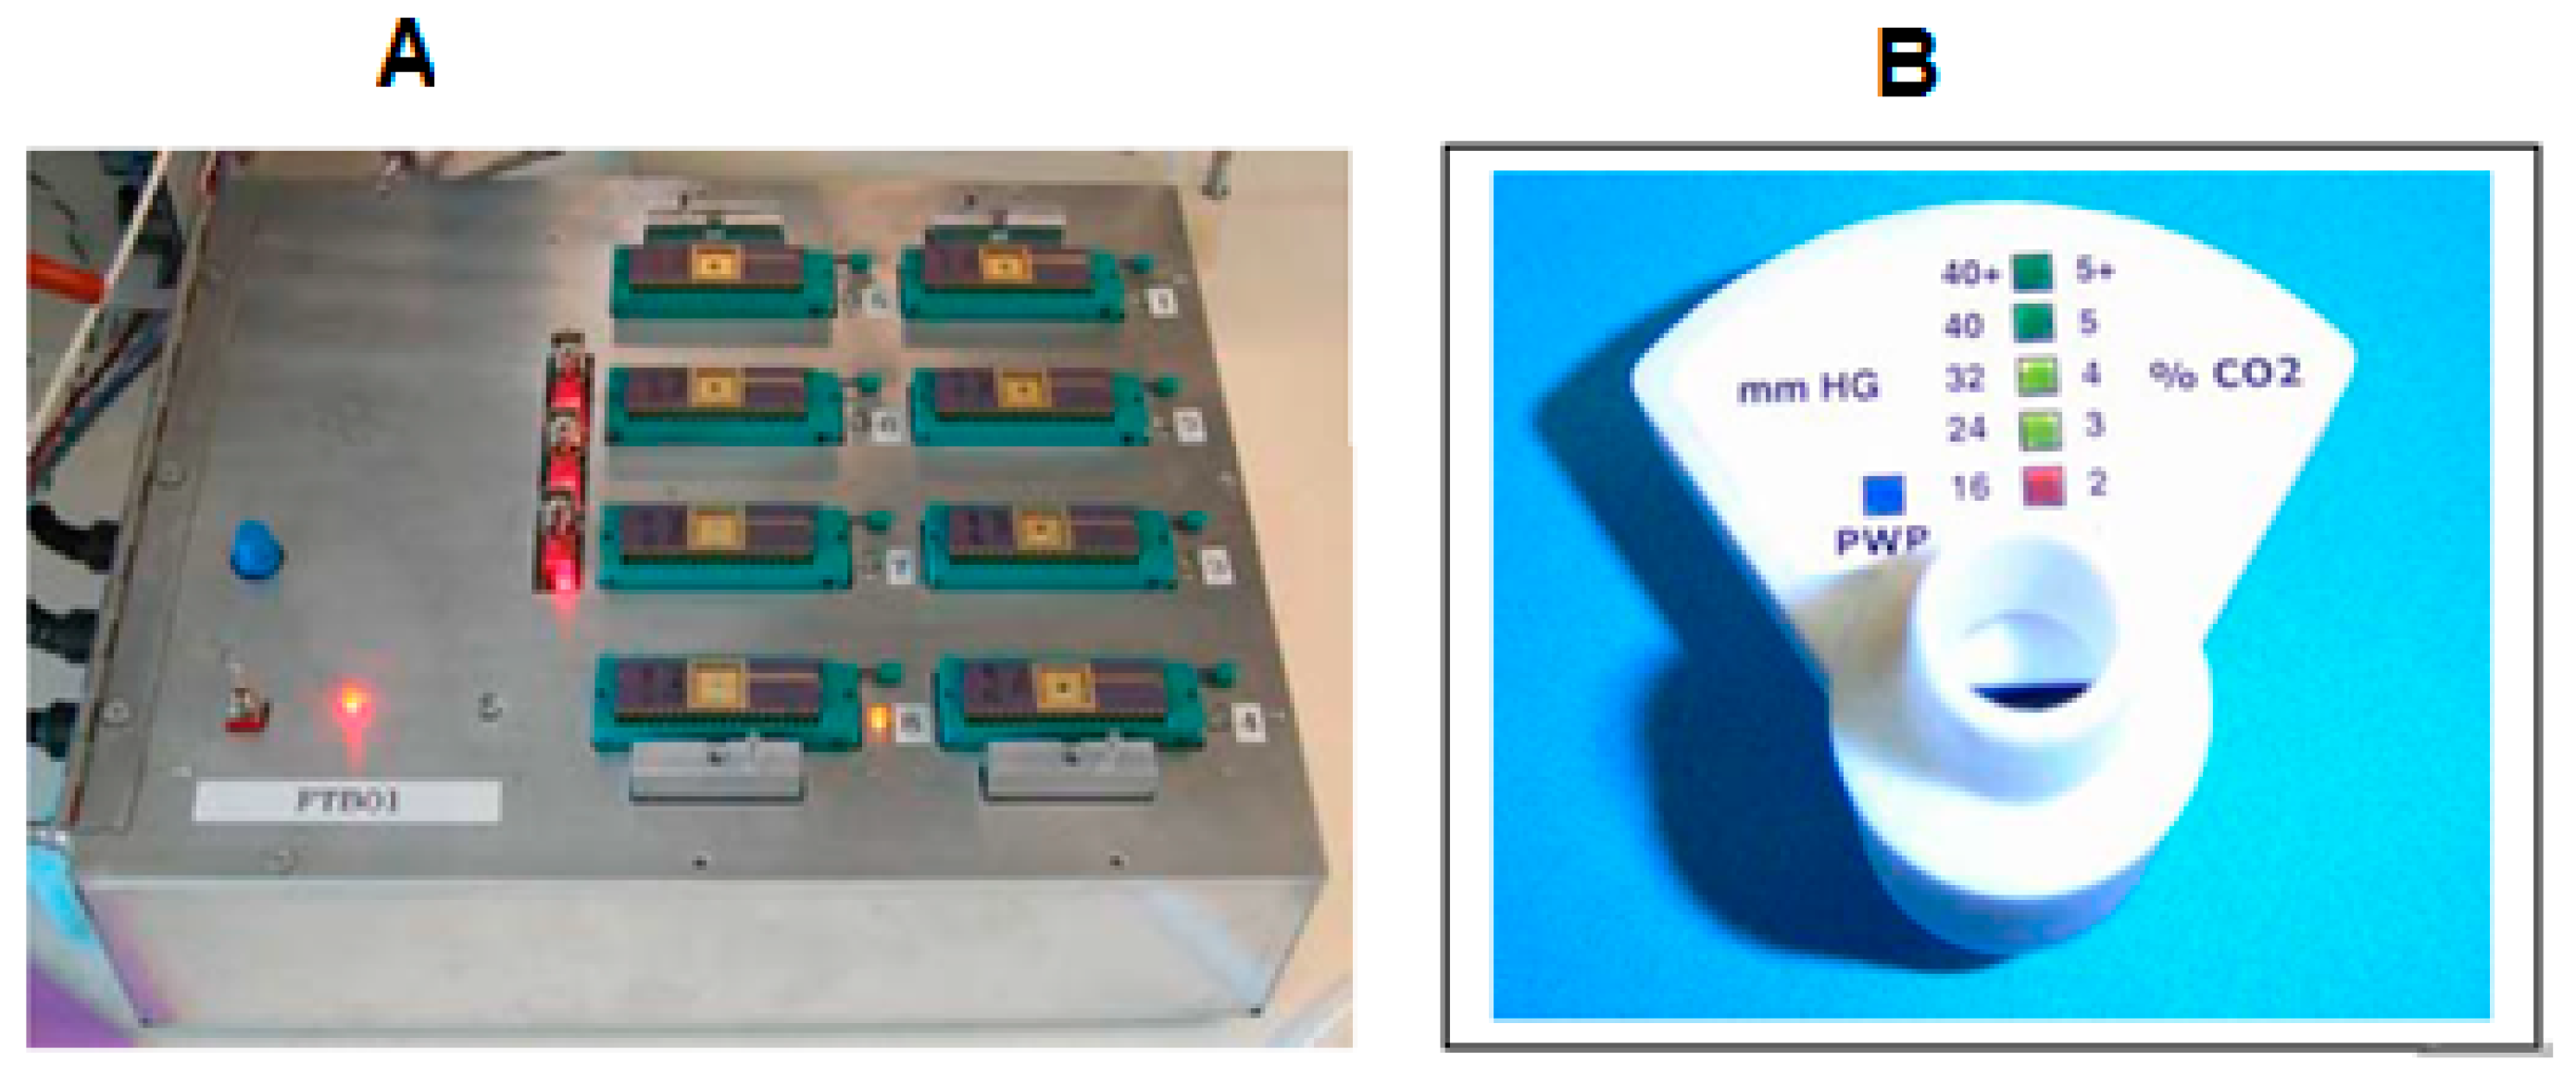
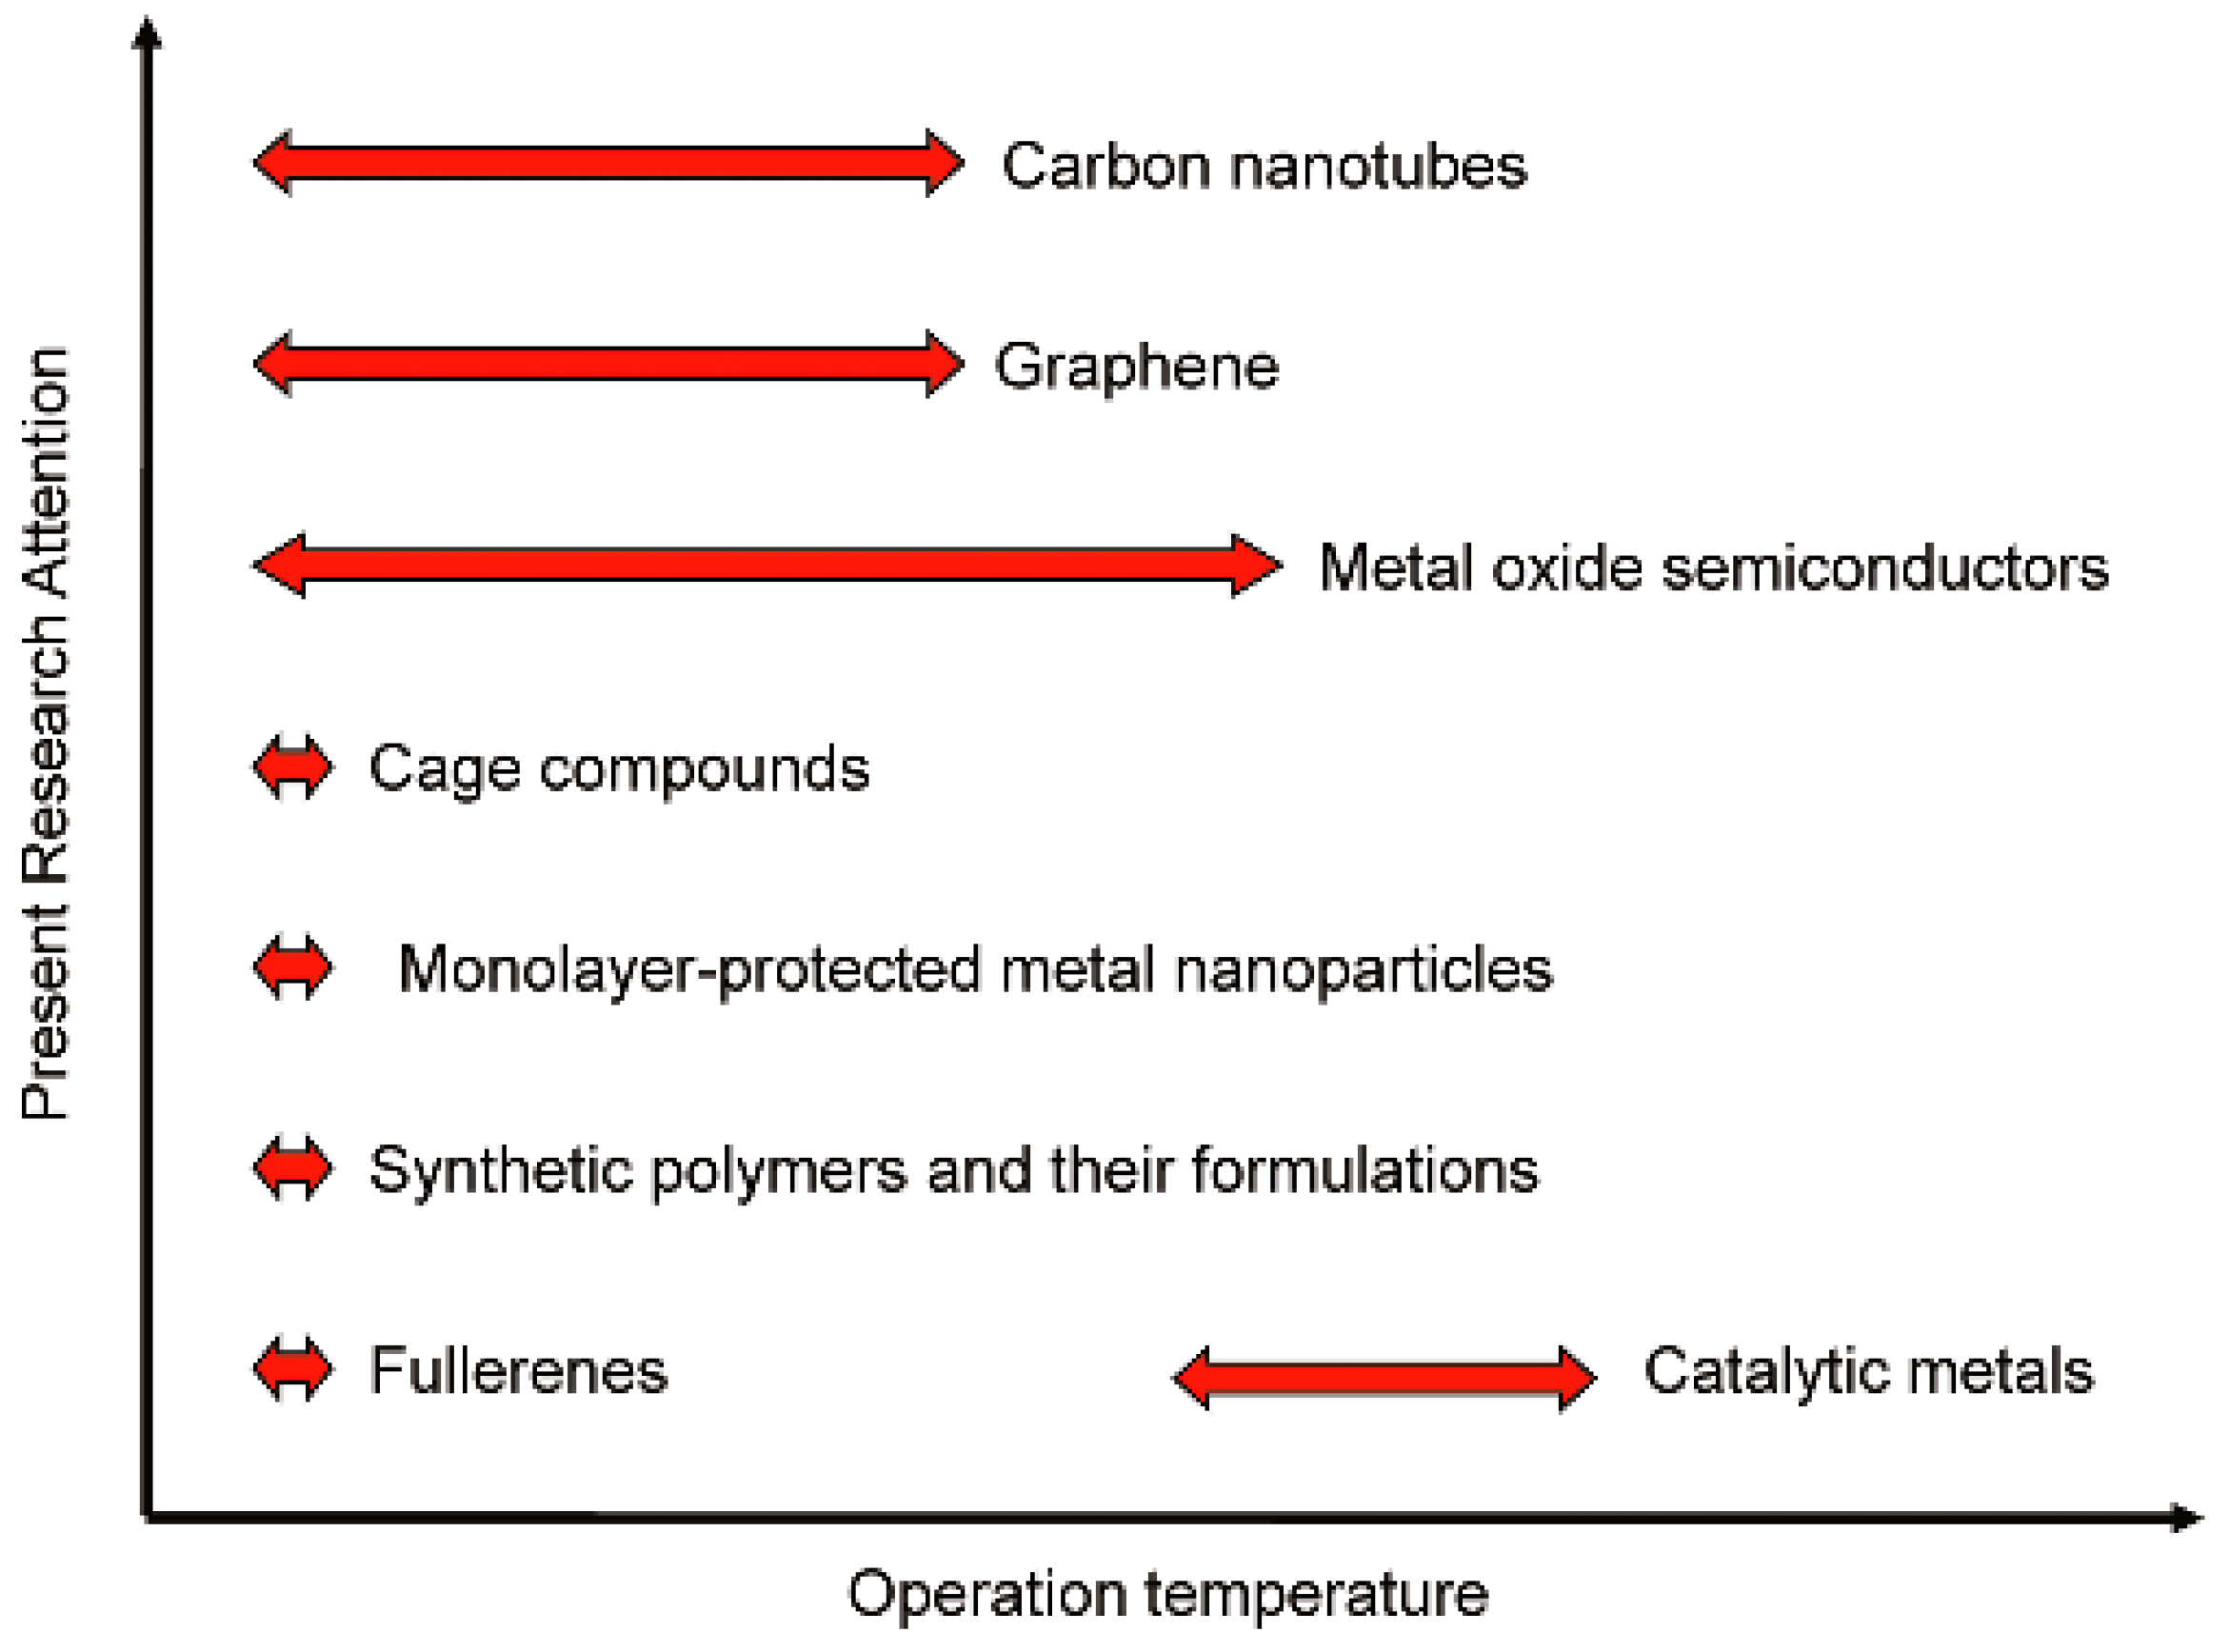
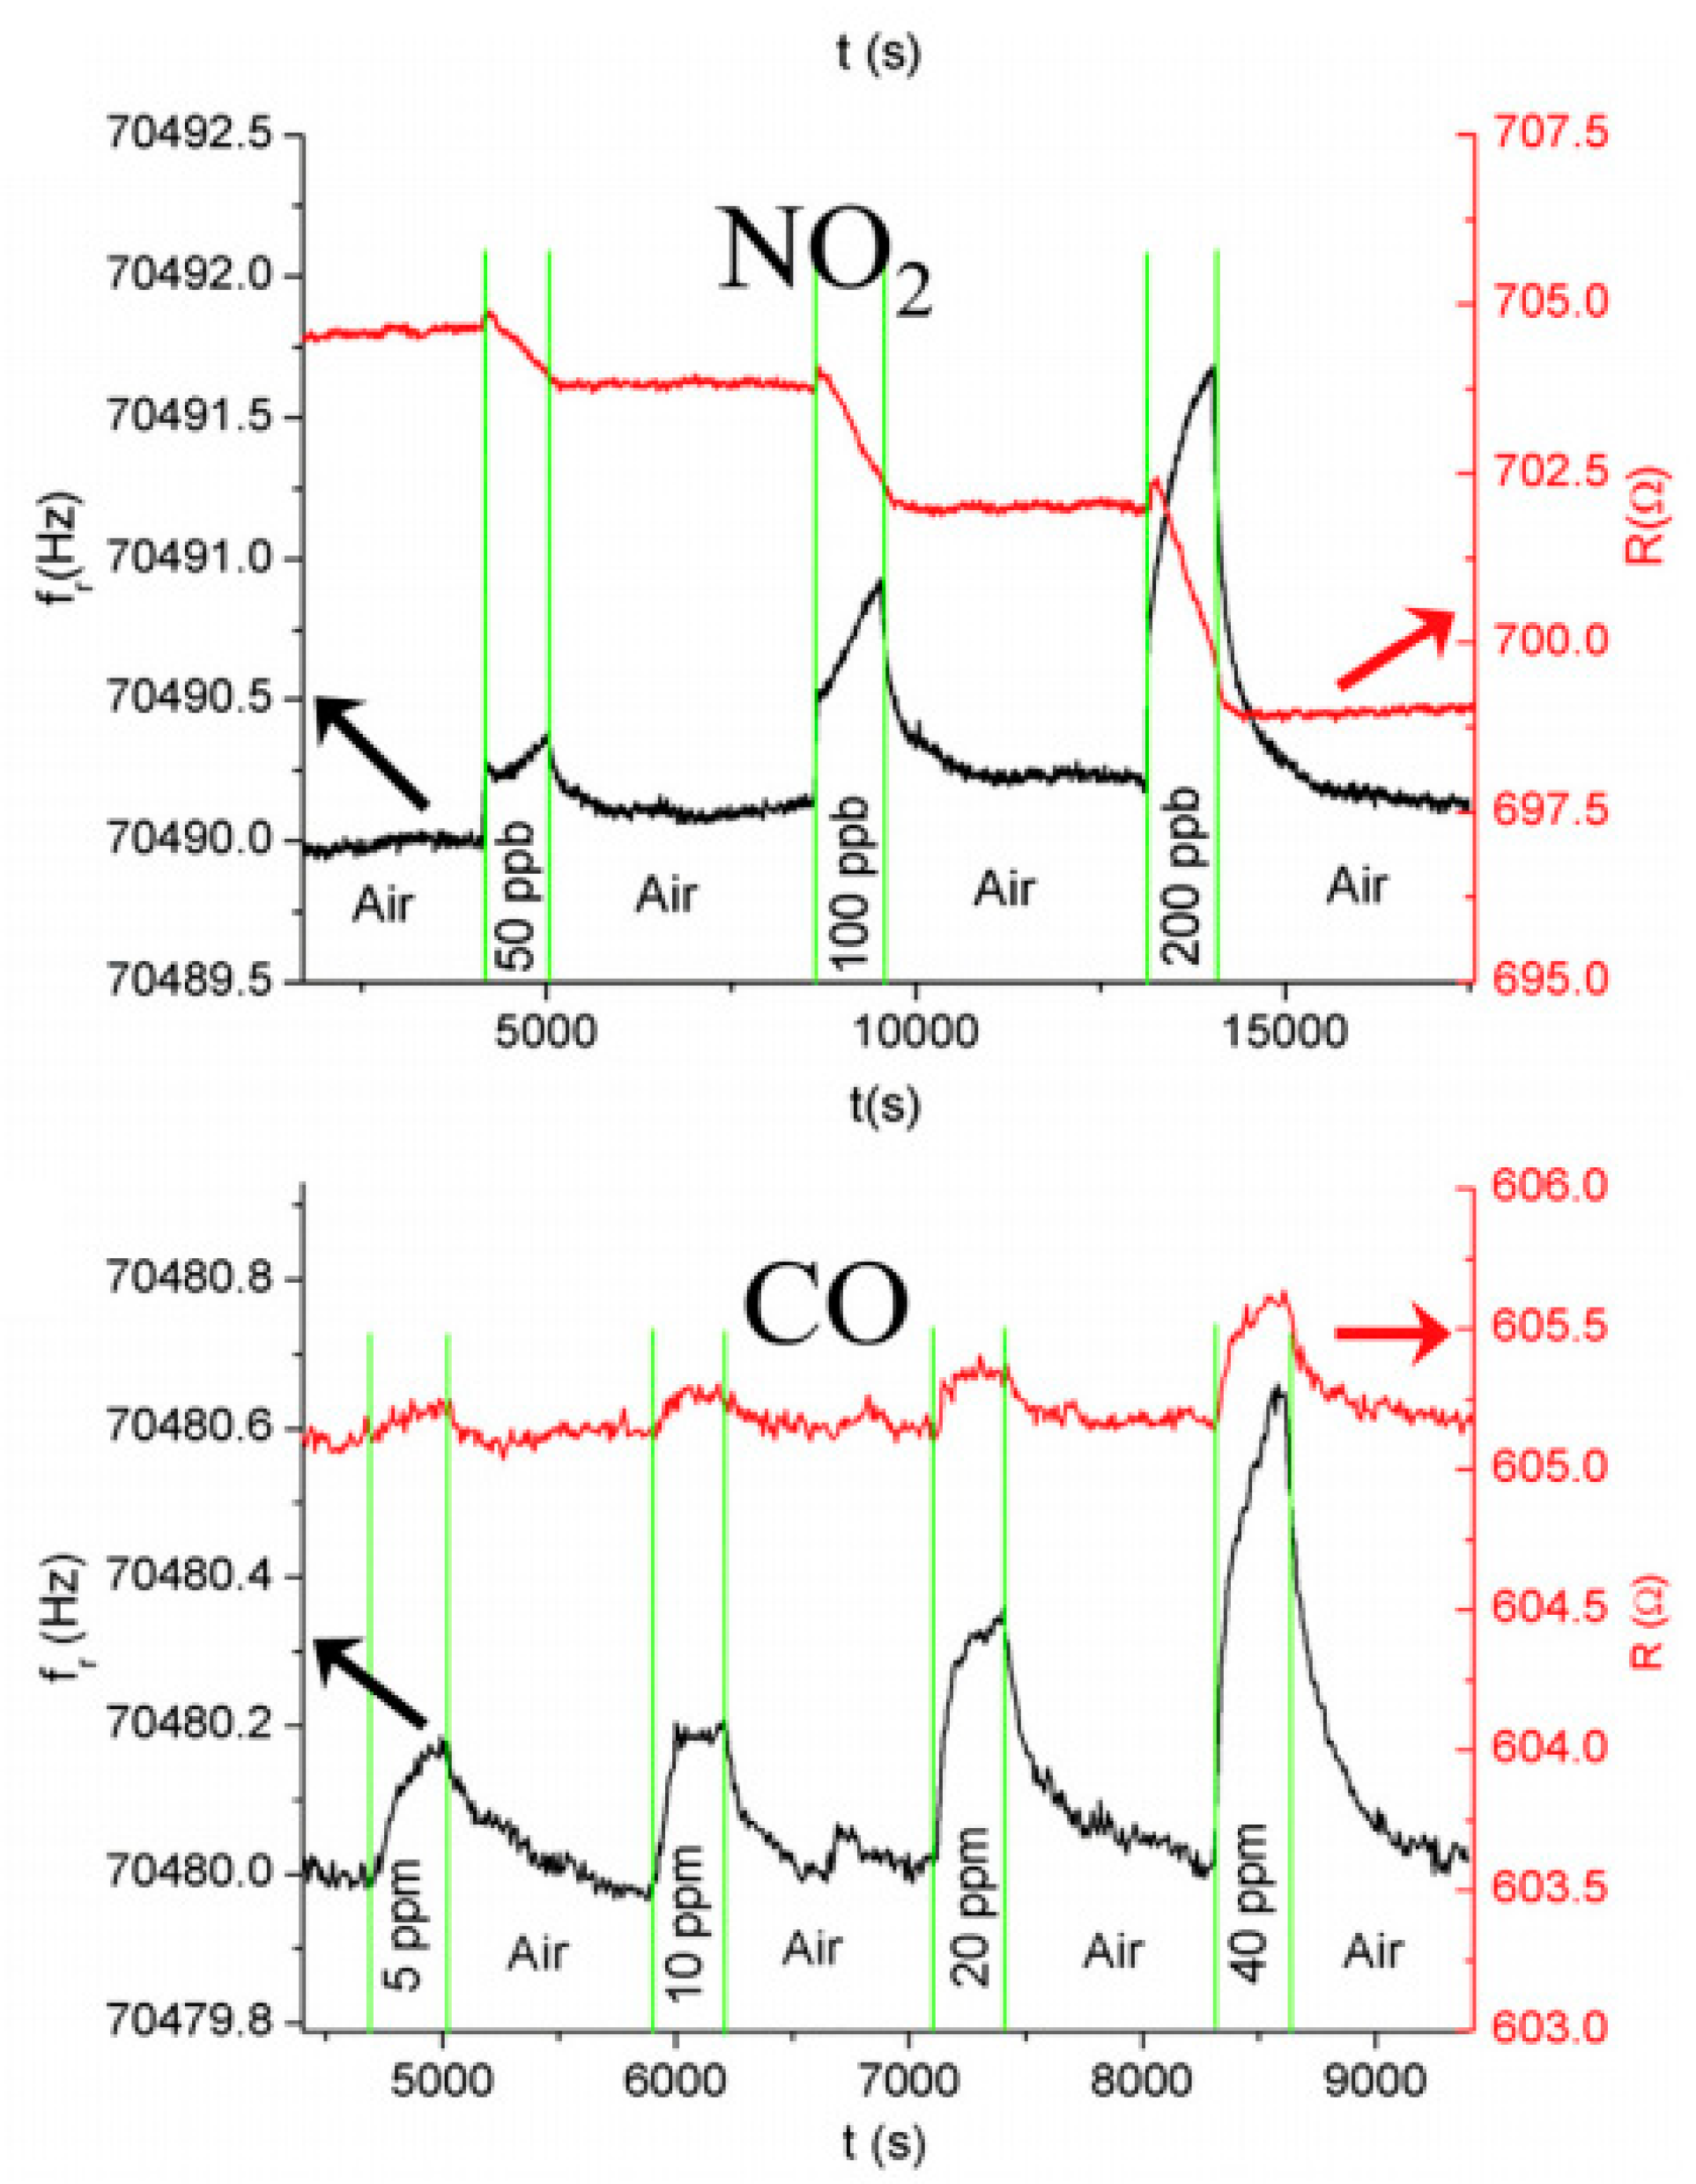
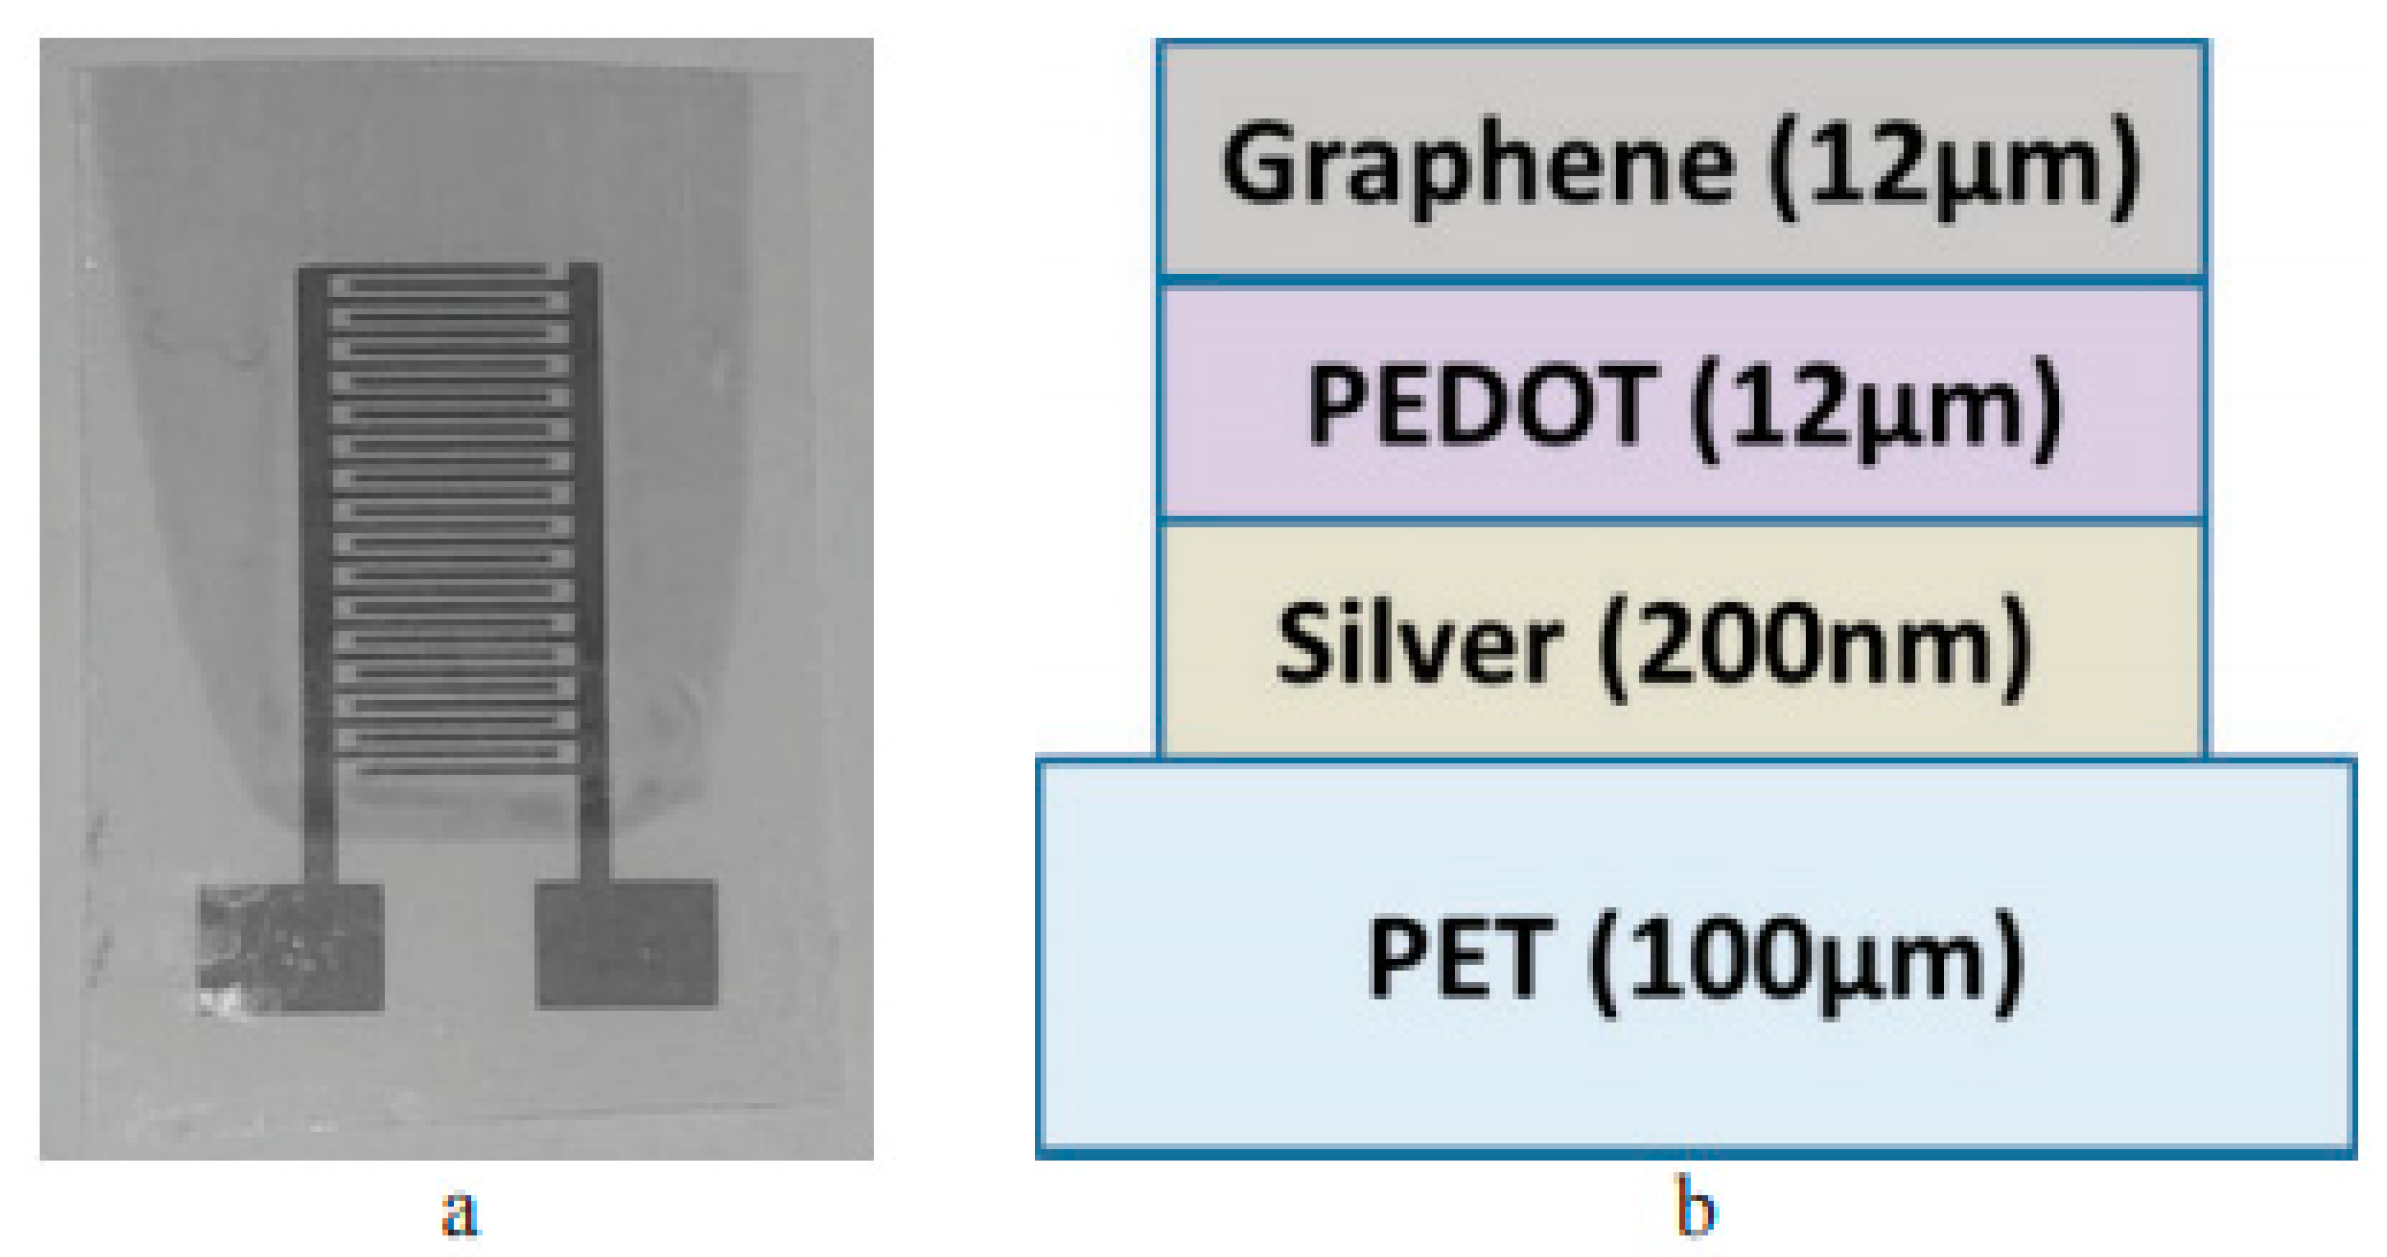
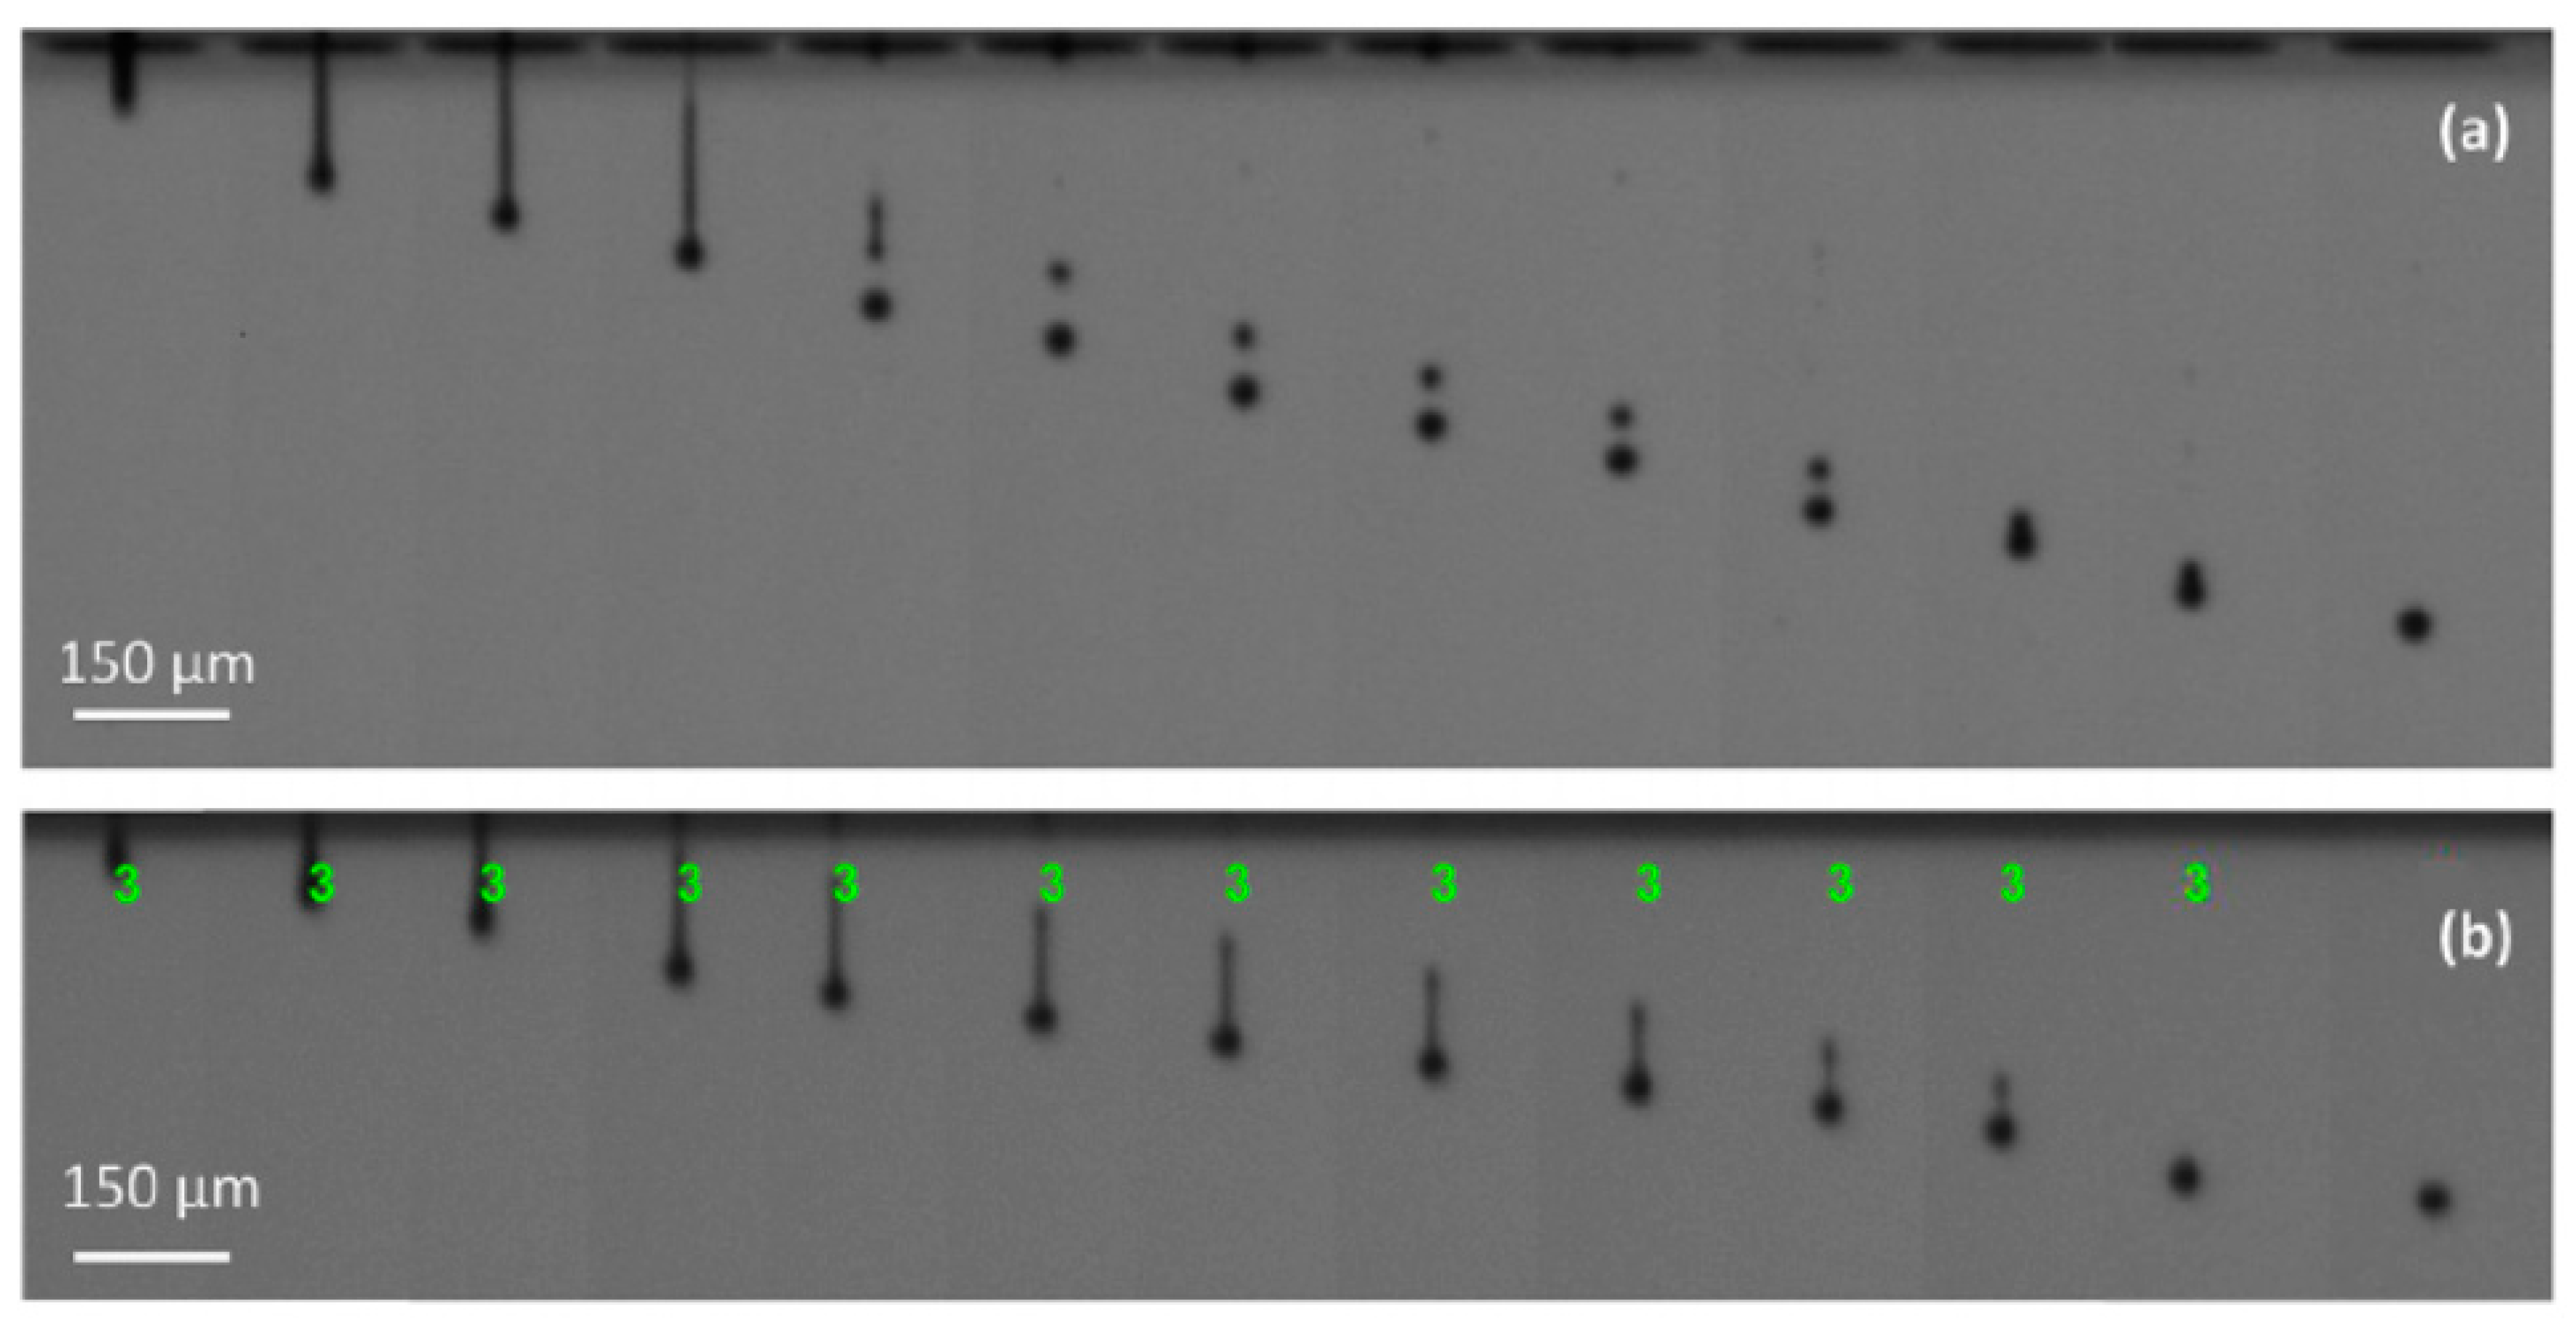
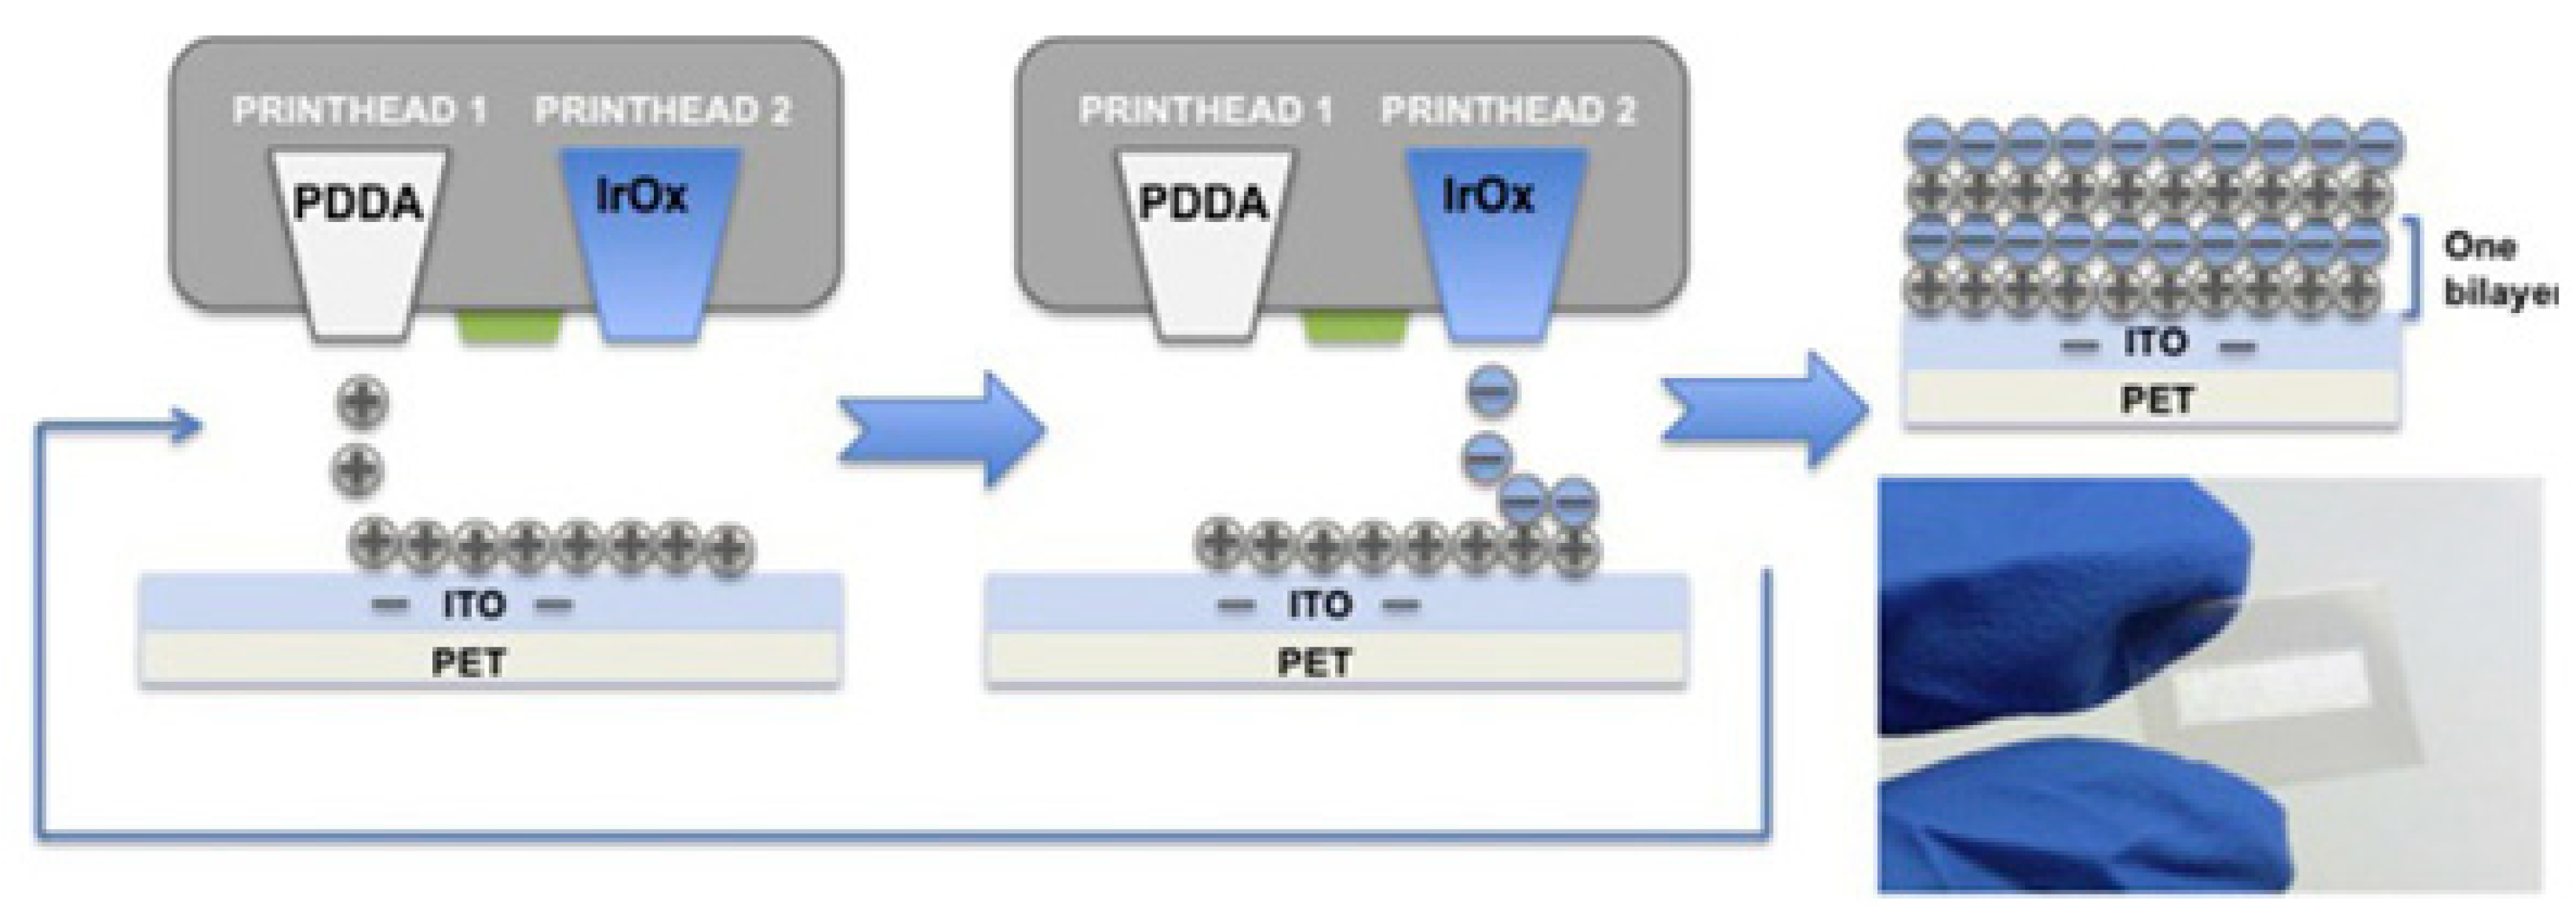
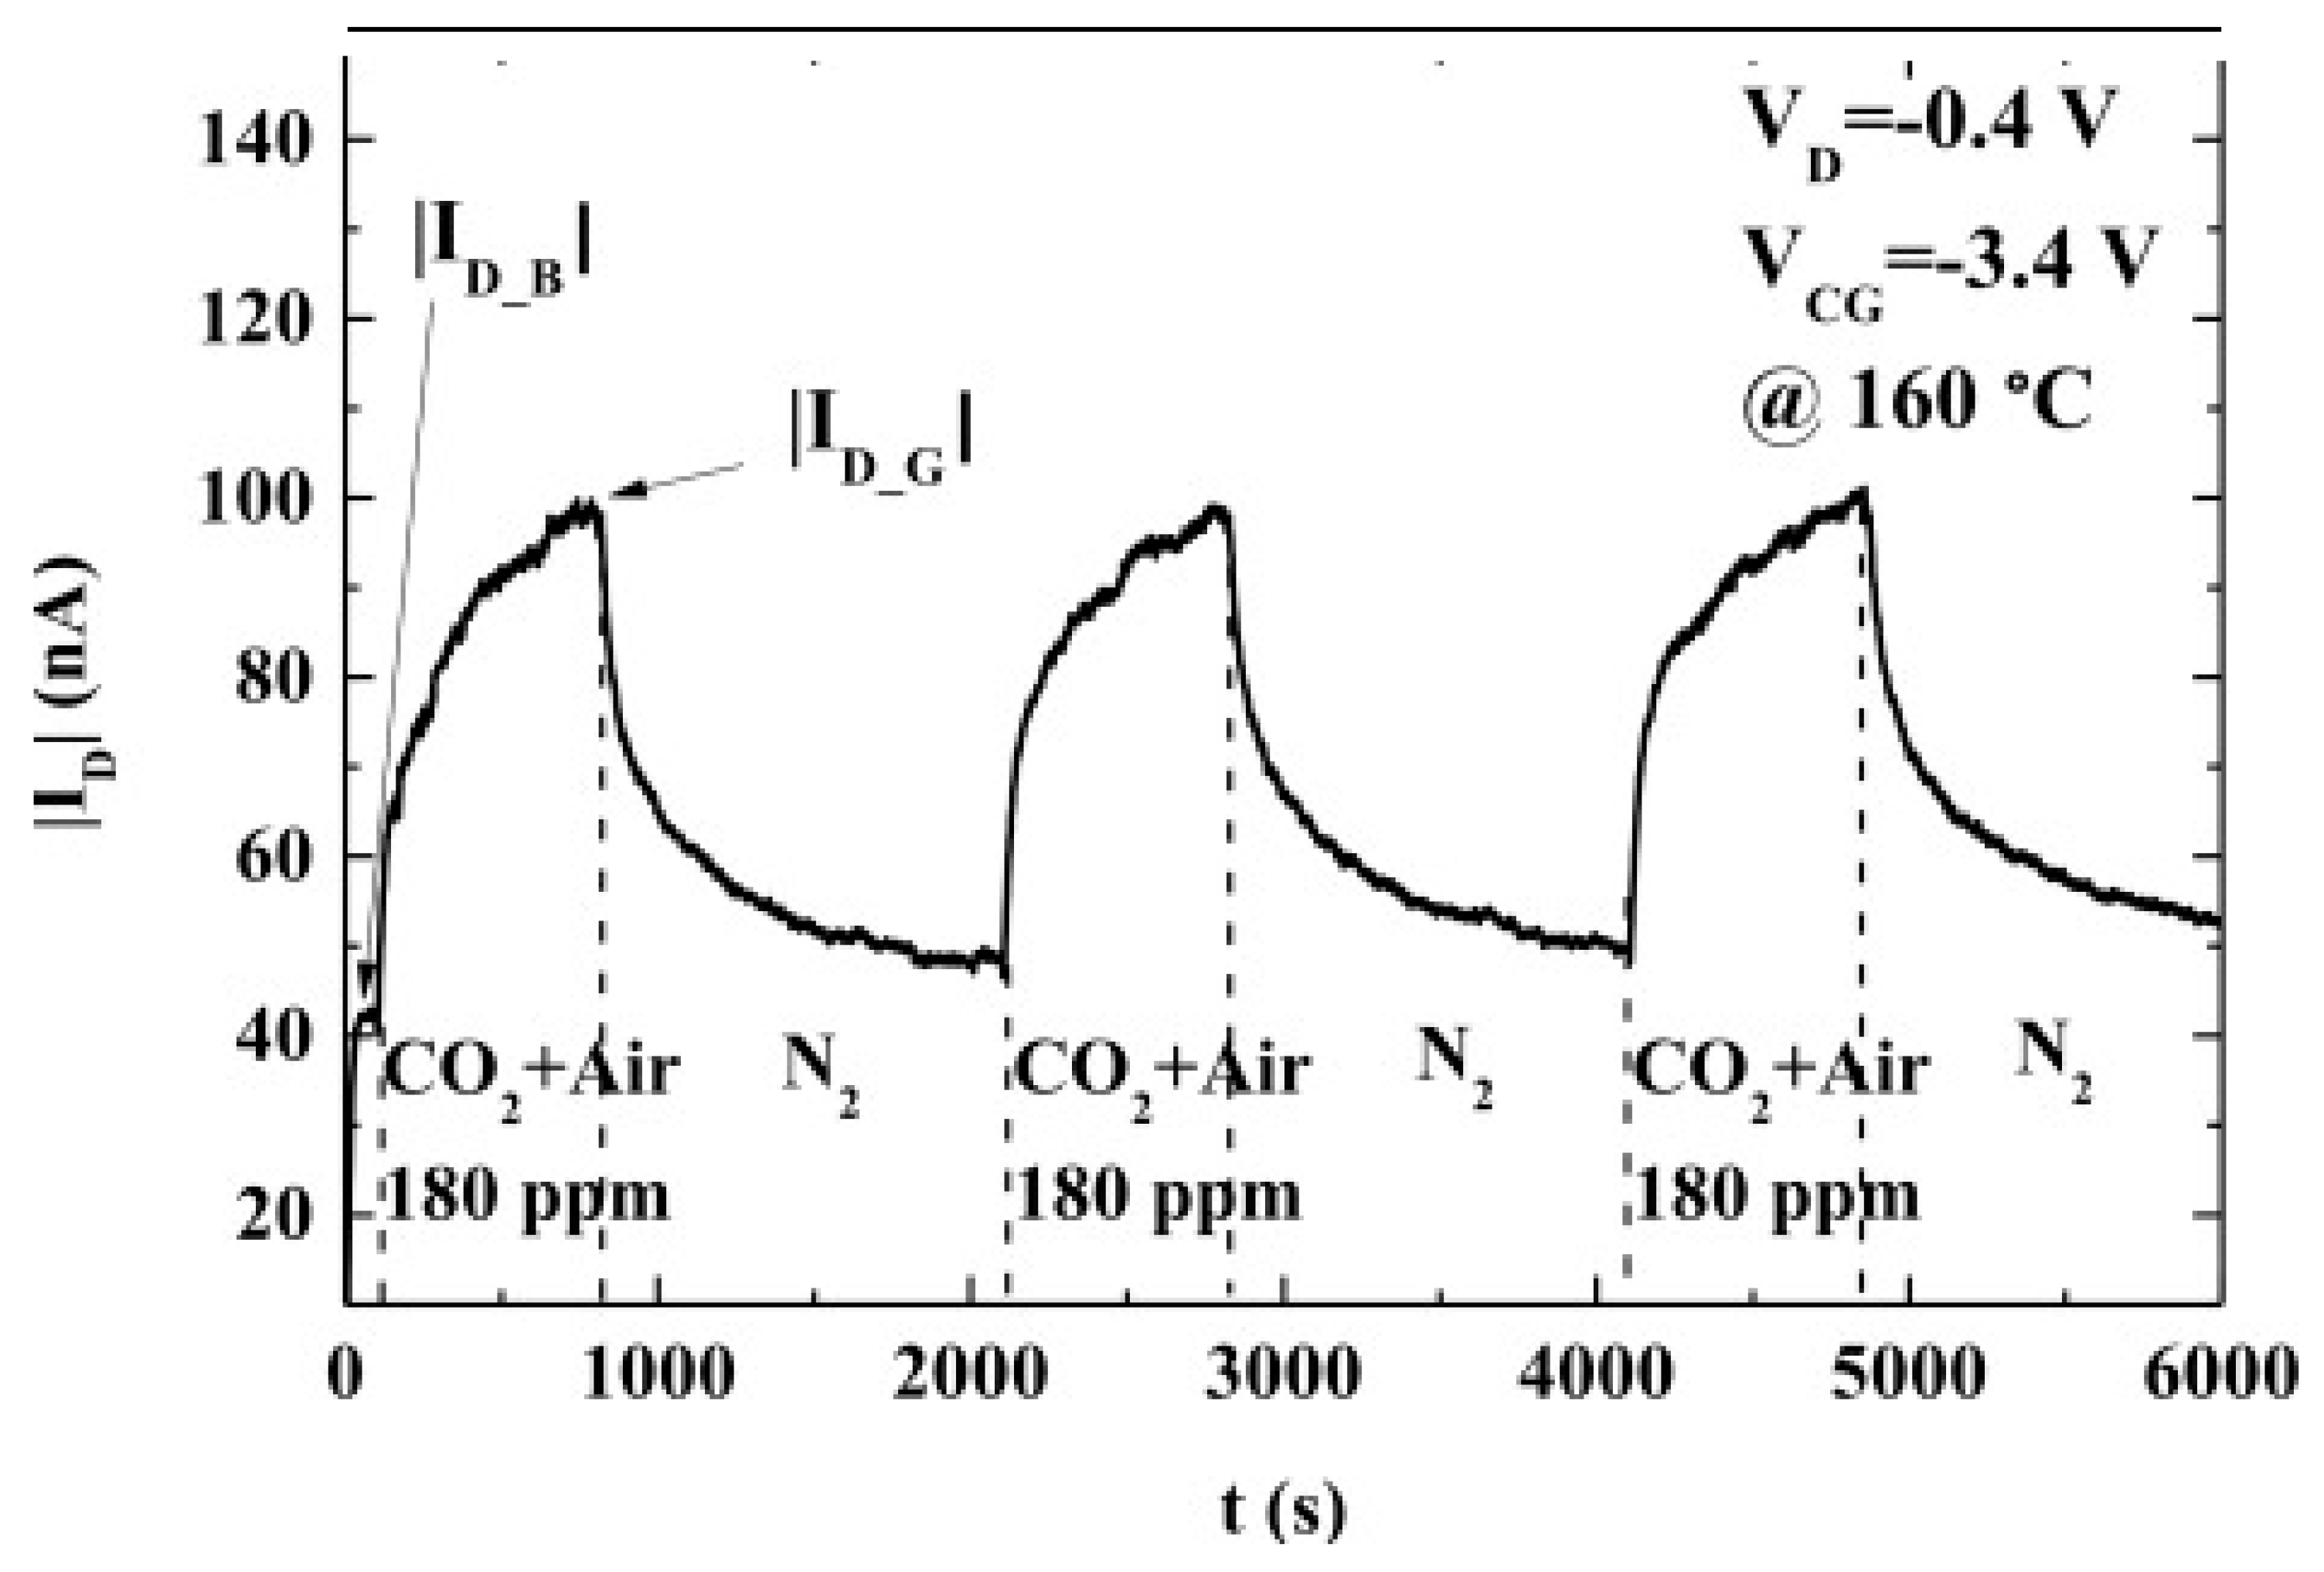
Table 1.
The CO2 concentrations in the atmosphere, pH value, and equilibrating species concentrations.
Table 1.
The CO2 concentrations in the atmosphere, pH value, and equilibrating species concentrations.
| CO2 (Gas, ppm) | pH | Concentration [CO2] | Concentration [H2CO3] | Concentration [HCO3] | Concentration [CO32−] |
|---|---|---|---|---|---|
| 1.0 × 10⁻¹ | 6.94 | 3.36 nM | 5.71 pM | 5.90 nM | 1.90 pM |
| 1.0 × 100 | 6.81 | 33.6 nM | 57.1 pM | 91.6 nM | 33.0 pM |
| 1.0 × 101 | 6.42 | 0.33 μM | 5.71 nM | 0.378 μM | 55.7 pM |
| 1.0 × 10² | 5.92 | 3.36 μM | 5.71 nM | 0.378 μM | 56.0 pM |
| 1.0 × 10³ | 5.42 | 33.6 μM | 57.1 nM | 3.78 μM | 56.1 pM |
| 1.0 × 10⁴ | 4.92 | 0.336 mM | 0.571 μM | 0.119 μM | 56.1 pM |
| 1.0 × 10⁵ | 4.42 | 3.36 mM | 5.71 μM | 0.378 μM | 56.1 pM |
| 1.0 × 10⁶ | 3.92 | 33.6 mM | 57.1 μM | 12.0 mM | 56.1 pM |
Table 2.
Commercialized carbon dioxide sensors for field experiments.
| Marketed by | Model | Concentration Range | Sensitivity | Response Time | Resolution | Comments |
|---|---|---|---|---|---|---|
| ELT Sensors | S-100H | 0–5 mmol/mol | 1 V/mmol/mol | 60 s | 70 nmol/mol | Uses 16 bits ADC with DAQ range of 5 V |
| Edinburgh sensors | Gas card NG | 0–1 mmol/mol | 1 V/0.1 mmol/mol | 10 s | 60 nmol/mol | Uses 14 bits ADC with DAQ range of 10 V |
Resistive sensor. (Type 1 sensor) Rs: resistance of the sensor in ambient air; Ro: is the resistance when not exposed to air. ADC: analog-to-digital converter; DAQ: data acquisition.
Table 3.
Carbon dioxide sensing materials.
| Material | Detection Method | Operating Temperature (°C) | Detection Concentration | Response Time | Reference |
|---|---|---|---|---|---|
| Carbon nanotubes | Resistance | 0–2000 ppm | 3 s | [13] | |
| Gascard-NG | Current–Voltage | 0–1000 μmol/mol | 10 s | [23] | |
| Germanium | IR sensor | 30–70 | 10 ppm | [15,18] | |
| PANI | Resistance | Room temperature | 102–105 ppm | [18,19] | |
| Graphene | 22–60 | 0–100 ppm | [50] | ||
| Graphene | Devise Conductance Resistance | 10–100 ppm | 10 s | [50] | |
| LaOCl/SnO2 | Resistance | 350–450 | 0–4000 ppm | [53] | |
| La/SnO2 | Resistance | >100 | 500–2500 ppm | [53] | |
| CNT-polyionic liquids | Resistance | 500 ppt | [53,60] | ||
| Graphene | Resistance | Room temperature | 0–1500 ppm | [61] | |
| Polypyrrole | Resistance | 60 | 100–700 ppm | [62] | |
| 1-Ethyl-3-methyl-imidazolium Tetrafuloroborate ([EMIM][BF4]) as ionic liquid and polyvinylidene fluoridecohexafluoro propylene (PVDF-HFP) as polymer. | Impedance change | Ambient temperature | 0–3000 ppm | 50 min | [63] |
| Graphene oxide | Resistance | 0–2000 ppm | 3 s | [64] | |
| Pristine graphine/UV light | 200 ppt | [65] | |||
| Flexible graphene | Resistance | Variable | Low to high | [66] | |
| ZnSb2O6 | Resistance | 400 °C | 100–400 | [68] |
Table 4.
Several metal–oxide–semiconductor (MOS) materials have been examined for NOx detection.
| MOS | Operating Temperature (°C) | Response Time (s) | Detection Concentration ppm | Reference |
|---|---|---|---|---|
| ZnO | RT | 240 | 0.01 | [74] |
| ZnO | 200 | 60 | 0.1–1 | [75] |
| In2O3 | 250 | 600 | 0.1–100 | [77] |
| WO3 | 300 | 80–300 | 0.5 | [78] |
| WO3 | 300 | 0.5–2.5 | [79] | |
| SnO2 | 300 | 0.5 | [85] | |
| WO3 | 350 | 180 | 1 | [86] |
Table 5.
The NO2 sensors fabricated with different materials.
| Sensor Material | Operating Temperature | Concentration ppm | Response, S (%) | Response/Recovery Time (s) | Reference |
|---|---|---|---|---|---|
| SnO2 nanofibers | 200 °C | 1–5 | 97%/5 ppm | 85/110 | [94] |
| SnO2 core/ZnO shell | RT, UV assisted | 1–5 | 600%/5 ppm | 100/220 | [95] |
| Reduced graphene oxide-ZnO | 80 °C | 1–25 | 25%/5 ppm | 164/499 | [96] |
| Graphene-WO3 | 250 °C | 1–20 | 140%/5 ppm | 45/50 | [97] |
| CNT thin film | 165 °C | 10–100 | 71%/100 ppb | >30 min | [98] |
| ZnO nano structure | RT | 5–20 | 1100%/5 ppm | 72/69 | [99] |
Table 6.
Metal oxide sensors for N2O.
| Oxide | Resistance in Air, Ra (Ω) | Sensitivity to 300 ppm N2O | Temperature (°C) |
|---|---|---|---|
| Cr2O3 | 3.5 × 10⁵ | 0.98 | 400 |
| Mn2O3 | 2.8 × 10⁵ | 1.00 | 400 |
| CO3O4 | 1.0 × 10⁴ | 0.98 | 400 |
| NiO | 2.8 × 10⁵ | 1.00 | 450 |
| CuO | 2.2 × 10⁶ | 0.98 | 300 |
| CdO | 5.3 × 10⁹ | 1.03 | 400 |
| MgO | 2.4 × 10¹⁰ | 1.00 | 500 |
| SrO | 5.6 × 10⁹ | 1.02 | 400 |
| BaO | 2.2 × 10¹⁰ | 1.02 | 500 |
| In2O3 | 3.6 × 10⁴ | 1.05 | 450 |
| SnO2 | 5.8 × 10⁵ | 1.66 | 450 |
| WO3 | 8.5 × 10⁵ | 1.32 | 450 |
| ZnO | 2.8 × 10⁶ | 1.21 | 450 |
| TiO2 | 4.9 × 10⁷ | 1.01 | 600 |
| V2O3 | 8.7 × 10⁵ | 1.00 | 400 |
| Fe2O3 | 3.9 × 10⁷ | 1.00 | 500 |
| GeO2 | l.2 × 108 | 1.00 | 400 |
| Nb2O5 | 9.6 × 10⁸ | 1.00 | 600 |
| MoO3 | 3.l × 109 | 1.00 | 500 |
| Ta2O5 | 2.7 × 10¹⁰ | 1.00 | 600 |
| La2O3 | 1.4 × 10⁹ | 1.10 | 600 |
| CeO2 | 3.9 × 10⁹ | 1.01 | 600 |
| Nd2O3 | 5.3 × 10⁹ | 1.00 | 500 |
Reproduced with permission from Reference [9]; Rg represents the resistance of the sensor in N2O. Sensitivity = (Rg/Ra).
Table 7.
Limits of detection of CO and NO2 using the SnO2 ink jet-printed sensors.
| Gas | Detection Level (ppm) | |||
|---|---|---|---|---|
| CO (ppm) | 0.5 (300 °C, dry air) | 24 (300 °C, wet air) | 0.4 (200 °C, dry air) | 46 (200 °C, wet air) |
| NO2 (ppm) | 6 (300 °C, dry air) | 9 (300 °C, wet air) | 1 (200 °C, dry air) | 6 (200 °C, wet air) |
Table 8.
Electrostatic Dispersants for Inkjet printing.
| Dispersant | Trade Name | Supplier |
|---|---|---|
| Aurintricarboxylic acid ammonium salt | Aluminon | Sigma-Aldrich, Saint Louis, MI, USA |
| Ammonium citrate | Sigma-Aldrich, Saint Louis, MI, USA | |
| Sodium sulfonate | Trion | Sigma-Aldrich, Saint Louis, MI, USA |
| Ammonium polyacrylate | Dispex-A40 | BASF, Ludwigshafen, Germany |
| Polymethylmethacrylate | Darvan-C | Vanderbilt Minerals, Saint Lawrence County, NY, USA |
| Ammonium polyacrylate | Dispex-A40 | BASF, Ludwigshafen, Germany |
© 2018 by the authors. Licensee MDPI, Basel, Switzerland. This article is an open access article distributed under the terms and conditions of the Creative Commons Attribution (CC BY) license (http://creativecommons.org/licenses/by/4.0/).
Share and Cite
MDPI and ACS Style
Santhanam, K.S.V.; Ahamed, N.N.N. Greenhouse Gas Sensors Fabricated with New Materials for Climatic Usage: A Review. ChemEngineering 2018, 2, 38. https://doi.org/10.3390/chemengineering2030038
AMA Style
Santhanam KSV, Ahamed NNN. Greenhouse Gas Sensors Fabricated with New Materials for Climatic Usage: A Review. ChemEngineering. 2018; 2(3):38. https://doi.org/10.3390/chemengineering2030038
Chicago/Turabian StyleSanthanam, Kalathur S. V., and Nuzhet Nihaar Nasir Ahamed. 2018. "Greenhouse Gas Sensors Fabricated with New Materials for Climatic Usage: A Review" ChemEngineering 2, no. 3: 38. https://doi.org/10.3390/chemengineering2030038