Article

Visible-Light-Driven Photocatalytic Fuel Cell with an Ag-TiO2 Carbon Foam Anode for Simultaneous 4-Chlorophenol Degradation and Energy Recovery

1
Key Laboratory of Groundwater Resources and Environment, Ministry of Education, Jilin University, Changchun 130021, China
2
The College of Environment and Resources, Jilin University, Changchun 130021, China
*
Author to whom correspondence should be addressed.
ChemEngineering 2018, 2(2), 20; https://doi.org/10.3390/chemengineering2020020
Submission received: 21 March 2018 / Revised: 5 April 2018 / Accepted: 23 April 2018 / Published: 7 May 2018

Abstract

:
Photocatalytic fuel cells (PFCs) are a sustainable technology with application in waste water treatment, in which energy is obtained from the photocatalytic degradation of organic pollutants. However, the application of PFCs is limited by the photoanode, in particular its low efficiency for treating recalcitrant pollutants. In this study, a double chamber PFC reactor was constructed. Visible-light-driven Ag-TiO2 photocatalyst supported carbon foam was used as the anode and platinum was used as the cathode. 4-Chlorophenol (4-CP) was used as a model pollutant in the cation chamber to investigate the efficiency of pollutant degradation and power generation. The effects of the electrolyte type and solution pH on the 4-CP degradation and power production were investigated. The results showed that 32.6% of 4-CP was degraded by the PFC in 6 h. Na2SO4 was the optimum electrolyte and had the least side effects on the degradation of 4-CP when compared with NaCl, NaHCO3 and NaH2PO4. The optimum pH range was 6.4–8.4 when sodium sulfate was used as the electrolyte. The power density was approximately 36.0 mW/m2 under the above experimental conditions.

1. Introduction

Chlorophenols are important industrial raw materials and are widely used in the production of solvents, dyes, preservatives, herbicides, insecticides and fungicides [1,2,3]. Organic matter containing chlorophenol residues is highly toxic and is resistant to degradation by conventional processes, owing to its benzene ring and chlorine atoms [4,5]. Photocatalytic oxidation by TiO2 has been demonstrated to be efficient for the degradation of chlorophenols [6,7]. However, the wide bandgap of TiO2 limits its utilization of solar energy to less than 4% [8]. Doping noble metals into TiO2 to form Schottky barriers can effectively inhibit the recombination of electron-hole pairs and improve photocatalytic efficiency under visible light irradiation [9].
Photocatalytic fuel cells (PFCs) can remove pollutants from waste water, while at the same time produce energy [10,11]. On the surface of photocatalytic anodes, the irradiation by photons produces electrons and holes is the basis for the chemical reaction of PFCs. Many materials have been developed as PFC anode supports, such as fluorine-doped tin oxide conducting glass [12,13], titanium sheet [14], and zinc sheet [15]. These two-dimensional electrodes are easily handled and incorporated into PFCs. However, their two-dimensional structures result in lower effective catalyst loadings and lower contact areas between the electrode and pollutant, when compared with three-dimensional anodes [16,17]. The use of metal electrodes also increases the electrode weight and introduces corrosion risks. Foam carbon electrodes have a three-dimensional structure and their characteristics include efficient conductivity and low density. The three-dimensional network structure also increases the relative contact area and thus the amount of adhered catalyst, which increases the electrode efficiency. In the PFC operation project, the choice of electrolyte will affect the PFC’s electricity production efficiency and photocatalytic efficiency. In many PFC research articles, the effect of a single electrolyte concentration PFC in the range of 0.05 M to 0.15 M is generally discussed [18,19,20]. Electrolytes and pH may have different effects on their photocatalytic effects due to the different reactive oxygen species (ROSs) and zero-point charge produced by different photocatalytic materials [21,22]. These factors may also affect the generation of electrical energy due to its different electrical conductivity. For the above reasons, electrolytes and pH are discussed in this article.
In the current study, a Ag-TiO2-coated carbon foam anode was prepared as a photoanode. The PFC prepared using this photoanode exhibited high photocatalytic activity under visible light irradiation. A double chamber PFC was constructed with 4-chlorophenol (4-CP) acting as a contaminant, to investigate the effectiveness of 4-CP degradation and stability of power generation by the PFC. The effects of the electrolyte and pH on the performance of the PFC were investigated. The results indicated that the PFC could degrade the 4-CP contaminant and exhibit efficient power generation.

2. Materials and Methods

2.1. Preparation and Characterization of Nanosize Ag-TiO2

The Ag-TiO2 sol was prepared via the modified sol-gel method and is described elsewhere [7]. X-ray diffraction (XRD) patterns were obtained using a powder X-ray diffractometer (RINT 2500, Rigaku Corporation, Tokyo, Japan) with Ni-filtered Cu Kα radiation in the 2θ range of 10° to 90°. Ultraviolet-visible diffuse reflectance spectra (UV-vis DRS) were recorded using a UV-2550 UV-vis spectrophotometer (Shimadzu Corporation, Kyoto, Japan) with BaSO4 as the reflectance standard. The scanning range was 200–800 nm. X-ray photoelectron spectra (XPS) were recorded using monochromatic Al Kα radiation on a Kratos Axis Ultra spectrometer, to analyze the surface chemical bonding states in the photocatalyst. The obtained spectra of the O 1s, Ti 2p, Ag 3d and C 1s states were calibrated against the C 1s signal at a binding energy (BE) of 284.6 eV. Scanning electron microscopy (SEM) images were collected using a Quanta 200 field-emission scanning electron microscope. Images were collected at an accelerating voltage of 10.0 kV and were used to observe the catalyst loaded on the foam carbon electrode.

2.2. Preparation and Photocatalytic of the Ag-TiO2 Photoanode

The conductive carbon foam (80 pores per linear inch, ERG Aerospace Corp., Oakland, CA, USA) was 40 mm in length, 25 mm in width and 3 mm in thickness. The carbon foam was pretreated using 1 M HNO3, acetone and anhydrous ethanol, successively. Ag-TiO2 nanoparticles were dispersed in anhydrous ethanol to obtain a 20 g/L solution. A given amount of this solution was sprayed onto the carbon foam, which was then dried at 60 °C. This procedure was repeated until each anode had coated 0.1 ± 0.02 g Ag-TiO2 nanoparticles. This weight load of photocatalyst was addressed in our previous work [7].
The photocatalytic activity of the photoanode was evaluated by the photocatalytic degradation of 4-CP under visible light irradiation. Visible light irradiation was provided by a 150 W Xenon lamp (CEL-HXF 300, Beijing Education Au-light Co., Ltd., Beijing, China) with 420–780 nm filter glasses (ultraviolet-infrared cut-off filter: CEL-UVIRCUT420-780). The power irradiation of Xenon lamp we used was 276,000 W/m2. The distance between the light source and photoanode was 13 cm. The prepared photoanode was immersed in an aqueous solution of 4-CP (50 mL, 20 mg L−1). The Ag-TiO2 and TiO2 powder concentration was 0.2 g/L. The 4-CP concentration was determined by measuring the absorbance of aliquots of sample at a wavelength of 279 nm, using an UV-vis spectrophotometer UV2800 (Shanghai Shun Yu Heng Ping Co., Ltd., Shanghai, China). The total organic carbon (TOC) was detected by Total Organic Carbon Analyzer TOC-L CPH Basic System (Shimadzu Co., Japan). The pH was measured using a Rex laboratory pH meter PHS-3E (Shanghai INESA Scientific Instrument Co., Ltd., Shanghai, China). The pH of the unadjusted electrolyte was 6.2. Sulfuric acid or sodium hydroxide were added to adjust the pH as required.

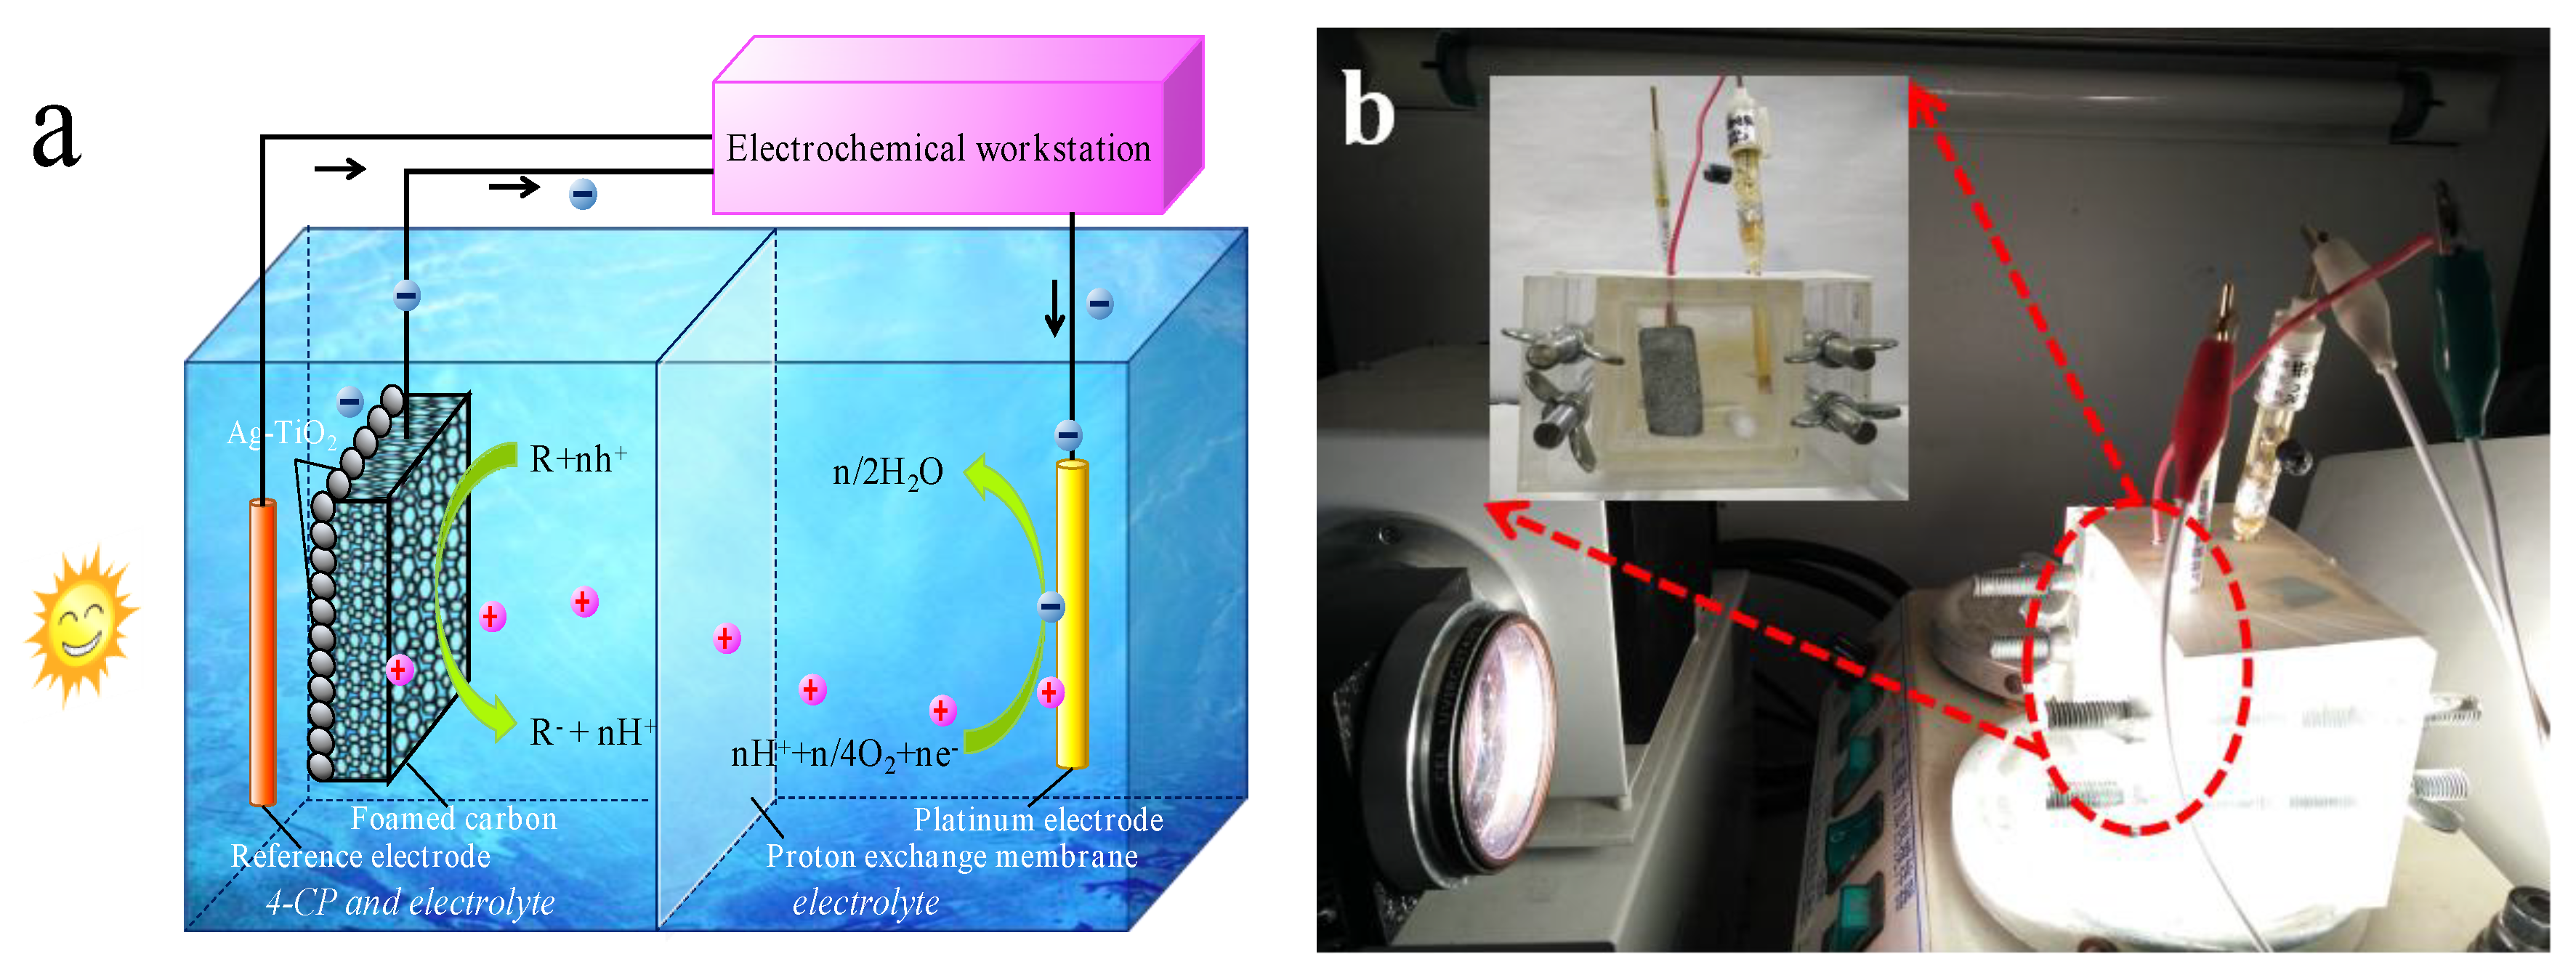
2.3. Photocatalytic Fuel Cell Set-Up and Operation

The flat-plate double-chamber electrolysis cell used in this study is shown in Figure 1. The volumes of the anode and cathode chambers were 50 mL and a proton exchange membrane (N117, DuPont, Wilmington, DE, USA) was used to isolate these two chambers. The Ag-TiO2 photoanode and a magnetic stirrer were immersed in 20 mg L−1 4-CP solution in the anode chamber. A 1 cm × 1 cm platinum wire was used as the cathode and a saturated calomel electrode was used as the reference electrode. The irradiation conditions were the same as for the photocatalytic analysis of the photoanode. The electric current during the photocatalytic degradation process was recorded once per second by a CHI-660e electrochemical workstation (Shanghai Chenhua, Shanghai, China).

2.4. Photocatalytic Fuel Cell Set-Up and Operation

All electrochemical measurements were conducted after standing for 6 h to ensure that the system had reached equilibrium and were performed using a CHI-660e instrument (Shanghai Huachen Instrument Co., Ltd., Shanghai, China). The electrolyte concentration was 0.05 M and the current was measured was once per second. Four sodium salts (NaSO4, NaCl, NaHCO3, NaH2PO4, all from Beijing Chemical Works, Beijing, China) of the same concentration were used as electrolyte solutions for 4-CP degradation by the PFC anode. Linear sweep voltammetry (LSV) measurements were performed in the range between −0.5 V and +0.5 V, at a scan rate of 0.1 V/s. The current was measured using a CHI-660e instrument, during chopping (on-off mode) irradiation. A saturated calomel electrode was used as the reference electrode.
The power density (P) was calculated from [23]:
P = JSC × VOC/A
where JSC is the short-circuit current density (mA), A is the surface area of the anode (m2) and VOC is the open-circuit voltage (V). The fill factor (FF) was calculated from:
FF = Pmax/(JSC × VOC)
where Pmax is the maximum output power density.

3. Results and Discussion

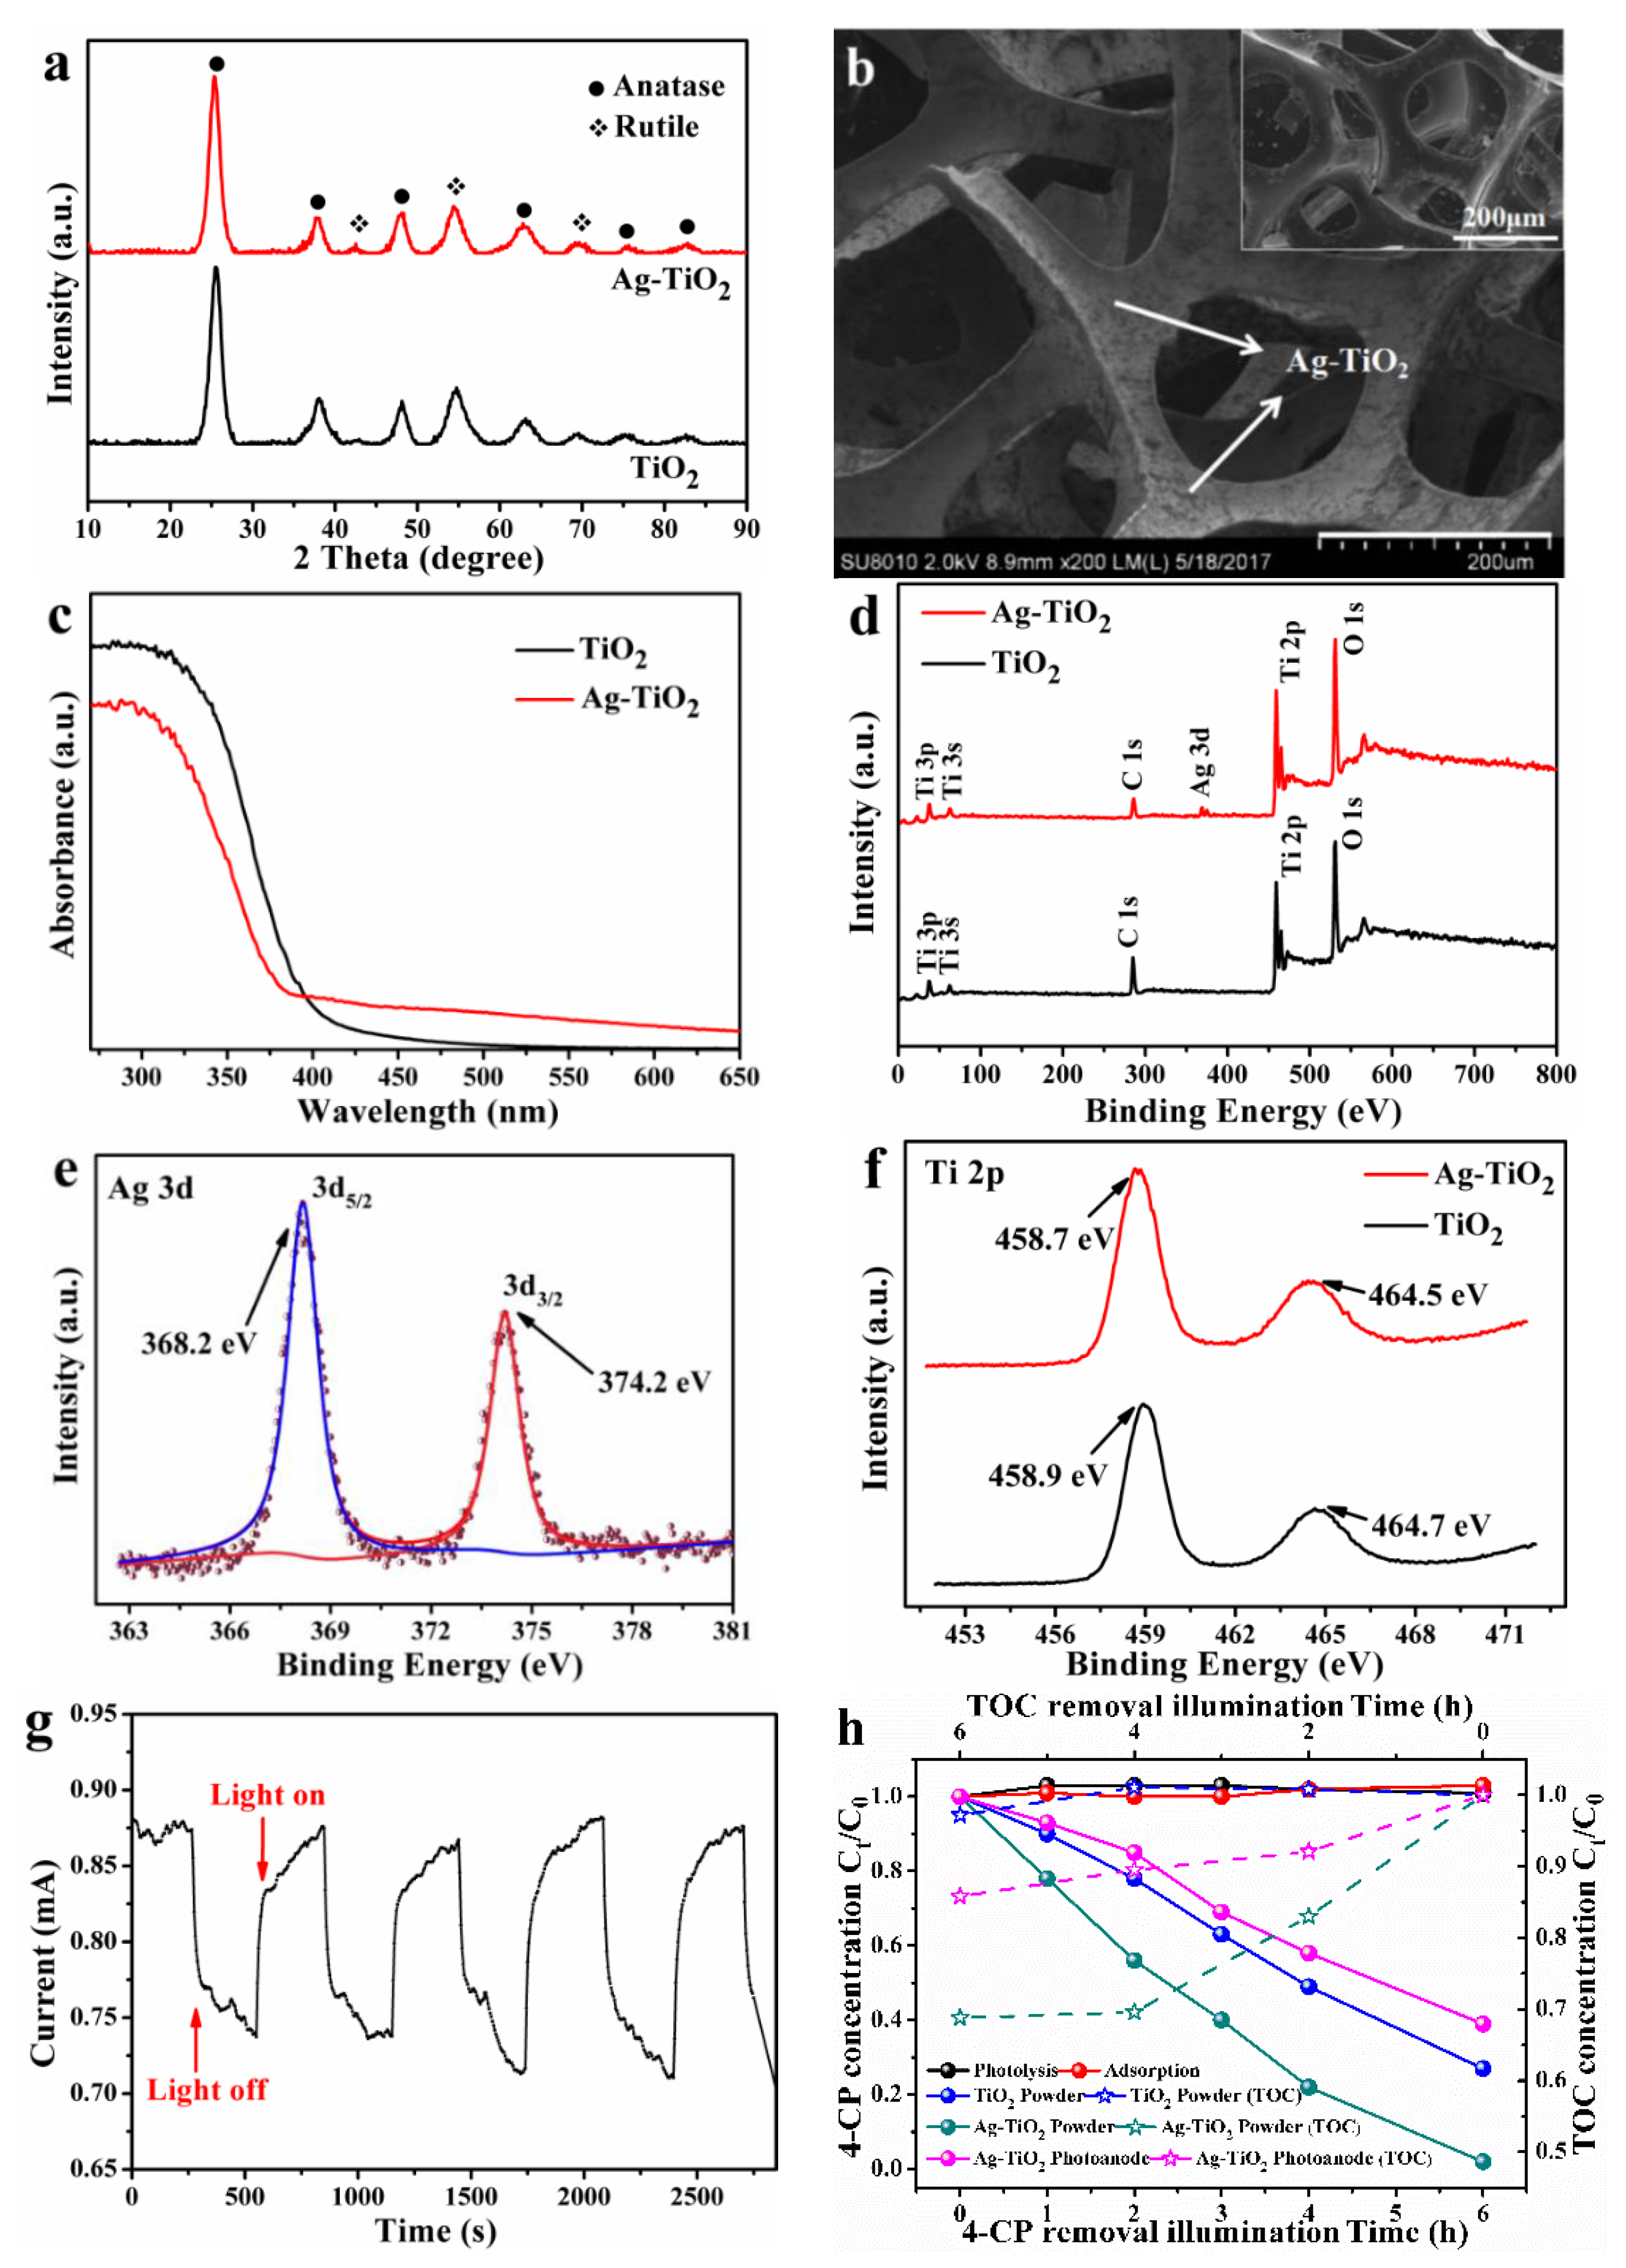
3.1. Characterization and Performance of the as-Prepared Ag-TiO2

The characterization and photocatalytic performance of as prepared catalyst and electrode were showed in Figure 2.
Figure 2a shows XRD patterns of the as-prepared TiO2 and Ag-TiO2 powders. Compared with the JCPDS files [24,25], the XRD patterns show that the as-prepared TiO2 and Ag-TiO2 powders were a mixture of anatase and rutile TiO2. Many studies have reported that the combination of rutile and anatase exhibits higher photocatalytic activity than pure anatase [25,26,27]. No obvious differences were observed in the XRD patterns of the TiO2 and Ag-TiO2 powders, which was attributed to the low Ag doping [28].
Figure 2b shows an SEM image of the Ag-TiO2 composite. The sample was uniformly coated and the structure of the foam carbon showed no obvious cracks. The Ag-TiO2 catalyst was densely adhered to the inside of the foam electrode and did not appear to clog the porous foam structure. This provided the basis for increasing the catalyst loading to increase the contact between the Ag-TiO2 photocatalyst and solute including 4-CP and electrolytes.
Figure 2c shows UV-vis DRS spectra of the as-prepared Ag-TiO2 and pure TiO2 nanoparticles. Pure TiO2 absorbed more strongly than Ag-TiO2 at wavelengths less than 400 nm. We did not observe any red shift in the adsorption of TiO2 after doping with Ag, as was reported by Choi et al. [29]. However, Ag-TiO2 exhibited stronger absorption at wavelengths higher than 400 nm (i.e., the visible region), compared with pure TiO2. This may have been due to the surface plasmon resonance of Ag, which promoted the excitation of electrons from the valence band to the conduction band [30].
Figure 2d shows XPS survey spectra of the TiO2 and Ag-TiO2 powders. The C1s peak at 284.6 eV resulted from adventitious hydrocarbon within the XPS instrument. The XPS peak for Ag in the spectrum of Ag-TiO2 confirmed the presence of the Ag dopant (Figure 2d). The spectrum of the Ag 3d region of Ag-TiO2 (Figure 2e) contained peaks at 368.2 eV and 374.2 eV, which corresponded to the Ag 3d5/2 and Ag 3d3/2 states, respectively. This indicated the formation of metallic Ag [31]. The difference in BE values of the Ag 3d5/2 and 3d3/2 peaks was 6.0 eV, which was also characteristic of metallic Ag [32]. The doping of Ag resulted in a +0.2 eV shift in the BE values of the Ti 2p3/2 and Ti 2p5/2 states (Figure 2f). This indicated a strong interaction between the Ag and TiO2, which was expected to promote electron transfer from the TiO2 to Ag [33].
Figure 2g shows that during on/off irradiation cycles, the photocurrent underwent a large instantaneous change and that this change was stable across several cycles. This demonstrated that the Ag-TiO2 catalyst realized the separation of electron-hole pairs during visible light irradiation. The separation of electron-hole pairs is the basis for 4-CP degradation by the PFC [30].
Figure 2h shows photocatalytic degradation of 4-CP and TOC analysis of prepared photocatalyst and photoanode. The degradation of 4-CP by TiO2, Ag-TiO2 catalyst powder and the photoanode during 6 h was 73.4%, 98.4% and 61.8%, respectively. The higher degradation about Ag-TiO2 catalyst could explain by doping Ag nanoparticles into the TiO2 significantly increased the 4-CP degradation rate. The decrease in the 4-CP degradation concentration of the photoanode resulted from the lower contact area between the 4-CP and Ag-TiO2 catalyst. The photolysis curve and adsorption curve showed no reduction in 4-CP concentration. This indicated that the carbon foam did not interfere with 4-CP degradation and confirmed the photocatalytic activity of the Ag-TiO2 catalyst. The TOC losses by TiO2, Ag-TiO2 catalyst powder and the photoanode during 6 h were 2.8%, 31.2% and 14.2%, respectively. All TOC losses were less than the losses of 4-CP, this indicates partial mineralization of the degraded 4-CP. The Ag-TiO2 photocatalyst and photoanode performed a better oxidation than TiO2 photocatalyst as the same reason in 4-CP degradation.

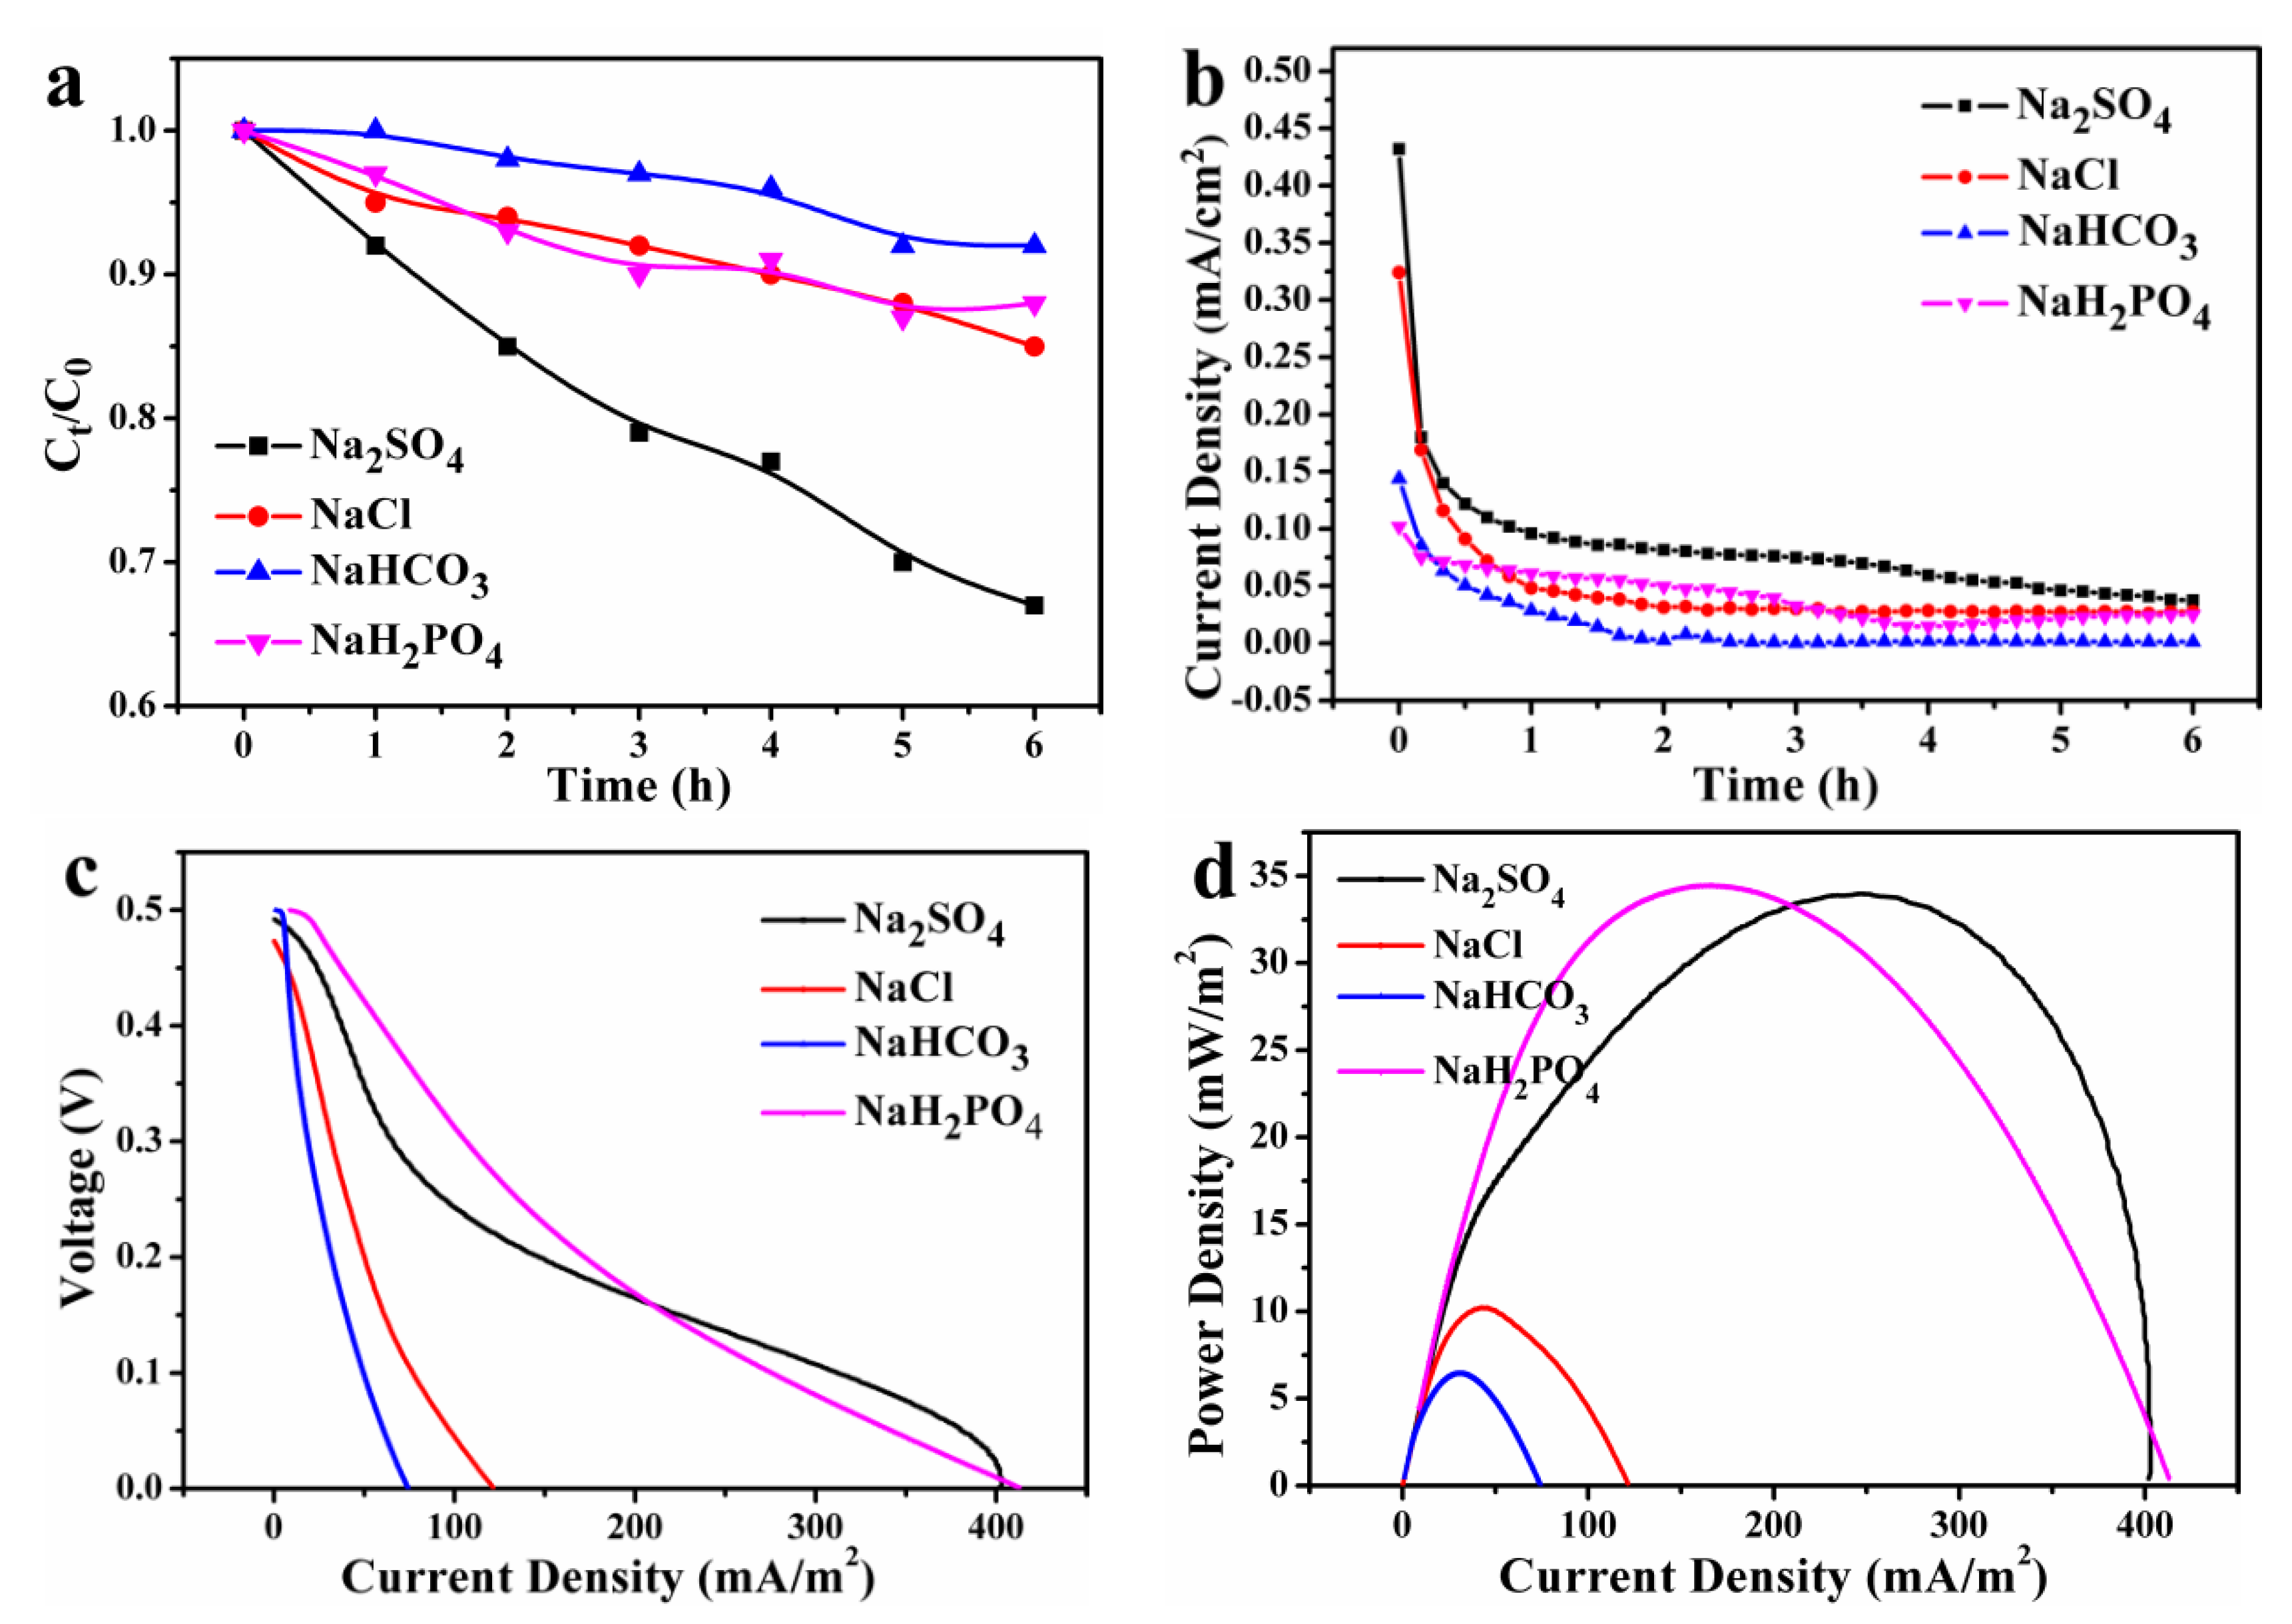
3.2. Effect of Electrolyte on PFC Performance

Anions have an important influence on the photocatalytic process [12,34,35]. Anions can compete with target contaminants for ROSs. Four anions (SO42−, Cl, HCO3 and H2PO4) were used to identify the influence of the anion on the PFC operation. Figure 3a shows that the degradation efficiency after 6 h when using sodium sulfate as the electrolyte was higher than when using the other electrolytes. This indicated that the presence of SO42− had less effect on the photocatalytic process than Cl, HCO3 and H2PO4. We previously reported that the Ag-TiO2 photocatalysis system was dominated by H2O2 and was assisted by hydroxyl radicals (•OH) [36]. The photocatalytic ROS in the TiO2 chain reaction can be described by the following reactions [21]:
TiO2 + hν → e + h+
h+ + H2O → •OH + H+
h+ + OH → •OH
O2 + e → •O2
•O2 + H+ → HO2
2HO2• → O2 + H2O2
H2O2 + O2 → •OH + OH + O2
The chain reaction suggests that reduced O2 in the conduction band was the source of H2O2. However, photoelectrons were transferred to the cathode in the PFC. The lack of H2O2 was the main reason for the lower photocatalytic efficiency of the 4-CP degradation.
H2O2 can be regarded as an acid according to the reversible reaction:
H2O2 ⇌ H+ + HO2
Electrolyte anions such as HCO3 and H2PO4 could not be oxidized by H2O2. The hydrolysis of HCO3 and ionization of H2PO4 exerted a significant influence on H2O2, by reducing the amount of H2O2 and weakening its oxidation ability, respectively. Cl could be oxidized to ClO• by •OH [37]. Although •OH played a supporting role in the PFC, the consumption of •OH adversely affected 4-CP degradation, even more than the presence of SO42. SO42 adsorption on TiO2 and its displacement of surface hydroxyl groups [34] were less detrimental to 4-CP degradation than the presence of the other three anions. This phenomenon is demonstrated by the results in Figure 3b. The PFC system containing sodium sulfate as the electrolyte exhibited the highest current density of approximately 0.9 mA/cm2.
Figure 3c,d show current-voltage and current-power plots of the PFC during operation. The highest Pmax of 34.0 mW/m2 and the highest FF of 19.3% were obtained when using Na2SO4 as the electrolyte. The Pmax in the NaH2PO4 electrolyte (29.4 mW/m2) was very close to that in Na2SO4. The PFC systems with NaHCO3 and NaCl electrolytes exhibited lower Pmax values of 6.4 mW/m2 and 10.2 mW/m2, respectively. This may have been due to the small amount of electrolyte charge caused by the increase in ohmic polarization. The FF values for the PFCs containing the four electrolytes were all in the range of 16.7–17.8%. The similar FF values are consistent with published studies, which have demonstrated the stability of the resistance for a given electrolyte [38]. In summary, sodium sulfate was the most suitable electrolyte for the current PFC.

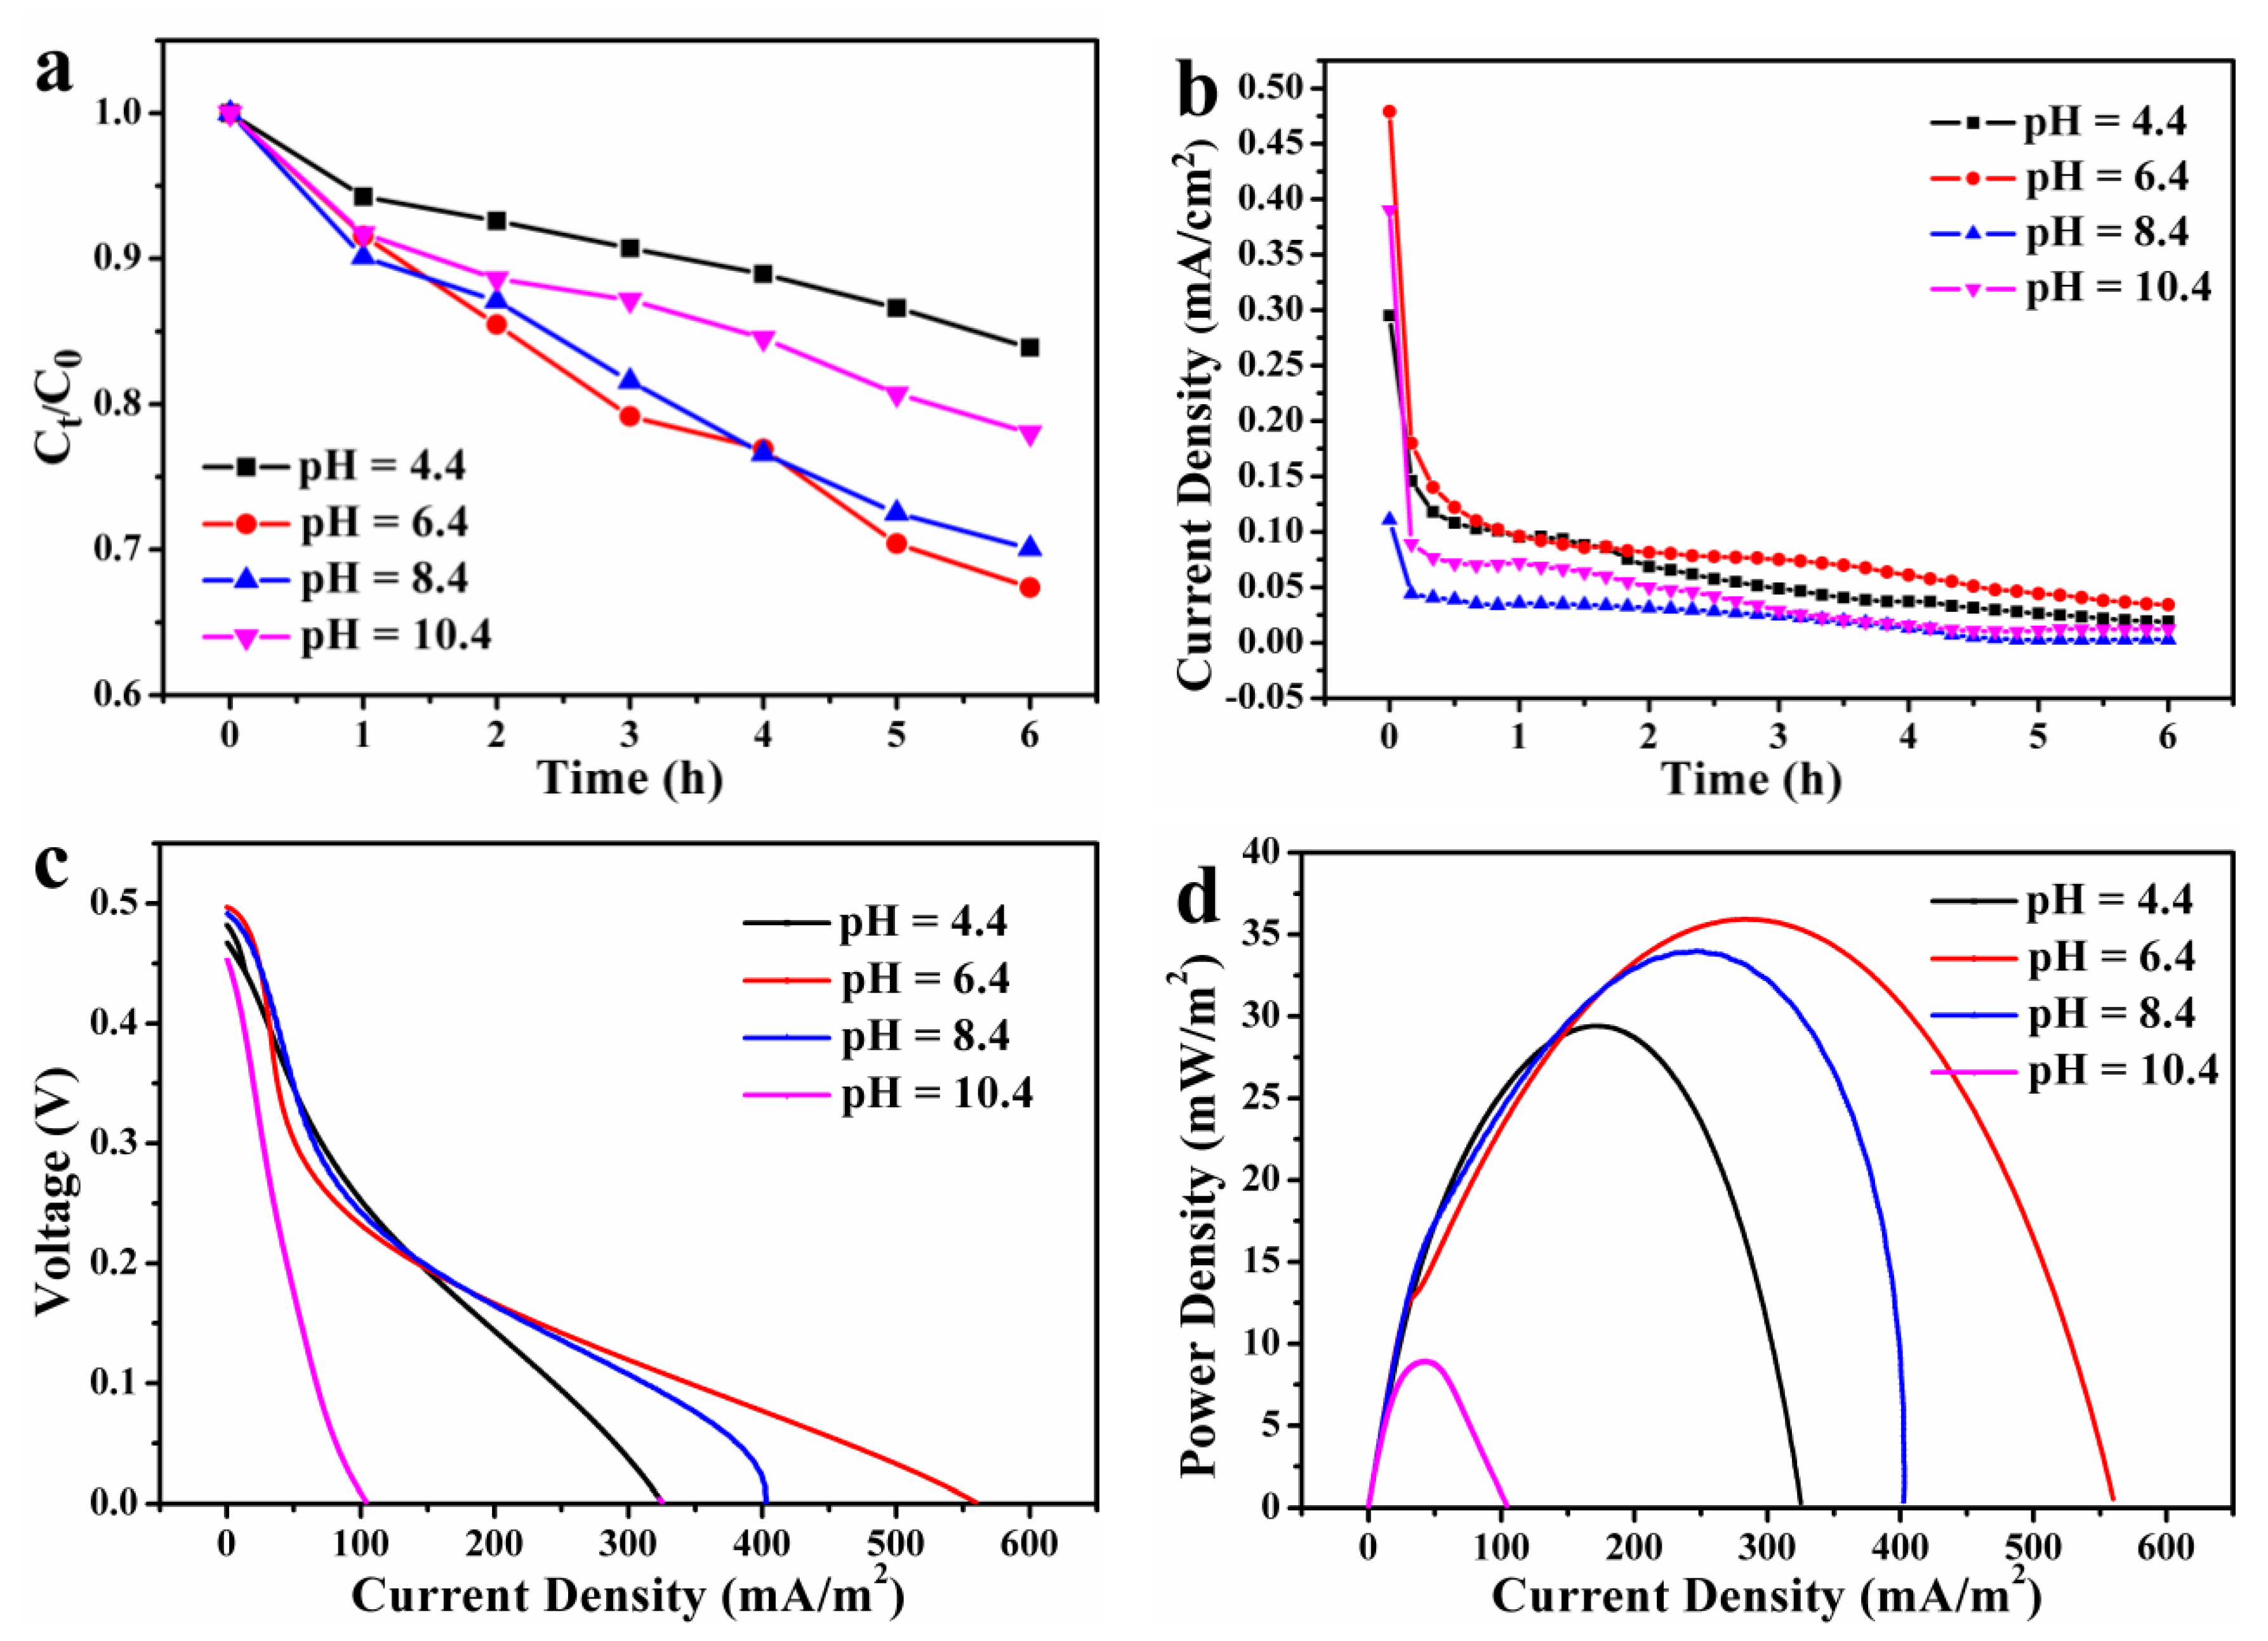
3.3. Effect of pH on PFC Performance

The effect of solution pH values of 4.4, 6.4, 8.4 and 10.4 on the performance of the PFC containing 0.05 M Na2SO4 electrolyte is shown in Figure 4. The 4-CP degradation rate increased as the pH decreased from 10.4 to 6.4. Various factors may have accounted for this. The reported zero-point charge of TiO2 with a similar morphology to the current photocatalyst is 6.5 [22]. At pH 6.4, the Ag-TiO2 surface was approximately neutral, so tended to release adsorbed electrolyte and generate ROS. The Ag-TiO2 surface was negatively charged at pH higher than the zero-point charge. This inhibited the chain reaction of H2O2 in the anode chamber. A higher pH like 10.4 corresponds to a lower proton concentration. Contacting with the reaction in cathode:
nH+ + n/4O2 + ne → n/2H2O
Photoelectrons and oxygen reacting to form water at pH 10.4 would be inhibited. A pH of 4.4 yielded insufficient hydroxyl groups. Hydroxyl groups reportedly promote the recombination of electron-hole pairs which will reduce the photocatalytic efficiency [39].
Although a lower pH was detrimental to 4-CP degradation, pH 4.4 yielded the second highest current density because these conditions provided abundant high conductivity protons (Figure 4b). At pH 10.4, the presence of OH promoted the ionic strength. The maximum average current density was 1.1 mA at pH 6.4. The results showed that the optimum pH range of the PFC for 4-CP degradation was 6.4–8.4 (Figure 4a,b). At this pH, the highest 4-CP degradation efficiency (29.9–32.6%) and highest power generation (Pmax = 34.0–36.0 mW/m2) could be achieved simultaneously.
The measured polarization curve exhibited a regular change with increasing pH (Figure 4c,d). The voltage loss caused by activating the PFC and the ohmic polarization loss decreased with increasing pH. The relationship between the current density and voltage in the polarization curve tended to be positive with increasing pH. The FF values at pH 4.4, 6.4, 8.4 and 10.4 were 19.1%, 12.9%, 17.2% and 19.0%, respectively. The FF is one of the parameters that measure the efficiency of the battery. The higher the fill factor value, the higher the efficiency of the battery. According to the data, the FF value was higher at pH 8.4 than at 6.4 and the current density was lower at pH 8.4 than at 6.4. So, increasing the pH of the electrolyte to an appropriate value in the pH range of 6.4–8.4 may increases the energy conversion rate in the PFC but reduce the power generation due to the negatively charge on photocatalyst surface.

4. Conclusions

In this study, we prepared an Ag-TiO2 carbon foam anode and setup a PFC system. The prepared Ag-TiO2 photocatalyst showed much higher 4-CP removal (98.4%) than the TiO2 (73.4%) and a higher TOC removal (31.2%) than the TiO2 (2.8%) due to the fact that the strong interaction between Ag and TiO2 promoted electron transfer. The anode was successfully obtained by uniformly coating the Ag-TiO2 photocatalyst on the three-dimensional foamed carbon. The PFC system can degrade the 4-CP and produced electricity simultaneously. Electrolyte type and pH were important factor during the PFC operation. The 4-CP degradation efficiency at 32.6% and the power density 34.0 mW/m2 could be obtained when the sodium sulfate was used as the electrolyte with pH at 6.4–8.4.

Author Contributions

Shaozhu Fu, Shuangshi Dong and Beiqi Deng conceived and designed the experiments and wrote the paper. Dongmei Ma and Shaozhu Fu prepared the photocatalysts. Hanqing Cheng analyzed part of the photocatalysts characterization. Shaozhu Fu, Beiqi Deng and Shuangshi Dong performed the experiments and analyzed the results.

Acknowledgments

This work was financially supported by the National Natural Science Foundation of China (51678270).

Conflicts of Interest

The authors declare no conflict of interest.

References

  1. Gomez-Acata, S.; Vital-Jacome, M.; Perez-Sandoval, M.V.; Navarro-Noya, Y.E.; Thalasso, F.; Luna-Guido, M.; Conde-Barajas, E.; Dendooven, L. Microbial community structure in aerobic and fluffy granules formed in a sequencing batch reactor supplied with 4-chlorophenol at different settling times. J. Hazard. Mater. 2018, 342, 606–616. [Google Scholar] [CrossRef] [PubMed]
  2. Basak, B.; Bhunia, B.; Dutta, S.; Dey, A. Enhanced biodegradation of 4-chlorophenol by Candida tropicalis PHB5 via optimization of physicochemical parameters using Taguchi orthogonal array approach. Int. Biodeterior. Biodegrad. 2013, 78, 17–23. [Google Scholar] [CrossRef]
  3. Lim, J.W.; Lim, P.E.; Seng, C.E.; Adnan, R. Simultaneous 4-chlorophenol and nitrogen removal in moving bed sequencing batch reactors packed with polyurethane foam cubes of various sizes. Bioresour. Technol. 2013, 129, 485–494. [Google Scholar] [CrossRef] [PubMed]
  4. Miran, W.; Nawaz, M.; Jang, J.; Lee, D.S. Chlorinated phenol treatment and in situ hydrogen peroxide production in a sulfate-reducing bacteria enriched bioelectrochemical system. Water Res. 2017, 117, 198–206. [Google Scholar] [CrossRef] [PubMed]
  5. Marković, M.D.; Dojčinović, B.P.; Obradović, B.M.; Nešić, J.; Natić, M.M.; Tosti, T.B.; Kuraica, M.M.; Manojlović, D.D. Degradation and detoxification of the 4-chlorophenol by non-thermal plasma-influence of homogeneous catalysts. Sep. Purif. Technol. 2015, 154, 246–254. [Google Scholar] [CrossRef]
  6. Zhou, D.; Dong, S.; Shi, J.; Cui, X.; Ki, D.; Torres, C.I.; Rittmann, B.E. Intimate coupling of an N-doped TiO2 photocatalyst and anode respiring bacteria for enhancing 4-chlorophenol degradation and current generation. Chem. Eng. J. 2017, 317, 882–889. [Google Scholar] [CrossRef]
  7. Deng, B.; Fu, S.; Zhang, Y.; Wang, Y.; Ma, D.; Dong, S. Simultaneous pollutant degradation and power generation in visible-light responsive photocatalytic fuel cell with an Ag-TiO2 loaded photoanode. Nano-Struct. Nano-Objects 2018, 15, 167–172. [Google Scholar] [CrossRef]
  8. Dong, S.; Zhang, J.; Gao, L.; Wang, Y.; Zhou, D. Preparation of spherical activated carbon-supported and Er3+:YAlO3-doped TiO2 photocatalyst for methyl orange degradation under visible light. Trans. Nonferrous Met. Soc. China 2012, 22, 2477–2483. [Google Scholar] [CrossRef]
  9. Xu, M.; Wang, Y.; Geng, J.; Jing, D. Photodecomposition of NOx on Ag/TiO2 composite catalysts in a gas phase reactor. Chem. Eng. J. 2017, 307, 181–188. [Google Scholar] [CrossRef]
  10. Ying, D.; Cao, R.; Li, C.; Tang, T.; Li, K.; Wang, H.; Wang, Y.; Jia, J. Study of the photocurrent in a photocatalytic fuel cell for wastewater treatment and the effects of TiO2 surface morphology to the apportionment of the photocurrent. Electrochim. Acta 2016, 192, 319–327. [Google Scholar] [CrossRef]
  11. Liu, Y.; Li, J.; Zhou, B.; Lv, S.; Li, X.; Chen, H.; Chen, Q.; Cai, W. Photoelectrocatalytic degradation of refractory organic compounds enhanced by a photocatalytic fuel cell. Appl. Catal. B 2012, 111–112, 485–491. [Google Scholar] [CrossRef]
  12. Zhou, X.; Zhang, J.; Ma, Y.; Cheng, H.; Fu, S.; Zhou, D.; Dong, S. Construction of Er3+:YAlO3 /RGO/TiO2 Hybrid Electrode with Enhanced Photoelectrocatalytic Performance in Methylene Blue Degradation Under Visible Light. Photochem. Photobiol. 2017, 93, 1170–1177. [Google Scholar] [CrossRef] [PubMed]
  13. Antoniadou, M.; Lianos, P. Production of electricity by photoelectrochemical oxidation of ethanol in a PhotoFuelCell. Appl. Catal. B 2010, 99, 307–313. [Google Scholar] [CrossRef]
  14. Li, K.; Zhang, H.; Tang, T.; Xu, Y.; Ying, D.; Wang, Y.; Jia, J. Optimization and application of TiO2/Ti-Pt photo fuel cell (PFC) to effectively generate electricity and degrade organic pollutants simultaneously. Water Res. 2014, 62, 1–10. [Google Scholar] [CrossRef] [PubMed]
  15. Nordin, N.; Ho, L.; Ong, S.; Ibrahim, A.H.; Wong, Y.; Lee, S.; Oon, Y.; Oon, Y. Hybrid system of photocatalytic fuel cell and Fenton process for electricity generation and degradation of Reactive Black 5. Sep. Purif. Technol. 2017, 177, 135–141. [Google Scholar] [CrossRef]
  16. Koyama, M.; Tsuboi, H.; Hatakeyama, N.; Endou, A.; Takaba, H.; Kubo, M.; del Carpio, C.A.; Miyamoto, A. Development of Three-Dimensional Porous Structure Simulator for Optimizing Microstructure of SOFC Anode. ECS Trans. 2007, 7, 2057–2064. [Google Scholar] [CrossRef]
  17. Guo, D.; Song, R.B.; Shao, H.H.; Zhang, J.R.; Zhu, J.J. Visible-light-enhanced power generation in microbial fuel cells coupling with 3D nitrogen-doped graphene. Chem. Commun. 2017, 53, 9967–9970. [Google Scholar] [CrossRef] [PubMed]
  18. Kan, L.; Yunlan, X.; Yi, H.; Chen, Y.; Yalin, W.; Jinping, J. Photocatalytic Fuel Cell (PFC) and Self-Photosensitization Photocatalytic Fuel Cell (DSPFC) with BiOCl/Ti Photoanode under UV and Visible Light Irradiation. Environ. Sci. Technol. 2013, 47, 3490–3497. [Google Scholar] [CrossRef]
  19. Liu, Y.; Li, J.; Zhou, B.; Li, X.; Chen, H.; Chen, Q.; Wang, Z.; Li, L.; Wang, J.; Cai, W. Efficient electricity production and simultaneously wastewater treatment via a high-performance photocatalytic fuel cell. Water Res. 2011, 45, 3991–3998. [Google Scholar] [CrossRef] [PubMed]
  20. Yasmina, B.; Marjolein, C.F.M.P.; Peter, W.A.; Luuk, C.R. Electrochemically active biofilm and photoelectrocatalytic regeneration of the titanium dioxide composite electrode for advanced oxidation in water treatment. Electrochim. Acta 2015, 182, 604–612. [Google Scholar] [CrossRef]
  21. Wang, Z.; Yang, C.; Lin, T.; Yin, H.; Chen, P.; Wan, D.; Xu, F.; Huang, F.; Lin, J.; Xie, X.; et al. Visible-light photocatalytic, solar thermal and photoelectrochemical properties of aluminium-reduced black titania. Energy Environ. Sci. 2013, 6, 3007–3014. [Google Scholar] [CrossRef]
  22. Chatterjee, D.; Dasgupta, S. Visible light induced photocatalytic degradation of organic pollutants. J. Photochem. Photobiol. C 2005, 6, 186–205. [Google Scholar] [CrossRef]
  23. O’Regan, B.; Grätzel, M. A low-cost, high-efficiency solar cell based on dye-sensitized colloidal TiO2 films. Nature 1991, 353, 737–740. [Google Scholar] [CrossRef]
  24. Wang, J.; Li, J.; Liu, B.; Xie, Y.; Han, G.; Li, Y.; Zhang, L.; Zhang, X. Preparation of nano-sized mixed crystal TiO2-coated Er3+:YAlO3 by sol-gel method for photocatalytic degradation of organic dyes under visible light irradiation. Water Sci. Technol. 2009, 60, 917–926. [Google Scholar] [CrossRef] [PubMed]
  25. Teruhisa, O.; Koji, S.; Michio, M. Photocatalytic Activities of Pure Rutile Particles Isolated from TiO2 Powder by Dissolving the Anatase Component in HF Solution. J. Phys. Chem. B 2001, 105, 2417–2420. [Google Scholar] [CrossRef]
  26. Ohno, T.; Tokieda, K.; Higashida, S.; Matsumura, M. Synergism between rutile and anatase TiO2 particles in photocatalytic oxidation of naphthalene. Appl. Catal. A 2003, 244, 383–391. [Google Scholar] [CrossRef]
  27. Fresno, F.; Coronado, J.M.; Tudela, D.; Soria, J. Influence of the structural characteristics of Ti1−xSnxO2 nanoparticles on their photocatalytic activity for the elimination of methylcyclohexane vapors. Appl. Catal. B 2005, 55, 159–167. [Google Scholar] [CrossRef]
  28. Xin, B.; Jing, L.; Ren, Z.; Wang, J.; Yu, H.; Fu, H. Preparation and Activity of Ag-TiO2 Photocatalyst with Multi-valency State. Acta Chim. Sin. 2004, 62, 1110–1114. [Google Scholar]
  29. Jina, C.; Hyunwoong, P.; Michael, R.H. Effects of Single Metal-Ion Doping on the Visible-Light Photoreactivity of TiO2. J. Phys. Chem. 2010, 114, 783–792. [Google Scholar] [CrossRef]
  30. Hou, W.; Cronin, S.B. A Review of Surface Plasmon Resonance-Enhanced Photocatalysis. Adv. Funct. Mater. 2013, 23, 1612–1619. [Google Scholar] [CrossRef]
  31. Yu, J.; Xiong, J.; Cheng, B.; Liu, S. Fabrication and characterization of Ag–TiO2 multiphase nanocomposite thin films with enhanced photocatalytic activity. Appl. Catal. B 2005, 60, 211–221. [Google Scholar] [CrossRef]
  32. Xiang, Q.; Yu, J.; Cheng, B.; Ong, H.C. Microwave-hydrothermal preparation and visible-light photoactivity of plasmonic photocatalyst Ag-TiO2 nanocomposite hollow spheres. Chem. Asian J. 2010, 5, 1466–1474. [Google Scholar] [CrossRef] [PubMed]
  33. Yan, X.; Shi, H.; Wang, D. Photoelectrocatalytic Degradation of Phenol Using a TiO2/Ni Thin-film Electrode. Korean J. Chem. Eng. 2003, 20, 679–684. [Google Scholar]
  34. Liu, H.; Cheng, S.; Logan, B.E. Power Generation in Fed-Batch Microbial Fuel Cells as a Function of Ionic Strength, Temperature and Reactor Configuration. Environ. Sci. Technol. 2005, 39, 5488–5493. [Google Scholar] [CrossRef] [PubMed]
  35. Du, Y.; Xiong, H.; Dong, S.; Zhang, J.; Ma, D.; Zhou, D. Identifying the role of reactive oxygen species (ROSs) in Fusarium solani spores inactivation. AMB Express 2016, 6, 81. [Google Scholar] [CrossRef] [PubMed]
  36. Ejhieh, A.N.; Khorsandi, M. Photodecolorization of Eriochrome Black T using NiS-P zeolite as a heterogeneous catalyst. J. Hazard. Mater. 2010, 176, 629–637. [Google Scholar] [CrossRef] [PubMed]
  37. Hu, C.; Kelm, D.; Schreiner, M.; Wollborn, T.; Madler, L.; Teoh, W.Y. Designing Photoelectrodes for Photocatalytic Fuel Cells and Elucidating the Effects of Organic Substrates. ChemSusChem 2015, 8, 4005–4015. [Google Scholar] [CrossRef] [PubMed]
  38. Nezamzadeh-Ejhieh, A.; Karimi-Shamsabadi, M. Decolorization of a binary azo dyes mixture using CuO incorporated nanozeolite-X as a heterogeneous catalyst and solar irradiation. Chem. Eng. J. 2013, 228, 631–641. [Google Scholar] [CrossRef]
  39. Wang, B.; Zhang, H.; Lu, X.-Y.; Xuan, J.; Leung, M.K.H. Solar photocatalytic fuel cell using CdS–TiO2 photoanode and air-breathing cathode for wastewater treatment and simultaneous electricity production. Chem. Eng. J. 2014, 253, 174–182. [Google Scholar] [CrossRef]
Figure 1. (a) Schematic diagram and (b) reactor set-up of the photocatalytic fuel cell (PFC).
Chemengineering 02 00020 g001
Figure 2. Characterization and photocatalytic performance of as prepared catalyst and electrode. (a) XRD patterns of TiO2 and Ag-TiO2 nanoparticles; (b) SEM images of Ag-TiO2 nanoparticles coated foamed carbon and pristine foamed carbon (inset); (c) DRS spectra of the prepared Ag-TiO2 and TiO2 respectively; (d) Survey spectra of Ag-TiO2 and TiO2 composite nanoparticles; XPS spectra of Ag-TiO2 nanoparticles for (e) Ag 3d and (f) Ti 2p; (g) Transient photo-current response (on-off mode) and (h) photocatalytic degradation and TOC analysis of 4-CP under visible light irradiation.
Chemengineering 02 00020 g002
Figure 3. Effect of different electrolytes on the (a) 4-CP degradation; (b)current density; (c) current-voltage plots and (d) current-power plots during the PFC operation.
Chemengineering 02 00020 g003
Figure 4. Effect of pH on (a) 4-CP degradation; (b) current density; (c) current-voltage plots and (d) current-power plots during the PFC operation.
Chemengineering 02 00020 g004

