
Are Stakeholders’ Opinions Redundant? †


Awareness Center, Linkøpingvej 35, Trekroner, DK-4000 Roskilde, Denmark
†
In memoriam Rainer Bruggemann (28 October 1943–4 December 2022).
Standards 2024, 4(2), 39-51; https://doi.org/10.3390/standards4020003
Submission received: 13 September 2023
/
Revised: 2 January 2024
/
Accepted: 7 April 2024
/
Published: 19 April 2024
Abstract
:Decision-making, bringing in the opinions of several stakeholders, may be a rather time- and resource-demanding process. Partial order-based methods like generalized linear aggregation (GLA) and average ranking appear as advantageous tools for considering several stakeholders’ opinions simultaneously. The present study presents an approach where stakeholders’ opinions/weights are substituted by a series of randomly generated weight regimes, leading to virtually identical rankings as demonstrated through comparisons to examples where true stakeholder opinions are applied, as demonstrated through a study on food sustainability. This study showed a high degree of agreement between the ranking based on random data and that based on real stakeholder data. The method, which is a top-down approach to the decision process, appears to be a highly resource-reducing decision-supporting process. However, the method, by default, excludes the possibility of incorporating specific knowledge from, e.g., employees or other stakeholders in the decision process.
1. Introduction
Decision-making is a common, if not daily, issue in a variety of situations, e.g., in most companies where decisions often require inclusion and thus analyses of a variety of parameters. One example that is used as an exemplary case in the present study comes from a study on food sustainability. Here, sugar, meat, fat, and salt consumption appear as crucial parameters, but the relative importance of these factors may be different from stakeholder to stakeholder. In the present case, the stakeholders are experts and politicians. However, such decision-making based on a group of parameters/elements, each being characterized by several indicators, often involves the aggregation of data into a single composite indicator by assigning weights to the single indicators followed by a simple arithmetic summation, despite the obvious problems associated with such a method, like compensation effects [1]. Nevertheless, using such composite indicators has obvious advantages, e.g., a subsequent ranking of the single elements based on these indicator values will lead to a strict, complete order. However, it is worthwhile to remember that when applying composite indicators, the role of the individual indicators is masked and no longer distinguishable [1,2].
A crucial point in such an aggregation process is the establishment of the weight regime, i.e., assigning weights to single indicators based on assumptions of the importance of the single indicators. The process of assigning weights typically involves a group of stakeholders [3,4,5,6] and can, in principle, be conducted in two different ways: (a) either a group of stakeholders mutually agrees on the weight regime, which may be a troublesome, time-consuming, and thus expensive process, or (b) each stakeholder comes up with their individual weight regime. The advantage of the first method is that eventually, only one single ranking is based on the agreed weight regime, whereas the disadvantage is that the weight regime is based on consensus, which may well be subject to controversy. The advantage of the second method is that each ranking is based on the single stakeholder’s weight regime, whereas the disadvantage is that the result would be several rankings equal to the number of stakeholders, which eventually need to be combined to give a final ranking. In two recent papers [7,8], a method, generalized linear aggregation (GLA), was introduced to circumvent this step. The GLA method is based on partial ordering [7,8] and results in a weak order based on average ranking, where all stakeholders’ opinions simultaneously are considered. The involvement of several stakeholders is foreseen with various associated consequences, not least from an administrative point of view. On the other hand, the potentially troublesome agreement on one single weight regime is avoided. The objective of the present study is to elucidate the possibility that weight regimes that are constructed simply through a random generation of single weights, eventually saving both time and money, can, and possibly to what extent, substitute the involvement of ‘real’ stakeholders.
It should be mentioned in this connection that such a process is a purely top-down approach, in contrast to a bottom-up one, where employees, experts, or possibly even various political systems promoting specific interests may participate in the decision process as stakeholders.
2. Methodology
2.1. Random Generation of Weight Regimes
Weight regimes were simply generated through random numbers within selected intervals, like [0, 1] or [1, 3], applying the appropriate function in Excel-2021. In all cases described below, three to five different weight regimes were generated.
2.2. Data
The data applied in this study were adopted from the Food Sustainability Index 2021 [9], which has also been used in a recent paper [4] describing the influence of stakeholders on the ranking of the 78 countries based on four indicators (Table 1 and Table 2).
It should be emphasized that “all indicator scores are normalized to a 0 to 100 scale, where 100 indicates the highest sustainability and greatest progress towards meeting environmental, social, and economic key performance indicators (KPI), and 0 represents the lowest” [9] (cf. Excel Workbook: Methodology), i.e., for all 4 indicators, the higher the indicator value, the better. Hence, no further treatment of the indicator values was necessary (cf. discussion about normalization in [7,8]).
2.3. Partial Ordering
Partial ordering is a relation between objects (here, the 78 countries, cf. Table 2). The method allows the analysis of the data without any pretreatments, e.g., aggregation of the data into one single indicator. In mathematical terms, partial ordering is based on the “≤” relation (cf. e.g., [10,11]). Considering two objects, x and y, where object x is characterized by a set of indicators rs(x), s = 1, …, m (in the present case m = 4, cf. Table 1) is comparable to the object y, which is characterized by an identical set of indicators rs(y), if and only if the relation x ≤ y holds (see below, Equation (1)):
rs(x) ≤ rs(y) for all s = 1,…, m.
The application of Equation (1) needs a convention about the orientation of the single indicators, i.e., the larger the value of an indicator, the better. In cases where indicators do not have the same orientation, this will initially be remedied by multiplying these indicator values by −1 to secure the common orientation. Since the single indicator values are not numerically aggregated, the method excludes, by default, possible compensation problems, i.e., a “good” value of an indicator may compensate a “bad” one of another indicator. [1,10]. A graphical representation of Equation (1) is the so-called Hasse diagram [2,11], visually displaying the partial ordering of the objects.
The Hasse Diagram
In the Hasse diagram, comparable objects are connected through a sequence of lines [2,11]. If Equation (1) is not fulfilled for some objects x, y, then x is incomparable with y, denoted by x ‖ y. Such incomparabilities point to the data leading to conflicts between the objects, e.g., x < y for some indicator(s) and y < x for other(s). If, for a subset of the data x, y, the ≤ - relation (Equation (1)) holds for all elements, this set will be denoted as a chain. On the other hand, if for a given subset, x ‖ y for all x, y, this set is called an antichain.
2.4. Generalized Linear Aggregation (GLA)
Although the GLA procedure has been explained in detail previously [7,8], a brief explanation is given here.
When the original multi-indicator system (MIS) (denoted as “MIS(old)” to emphasize the role of the aggregation process) is written in the form where rr are the indicators and ei the studied elements:
If only the opinion of one single stakeholder is introduced, i.e., applying one single weight scheme, only the aggregation to a single scalar, CI (composite indicator), that subsequently may serve as a ranking index can be formulated using (Equation (3)):
where the selection of weights, gi, is responsible for the composite indicator CI but is based on a system of indicator values riold, where riold refers to the MIS(old).
CI = (g1 g2 … gm) · MIS(old), i.e., CI = ∑gi · riold,
The result of the matrix multiplication, where a row of m entries is acting on each column of matrix MIS, leads to the traditional weighted sum expressing the aggregation process. The difficulty in Equation (3) is not its mathematics, but the way how the weights can be found cf. [3,4,5,6].
If several stakeholders, s1, s2, …, st, are considered, the corresponding weight scheme can be summarized in a matrix G (Equation (4)):
The weights bear important information concerning the roles played through the single indicators of an original MIS. The aggregation to a set of single scalars can be formulated as follows:
Ĝ · MIS(old) = MIS(new).
Equation (5) describes the calculation of a new MIS through matrix multiplication of the weight matrix G (Equation (4)), where each row of G corresponds to a weight regime. In Equation (5), the role of G as an operator Ĝ is stressed; Ĝ denotes the transformed G matrix. Application of Equation (5) is more convenient as it accepts any number of weight regimes/stakeholder opinions.
Following the GLA procedure, a highly enriched Hasse diagram is obtained, i.e., a diagram with a much higher number of comparisons and, simultaneously, a significantly reduced number of incomparisons, U, as a consequence of including all stakeholder opinions, i.e., weight regimes, simultaneously. In general, the procedure will not lead to a strict linear order, as would the result of taking only one weight regime/stakeholder into account.
2.5. Average Ranks
The level structure of the Hasse diagram offers a first approximation to an order. However, as all objects on a level automatically will be assigned identical orders, such an order will cause many tied orders. It is desirable that the degree of tiedness is as low as possible, i.e., a ranking with a low number of incomparabilities, ideally a linear ordering of the single objects. However, since a certain portion of incomparable objects are present, this is not immediately obtainable. Partial order methodology provides a weak order, i.e., where tied orders are not excluded—an average ranking—as described by Bruggemann and Carlsen [12] and Bruggemann and Annoni [13]. The above-described GLA procedure significantly enriches the Hasse diagram, thus decreasing U and eventually leading to an average ranking closer to the single linear order.
2.6. Software
All partial-order analyses were carried out using the PyHasse software [14]. PyHasse is programmed using the interpreter language Python (version 2.6). Today, the software package contains around 140 more or less specialized modules. Selected modules are available from the author.
3. Results and Discussion
In a recent study [4], the advantageous effect of applying the GLA method was demonstrated. This study included four ”stakeholders” denoted as Expert, Political, Outcome, and Uniform (cf. Table 3), each giving rise to a weighting scheme, with the single weights ranging from 0 to 1. Subsequently, this weighting scheme (Table 3) was applied to give an average ranking of the countries shown in Table 2 [8]. The results of the GLA, i.e., the resulting Hasse diagram and the average ranking are shown and discussed in detail previously [8].
The question now arises: if a random generation of weighting schemes would lead to an identical ranking of the 78 countries, thereby making a significant reduction in the use of resources required to achieve the weighting schemes from the single stakeholders.
A ranking based on a single randomly generated weighting scheme may well result in a quite different ranking than the one shown in Table 3 [8]. To circumvent this, a series of GLA calculations were performed, with the eventual ranking generated as an average of rankings generated through the individual GLAs. In the present case, five randomly generated weighting schemes were applied. The resulting average rankings are shown in Table 4, together with the average and the standard deviation (std).
It is immediately noted that the single average ranking from the five GLAs does not appear identical but still quite similar, which itself appears somewhat surprising. This is further verified through the relatively small standard deviations obtained by averaging the five rankings. In Table 5, the randomly generated weight regime leading to rank a (Table 4) is shown. In Figure 1, the original Hasse diagram based on the data in Table 2 (A) is shown together with the diagram based on the GLA a (B), and for comparison, the diagram following the GLA applying the original weights [4], as given in Table 3 (C). Figure 1A,C is adopted from [8].
The enrichment of the diagram (Figure 1B,C) compared to the original (Figure 1A) is immediately apparent. Thus, the original Hasse diagram has only 1048 comparisons and 1955 incomparisons, whereas the diagram in Figure 1B displays 2602 comparisons and only 401 incomparisons. The diagram in Figure 1C displays 2718 comparisons and 285 incomparisons, which for the two diagrams in Figure 1B,C are further visualized through much slimmer and higher diagrams. The similarity between the diagrams in Figure 1B,C is striking, although there are differences. However, it must be remembered that this is only an exemplary case. Hence, the average rankings obtained through the five GLAs based on randomly generated weighting schemes remain to be discussed, compared to the rankings obtained by applying the original fixed ranking (cf. Table 3). In Table 5, the top 10 and bottom 10 ranked countries are summarized and compared to the ranking previously obtained [8] (Table 6).
Looking at the data given in Table 5, it is obvious that some variations between the original raking and that based on the randomly generated weighting schemes prevail. However, taking into account the standard deviations, a surprisingly good agreement between the two sets of data is immediately noted.
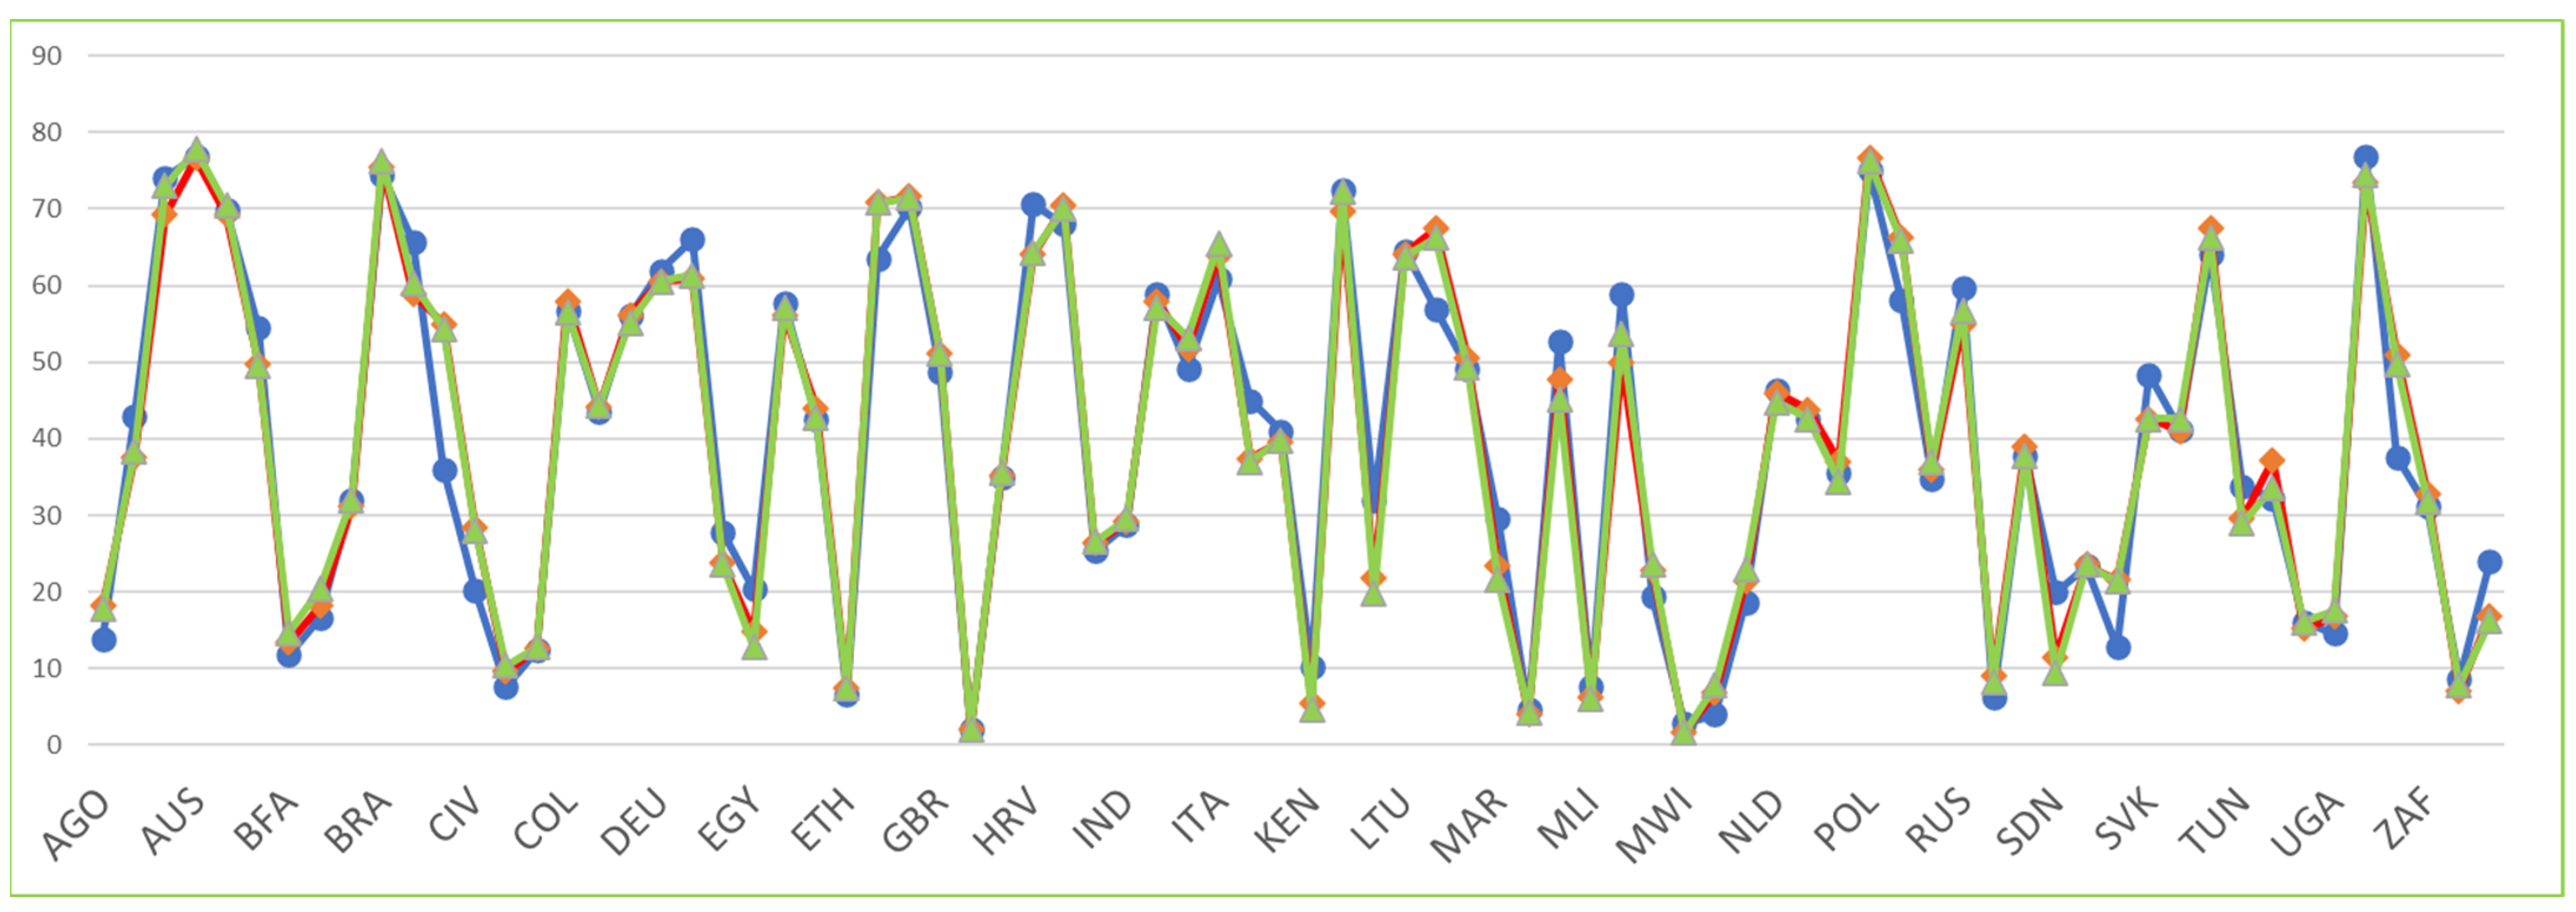
An obvious question now arises: how many randomly generated weighting schemes and subsequent GLAs are necessary to obtain reliable results? To answer this question, a series of weighting schemes were randomly generated, allowing integer values of 1, 2, and 3 for four ‘stakeholders’ (cf. Table 1). The original dataset (Table 2) was applied, and the combined average rankings for the GLAs were generated following three, five, and seven GLAs. It should be noted that all weighing schemes, i.e., in total fifteen, were different, meaning that, e.g., for the series of five weighting schemes, none of the weighting schemes for the series of three were reused.
In Figure 2, the comparison of three series, SH3: ●, SH5: ♦, and SH7: ▲, is visualized. It is immediately clear that a good agreement between the three series prevails. However, a somewhat better agreement between SH5 and SH7 than the agreement with SH3 is noted—although not spectacular. Hence, it is suggested that SH5 appears sufficient and should be the preferred choice in general.
A further obvious question to ask is to what extent the proposed method can be used and what the possible limitations are. Here, it should initially be noted that a satisfactory agreement between the ranking based on random data and those from real stakeholder opinions is striking. However, despite the fact that the method a priori does not suffer from specific limitations, in cases where real stakeholders’ opinions are available, they obviously should be applied.
4. Conclusions and Outlook
The present paper answers the question: Are stakeholders’ opinions redundant? To answer the question, partial order-based methods, generalized linear aggregation (GLA) combined with average ranking, were applied. To simulate—here four—stakeholders’ opinions, randomly generated weight regimes were brought into play, and using GLA, the combined effect of the stakeholders was calculated. The overall effect was retrieved by averaging the outcome of the individual GLAs. The result is compared to that of a previous study applying real stakeholders’ weight regimes, demonstrating close agreement.
In a further study, the effect of the number of simulations was disclosed using three, five, and seven sets of weight regimes for the ranking of the data. Based on these calculations, it is suggested that applying five sets of weight regimes satisfactorily leads to a result that closely mimics what was obtained based on real stakeholders’ opinions.
Application of the suggested method discloses that stakeholders’ opinions may well be redundant and that a combined inclusion of a series of randomly generated weight regimes to substitute opinions of real stakeholders is assumed to be a highly resource-reducing decision-supporting process. It must, however, be stressed that this obviously top-down method excludes advantages possibly obtained through the involvement of employees in the decision process through a bottom-up process. However, obviously, employees may well be stakeholders. In such a situation, obviously ‘real’ data, e.g., the weighting based on employee opinions, will be used.
Funding
This research received no external funding.
Institutional Review Board Statement
Not applicable.
Informed Consent Statement
Not applicable.
Data Availability Statement
The data presented in this study are openly available in reference [9].
Conflicts of Interest
There are no conflicts of interest.
References
- Munda, G. Social Multi-Criteria Evaluation for a Sustainable Economy; Springer: Berlin/Heidelberg, Germany, 2008; Available online: https://www.springer.com/la/book/9783540737025 (accessed on 12 September 2023).
- Bruggemann, R.; Patil, G.P. Ranking and Prioritization for Multi-Indicator Systems—Introduction to Partial Order Applications; Springer: New York, NY, USA, 2011; Available online: https://www.springer.com/gp/book/9781441984760 (accessed on 12 September 2023).
- Smith, L.W. Stakeholder Analysis: A Pivotal Practice of Successful Projects. In Proceedings of the Project Management Institute Annual Seminars & Symposium, Houston, TX, USA, 7–16 September 2000; Project Management Institute: Newtown Square, PA, USA, 2000. Available online: https://www.pmi.org/learning/library/stakeholder-analysis-pivotal-practice-projects-8905 (accessed on 12 December 2023).
- Stakeholder Influence. Available online: https://www.stakeholdermap.com/stakeholder-influence.html (accessed on 1 December 2023).
- Lienert, J. Stakeholder Importance and Influence. 2020. Available online: https://sswm.info/es/humanitarian-crises/prolonged-encampments/planning-process-tools/exploring-tools/stakeholder-importance-and-influence (accessed on 1 December 2023).
- Greany, K. 4 Fresh Strategies to Transform Your Stakeholder Relationships and Influence Change. eLearning Industry. 2021. Available online: https://elearningindustry.com/fresh-strategies-transform-stakeholder-relationships-and-influence-change (accessed on 1 December 2023).
- Carlsen, L.; Bruggemann, R. Partial Order as Decision Support Between Statistics and Multicriteria Decision Analyses. Standards 2022, 2, 306–328. [Google Scholar] [CrossRef]
- Carlsen, L.; Bruggemann, R. Combining different stakeholders’ opinions in multi-criteria decision analyses applying partial order methodology. Standards 2022, 2, 503–521. [Google Scholar] [CrossRef]
- Food Sustainability Index. See also the Associated Workbook: Food_Sustainability_Index_2021.xlsm. 2021. Available online: https://impact.economist.com/projects/foodsustainability/ (accessed on 12 September 2023).
- Nardo, M.; Saisana, M.; Saltelli, A.; Tarantola, S.; Hoffman, A.; Giovannini, E. Handbook on Constructing Composite Indicators: Methodology and User Guide; OECD: Ispra, Italy, 2008; Available online: https://www.oecd.org/sdd/42495745.pdf (accessed on 12 September 2023).
- Brüggemann, R.; Carlsen, L. Introduction to partial order theory exemplified by the Evaluation of Sampling Sites. In Partial Order in Environmental Sciences and Chemistry; Bruggemann, R., Carlsen, L., Eds.; Springer: Berlin/Heidelberg, Germany, 2006; pp. 61–110. [Google Scholar] [CrossRef]
- Brüggemann, R.; Carlsen, L. An Improved Estimation of Averaged Ranks of Partial Orders. MATCH Commun. Math. Comput. Chem. 2011, 65, 383–414. [Google Scholar]
- Bruggemann, R.; Annoni, P. Average Heights in Partially Ordered Sets. MATCH Commun. Math. Comput. Chem. 2014, 71, 117–142. [Google Scholar]
- Bruggemann, R.; Carlsen, L.; Voigt, K.; Wieland, R. PyHasse Software for Partial Order Analysis. In Multi-Indicator Systems and Modelling in Partial Order; Bruggemann, R., Carlsen, L., Wittmann, J., Eds.; Springer: New York, NY, USA, 2014; pp. 389–423. [Google Scholar] [CrossRef]
Figure 1.
(A) The original Hasse diagram based on the data in Table 2, (B) the Hasse diagram based on the GLA a, and (C) the Hasse diagram following the GLA applying the original weights [4] as given in Table 3.
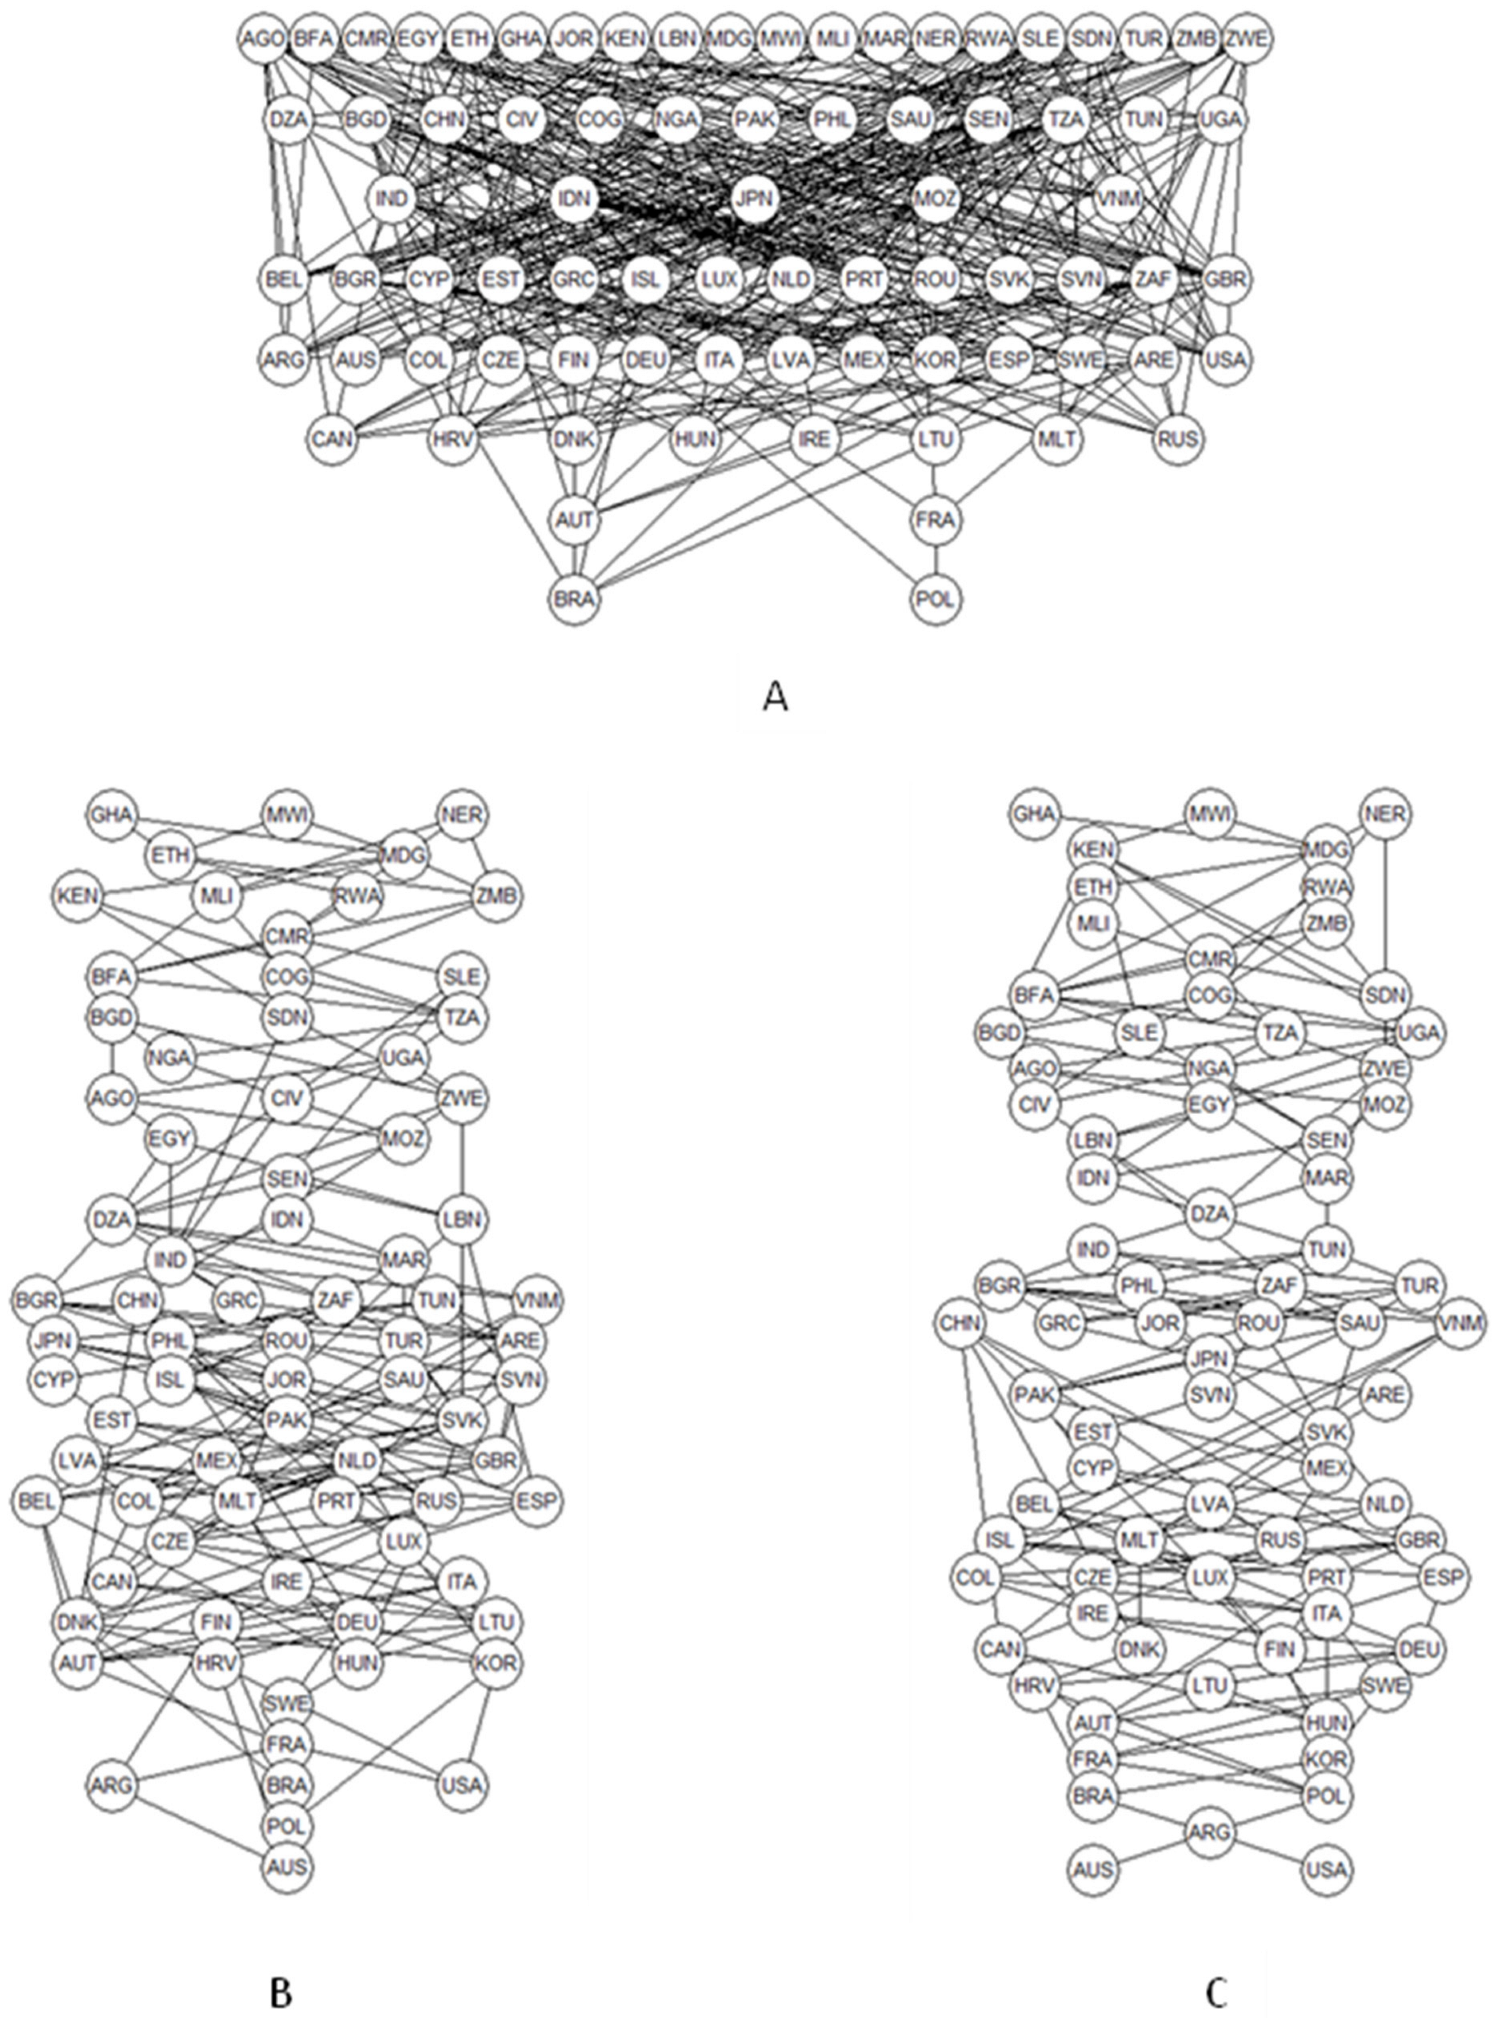
Figure 2.
Combined average ranks following GLA applying three (●), five (♦), and seven (▲) randomly generated weighting schemes, respectively.
Figure 2.
Combined average ranks following GLA applying three (●), five (♦), and seven (▲) randomly generated weighting schemes, respectively.

Table 1.
Indicators of the Food Sustainability Study.
| Indicator | ||
|---|---|---|
| r1 | Pct. Of sugar in diets | Percent sugar in the diet |
| r2 | Meat consumption levels | The difference in meat consumption (g/capita(day) from the daily recommended intake (90 g/capita/day) |
| r3 | Saturated fat consumption | g/capita/day |
| r4 | Salt consumption | Average g/day sodium consumption |
Table 2.
Data matrix of food sustainability. Seventy-eight countries are characterized by the numerical values of four indicators [8,9].
| ID | r1 | r2 | r3 | r4 | |
|---|---|---|---|---|---|
| Algeria | DZA | 47.3 | 86.9 | 91 | 24.9 |
| Angola | AGO | 65.8 | 91.2 | 57.3 | 72.9 |
| Argentina | ARG | 12.2 | 7.4 | 14.9 | 59.2 |
| Australia | AUS | 13.3 | 11.4 | 6 | 48 |
| Austria | AUT | 22.4 | 41.1 | 28.3 | 33.8 |
| Bangladesh | BGD | 84.2 | 69.4 | 88.6 | 44.8 |
| Belgium | BEL | 15.7 | 76.9 | 31.9 | 47.2 |
| Brazil | BRA | 21.7 | 26.8 | 26.2 | 29.5 |
| Bulgaria | BGR | 40.9 | 70.8 | 69.4 | 42.6 |
| Burkina Faso | BFA | 78.2 | 79.4 | 80.8 | 62.5 |
| Cameroon | CMR | 74.9 | 78.2 | 79.8 | 83.6 |
| Canada | CAN | 19.6 | 35.3 | 48.8 | 40.2 |
| China | CHN | 84.6 | 68.2 | 15 | 10.2 |
| Colombia | COL | 27.5 | 69.4 | 30.5 | 30 |
| Cote d’Ivoire | CIV | 77.2 | 76.1 | 48 | 64.6 |
| Croatia | HRV | 4.1 | 48.7 | 40.2 | 40.2 |
| Cyprus | CYP | 46.8 | 52.2 | 58.1 | 30.8 |
| Czech Republic | CZE | 33.9 | 44.3 | 43.7 | 33 |
| Dem. Rep. of Congo | COG | 69.4 | 80.1 | 79.8 | 74.8 |
| Denmark | DNK | 7.5 | 49.2 | 29.8 | 52 |
| Egypt | EGY | 43.8 | 99.1 | 90.8 | 41 |
| Estonia | EST | 46.9 | 60.7 | 48 | 33.8 |
| Ethiopia | ETH | 77.5 | 72.5 | 94.3 | 78.8 |
| Finland | FIN | 40.7 | 50.6 | 0 | 36.5 |
| France | FRA | 25.4 | 49.6 | 8.3 | 38.6 |
| Germany | DEU | 22.6 | 49.9 | 26.1 | 44.8 |
| Ghana | GHA | 78 | 81.7 | 95.6 | 76.7 |
| Greece | GRC | 45.9 | 56.1 | 71.2 | 38.6 |
| Hungary | HUN | 31.2 | 44.1 | 25.8 | 26.3 |
| India | IND | 45.5 | 69.2 | 83.4 | 39.9 |
| Indonesia | IDN | 56.8 | 78.5 | 73.1 | 49.6 |
| Ireland | IRE | 25.4 | 50.8 | 33.9 | 39.4 |
| Israel | ISL | 53.8 | 28.2 | 43.9 | 38.1 |
| Italy | ITA | 42.3 | 46.6 | 31.4 | 21.2 |
| Japan | JPN | 41.9 | 82.1 | 77 | 8.6 |
| Jordan | JOR | 15.8 | 99.8 | 64.8 | 29 |
| Kenya | KEN | 49.6 | 82.1 | 90.1 | 100 |
| Latvia | LVA | 40.8 | 58.3 | 50.9 | 27.3 |
| Lebanon | LBN | 7.3 | 98.3 | 88.6 | 55.8 |
| Lithuania | LTU | 28 | 44.3 | 33.9 | 30.6 |
| Luxembourg | LUX | 49.1 | 46.6 | 11.1 | 30.6 |
| Madagascar | MDG | 74.2 | 79.5 | 94.1 | 80.7 |
| Malawi | MWI | 68.6 | 78.8 | 95.5 | 95.2 |
| Mali | MLI | 77.2 | 88 | 97.6 | 55.2 |
| Malta | MLT | 16.9 | 50.9 | 63.6 | 29.8 |
| Mexico | MEX | 10.2 | 60.6 | 35.2 | 65.7 |
| Morocco | MAR | 35.9 | 100 | 88.1 | 24.1 |
| Mozambique | MOZ | 60.2 | 75.4 | 60.5 | 79.6 |
| Netherlands | NLD | 32.3 | 60.7 | 34.7 | 50.7 |
| Niger | NER | 100 | 74.3 | 92.4 | 61.4 |
| Nigeria | NGA | 74 | 73 | 69.4 | 64.1 |
| Pakistan | PAK | 37.8 | 82.8 | 41.1 | 34.9 |
| Philippines | PHL | 43.7 | 96.8 | 48.2 | 24.7 |
| Poland | POL | 18.7 | 39 | 7.2 | 36.7 |
| Portugal | PRT | 52.3 | 32 | 30.4 | 26 |
| Romania | ROU | 50.4 | 65.5 | 63.8 | 29.2 |
| Russia | RUS | 19.8 | 53.4 | 57.9 | 27.9 |
| Rwanda | RWA | 70.4 | 73.3 | 80.4 | 96.8 |
| Saudi Arabia | SAU | 42.4 | 87.3 | 22.3 | 53.9 |
| Senegal | SEN | 54.2 | 81.4 | 74.8 | 55.2 |
| Sierra Leone | SLE | 84.9 | 74.4 | 52 | 72.4 |
| Slovakia | SVK | 29.1 | 73.9 | 65.1 | 26.3 |
| Slovenia | SVN | 45.3 | 60.2 | 64.1 | 26.3 |
| South Africa | ZAF | 30.4 | 66.4 | 57 | 73.2 |
| South Korea | KOR | 31.3 | 58.5 | 33.1 | 0 |
| Spain | ESP | 39 | 27.4 | 54.9 | 31.9 |
| Sudan | SDN | 23.8 | 88.3 | 95.5 | 76.1 |
| Sweden | SWE | 27.8 | 56.2 | 4.1 | 41.8 |
| Tanzania | TZA | 70 | 76.6 | 82.1 | 66 |
| Tunisia | TUN | 36 | 96.5 | 80.5 | 20.9 |
| Turkey | TUR | 46.9 | 94.1 | 43.4 | 29.8 |
| United Arab Emirates | ARE | 29.3 | 61.8 | 68.1 | 41.3 |
| Uganda | UGA | 62.7 | 78 | 69.2 | 83.1 |
| United Kingdom | GBR | 40.9 | 51.6 | 31.7 | 42.9 |
| United States | USA | 0 | 0 | 41.5 | 43.2 |
| Vietnam | VNM | 75.6 | 65.2 | 24.6 | 16.6 |
| Zambia | ZMB | 66 | 85.7 | 87.1 | 78.8 |
| Zimbabwe | ZWE | 27.9 | 85.3 | 100 | 56.6 |
Table 3.
Four weighting schemes, as defined within the food sustainability study [8].
Table 3.
Four weighting schemes, as defined within the food sustainability study [8].
| Indicators | Expert | Political | Outcome | Uniform |
|---|---|---|---|---|
| i1: Percentage of sugar in diets | 0.375 | 0.143 | 0.400 | 0.250 |
| i2: Meat consumption levels | 0.250 | 0.286 | 0.200 | 0.250 |
| i3: Saturated fat consumption | 0.163 | 0.286 | 0.200 | 0.250 |
| i4: Salt consumption | 0.213 | 0.286 | 0.200 | 0.250 |
Table 4.
Average ranking of the 78 countries following five GLA based on randomly generated weighting schemes.
Table 4.
Average ranking of the 78 countries following five GLA based on randomly generated weighting schemes.
| ID | Rank_a | Rank_b | Rank_c | Rank_d | Rank_e | Average | Std |
|---|---|---|---|---|---|---|---|
| AGO | 19 | 16 | 16 | 17 | 13.5 | 16.3 | 1.987 |
| ARE | 42 | 45 | 40 | 38 | 42 | 41.4 | 2.608 |
| ARG | 75 | 76 | 75 | 72 | 76 | 74.8 | 1.643 |
| AUS | 78 | 78 | 78 | 76 | 77.5 | 77.5 | 0.866 |
| AUT | 69 | 71 | 72 | 70 | 73 | 71 | 1.581 |
| BEL | 56.5 | 51 | 50 | 43 | 51 | 50.3 | 4.817 |
| BFA | 11 | 9 | 11 | 13 | 12 | 11.2 | 1.483 |
| BGD | 13 | 12 | 13 | 20 | 21 | 15.8 | 4.324 |
| BGR | 29 | 32 | 32 | 29 | 32 | 30.8 | 1.643 |
| BRA | 74 | 74 | 74 | 75 | 74 | 74.2 | 0.447 |
| CAN | 61 | 66 | 68 | 60 | 64.5 | 63.9 | 3.362 |
| CHN | 43 | 36 | 46 | 55 | 44 | 44.8 | 6.834 |
| CIV | 23 | 27.5 | 25 | 21 | 23 | 23.9 | 2.460 |
| CMR | 9 | 8 | 8 | 7 | 10 | 8.4 | 1.140 |
| COG | 12 | 13 | 12 | 11 | 11 | 11.8 | 0.837 |
| COL | 60 | 55 | 52 | 57 | 53 | 55.4 | 3.209 |
| CYP | 37 | 46.5 | 47 | 45 | 47 | 44.5 | 4.272 |
| CZE | 54 | 54 | 58 | 58 | 56 | 56 | 2.000 |
| DEU | 64 | 65 | 59 | 53 | 59 | 60 | 4.796 |
| DNK | 66 | 72 | 67 | 56 | 66 | 65.4 | 5.814 |
| DZA | 26 | 21 | 24 | 30 | 28 | 25.8 | 3.493 |
| EGY | 21 | 11 | 15 | 24 | 17 | 17.6 | 5.079 |
| ESP | 52 | 60 | 62 | 61 | 61 | 59.2 | 4.087 |
| EST | 45 | 46.5 | 44 | 44 | 46 | 45.1 | 1.140 |
| ETH | 5 | 6 | 7 | 5.5 | 9 | 6.5 | 1.581 |
| FIN | 68 | 67 | 64 | 63 | 67 | 65.8 | 2.168 |
| FRA | 72 | 73 | 73 | 68 | 71 | 71.4 | 2.074 |
| GBR | 51 | 52 | 51 | 47 | 52 | 50.6 | 2.074 |
| GHA | 1.5 | 2 | 1 | 5.5 | 2 | 2.4 | 1.782 |
| GRC | 31 | 38 | 37 | 33 | 36 | 35 | 2.915 |
| HRV | 71 | 70 | 70 | 67 | 69 | 69.4 | 1.517 |
| HUN | 67 | 68 | 71 | 73 | 72 | 70.2 | 2.588 |
| IDN | 25 | 25 | 27 | 27 | 26 | 26 | 1.000 |
| IND | 27 | 29 | 30 | 28 | 30 | 28.8 | 1.304 |
| IRE | 59 | 62 | 57 | 54 | 58 | 58 | 2.915 |
| ISL | 44 | 50 | 53 | 48 | 54 | 49.8 | 4.025 |
| ITA | 62 | 57 | 60 | 71 | 60 | 62 | 5.339 |
| JOR | 48 | 43 | 38 | 40 | 39 | 41.6 | 4.037 |
| JPN | 36 | 33 | 34 | 51 | 38 | 38.4 | 7.301 |
| KEN | 10 | 14 | 9 | 4 | 5 | 8.4 | 4.037 |
| KOR | 73 | 63 | 69 | 77 | 70 | 70.4 | 5.177 |
| LBN | 33 | 30 | 28 | 26 | 25 | 28.4 | 3.209 |
| LTU | 65 | 64 | 65 | 66 | 64.5 | 64.9 | 0.742 |
| LUX | 63 | 61 | 61 | 64 | 62 | 62.2 | 1.304 |
| LVA | 49 | 48 | 49 | 52 | 49 | 49.4 | 1.517 |
| MAR | 28 | 18 | 22 | 32 | 27 | 25.4 | 5.459 |
| MDG | 4 | 4.5 | 3 | 3 | 3 | 3.5 | 0.707 |
| MEX | 53 | 58 | 54 | 37 | 50 | 50.4 | 8.019 |
| MLI | 7 | 3 | 4.5 | 12 | 6 | 6.5 | 3.428 |
| MLT | 56.5 | 56 | 55 | 59 | 55 | 56.3 | 1.643 |
| MOZ | 20 | 27.5 | 26 | 18 | 20 | 22.3 | 4.177 |
| MWI | 1.5 | 4.5 | 2 | 1 | 1 | 2 | 1.458 |
| NER | 3 | 1 | 4.5 | 9 | 8 | 5.1 | 3.362 |
| NGA | 18 | 19.5 | 19 | 19 | 19 | 18.9 | 0.548 |
| NLD | 50 | 49 | 48 | 41 | 48 | 47.2 | 3.564 |
| PAK | 46 | 42 | 41 | 42 | 40 | 42.2 | 2.280 |
| PHL | 38 | 34 | 31 | 39 | 34 | 35.2 | 3.271 |
| POL | 76 | 75 | 76 | 74 | 75 | 75.2 | 0.837 |
| PRT | 55 | 59 | 66 | 69 | 68 | 63.4 | 6.107 |
| ROU | 34 | 35 | 36 | 35 | 35 | 35 | 0.707 |
| RUS | 58 | 53 | 56 | 65 | 57 | 57.8 | 4.438 |
| RWA | 6 | 10 | 10 | 2 | 7 | 7 | 3.317 |
| SAU | 39 | 39 | 39 | 31 | 37 | 37 | 3.464 |
| SDN | 17 | 24 | 18 | 15 | 16 | 18 | 3.536 |
| SEN | 24 | 22 | 23 | 23 | 22 | 22.8 | 0.837 |
| SLE | 15 | 17 | 20 | 14 | 18 | 16.8 | 2.387 |
| SVK | 47 | 44 | 43 | 50 | 45 | 45.8 | 2.775 |
| SVN | 41 | 41 | 42 | 46 | 41 | 42.2 | 2.168 |
| SWE | 70 | 69 | 63 | 62 | 63 | 65.4 | 3.782 |
| TUN | 32 | 26 | 29 | 36 | 29 | 30.4 | 3.782 |
| TUR | 35 | 31 | 33 | 34 | 33 | 33.2 | 1.483 |
| TZA | 14 | 15 | 14 | 16 | 15 | 14.8 | 0.837 |
| UGA | 16 | 19.5 | 17 | 10 | 13.5 | 15.2 | 3.616 |
| USA | 77 | 77 | 77 | 78 | 77.5 | 77.3 | 0.447 |
| VNM | 40 | 40 | 45 | 49 | 43 | 43.4 | 3.782 |
| ZAF | 30 | 37 | 35 | 25 | 31 | 31.6 | 4.669 |
| ZMB | 8 | 7 | 6 | 8 | 4 | 6.6 | 1.673 |
| ZWE | 22 | 23 | 21 | 22 | 24 | 22.4 | 1.140 |
Table 5.
Randomly generated weight scheme for the GLA process leading to rank a.
| Indicators: | R1 | R2 | R3 | R4 |
|---|---|---|---|---|
| i1: Percentage of sugar in diets | 0.193 | 0.165 | 0.352 | 0.29 |
| i2: Meat consumption levels | 0.494 | 0.044 | 0.167 | 0.294 |
| i3: Saturated fat consumption | 0.265 | 0.258 | 0.29 | 0.186 |
| i4: Salt consumption | 0.445 | 0.087 | 0.229 | 0.24 |
Table 6.
Combined average rankings (top 10 and bottom 10) of the 78 countries following the five GLAs based on the above (Table 4) randomly generated weighting schemes.
Table 6.
Combined average rankings (top 10 and bottom 10) of the 78 countries following the five GLAs based on the above (Table 4) randomly generated weighting schemes.
| Objects | Average | Std | [8] |
|---|---|---|---|
| Top 10 | |||
| MWI | 2 | 1.458 | MWI |
| GHA | 2.4 | 1.782 | GHA |
| MDG | 3.5 | 0.707 | MDG |
| NER | 5.1 | 3.362 | NER |
| ETH | 6.5 | 1.581 | ETH |
| MLI | 6.5 | 3.428 | RWA |
| ZMB | 6.6 | 1.673 | KEN |
| RWA | 7 | 3.317 | MLI |
| CMR | 8.4 | 1.140 | ZMB |
| KEN | 8.4 | 4.037 | CMR |
| Bottom 10 | |||
| HRV | 69.4 | 1.517 | HUN |
| HUN | 70.2 | 2.588 | HRV |
| KOR | 70.4 | 5.177 | AUT |
| AUT | 71 | 1.581 | FRA |
| FRA | 71.4 | 2.074 | KOR |
| BRA | 74.2 | 0.447 | BRA |
| ARG | 74.8 | 1.643 | POL |
| POL | 75.2 | 0.837 | ARG |
| USA | 77.3 | 0.447 | AUS |
| AUS | 77.5 | 0.866 | USA |
Disclaimer/Publisher’s Note: The statements, opinions and data contained in all publications are solely those of the individual author(s) and contributor(s) and not of MDPI and/or the editor(s). MDPI and/or the editor(s) disclaim responsibility for any injury to people or property resulting from any ideas, methods, instructions or products referred to in the content. |
© 2024 by the author. Licensee MDPI, Basel, Switzerland. This article is an open access article distributed under the terms and conditions of the Creative Commons Attribution (CC BY) license (https://creativecommons.org/licenses/by/4.0/).
Share and Cite
MDPI and ACS Style
Carlsen, L. Are Stakeholders’ Opinions Redundant? Standards 2024, 4, 39-51. https://doi.org/10.3390/standards4020003
AMA Style
Carlsen L. Are Stakeholders’ Opinions Redundant? Standards. 2024; 4(2):39-51. https://doi.org/10.3390/standards4020003
Chicago/Turabian StyleCarlsen, Lars. 2024. "Are Stakeholders’ Opinions Redundant?" Standards 4, no. 2: 39-51. https://doi.org/10.3390/standards4020003