
Exploration of the Effects of Cadmium Stress on Photosynthesis in Oenanthe javanica (Blume) DC.
by
 ,
,
Ronghua Zhou
1,
Jun Xu
1,
Liangjun Li
2,
Yulai Yin
1,*,
Bowen Xue
1,
Jingjing Li
1 and
Fangfang Sun
1,* 1
Suzhou Academy of Agricultural Sciences, Institute of Agricultural Sciences in Taihu Lake Region of Jiangsu, Suzhou 215105, China
2
School of Horticulture and Plant Protection, Yangzhou University, Yangzhou 225009, China
*
Authors to whom correspondence should be addressed.
Toxics 2024, 12(5), 307; https://doi.org/10.3390/toxics12050307
Submission received: 22 February 2024
/
Revised: 20 April 2024
/
Accepted: 22 April 2024
/
Published: 23 April 2024
(This article belongs to the Special Issue Toxicity Assessment of Environmental Pollutants towards Aquatic Organisms)
Abstract
:Cadmium ion (Cd2+) stress is a major abiotic stressor affecting plant photosynthesis. However, the impact of sustained high-concentration Cd stress on the photosynthetic electron transport chain of aquatic plants is currently unclear. Here, prompt fluorescence (PF), delayed fluorescence (DF), and P700 signals were simultaneously measured to investigate the effect of Cd stress on photosynthesis in water dropwort [Oenanthe javanica (Blume) DC.]. We aimed to elucidate how Cd stress continuously affects the electron transport chain in this species. The PF analysis showed that with prolonged Cd stress, the FJ, FI and FP steadily decreased, accompanied by a positive shift in the K-band and L-band. Moreover, JIP-test parameters, including TRO/ABS, ABS/CSO, TRO/CSO and PIABS, were significantly reduced. The P700 signals showed that exposure to Cd stress hindered both the fast decrease and slow increase phases of the MR transient, ultimately resulting in a gradual reduction in both VPSI and VPSII−PSI. The DF analysis showed a gradual decrease in the I1 and I2 values as the duration of stress from Cd increased. The above results suggested that Cd stress affected the photosynthetic electron transport in water dropwort by influencing the amount of active PSII and PSI, primarily affecting PSII RCs in the early to mid-stages and PSI reductive activity in the later stage.
1. Introduction
Heavy metal contamination is frequently observed as one of the abiotic stressors in agricultural production, especially in underdeveloped countries. The heavy metal content in agricultural land and irrigation water has constantly increased due to the heavy use of chemical fertilizers and the unreasonable discharge of “three wastes” from industrial facilities, seriously threatening the safety of aquatic vegetable production. Cd is the most toxic element among Category I harmful elements [1]. Easily absorbed by and accumulated in plants [2,3], Cd can produce toxic effects even at a low concentration [4,5]. It inhibits plant growth by causing yellowing and the shedding of leaves as well as reducing dry matter. In serious cases, it may cause plants to wither or even die [6,7,8].
Photosynthesis, a vital activity for plants, is a process in which plants fix CO2 and water using energy from sunlight, producing organic matter and finally releasing oxygen. Photosynthesis in plants is hindered by heavy metal stress [9,10,11,12]. Specifically, the synthesis of chlorophyll and carotene is inhibited, and the activity of key enzymes in photosynthesis is affected [13]. Furthermore, light-harvesting chlorophyll a/b binding proteins are downregulated [14], which hinders the process of photosynthesis and inhibits plant development [15,16]. Heavy metals such as Cd, Mn and Pb can markedly reduce the net photosynthetic rate (Pn), transpiration rate (E), stomatal conductance (Gs) and intercellular carbon dioxide concentration (Ci) of leaves [16,17], and result in a decrease in maximum photochemical efficiency (Fv/Fm), potential activity (Fv/Fo), PSII actual photochemical efficiency (ΦPSII), and photochemical quenching coefficient (qP) [18]. Chlorophyll fluorescence measurement technologies have recently been widely applied in the field of photosynthesis research. These technologies can be used to collect photosynthesis-related information from experimental materials without causing damage. The prompt chlorophyll a fluorescence (PF) transient (OJIP) can reflect the photochemical changes in photosystem II (PSII) before the activation of the dark reaction [19,20,21,22]. The modulated 820 nm reflection (MR) is an effective way to study the primary photochemical reaction and examine the redox activity of PSI [19,23]. Furthermore, the delayed chlorophyll a fluorescence (DF) can intuitively reflect the state of PSII. The above technologies have been extensively employed in research on stress resistance in corn, rice, wheat, and other major crops [24,25,26,27]. Cu stress reduces the number of oxygen-evolving complexes (OECs) and inhibits the photosynthetic electron transport of PSII in higher plants [28]. Barley and oilseed rape show similar responses under Cd stress [29,30]. Mn stress inhibits PSI oxidization-reduction reactions in Melia azedarach but not in Ligustrum lucidum [31]. The above studies mainly focused on xerophytic crops [32,33]. However, heavy metal ion pollution is more harmful to aquatic crops than to xerophytes due to the high mobility of these pollutants. As far as we know, there have been limited investigations into alterations in the photosynthetic function of aquatic vegetables caused by exposure to heavy metals. Furthermore, there is currently no research revealing the impact of heavy metal stress on the photosynthetic electron transport chain and its components in aquatic vegetables.
Water dropwort [Oenanthe javanica (Blume) DC.], a common aquatic vegetable in China, is favored by consumers because of its much higher nutritional and medicinal value compared with other common vegetables. In China, Cd pollution seriously threatens the production safety of water dropwort and other aquatic vegetables. However, there are few relevant reports about aquatic vegetables vulnerable to heavy metal pollution. Herein, the local variety “Yuqihongqin” was utilized as the experimental material to investigate the effects of high-concentration Cd stress on the photosynthetic electron transport chain and its components in water dropwort. We hypothesized that cadmium stress might impair multiple sites of the photosynthetic electron transport chain in water dropwort. Additionally, the injured sites may vary across distinct stages of Cd treatment. Our objectives were to investigate the impact of high concentration Cd stress on the photosynthetic electron transport chain and its components in water dropwort during different Cd treatment periods, to explore the target sites through which Cd2+ acts on photosynthetic components of water dropwort at different Cd treatment duration.
2. Materials and Methods
2.1. Plant Material and Growth Conditions
The local variety of O. javanica, “Yuqihongqin”, was employed as the experimental material. Planted in April 2020, the seedlings originated from the Vegetable Research Institute of Suzhou Academy of Agricultural Sciences (SAAS) and were cultivated in the Suzhou Cao-hu Agricultural Demonstration Garden. In early October 2020, seedlings with similar growth trends were randomly selected and transplanted in a vegetable experiment greenhouse for hydroponic experiments. During the experiment, the greenhouse was maintained at a temperature of 30/25 °C, with a diurnal cycle of 12/12 h, an approximate light intensity of 400 μmol m−2 s−1, and a relative humidity of 70%. After being washed with clean water, all seedlings were randomly planted in eighteen turnover boxes (43.3 cm × 30.8 cm × 14.5 cm) containing 10 L of Hoagland solution. Each box contained 10 seedlings, with a spacing of 8 cm between seedlings and a row spacing of 10 cm. During the experimental period, the nutrient solution in all the turnover boxes was supplemented every 3 d to reach a water volume of 10 L.
2.2. Cd Treatment
The treatment solutions were prepared with Cd chloride hemi (pentahydrate) (Sinopharm Chemical Reagent Co., Ltd., Shanghai, China: CdCl2∙2.5 H2O, F.W. 228.36; GB/T 1285-1994) to provide Cd2+. In this study, two treatments were established based on the preexperiment, with varying levels of Cd2+: (1) 0 mg L−1 Cd2+ (Cd0) and (2) 100 mg L−1 Cd2+ (Cd100). Each group included nine turnover boxes, for a total of 90 seedlings. The OJIP transient, MR transient, and DF induction decay curves of functional leaves of the water dropwort plant were measured at 0, 3, 6, 9, 12, and 15 days into Cd0 group or Cd100 group. After each fluorescence signal measurement, the plants were used to determine the pigment, hydrogen peroxide (H2O2), malondialdehyde (MDA) and Cd contents of water dropwort.
2.3. Determination of PF, MR, and DF
The simultaneous determination of OJIP transient, MR transient, and DF induction decay curves was performed with a multifunctional plant efficiency analyzer (M-PEA, Hansatech, Norfoik, UK) [34,35]. First, 5000 μmol m−2 s−1 red light (with a wavelength of 627 nm) was used to determine the three measures simultaneously, which was followed by light–dark conversion after exposure for 300 μs. The DF signal in the dark condition and the PF signal and MR signal in the light condition were recorded. The JIP-test of the PF curve was then carried out as described [19]. A total of sixteen parameters were developed from OJIP transients using the JIP-test (Table 1).
2.4. Quantification of Pigment, H2O2, MDA and Cd Contents
To determine the pigment content, 0.5 g of functional leaves were sliced into smaller pieces. Then, 10 mL of 80% acetone was added, and the mixture was stored in a freezer at −20 °C for 24 h to extract the pigments. Three milliliters of chlorophyll extract was taken, and the optical density (OD) values of the extract at 662, 645 and 470 nm were determined using a UV–Vis spectrophotometer (TU-1810, Beijing General, Beijing, China). Equations (1)–(3) were utilized to compute the quantities of chlorophyll a, chlorophyll b, and carotenoids [36].
Chlorophyll a = 12.25 × OD662 − 2.79 × OD645
Chlorophyll b = 21.50 × OD645 − 5.10 × OD662
Total carotenoids = (1000 × OD470 − 1.82 × Chl a − 85.02 × Chl b)/198
To determine the concentration of H2O2, 5 g of functional leaves was added to acetone (5 mL, 4 °C), ground into a homogeneous slurry, and then centrifuged at 3000 rpm for 10 min. One milliliter of the supernatant was taken and mixed with 5% titanium sulfate and concentrated ammonia, retaining the precipitate and discarding the supernatant. This process was repeated three times. The washed precipitate was completely dissolved in 5 mL of 2 mol sulfuric acid. The absorbance was measured at 415 nm using a UV–Vis spectrophotometer (TU-1810, Beijing General, Beijing, China). The H2O2 content was calculated by using Equation (4) [37].
where C is the concentration of H2O2 in the sample obtained by examining the standard curve; Vt is the total volume of the sample extraction solution; Vs is the volume of the sample extraction solution used during measurement; and W is the fresh weight of the sample.
H2O2 content = (C × Vt)/(Vs × W)
The determination of malondialdehyde (MDA) content was performed via thiobarbituric acid spectrophotometry [38]. Functional leaves weighing 0.05 g were sliced into fragments before being mixed with 2 mL of a 10% TCA solution to create a paste through grinding. Next, 3 mL of 10% TCA solution was added to continue the grinding process. The mixture obtained after crushing was transferred to a centrifuge tube with a capacity of 5 mL and subsequently centrifuged at 3000 rpm for 10 min. To perform the experiment, 2 mL of the supernatant was combined with 2 mL of TBA solution and thoroughly mixed, and the mixture was heated in a water bath for 20 min. In the control, the extract was substituted with 2 mL of distilled water. Following a quick cooling process, the mixture was separated using centrifugation, and the supernatant was collected for absorbance measurements at wavelengths of 532 nm, 600 nm, and 450 nm. The MDA content was calculated by using Equation (5).
where A is the absorbance value; Vt is the total volume of the sample extraction solution; Vs is the volume of the sample extraction solution used during measurement; and W is the fresh weight of the sample.
MDA content = [6.45 × (A532 − A600) − 0.56 × A450] × Vt/(Vs × W)
Water dropwort samples were analyzed for Cd content using microwave digestion-inductively coupled plasma–mass spectrometry (ICP–MS) [39]. Following the grinding of functional leaves of water dropwort into a fine powder, 0.2 g of the obtained sample was weighed out in a digestion jar. Then, 5 mL of HNO3 was introduced, and the samples were allowed to predigest at room temperature for 0.5 h. Subsequently, 2 mL of H2O2 was added. The digestion protocol was configured in the following manner: the temperature was elevated to 160 °C within a span of 10 min using 800 W and held steady for 5 min. Subsequently, the temperature was further increased to 200 °C over a duration of 10 min employing 1600 W and maintained at this level for 25 min. Following the digestion process, the sample was cooled to ambient temperature. The volume was adjusted to 50 mL using ultrapure water, and the concentration of Cd was analyzed using ICP–MS (NexION 2000 G, PerkinElmer, Waltham, MA, USA).
2.5. Data Processing
Both chlorophyll fluorescence and physiological parameters were statistically analyzed using SPSS 17.0 (IBM, New York, NY, USA) and plotted using SigmaPlot 12.5 (Systat Software Inc., San Jose, CA, USA). One-way analysis of variance (ANOVA) was used, and differences among different treatment durations (0, 3, 6, 9, 12, and 15 days) within the Cd0 group or Cd100 group were analyzed using Duncan’s multiple range test (p < 0.05). Values were expressed as the mean ± standard errors (SE) of five replicate samples (n = 5).
3. Results
3.1. Growth, Pigment Content, H2O2 Content, MDA Content and Cd Concentration
After 3 d of Cd100 treatment, the water dropwort in the Cd100 group showed a yellowing of leaves. As the Cd100 treatment continued, the plants further showed leaf wilting, stalk whitening, root rot, and plant wilting (Figure 1). The water dropwort in Cd0 group showed no significant changes throughout the entire experimental period.
The excess Cd caused a decrease in chlorophyll a and chlorophyll b contents compared with those at 0 d but had little effect on carotenoids (Figure 2a). The chlorophyll a and chlorophyll b contents decreased by 42.02% and 59.90%, respectively, within 15 d of Cd100 treatment, while the carotenoid content did not change significantly (Table S1). The chlorophyll a, chlorophyll b and carotenoids contents under Cd0 treatment showed no significant change within 15 d of experimental period (Figure 2b).
Under Cd0 treatment, there was no significant change in H2O2 (Figure 2c), MDA (Figure 2d) and leaf Cd2+ contents (Figure 2e) within 15 d of experimental period. Under high Cd stress (Cd100 treatment), the H2O2 content slightly increased from 0 d to 6 d of treatment. As the treatment continued, the H2O2 content significantly increased from 6 d to 15 d of treatment (Figure 2c), rising from 3.34 μmol g−1 to 6.45 μmol g−1 (Table S1). The trend for the MDA content was also sensitive to Cd2+ stress (Figure 2d). The MDA content significantly increased from 53.11 nmol g−1 to 78.48 nmol g−1 after 3 d of Cd2+ treatment and gradually increased to 107.46 nmol g−1 after 15 d of Cd100 treatment (Table S1). Water dropwort exhibited a strong ability to absorb Cd (Figure 2e). After 3 d of Cd100 treatment, the leaf Cd concentration increased from 1.13 mg kg−1 to 64.23 mg kg−1. As the Cd100 treatment continued, the Cd concentration in the leaves increased continuously, increasing by 1478.62% (Table S1) after 15 d of Cd100 treatment (compared with the concentrations on the third day).
3.2. Effect of Cd Stress on Rapid Chlorophyll Fluorescence Kinetic Curves and JIP-Test Parameters
Throughout the entire duration of the treatment, there were no significant alterations observed in the OJIP curve of samples belonging to the Cd0 group (Figure 3a). Moreover, their O-P standardized curves were consistent (Figure 3c). As the Cd100 treatment continued, points J, I, and P on the OJIP curve gradually decreased (Figure 3b). The J-I and I-P segments almost disappeared, and weak signals were detected only in the O-J segment (K-band) after 12 d of treatment. The fluorescence signals essentially disappeared after 15 d of treatment. Based on the standardization of the O-P segment on the OJIP curve of the Cd100 group, point J on the standardized curve was stably elevated from Day 6 on, while point I displayed an evident rise on Day 15 (Figure 3d).
To investigate the impact of Cd2+ stress on each part of the OJIP curve, the standardized O-K (L-band) curve (WOK) (Figure 4a) and the standardized K-band curve (WOJ) (Figure 4c) on the OJIP curve of the Cd100 group were obtained, and their differences from those on Day 0 were used to plot the difference kinetics curves ΔWOK (Figure 4b) and ΔWOJ (Figure 4d), respectively. A positive and rising L-band and K-band appeared after 3 d of Cd100 treatment (Figure 4b,d).
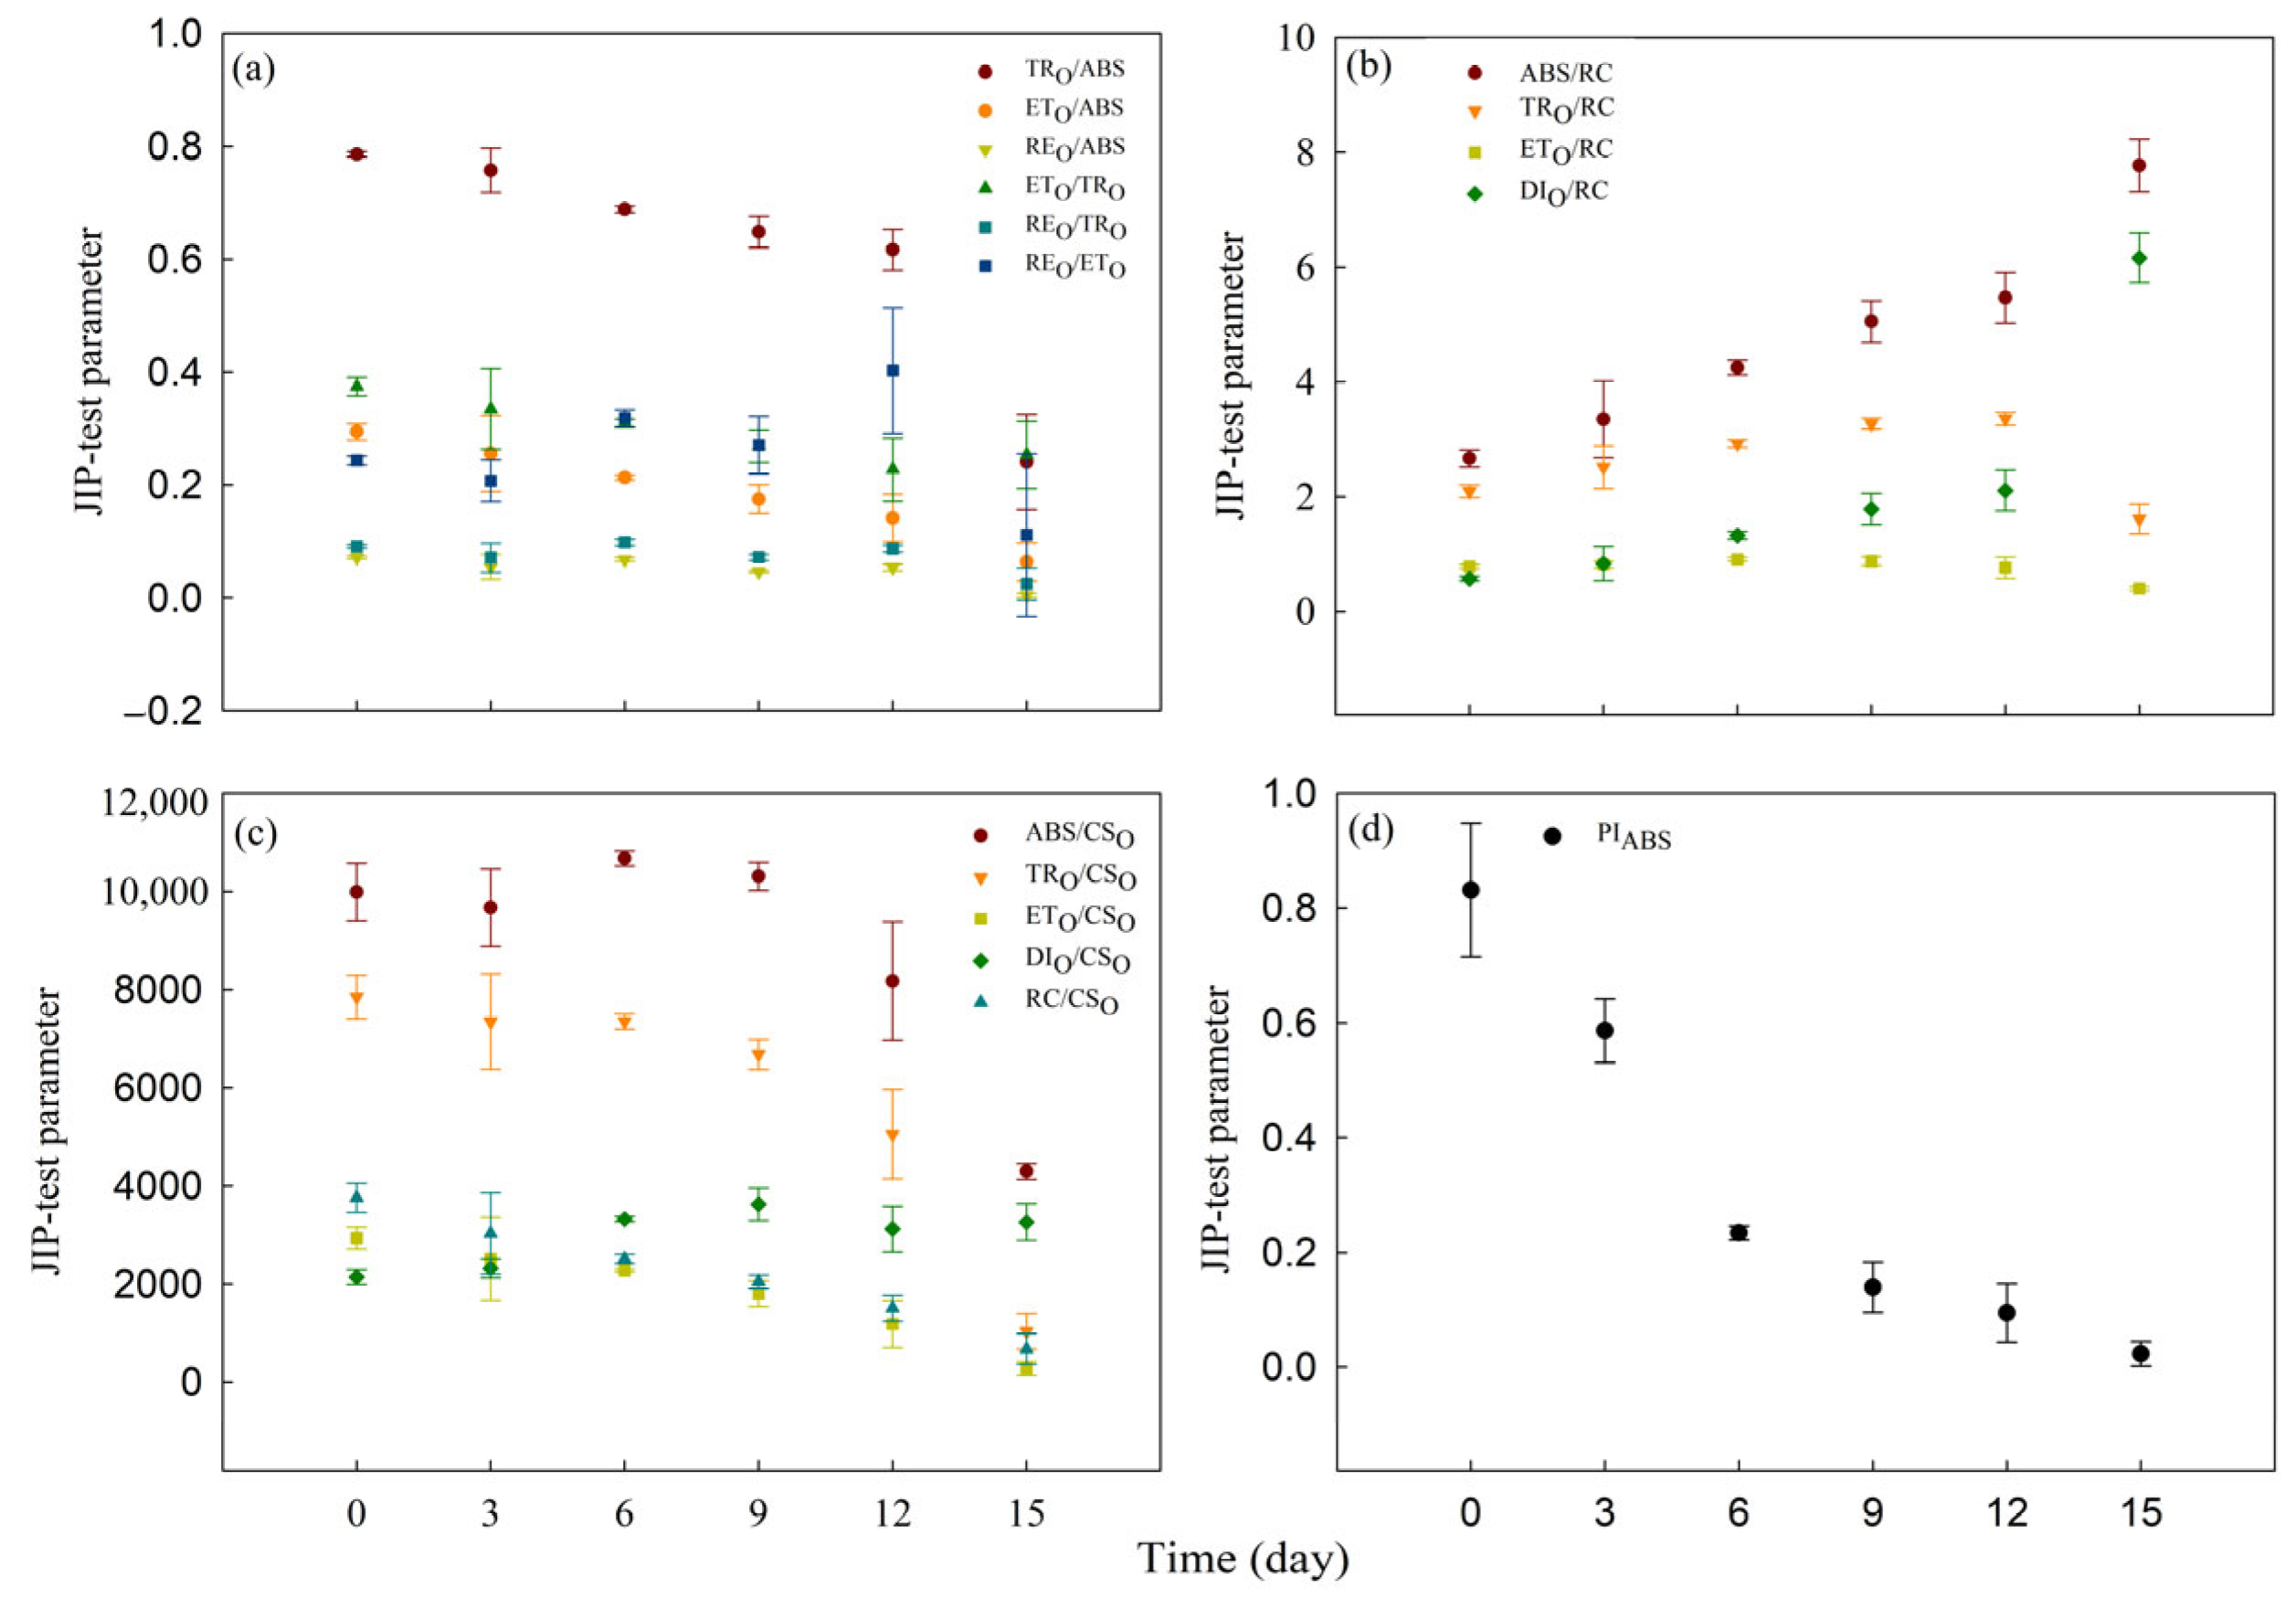
To quantify alterations in photosynthetic apparatus, we developed sixteen parameters from OJIP transients using the JIP-test. Within the 15 d of Cd0 treatment period, the values of TRO/ABS, ETO/ABS, REO/ABS, ETO/TRO, REO/TRO, REO/ETO, ABS/RC, TRO/RC, ETO/RC, DIO/RC, ABS/CSO, TRO/CSO, ETO/CSO, DIO/RC, RC/CSO and PIABS of water dropwort showed no significant change (Figure S1). Within the 15 d of Cd100 treatment period, the values of quantum efficiencies or flux ratios parameters (TRO/ABS, ETO/ABS, REO/ABS, ETO/TRO, REO/TRO and REO/ETO) all significantly decreased (Figure 5a, Table S2). Additionally, ETO/RC, TRO/CSO, ETO/CSO, RC/CSO and PIABS significantly decreased after 15 d of Cd100 treatment (Figure 5b,c), while ABS/RC and DIO/RC increased gradually with the duration of Cd100 treatment (Figure 5b, Table S2).
3.3. Effect of Cd Stress on MR
The redox state of PSI can be inferred from the MR curve. The MR/MRO curve of the Cd0 group showed no significant change throughout the entire experimental period (Figure 6a). On Day 0, the MR/MRO curve of the Cd100 group experienced two typical stages, i.e., fast-phase descent and slow-phase ascent stages (Figure 6b). After Cd100 treatment, both stages, as well as the lowest intersection point of the fast and slow phases, were consistently elevated. After 15 d of treatment, the ascent stage of the MR/MRO curve almost disappeared, and only a small descent stage could be observed.
To intuitively observe the redox state of PSI under Cd stress, the maximum descending slope VPSI, the maximum ascending slope VPSII−PSI, and their sum VPSII = VPSI + VPSII−PSI of the MR/MRO curve were calculated. After Cd100 treatment, both the VPSI and VPSII−PSI of the TR group declined over time, cumulatively decreasing by 81.98% and 89.81% after 15 d of treatment, respectively (Table 2).
3.4. Effect of Cd Stress on DF
The DF curves at the microsecond and millisecond scales mainly exhibited the redox states of the primary electron acceptor QA− and the P680+ acceptor side in the photosynthetic electron transport chain. In this experiment, the DF induction curve was generated by plotting the fluorescence signals at 20 μs (Figure 7). The DF curves and the double-normalized DF values of Cd0 group showed no significant change throughout the entire experimental period (Figure 7a,c). After Cd100 treatment, the amplitudes of the DF curves of specimens in the TR group gradually declined with time, with sharp decreases at the starting point D0, the first peak I1, and the second peak I2 (Figure 7b). After 15 d of Cd100 treatment, I1 and I2 decreased by 88.95% and 58.16%, respectively. The I2/I1 value also increased significantly after Cd100 treatment (Table S3). After the dual standardization of D0 and I1 (Figure 7d), no obvious difference in the initial rate at which D0 grew to I1 could be observed after the treatment, while I2 was markedly elevated in the late Cd100 treatment period, consistently revealing the increased I2/I1 value in this period.
4. Discussion
Cd is part of a group of highly toxic heavy metals that not only affect crop quality and yield in agricultural production [8,40,41] but also affect consumer health through food chain transport [42]. Cd pollution seriously threatens the production safety of aquatic vegetables. However, there are few relevant reports about aquatic vegetables vulnerable to Cd pollution. Here, we investigated for the first time the alterations in the photosynthetic electron transport pathway induced by Cd stress in water dropwort. Furthermore, we compared the target sites of Cd stress on the photosynthetic electron transport chain under different durations of Cd100 treatment. We demonstrated that a short-term high concentration of Cd2+ treatment primarily inactivated PSII RCs, whereas with prolonged cadmium exposure, the target sites shift towards the donor side of PSI.
Under non-stress conditions, the test material “Yuqihongqin” showed no significant changes in phenotypic characterization (Figure 1), physiological parameters (Figure 2), PF (Figure 3a), MR (Figure 6a) and DF (Figure 7a) within the 15 d of hydroponic treatment. However, under Cd100 treatment, symptoms of wilting, leaf wilting, and stalk whitening appeared in the plants (Figure 1). This suggests that excessive levels of Cd2+ hinder the growth and development of water dropwort. Water dropwort cultivated hydroponically exhibited a robust absorption of Cd2+ (Figure 2e). The accumulation of Cd2+ resulted in a significant decrease in chlorophyll a and chlorophyll b content (Figure 2a, Table S1). This result confirmed the previous conclusion that Cd2+ has an impact on the photosynthetic process [27,43,44,45,46]. The Cd100 treatment also resulted in a significant increase in H2O2 (Figure 2c) and MDA (Figure 2d) contents in water dropwort. This indicates that the continuous accumulation of Cd2+ in leaves increases the degree of cell oxidation damage, damaging the cell membrane and leading to the dysfunction of cell membrane [47,48]. The chlorophyll b content was more sensitive than chlorophyll a to Cd stress in this study (Table S1). As most of the chlorophyll b is associated with the light-harvesting complex I and II, a decline would suggest degradation of the antenna. Similarly, a decrease in chlorophyll a content would suggest a reduction in the amount of active PSII and PSI [49,50]. A similar alteration was reported for the purslane plants’ reduction in chlorophyll a and chlorophyll b content by 35 and 41%, respectively, when 300 mg kg−1 of Cd was added to the soil [51]. On the contrary, chlorophyll a content is more sensitive to Cd stress than chlorophyll b in soybean plants and lettuce plants [33,52]. The above results indicated that the extent of damage to chlorophyll a and chlorophyll b varies under Cd stress among different species.
The alterations in the primary photochemical reaction of PSII are mainly indicated by the OJIP curve. In this study, point J, point I, and point P on the water dropwort OJIP curve gradually fell with increasing Cd stress duration (Figure 3b). The decrease in fluorescence intensity indicates hindered photosynthetic electron transmission. A reduction in photosynthetic pigments, along with increases in MDA and H2O2 levels in physiological indicators, serves as strong evidence for this. Membrane damage and the degradation of photosynthetic pigments affect electron transmission between the photosystems. Point J on the standardized OJIP curve rose gradually, and the J-I segment rose significantly at the late stage of Cd100 treatment (Figure 3d). The electron transport rate from QA to QB in the photosynthetic electron transport chain is reflected by Point J on the OJIP curve [53,54]. The increased level J in the standardized curve indicates the hindrance of electron transfer from QA to QB, indicating that the rate of electron transfer at QA in the photosynthetic electron transport chain can be suppressed by Cd stress. The J-I segment on the standardized curve gradually rose after treatment, which indicates that PSII RCs were strongly repressed by Cd stress. The number of PSII RCs in water dropwort begins to decrease under the effect of Cd stress [27]. FP is a complex parameter that is dependent on the structural leaf tissue characteristics and the chlorophyll content in the leaf. Lower FP is related to the reduced chlorophyll a level (Figure 2a) [27,54,55], heightened non-radiative dissipation of PSII antenna chlorophylls [56], diminished PSII antenna size [57], impairment at the PSI accepter side [20], and/or decreased number of photosynthetic apparatus with fully closed PSII RCs [27,35]. This quasi-quenching effect on fluorescence yield indicates an inhibition of PSII electron transfer, decreasing the number of active reaction centers capable of supporting electron transfer to PSI [35,58,59,60]. The I-P segment has a relationship with the redox activity of PSI [23,61]. The segment was gradually reduced after the addition of Cd2+ in this study (Figure 3b), indicating that the redox activity of PSI is also affected by Cd stress. In addition, a favorable K-band and L-band appeared (Figure 4b,d). Similar phenomena have been found in other stressed crops, including corn [34], wheat [27] and rice [3]. The status of PSII components is well reflected by the L-band and K-band, which have been widely applied in research on photosynthesis under various kinds of stresses. The connectivity between all PSII components is mainly represented by the L-band [62,63], while the activity of the OEC and the electron transport ability of the donor side of PSII are represented by the K-band [61,64]. The K/L-band was positive and constantly increased with the continuous Cd100 treatment in this study, suggesting that Cd100 stress has a strong inhibitory effect on the connectivity of the OEC of PSII and among all PSII components in water dropwort.
In addition, all sixteen parameters of the JIP-test were measured to reveal the changes in each step of the photosynthetic process at different Cd100 treatment stages in water dropwort. JIP-test parameters allow the quantitative analysis of changes in the structure and function of components of the photosynthetic electron transport chain [58]. In the present study, all these parameters were changed by Cd stress. Most JIP test parameters exhibited a gradual change during the early to mid-stages of Cd100 treatment, followed by a rapid alteration at the later stage of treatment. The drop in TRO/ABS indicates that the light use efficiency of PSII RCs is lowered by Cd stress [39,65]. PIABS, a comprehensive performance index of PSII [25,58,66], is a more sensitive response index than TRO/ABS in quantitatively detecting the toxicity of heavy metals [67]. In this study, PIABS was more sensitive than TRO/ABS to Cd stress. The drop in PIABS indicates that Cd stress strongly inhibits the PSII activity of water dropwort. The increased DIO/RC and DIO/CSO suggest that Cd stress disrupted the photosynthetic electron transport process and induced the passive energy dissipation. After 12 d to 15 d of Cd100 treatment, there was a significant decline in REO/ETO and ABS/CSO. The decline in REO/ETO indicates a reduction in the transfer of electrons from QA− to the accepter side of PSI. The decline in ABS/CSO absorbed by the antenna pigments occurred during the later stages of treatment, suggesting a substantial degradation of the antenna pigments [27]. This is consistent with the decline in chlorophyll b content (Figure 2a). Moreover, although chlorophyll b is more sensitive to Cd stress than chlorophyll a (Table S1), the rise in ABS/RC and the decline in RC/CSO indicates that cadmium accumulation has a much greater impact on the quantity of PSII RCs than on the light-harvesting complex I and II. This aligns with the J-I standardized curve (Figure 3b) [24,25]. This indicates that the early reduction in chlorophyll b does not impact the absorption of light energy by the antenna. The quantities of light-harvesting complexes I and II are redundant; even with partial antenna degradation, the remaining antenna complex can still absorb sufficient light and transfer electrons downstream to the photosynthetic electron transport chain. Instead, the crucial factor influencing the efficiency of photosynthetic electron transport is the amount of active PSII and PSI in chlorophyll a.
The MR/MRO curve indicated that Cd stress weakened the photochemical function of PSI. The descending and ascending phases of the MR/MRO curve, respectively, reflect the oxidation and reduction in PSI [57]. Within 12 d after treatment, the decreases in the VPSI and VPSII − PSI rates were practically identical (Table 2), suggesting that the photochemical function of PSI during this timeframe is primarily constrained by the rate of electron transport from the donor side of PSII to the receptor side of PSI. The suppressive effect of Cd stress on PSII surpassed its effect on PSI. The decrease in PSI reduction activity during the early to mid-stages of Cd100 treatment can be attributed to the reduced number of active PSII RCs, leading to a decrease in electron supply capacity. [23,36]. This deduction is consistent with the decrease in RC/CSO (Figure 5c) and the chlorophyll a content (Figure 2a). After 15 d of treatment, VPSII − PSI showed no indication, and VPSI displayed a faint indication (Table 2). This indicates that Cd stress completely eliminates the reduction activity of PSI while partially preserving its oxidation activity. The inhibitory effect of Cd stress on PSI was stronger than that on PSII at this time. The potential decline in the photosynthetic capacity of water dropwort could primarily be attributed to the vanishing reduction function of PSI [20].
The DF results demonstrated that the DF intensity of water dropwort decreased gradually due to Cd stress (Figure 7b), implying that the number of active PSII RCs could be lessened by Cd stress, weakening the ability of PSII to supply electrons for downstream processes [19,68]. This is consistent with the conclusions drawn from the decrease in chlorophyll content (Figure 2a), RC/CSO (Figure 5c) and MR parameters (Table 2). Point I1 of the DF is correlated with the electron transport ability of the donor/receptor side of PSII and the number of PSII RCs [19,69]. Therefore, the drop in I1 (Figure 7a) is attributed to the reduction in the number of PSII RCs and the decreased electron transport rate from QA to QB. Point I2 of the DF curve typically corresponds to the I-P phase on the OJIP curve and the ascending phase on the MR/MRO curve, which is associated with the reduction in the PSI accepter side [26,70]. Consistent with the aforementioned results of PF and MR, the decrease in I1 and I2 (Figure 7b) indicates a reduction in the quantity of PSII RCs and decrease in the reduction activity of PSI with the continuous accumulation of Cd2+ [64]. Other studies [20,71,72] have noted that the I2/I1 value is associated with the electron transport ability of the PSII donor side. This value significantly increased with Cd100 treatment duration in this study (Table S3), indicating that the electron transport ability of the PSII donor side declined uninterruptedly, consistent with the results for the pigment changes, I-P segment, K-band, JIP-test and MR curves above.
5. Conclusions
This study examined the impact of exposure to elevated levels of Cd2+ on the photosynthetic electron transport chain and its constituents in water dropwort during different treatment periods. The findings indicated that exposure to Cd2+ had a detrimental effect on various components of the photosynthetic electron transport pathway in water dropwort. At the early and middle stages of Cd100 treatment, the damage caused by cadmium accumulation is more pronounced on PSII than PSI. Cd2+ stress led to the inactivation of PSII reaction centers (RCs), destruction of the oxygen evolving complex (OEC), obstruction of electron transfer from QA to QB, decreased connectivity between independent PSII units, and the blockage of PSI accepter-side electron transporters in water dropwort leaves. At the later stages of Cd100 treatment, the numbers of active PSII RCs were significantly reduced, and the connectivity between independent PSII units further deteriorated. The disruption of the photosynthetic electron transport chain due to cadmium accumulation extended to the donor side of PSI, resulting in the loss of PSI reduction activity. At this time, the downstream pathways are blocked, although PSII still has some photosynthetic activity. In summary, the amount of active PSII and PSI associated with chlorophyll a is crucial in influencing the changes in the photosynthetic electron transport. A short-term high-concentration Cd2+ treatment primarily inactivated PSII RCs and affected the photosynthetic electron transport of PSII. With prolonged Cd2+ treatment, the target sites shift to the donor side of PSI and completely inhibit the reduction activity of PSI.
Supplementary Materials
The following supporting information can be downloaded at: https://www.mdpi.com/article/10.3390/toxics12050307/s1, Figure S1: Relative changes in JIP-test parameters after 15 d of Cd0 treatment. (a) TRO/ABS, ETO/ABS, REO/ABS, ETO/TRO, REO/TRO and REO/ETO; (b) ABS/RC, TRO/RC, ETO/RC, DIO/RC; (c) ABS/CSO, TRO/CSO, ETO/CSO, DIO/CSO, RC/CSO; (d) PIABS. The average of five replicates is used as the value, and the error was determined based on this value (n = 5).; Table S1: Physiological parameters of the Cd100 group on the 0th, 3rd, 6th, 9th, 12th and 15th days of treatment; Table S2: Physiological parameters of the Cd100 group on the 0th, 3rd, 6th, 9th, 12th and 15th days of treatment; Table S3: DF parameters of the Cd100 group on the 0th, 3rd, 6th, 9th, 12th and 15th days of treatment.
Author Contributions
Conceptualization, F.S. and R.Z.; methodology, R.Z.; software, F.S.; validation, R.Z., Y.Y. and J.X.; formal analysis, B.X.; investigation, F.S.; resources, L.L.; data curation, B.X.; writing—original draft preparation, J.L.; writing—review and editing, R.Z.; visualization, Y.Y.; supervision, Y.Y.; project administration, F.S.; funding acquisition, F.S. All authors have read and agreed to the published version of the manuscript.
Funding
Jiangsu Province Seed Industry Revitalization Unveiled Project (JBGS (2021)017); Suzhou Agricultural Science and Education Project, Foundation of Suzhou Academy of Agricultural Sciences (SAAS-20032); Suzhou Science and Technology Plan Project (2022SS21); Suzhou Agricultural Modernization (Special Project for Seed Industry Development-2024) and Jiangsu Province Agricultural Science and Technology Innovation Fund Project (CX (22)3179).
Institutional Review Board Statement
Not applicable.
Informed Consent Statement
Not applicable.
Data Availability Statement
All original contributions presented in the study are included in the article. Further inquiries can be directed to the corresponding author.
Conflicts of Interest
The authors declare no conflicts of interest.
References
- Tötsch, W. Cadmium-towards a rational use of a toxic element. Environ. Manag. 1990, 14, 333–338. [Google Scholar] [CrossRef]
- Grant, C.A.; Clarke, J.M.; Duguid, S.; Chaney, R.L. Selection and breeding of plant cultivars to minimize cadmium accumulation. Sci. Total Environ. 2008, 390, 301–310. [Google Scholar] [CrossRef] [PubMed]
- Rizwan, M.; Ali, S.; Adrees, M.; Rizvi, H.; Ziaur-Rehman, M.; Hannan, F.; Qayyum, M.F.; Hafeez, F.; Ok, Y.S. Cadmium stress in rice: Toxic effects, tolerance mechanisms, and management: A critical review. Environ. Sci. Pollut. R 2016, 23, 17859–17879. [Google Scholar] [CrossRef] [PubMed]
- Nagajyoti, P.C.; Lee, K.D.; Sreekanth, T.V.M. Heavy metals, occurrence and toxicity for plants: A review. Environ. Chem. Lett. 2010, 8, 199–216. [Google Scholar] [CrossRef]
- Lysenko, E.A.; Klaus, A.A.; Kartashov, A.V.; Kusnetsov, V.V. Distribution of Cd and other cations between the stroma and thylakoids: A quantitative approach to the search for Cd targets in chloroplasts. Photosynth. Res. 2018, 139, 337–358. [Google Scholar] [CrossRef] [PubMed]
- Singh, H.P.; Mahajan, P.; Kaur, S.; Batish, D.R.; Kohli, R.K. Cadmium: Toxicity and tolerance in plants. Environ. Chem. Lett. 2013, 11, 229–254. [Google Scholar] [CrossRef]
- Tran, T.A.; Popova, L.P. Functions and toxicity of cadmium in plants: Recent advances and future prospects. Turk. J. Bot. 2013, 37, 1–13. [Google Scholar] [CrossRef]
- He, S.; Yang, X.; He, Z.; Baligar, V.C. Morphological and physiological responses of plants to cadmium toxicity: A review. Pedosphere 2017, 27, 421–438. [Google Scholar] [CrossRef]
- Papazoglou, E.G.; Karantounias, G.A.; Vemmos, S.N.; Bouranis, D.L. Photosynthesis and growth responses of giant reed (Arundo donax L.) to the heavy metals Cd and Ni. Environ. Int. 2005, 31, 243–249. [Google Scholar] [CrossRef]
- Hattab, S.; Dridi, B.; Chouba, L.; Kheder, M.B.; Bousetta, H. Photosynthesis and growth responses of pea Pisum sativum L. under heavy metals stress. J. Environ. Sci. 2009, 21, 1552–1556. [Google Scholar] [CrossRef]
- Pogrzeba, M.; Rusinowski, S.; Sitko, K.; Krzyżak, J.; Skalska, A.; Małkowski, E.; Ciszek, D.; Werle, S.; McCalmont, J.P.; Mos, M.; et al. Relationships between soil parameters and physiological status of Miscanthus x giganteus cultivated on soil contaminated with trace elements under NPK fertilisation vs. microbial inoculation. Environ. Pollut. 2017, 225, 163–174. [Google Scholar] [CrossRef] [PubMed]
- Lysenko, E.A.; Klaus, A.A.; Kartashov, A.V.; Kusnetsov, V.V. Specificity of Cd, Cu, and Fe effects on barley growth, metal contents in leaves and chloroplasts, and activities of photosystem I and photosystem II. Plant Physiol. Biochem. 2020, 147, 191–204. [Google Scholar] [CrossRef] [PubMed]
- Jiang, W.; Xu, L.; Liu, Y.; Su, W.; Yan, J.; Xu, D. Effect of Biochar on the Growth, Photosynthesis, Antioxidant System and Cadmium Content of Mentha piperita ‘Chocolate’ and Mentha spicata in Cadmium-Contaminated Soil. Agronomy 2022, 12, 2737. [Google Scholar] [CrossRef]
- Rodriguez, E.; Santos, C.; Azevedo, R.; Moutinho-Pereira, J.; Correia, C.; Dias, M.C. Chromium (VI) induces toxicity at different photosynthetic levels in pea. Plant Physiol. Bioch. 2012, 53, 94–100. [Google Scholar] [CrossRef] [PubMed]
- Moradi, L.; Ehsanzadeh, P. Effects of Cd on photosynthesis and growth of safflower (Carthamus tinctorius L.) genotypes. Photosynthetica 2015, 53, 506–518. [Google Scholar] [CrossRef]
- Zhang, X.F.; Zhang, X.H.; Gao, B.; Li, Z.; Xia, H.P.; Li, H.F.; Li, J. Effect of cadmium on growth, photosynthesis, mineral nutrition and metal accumulation of an energy crop, king grass (Pennisetum americanum × P. purpureum). Biomass Bioenergy 2014, 67, 179–187. [Google Scholar] [CrossRef]
- Subrahmanyam, D.; Rathore, V.S. Influence of Manganese Toxicity on Photosynthesis in Ricebean (Vigna Umbellata) Seedlings. Photosynthetica 2021, 38, 449–453. [Google Scholar] [CrossRef]
- Qin, J.; Jiang, X.; Qin, J.; Zhao, H.; Dai, M.; Liu, H.; Chen, X. Effects of Lead Pollution on Photosynthetic Characteristics and Chlorophyll Fluorescence Parameters of Different Populations of Miscanthus floridulus. Processes 2023, 11, 1562. [Google Scholar] [CrossRef]
- Strasser, R.J.; Tsimilli-Michael, M.; Qiang, S.; Goltsev, V. Simultaneous in vivo recording of prompt and delayed fluorescence and 820-nm reflection changes during drying and after rehydration of the resurrection plant Haberlea rhodopensis. Biochim. Biophys. Acta 2010, 1797, 1313–1326. [Google Scholar] [CrossRef]
- Oukarroum, A.; Goltsev, V.; Strasser, R.J. Temperature effects on pea plants probed by simultaneous measurements of the kinetics of prompt fluorescence, delayed fluorescence and modulated 820 nm reflection. PLoS ONE 2013, 8, e59433. [Google Scholar] [CrossRef]
- Gao, J.; Li, P.; Ma, F.; Goltsev, V. Photosynthetic performance during leaf expansion in Malus micromalus probed by chlorophyll a fluorescence and modulated 820 nm reflection. J. Photochem. Photobiol. B Biol. 2014, 137, 144–150. [Google Scholar] [CrossRef] [PubMed]
- Duan, Y.; Zhang, M.; Gao, J.; Li, P.; Goltsev, V.; Ma, F. Thermotolerance of apple tree leaves probed by chlorophyll a fluorescence and modulated 820 nm reflection during seasonal shift. J. Photochem. Photobiol. B Biol. 2015, 152, 347–356. [Google Scholar] [CrossRef] [PubMed]
- Schansker, G.; Srivastava, A.; Strasser, R.J. Characterization of the 820-nm transmission signal paralleling the chlorophyll a fluorescence rise (OJIP) in pea leaves. Funct. Plant Biol. 2003, 30, 785–796. [Google Scholar] [CrossRef] [PubMed]
- Mehta, P.; Jajoo, A.; Mathur, S.; Bharti, S. Chlorophyll a fluorescence study revealing effects of high salt stress on Photosystem II in wheat leaves. Plant Physiol. Biochem. 2010, 48, 16–20. [Google Scholar] [CrossRef] [PubMed]
- Chen, S.; Yang, J.; Zhang, M.; Strasser, R.J.; Qiang, S. Classification and characteristics of heat tolerance in Ageratina adenophora populations using fast chlorophyll a fluorescence rise O-J-I-P. Environ. Exp. Bot. 2016, 122, 126–140. [Google Scholar] [CrossRef]
- Dąbrowski, P.; Kalaji, M.H.; Baczewska, A.H.; Pawluśkiewicz, B.; Mastalerczuk, G.; Borawska-Jarmułowicz, B.; Paunov, M.; Goltsev, V. Delayed chlorophyll a fluorescence, MR 820, and gas exchange changes in perennial ryegrass under salt stress. J. Lumin. 2017, 183, 322–333. [Google Scholar] [CrossRef]
- Paunov, M.; Koleva, L.; Vassilev, A.; Vangronsveld, J.; Goltsev, V. Effects of different metals on photosynthesis: Cadmium and zinc affect chorophyll fluorescence in durum wheat. Int. J. Mol. Sci. 2018, 19, 787. [Google Scholar] [CrossRef] [PubMed]
- Yruela, I.; Pueyo, J.J.; Alonso, P.J.; Picorel, R. Photoinhibition of Photosystem II from Higher Plants. J. Biol. Chem. 1996, 271, 27408–27415. [Google Scholar] [CrossRef] [PubMed]
- Vassilev, A.; Lidon, F.; Scotti, P.; Da Graca, M.; Yordanov, I. Cadmium-induced Changes in Chloroplast Lipids and Photosystem Activities in Barley Plants. Biol. Plant. 2004, 48, 153–156. [Google Scholar] [CrossRef]
- Janeczko, A.; Koscielniak, J.; Pilipowicz, M.; Szarek-Lukaszewska, G.; Skoczowski, A. Protection of winter rape photosystem 2 by 24-epibrassinolide under cadmium stress. Photosynthetica 2005, 43, 293–298. [Google Scholar] [CrossRef]
- Liu, M.S.; Huang, X.H.; Wang, R.J.; Xu, H.Y.; Zhu, F. Inhibition of photosynthesis in Melia azedarach and Ligustrum lucidum induced by manganese toxicity using OJIP chlorophyll a fluorescence transient. Photosynthetica 2021, 59, 148–159. [Google Scholar] [CrossRef]
- Baszyński, T. Interference of Cd2+ in Functioning of the Photosynthetic Apparatus of Higher Plants. Acta Soc. Bot. Pol. 2014, 55, 291–304. [Google Scholar] [CrossRef]
- Xue, Z.C.; Gao, H.Y.; Zhang, L.T. Effects of Cadmium on Growth, Photosynthetic Rate and Chlorophyll Content in Leaves of Soybean Seedlings. Biol. Plant. 2013, 57, 587–590. [Google Scholar] [CrossRef]
- Kan, X.; Ren, J.; Chen, T.; Cui, M.; Li, C.; Zhou, R.; Zhang, Y.; Liu, H.; Deng, D.; Yin, Z.T. Effects of salinity on photosynthesis in maize probed by prompt fluorescence, delayed fluorescence and P700 signals. Environ. Exp. Bot. 2017, 140, 56–64. [Google Scholar] [CrossRef]
- Zhou, R.; Kan, X.; Chen, J.; Hua, H.; Li, Y.; Ren, J.; Feng, K.; Liu, H.; Deng, D.; Yin, Z. Drought-induced changes in photosynthetic electron transport in maize probed by prompt fluorescence, delayed fluorescence, P700 and cyclic electron flow signals. Environ. Exp. Bot. 2019, 158, 51–62. [Google Scholar] [CrossRef]
- Lichtenthaler, H.K. Chlorophylls and carotenoids: Pigments of photosynthetic biomembrans. Methods Enzymol. 1987, 148, 350–382. [Google Scholar] [CrossRef]
- Satterfield, C.N.; Bonnell, A.H. Interferences in Titanium Sulfate Method for Hydrogen Peroxide. Anal. Chem. 1955, 27, 1174–1175. [Google Scholar] [CrossRef]
- Senthilkumar, M.; Amaresan, N.; Sankaranarayanan, A. Estimation of Malondialdehyde (MDA) by Thiobarbituric Acid (TBA) Assay. In Plant-Microbe Interactions; Springer: Berlin/Heidelberg, Germany, 2021; pp. 103–105. [Google Scholar] [CrossRef]
- Noël, L.; Dufailly, V.; Lemahieu, N.; Vastel, C.; Guérin, T. Simultaneous analysis of cadmium, lead, mercury, and arsenic content in foodstuffs of animal origin by inductively coupled plasma/mass spectrometry after closed vessel microwave digestion: Method validation. J AOAC Int. 2005, 88, 1811–1821. [Google Scholar] [CrossRef]
- Anjum, S.A.; Tanveer, M.; Hussain, S.; Shahzad, B.; Ashraf, U.; Fahad, S.; Hassan, W.; Jan, S.; Khan, L.; Saleem, M.F.; et al. Osmoregulation and antioxidant production in maize under combined cadmium and arsenic stress. Environ. Sci. Pollut. Res. Int. 2016, 23, 11864–11875. [Google Scholar] [CrossRef] [PubMed]
- Baczek-Kwinta, R.; JuzoŃ, K.; Borek, M.; Antonkiewicz, J. Photosynthetic response of cabbage in cadmium-spiked soil. Photosynthetica 2019, 57, 731–739. [Google Scholar] [CrossRef]
- Satarug, S.; Garrett, S.H.; Sens, M.A.; Sens, D.A. Cadmium, environmental exposure, and health outcomes. Environ. Health Perspect. 2010, 118, 182–190. [Google Scholar] [CrossRef]
- Liu, B.; An, C.; Jiao, S.; Jia, F.; Liu, R.; Wu, Q.; Dong, Z. Impacts of the Inoculation of Piriformospora indica on Photosynthesis, Osmoregulatory Substances, and Antioxidant Enzymes of Alfalfa Seedlings under Cadmium Stress. Agriculture 2022, 12, 1928. [Google Scholar] [CrossRef]
- Ci, D.; Jiang, D.; Wollenweber, B.; Dai, T.; Jing, Q.; Cao, W. Cadmium stress in wheat seedlings: Growth, cadmium accumulation and photosynthesis. Acta Physiol. Plant 2010, 32, 365–373. [Google Scholar] [CrossRef]
- Yang, Y.; Zhang, L.; Huang, X.; Zhou, Y.; Quan, Q.; Li, Y.; Zhu, X. Response of photosynthesis to different concentrations of heavy metals in Davidia involucrata. PLoS ONE 2020, 15, e0228563. [Google Scholar] [CrossRef] [PubMed]
- Baruah, N.; Gogoi, N.; Roy, S.; Bora, P.; Chetia, J.; Zahra, N.; Ali, N.; Gogoi, P.; Farooq, M. Phytotoxic Responses and Plant Tolerance Mechanisms to Cadmium Toxicity. J. Soil Sci. Plant Nutr. 2023, 23, 4805–4826. [Google Scholar] [CrossRef]
- Popova, A.V.; Borisova, P.; Vasilev, D. Response of Pea Plants (Pisum sativum cv. Ran 1) to NaCl Treatment in Regard to Membrane Stability and Photosynthetic Activity. Plants 2023, 12, 324. [Google Scholar] [CrossRef]
- Desoky, E.-S.M.; Merwad, A.-R.M.A.; Abo El-Maati, M.F.; Mansour, E.; Arnaout, S.M.A.I.; Awad, M.F.; Ramadan, M.F.; Ibrahim, S.A. Physiological and Biochemical Mechanisms of Exogenously Applied Selenium for Alleviating Destructive Impacts Induced by Salinity Stress in Bread Wheat. Agronomy 2021, 11, 926. [Google Scholar] [CrossRef]
- Yaghoubian, Y.; Siadat, S.A.; Moradi Telavat, M.R.; Pirdashti, H. Quantify the response of purslane plant growth, photosynthesis pigments and photosystem II photochemistry to cadmium concentration gradients in the soil. Russ. J. Plant Physiol. 2016, 63, 77–84. [Google Scholar] [CrossRef]
- Chen, X.; Tao, H.; Wu, Y.; Xu, X. Effects of Cadmium on metabolism of photosynthetic pigment and photosynthetic system in Lactuca sativa L. revealed by physiological and proteomics analysis. Sci. Hortic. 2022, 305, 111371. [Google Scholar] [CrossRef]
- Takabayashi, A.; Kurihara, K.; Kuwano, M.; Kasahara, Y.; Tanaka, R.; Tanaka, A. The Oligomeric States of the Photosystems and the Light-Harvesting Complexes in the Chl b-Less Mutant. Plant Cell Physiol. 2011, 52, 2103–2114. [Google Scholar] [CrossRef]
- Dias, M.C.; Monteiro, C.; Moutinho-Pereira, J.; Correia, C.; Goncalves, B.; Santos, C. Cadmium toxicity affects photosynthesis and plant growth at different levels. Acta Physiol. Plant. 2013, 35, 1281–1289. [Google Scholar] [CrossRef]
- Toth, S.Z.; Schansker, G.; Garab, G.; Strasser, R.J. Photosynthetic electron transport activity in heat-treated barley leaves: The role of internal alternative electron donors to photosystem II. Biochim. Biophys. Acta 2007, 1767, 295–305. [Google Scholar] [CrossRef]
- Gao, Y.; Liu, W.; Wang, X.; Yang, L.; Han, S.; Chen, S.; Strasser, R.J.; Valverde, B.E.; Qiang, S. Comparative phytotoxicity of usnic acid, salicylic acid, cinnamic acid and benzoic acid on photosynthetic apparatus of Chlamydomonas reinhardtii. Plant Physiol. Biochem. 2018, 128, 1–12. [Google Scholar] [CrossRef]
- Yamane, Y.; Kashino, Y.; Koike, H.; Satoh, K. Increases in the fluorescence Fo level and reversible inhibition of photosystem II reaction center by high-temperature treatments in higher plants. Photosynth. Res. 1997, 52, 57–64. [Google Scholar] [CrossRef]
- Oukarroum, A.; Bussotti, F.; Goltsev, V.; Kalaji, H.M. Correlation between reactive oxygen species production and photochemistry of photosystems I and II in Lemna gibba l plants under salt stress. Environ. Exp. Bot. 2015, 109, 80–88. [Google Scholar] [CrossRef]
- Oukarroum, A.; Gharous, M.E.; Goltsev, V.; Strasser, R.J. Delayed fluorescence emission as a probe for the response of photosynthetic organisms to high temperature exposure: A comparative study. J. Lumin. 2016, 180, 321–327. [Google Scholar] [CrossRef]
- Strasser, R.J.; Tsimilli-Michael, M.; Srivastava, A. Analysis of the chlorophyll a fluorescence transient. In Chlorophyll a fluorescence: A Signature of Photosynthesis; Papageorgiou, G.C., Ed.; Springer: Berlin/Heidelberg, Germany, 2004; pp. 321–362. [Google Scholar] [CrossRef]
- Dąbrowski, P.; Baczewska, A.H.; Bussotti, F.; Pollastrini, M.; Piekut, K.; Kowalik, W.; Wróbel, J.; Kalaji, H.M. Photosynthetic efficiency of Microcystis ssp. under salt stress. Environ. Exp. Bot. 2021, 186, 104459. [Google Scholar] [CrossRef]
- He, Y.; Lu, C.; Jiang, Z.; Sun, Y.; Liu, H.; Yin, Z. NADH dehydrogenase-like complex L subunit improves salt tolerance by enhancing photosynthetic electron transport. Plant Physiol. Biochem. 2024, 207, 108420. [Google Scholar] [CrossRef]
- Dąbrowski, P.; Baczewska, A.H.; Pawluskiewicz, B.; Paunov, M.; Alexantrov, V.; Goltsev, V.; Kalaji, M.H. Prompt chlorophyll a fluorescence as a rapid tool for diagnostic changes in PSII structure inhibited by salt stress in perennial ryegrass. J. Photochem. Photobiol. B Biol. 2016, 157, 22–31. [Google Scholar] [CrossRef]
- Dabrowski, P.; Baczewska, A.H.; Kalaji, H.M.; Goltsev, V.; Paunov, M.; Rapacz, M.; Wójcik-Jagła, M.; Pawluśkiewicz, B.; Bąba, W.; Brestic, M. Exploration of chlorophyll a fluorescence and plant gas exchange parameters as indicators of drought tolerance in perennial ryegrass. Sensors 2019, 19, 2736. [Google Scholar] [CrossRef]
- Rastogi, A.; Zivcak, M.; Tripathi, D.K.; Yadav, S.; Kalaji, H.M. Phytotoxic effect of silver nanoparticles in Triticum aestivum: Improper regulation of photosystem I activity as the reason for oxidative damage in the chloroplast. Photosynthetica 2019, 57, 209–216. [Google Scholar] [CrossRef]
- Kalaji, H.M.; Račková, L.; Paganová, V.; Swoczyna, T.; Rusinowski, S.; Sitko, K. Can chlorophyll-a fluorescence parameters be used as bio-indicators to distinguish between drought and salinity stress in Tilia cordata Mill? Environ. Exp. Bot. 2018, 152, 149–157. [Google Scholar] [CrossRef]
- Pavlović, I.; Mlinarić, S.; Tarkowská, D.; Oklestkova, J.; Novak, O.; Lepeduš, H.; Bok, V.V.; Brkanac, S.R.; Strnad, M.; Salopek-Sondi, B. Early Brassica crops responses to salinity stress: A comparative analysis between Chinese cabbage, white cabbage, and kale. Front. Plant. Sci. 2019, 10, 450. [Google Scholar] [CrossRef]
- Chen, W.; Jia, B.; Chen, J.; Feng, Y.; Li, Y.; Chen, M.; Liu, H.; Yin, Z. Effects of Different Planting Densities on Photosynthesis in Maize Determined via Prompt Fluorescence, Delayed Fluorescence and P700 Signals. Plants 2021, 10, 276. [Google Scholar] [CrossRef]
- Gan, T.; Yin, G.; Zhao, N.; Tan, X.; Wang, Y. A Sensitive Response Index Selection for Rapid Assessment of Heavy Metals Toxicity to the Photosynthesis of Chlorella pyrenoidosa Based on Rapid Chlorophyll Fluorescence Induction Kinetics. Toxics 2023, 11, 468. [Google Scholar] [CrossRef]
- Dąbrowski, P.; Keutgen, A.J.; Keutgen, N.; Sierka, E.; Baczewska- Dąbrowska, A.H.; Mojski, J.; Pawluśkiewicz, B.; Sieczko, L.; Kalaji, A.H. Photosynthetic efficiency of perennial ryegrass (Lolium perenne L.) seedlings in response to Ni and Cd stress. Sci. Rep. 2023, 13, 5357. [Google Scholar] [CrossRef]
- Salvatori, E.; Fusaro, L.; Gottardini, E.; Pollastrini, M.; Goltsev, V.; Strasser, R.J.; Bussotti, F. Plant stress analysis: Application of prompt, delayed chlorophyll fluorescence and 820 nm modulated reflectance. Insights from independent experiments. Plant Physiol. Biochem. 2014, 85, 105–113. [Google Scholar] [CrossRef]
- Kalaji, H.M.; Goltsev, V.; Bosa, K.; Allakhverdiev, S.L.; Strasser, R.J.; Goltsev, V. Experimental in vivo measurements of light emission in plants: A perspective dedicated to David Walker. Photosynth. Res. 2012, 114, 69–96. [Google Scholar] [CrossRef]
- Goltsev, V.; Chernev, P.; Zaharieva, I.; Lambrev, P.; Strasser, R. Kinetics of delayed chlorophyll a fluorescence registered in milliseconds time rang. Photosynth. Res. 2005, 84, 209–215. [Google Scholar] [CrossRef]
- Oukarroum, A.; Lebrihi, A.; Gharous, M.E.; Goltsev, V.; Strasser, R.J. Desiccation-induced changes of photosynthetic transport in Parmelina tiliacea (Hoffm.) Ach. analysed by simultaneous measurements of the kinetics of prompt fluorescence, delayed fluorescence and modulated 820 nm reflection. J. Lumin. 2018, 198, 302–308. [Google Scholar] [CrossRef]
Figure 1.
Phenotypic characterization of water dropwort in Cd0 and Cd100 groups on the 0th, 3rd, 6th, 9th, 12th and 15th days of treatment.
Figure 1.
Phenotypic characterization of water dropwort in Cd0 and Cd100 groups on the 0th, 3rd, 6th, 9th, 12th and 15th days of treatment.

Figure 2.
Changes in pigment (a,b), H2O2 (c), malondialdehyde (MDA) (d), and Cd2+ contents (e) in water dropwort leaves of the Cd0 group and the Cd100 group on the 0th, 3rd, 6th, 9th, 12th and 15th days of treatment (n = 5).
Figure 2.
Changes in pigment (a,b), H2O2 (c), malondialdehyde (MDA) (d), and Cd2+ contents (e) in water dropwort leaves of the Cd0 group and the Cd100 group on the 0th, 3rd, 6th, 9th, 12th and 15th days of treatment (n = 5).

Figure 3.
The PF transients of the Cd0 (a) group and Cd100 (b) group on the 0th, 3rd, 6th, 9th, 12th and 15th days of treatment. (c,d) O-P normalized transients of CK and TR, respectively, expressed as Vt = (Ft − FO)/(FP − FO). Each curve is the average of five replicates and was plotted on a logarithmic time scale.

Figure 4.
L-band and K-band of the Cd100 group on the 0th, 3rd, 6th, 9th, 12th and 15th days of treatment. (a) The normalized PF transient curves between FO and FK, expressed as WOK = (Ft − FO)/(FK − FO), (b) and their variation kinetics (L-band), expressed as ΔWOK = WOKTR − WOK0d. (c) The PF transient curves standardized from FO to FJ, expressed as WOJ = (Ft − FO)/(FJ − FO), (d) and their variation kinetics (K-band), represented as ΔWOJ = WOKTR − WOJ0d. Each curve is the average of five replicates.

Figure 5.
JIP-test parameters of the Cd100 group on the 0th, 3rd, 6th, 9th, 12th and 15th days of treatment. (a) TRO/ABS, ETO/ABS, REO/ABS, ETO/TRO, REO/TRO and REO/ETO; (b) ABS/RC, TRO/RC, ETO/RC, DIO/RC; (c) ABS/CSO, TRO/CSO, ETO/CSO, DIO/CSO, RC/CSO; (d) PIABS, (n = 5).
Figure 5.
JIP-test parameters of the Cd100 group on the 0th, 3rd, 6th, 9th, 12th and 15th days of treatment. (a) TRO/ABS, ETO/ABS, REO/ABS, ETO/TRO, REO/TRO and REO/ETO; (b) ABS/RC, TRO/RC, ETO/RC, DIO/RC; (c) ABS/CSO, TRO/CSO, ETO/CSO, DIO/CSO, RC/CSO; (d) PIABS, (n = 5).

Figure 6.
The modulated 820 nm reflection kinetics of the Cd0 (a) group and Cd100 (b) group on the 0th, 3rd, 6th, 9th, 12th and 15th days of treatment. Each curve was averaged over five replicates and plotted on a logarithmic time scale.
Figure 6.
The modulated 820 nm reflection kinetics of the Cd0 (a) group and Cd100 (b) group on the 0th, 3rd, 6th, 9th, 12th and 15th days of treatment. Each curve was averaged over five replicates and plotted on a logarithmic time scale.

Figure 7.
The delayed fluorescence induction kinetics of the Cd0 (a) group and Cd100 (b) group on the 0th, 3rd, 6th, 9th, 12th and 15th days of treatment. The double-normalized DF values of the Cd0 (c) group and Cd100 (d) group are expressed as (DFt − D0)/(DFI1 − D0). D0 is the initial minimum. D2 is the final plateau. I1 is the peak at 3 ms. I2 is the peak at 100 ms. Each curve is the average of five replicates and is plotted on a logarithmic time scale.


Table 1.
The derivation and meaning of technical fluorescence parameters and related JIP-test parameters.
Table 1.
The derivation and meaning of technical fluorescence parameters and related JIP-test parameters.
| Technical Fluorescence Parameters | Meaning |
|---|---|
| FO | Minimal fluorescence yield of the dark-adapted state |
| FK | PF intensity at the K-step (0.3 ms) |
| FJ | PF intensity at the J-step (2 ms) |
| FI | PF intensity at the I-step (30 ms) |
| FM = FP | Maximal fluorescence yield of the dark-adapted state |
| Vt = (Ft − FO)/(FM − FO) | Relative variable fluorescence at time t |
| VJ = (FJ − FO)/(FM − FO) | Relative variable fluorescence at the J-step (2 ms) |
| VI = (FI − FO)/(FM − FO) | Relative variable fluorescence at the I-step (30 ms) |
| MO = 4·(F300μs − FO)/(FM − FO) | Approximated initial slope of the fluorescence transient |
| Quantum efficiencies or flux ratios | |
| TRO/ABS = φPo = 1 − FO/FM | Maximum quantum yield for primary photochemistry |
| ETO/ABS = φEo = 1 − FJ/FM | Quantum yield of the electron transport flux from QA to QB |
| REO/ABS = φRo = 1 − FI/FM | Quantum yield of the electron transport flux until the PSI electron acceptors |
| ETO/TRO = ψEo = 1 − VJ | The efficiency of electron movement at QA |
| REO/TRO = ψRo = 1 − VI | Efficiency with which a PSII trapped electron is transferred until PSI acceptors |
| REO/ETO = δRo = (1 − VI)/(1 − VJ) | The efficiency of an electron beyond QA reduced PSI acceptors |
| Specific energy fluxes [per QA-reducing PSII reaction center (RC)] | |
| ABS/RC = MO·(1/VJ)/(1/φPo) | Absorption flux per RC |
| TRO/RC = MO·(1/VJ) | Trapped energy flux per RC (at t = 0) |
| ETO/RC = MO·(1/VJ)·ψEo | Electron transport flux per RC (at t = 0) |
| DIO/RC = (ABS/RC) − (TRO/RC) | Dissipated energy flux per RC (at t = 0) |
| Phenomenological energy fluxes [per excited cross-section (CS)] | |
| ABS/CSO ≈ FO | Absorption flux per CS (at t = 0) |
| TRO/CSO = φPo·(ABS/CSO) | Trapped energy flux per CS (at t = 0) |
| ETO/CSO = φEo·(ABS/CSO) | Electron transport flux per CS (at t = 0) |
| DIO/CSO = (ABS/CSO) − (TRO/CSO) | Dissipated energy flux per CS (at t = 0) |
| Density of reaction centers | |
| RC/CSO = φPo·(VJ/MO)·(ABS/CSO) | Density of RCs (QA-reducing PSII reaction centers) |
| Performance indexes | |
| PIABS = (RC/ABS)·[φPo/(1 − φPo)]·[ψEo/(1 − ψEo)] | Performance index (potential) for energy conservation from photons absorbed by PSII to the reduction of intersystem electron acceptors |
Table 2.
MR parameters of the Cd100 group on the 0th, 3rd, 6th, 9th, 12th and 15th days of treatment.
Table 2.
MR parameters of the Cd100 group on the 0th, 3rd, 6th, 9th, 12th and 15th days of treatment.
| Treatment Duration in Days | VPSI | VPSII−PSI | VPSII |
|---|---|---|---|
| 0 d | 0.616 ± 0.097 a | 0.041 ± 0.004 a | 0.657 ± 0.101 a |
| 3 d | 0.470 ± 0.141 b | 0.029 ± 0.012 b | 0.499 ± 0.152 b |
| 6 d | 0.342 ± 0.022 c | 0.021 ± 0.002 c | 0.363 ± 0.023 c |
| 9 d | 0.300 ± 0.028 c | 0.015 ± 0.001 d | 0.315 ± 0.029 c |
| 12 d | 0.160 ± 0.081 d | 0.012 ± 0.004 e | 0.171 ± 0.085 d |
| 15 d | 0.111 ± 0.061 e | 0.000 ± 0.003 f | 0.068 ± 0.064 e |
Value are means ± SD (n = 5). Duncan’s multiple range test is used for multiple comparisons. Lowercase letters within the same column indicate significant differences at the p < 0.05 level.
Disclaimer/Publisher’s Note: The statements, opinions and data contained in all publications are solely those of the individual author(s) and contributor(s) and not of MDPI and/or the editor(s). MDPI and/or the editor(s) disclaim responsibility for any injury to people or property resulting from any ideas, methods, instructions or products referred to in the content. |
© 2024 by the authors. Licensee MDPI, Basel, Switzerland. This article is an open access article distributed under the terms and conditions of the Creative Commons Attribution (CC BY) license (https://creativecommons.org/licenses/by/4.0/).
Share and Cite
MDPI and ACS Style
Zhou, R.; Xu, J.; Li, L.; Yin, Y.; Xue, B.; Li, J.; Sun, F. Exploration of the Effects of Cadmium Stress on Photosynthesis in Oenanthe javanica (Blume) DC. Toxics 2024, 12, 307. https://doi.org/10.3390/toxics12050307
AMA Style
Zhou R, Xu J, Li L, Yin Y, Xue B, Li J, Sun F. Exploration of the Effects of Cadmium Stress on Photosynthesis in Oenanthe javanica (Blume) DC. Toxics. 2024; 12(5):307. https://doi.org/10.3390/toxics12050307
Chicago/Turabian StyleZhou, Ronghua, Jun Xu, Liangjun Li, Yulai Yin, Bowen Xue, Jingjing Li, and Fangfang Sun. 2024. "Exploration of the Effects of Cadmium Stress on Photosynthesis in Oenanthe javanica (Blume) DC." Toxics 12, no. 5: 307. https://doi.org/10.3390/toxics12050307
Note that from the first issue of 2016, this journal uses article numbers instead of page numbers. See further details here.