Effect of Lactobacillus acidophilus, Oenococcus oeni, and Lactobacillus brevis on Composition of Bog Bilberry Juice


 ,
,
Abstract
1. Introduction
2. Materials and Methods
2.1. Bog Bilberry Juice
2.2. Lactic Acid Bacterial Strains
2.3. Inoculation of the Strains
2.4. Reducing Sugars
2.5. pH and Organic Acids
2.6. Amino Acids, Ammonium Ion and Biogenic Amines
2.7. Anthocyanin Compounds
2.8. Non-Anthocyanin Phenolic Compounds
2.9. Color Attributes
2.10. Statistical Analysis
3. Results
3.1. Bacterial Growth in Bog Bilberry Juice
3.2. Changes in Chemical Components and pH in Juice after Inoculation
3.2.1. Reducing Sugars
3.2.2. Organic Acids and pH
3.2.3. Amino Acids, Ammonium Ion and Biogenic Amines
3.2.4. Anthocyanins
3.2.5. Non-Anthocyanin Phenolic Compounds
3.3. Color Attributes
3.4. Multivariate Statistical Analysis
4. Discussion
5. Conclusions
Supplementary Materials
Author Contributions
Funding
Acknowledgments
Conflicts of Interest
References
- Di Cagno, R.; Coda, R.; De Angelis, M.; Gobbetti, M. Exploitation of vegetables and fruits through lactic acid fermentation. Food Microbiol. 2013, 33, 1–10. [Google Scholar] [CrossRef] [PubMed]
- Parvez, S.; Malik, K.; Kang, S.; Kim, H. Probiotics and their fermented food products are beneficial for health. J. Appl. Microbiol. 2016, 100, 1171–1185. [Google Scholar] [CrossRef] [PubMed]
- Zhao, L.L.; Wei, J.Y.; Zhao, H.F.; Zhu, B.Q.; Zhang, B.L. Detoxification of cancerogenic compounds by lactic acid bacteria strains. Crit. Rev. Food Sci. Nutr. 2017, 58, 2727–2742. [Google Scholar]
- Di Cagno, R.; Filannino, P.; Gobbetti, M. Vegetable and Fruit Fermentation by Lactic Acid Bacteria; John Wiley & Sons, Ltd.: Hoboken, NJ, USA, 2015. [Google Scholar]
- Di Cagno, R.; Surico, R.F.; Paradiso, A.; De Angelis, M.; Salmon, J.C.; Buchin, S.; De Gara, L.; Gobbetti, M. Effect of autochthonous lactic acid bacteria starters on health-promoting and sensory properties of tomato juices. Int. J. Food Microbiol. 2009, 128, 473–483. [Google Scholar] [CrossRef] [PubMed]
- Fernández, M.; Zúñiga, M. Amino acid catabolic pathways of lactic acid bacteria. Crit. Rev. Microbiol. 2006, 32, 155. [Google Scholar] [CrossRef] [PubMed]
- Filannino, P.; Cardinali, G.; Rizzello, C.G.; Buchin, S.; Angelis, M.D.; Gobbetti, M.; Di Cango, R. Metabolic responses of Lactobacillus plantarum strains during fermentation and storage of vegetable and fruit juices. Appl. Environ. Microbiol. 2014, 80, 2206–2215. [Google Scholar] [CrossRef] [PubMed]
- Jing, P.; Song, L.H.; Shen, S.H.; Zhao, S.J.; Pang, J.; Qian, B.J. Characterization of phytochemicals and antioxidant activities of red radish brines during lactic acid fermentation. Molecules 2014, 19, 9675–9688. [Google Scholar] [CrossRef] [PubMed]
- Zafra-Stone, S.; Yasmin, T.; Bagchi, M.; Chatterjee, A.; Vinson, J.A.; Bagchi, D. Berry anthocyanins as novel antioxidants in human health and disease prevention. Mol. Nutr. Food Res. 2007, 51, 675–683. [Google Scholar] [CrossRef] [PubMed]
- Francis, F.J.; Markakis, P.C. Food colorants: Anthocyanins. Crit. Rev. Food Sci. Nutr. 1989, 28, 273–314. [Google Scholar] [CrossRef]
- Kwaw, E.; Ma, Y.; Tchabo, W.; Apaliya, M.T.; Wu, M.; Sackey, A.S.; Xiao, L.L.; Tahir, H.E. Effect of lactobacillus strains on phenolic profile, color attributes and antioxidant activities of lactic-acid-fermented mulberry juice. Food Chem. 2018, 250, 148–154. [Google Scholar] [CrossRef]
- Rustioni, L.; Bedgood, D.R.; Failla, O.; Prenzler, P.D.; Robards, K. Copigmentation and anti-copigmentation in grape extracts studied by spectrophotometry and post-column-reaction HPLC. Food Chem. 2012, 132, 2194–2201. [Google Scholar] [CrossRef]
- Rein, M.J.; Marina, H. Stability and enhancement of berry juice color. J. Agric. Food Chem. 2004, 52, 3106–3114. [Google Scholar] [CrossRef] [PubMed]
- Kopjar, M.; JakŠIĆ, K.; PiliŽOta, V. Influence of sugars and chlorogenic acid addition on anthocyanin content, antioxidant activity and color of blackberry juice during storage. J. Food Process. Preserv. 2012, 36, 545–552. [Google Scholar] [CrossRef]
- Rodriguez, H.; Curiel, J.A.; Landete, J.M.; de las Rivas, B.; Lopez de Felipe, F.; Gomez-Cordoves, C.; Mancheno, J.M.; Munoz, R. Food phenolics and lactic acid bacteria. Int. J. Food Microbiol. 2009, 132, 79–90. [Google Scholar] [CrossRef] [PubMed]
- Christensen, J.E.; Dudley, E.G.; Pederson, J.A.; Steele, J.L. Peptidases and amino acid catabolism in lactic acid bacteria. Antonie Leeuwenhoek 1999, 76, 217–246. [Google Scholar] [CrossRef] [PubMed]
- Santos, M.H.S. Biogenic amines: Their importance in foods. Int. J. Food Microbiol. 1996, 29, 213–231. [Google Scholar] [CrossRef]
- Wang, L.J.; Su, S.; Wu, J.; Du, H.; Li, S.S.; Huo, J.W.; Zhang, Y.; Wang, L.S. Variation of anthocyanins and flavonols in Vaccinium uliginosum berry in Lesser Khingan Mountains and its antioxidant activity. Food Chem. 2014, 160, 357–364. [Google Scholar] [CrossRef]
- Liu, S.X.; Yang, H.Y.; Li, S.Y.; Zhang, J.Y.; Li, T.; Zhu, B.Q.; Zhang, B.L. Polyphenolic compositions and chromatic characteristics of bog bilberry syrup wines. Molecules 2015, 20, 19865–19877. [Google Scholar] [CrossRef]
- Colak, N.; Torun, H.; Gruz, J.; Strnad, M.; Hermosin-Gutierrez, I.; Hayirlioglu-Ayaz, S.; Ayaz, F.A. Bog bilberry phenolics, antioxidant capacity and nutrient profile. Food Chem. 2016, 201, 339–349. [Google Scholar] [CrossRef]
- Kim, Y.H.; Bang, C.Y.; Won, E.K.; Kim, J.P.; Choung, S.Y. Antioxidant activities of Vaccinium uliginosum L. extract and its active components. J. Med. Food 2009, 12, 885–892. [Google Scholar] [CrossRef]
- Ames, B.N.; Shigenaga, M.K.; Hagen, T.M. Oxidants, antioxidants, and the degenerative diseases of aging. Proc. Natl. Acad. Sci. USA 1993, 90, 7915–7922. [Google Scholar] [CrossRef] [PubMed]
- Han, E.K.; Kwon, H.S.; Shin, S.G.; Choi, Y.H.; Kang, I.J.; Chung, C.K. Biological effect of Vaccinium uliginosum L. on STZ-induced diabetes and lipid metabolism in rats. J. Korean Soc. Food Sci. Nutr. 2012, 41, 1727–1733. [Google Scholar] [CrossRef][Green Version]
- Chen, C.; Lu, Y.; Yu, H.; Chen, Z.; Tian, H. Influence of 4 lactic acid bacteria on the flavor profile of fermented apple juice. Food Biosci. 2019, 27, 30–36. [Google Scholar] [CrossRef]
- Markkinen, N.; Laaksonen, O.; Nahku, R.; Kuldjarv, R.; Yang, B. Impact of lactic acid fermentation on acids, sugars, and phenolic compounds in black chokeberry and sea buckthorn juices. Food Chem. 2019, 286, 204–215. [Google Scholar] [CrossRef] [PubMed]
- Park, J.B.; Lim, S.H.; Sim, H.S.; Park, J.H.; Kwon, H.J.; Nam, H.S.; Kim, M.D.; Baek, H.H.; Ha, S.J. Changes in antioxidant activities and volatile compounds of mixed berry juice through fermentation by lactic acid bacteria. Food Sci. Biotechnol. 2017, 26, 441–446. [Google Scholar] [CrossRef] [PubMed]
- Ricci, A.; Cirlini, M.; Levante, A.; Dall’Asta, C.; Galaverna, G.; Lazzi, C. Volatile profile of elderberry juice: Effect of lactic acid fermentation using L. plantarum, L. rhamnosus and L. casei strains. Food Res. Int. 2018, 105, 412–422. [Google Scholar] [CrossRef] [PubMed]
- Wei, M.; Wang, S.Y.; Gu, P.; Ouyang, X.Y.; Liu, S.X.; Li, Y.Q.; Zhang, B.L.; Zhu, B.Q. Comparison of physicochemical indexes, amino acids, phenolic compounds and volatile compounds in bog bilberry juice fermented by Lactobacillus plantarum under different pH conditions. J. Food Sci. Technol. 2018, 55, 2240–2250. [Google Scholar] [CrossRef]
- Sanders, M.E.; Klaenhammer, T.R. Invited review: The scientific basis of Lactobacillus acidophilus NCFM functionality as a probiotic. J. Dairy Sci. 2001, 84, 319–331. [Google Scholar] [CrossRef]
- Collins, J.K.; Thornton, G.; Sullivan, G.O. Selection of probiotic strains for human applications. Int. Dairy J. 1998, 8, 487–490. [Google Scholar] [CrossRef]
- Kim, J.Y.; Lee, M.Y.; Ji, G.E.; Lee, Y.S.; Hwang, K.T. Production of gamma-aminobutyric acid in black raspberry juice during fermentation by Lactobacillus brevis GABA100. Int. J. Food Microbiol. 2009, 130, 12–16. [Google Scholar] [CrossRef]
- Alexandre, H.; Costello, P.J.; Remize, F.; Guzzo, J.; Guilloux-Benatier, M. Saccharomyces cerevisiae-Oenococcus oeni interactions in wine: Current knowledge and perspectives. Int. J. Food Microbiol. 2004, 93, 141–154. [Google Scholar] [CrossRef] [PubMed]
- Ling, D.W.; Dong, X.Z. Characterization and Experimental Methods of Lactic Acid Bacteria; China Light Industry Press: Beijing, China, 1999. [Google Scholar]
- De Man, J.C.; Rogosa, M.; Sharpe, M.E. A medium for the cultivation of Lactobacilli. J. Appl. Bacteriol. 1960, 23, 130–135. [Google Scholar] [CrossRef]
- Fugelsang, K.C.; Edwards, C.G. Wine Microbiology: Practical Applications and Procedures; Springer: Berlin/Heidelberg, Germany, 2007. [Google Scholar]
- Wei, M.; Gu, P.; Li, C.J.; Yang, H.Y.; Liu, S.X.; Zhang, J.Y.; Yan, Z.X.; Zhang, B.L.; Zhu, B.Q. Determination of 7 organic acids in Vaccinium uliginosum products by HPLC. China Brew. 2014, 33, 145–148. [Google Scholar]
- Welman, A.D.; Maddox, I.S. Exopolysaccharides from lactic acid bacteria: Perspectives and challenges. Trends Biotechnol. 2003, 21, 269–274. [Google Scholar] [CrossRef]
- Li, J.C.; Li, S.Y.; He, F.; Yuan, Z.Y.; Liu, T.; Reeves, M.J.; Duan, C.Q. Phenolic and chromatic properties of beibinghong red ice wine during and after vinification. Molecules 2016, 21, 431. [Google Scholar] [CrossRef] [PubMed]
- Li, R.; Wang, P.; Guo, Q.Q.; Wang, Z.Y. Anthocyanin composition and content of the Vaccinium uliginosum berry. Food Chem. 2011, 125, 116–120. [Google Scholar] [CrossRef]
- Gao, Y.; Tian, Y.; Liu, D.; Li, Z.; Zhang, X.X.; Li, J.M.; Huang, J.H.; Wang, J.; Pan, Q.H. Evolution of phenolic compounds and sensory in bottled red wines and their co-development. Food Chem. 2015, 172, 565–574. [Google Scholar] [CrossRef] [PubMed]
- Lee, J.; Durst, R.W.; Wrolstad, R.E. Determination of total monomeric anthocyanin pigment content of fruit juices, beverages, natural colorants, and wines by the pH differential method: Collaborative study. J. AOAC Int. 2005, 88, 1269–1278. [Google Scholar]
- Tarján, V.; Jánossy, G. The role of biogenic amines in foods. Mol. Nutr. Food Res. 1978, 22, 285–289. [Google Scholar] [CrossRef]
- Dicks, L.M.T.; Dellaglio, F.; Collins, M.D. Proposal to reclassify Leuconostoc oenos as Oenococcus oeni [corrig.] gen. nov.; comb. nov. Int. J. Syst. Bacteriol. 1995, 45, 395–397. [Google Scholar] [CrossRef]
- Moreno-Arribas, V.; Lonvaud-Funel, A. Tyrosine decarboxylase activity of Lactobacillus brevis IOEB 9809 isolated from wine and L. brevis ATCC 367. FEMS Microbiol. Lett. 1999, 180, 55–60. [Google Scholar] [CrossRef] [PubMed]
- Conway, P.L.; Gorbach, S.L.; Goldin, B.R. Survival of lactic acid bacteria in the human stomach and adhesion to intestinal cells. J. Dairy Sci. 1987, 70, 1–12. [Google Scholar] [CrossRef]
- Kashket, E.R. Bioenergetics of lactic acid bacteria: Cytoplasmic pH and osmotolerance. FEMS Microbiol. Lett. 1987, 46, 233–244. [Google Scholar] [CrossRef]
- Mousavi, Z.; Mousavi, M.; Razavi, S.H.; Hadinejad, M.; Emam-Djomeh, Z.; Mirzapour, M. Effect of fermentation of pomegranate juice by Lactobacillus plantarum and Lactobacillus acidophilus on the antioxidant activity and metabolism of sugars, organic acids and phenolic compounds. Food Biotechnol. 2013, 27, 1–13. [Google Scholar] [CrossRef]
- Harvey, R.J. Damage to streptococcus lactis resulting from growth at low pH. J. Bacteriol. 1965, 90, 1330–1336. [Google Scholar] [PubMed]
- Carvalho, A.L.; Turner, D.L.; Fonseca, L.L.; Solopova, A.; Catarino, T.; Kuipers, O.P.; Voit, E.O.; Neves, A.R.; Santos, H. Metabolic and transcriptional analysis of acid stress in Lactococcus lactis, with a focus on the kinetics of lactic acid pools. PLoS ONE 2013, 8, e68470. [Google Scholar] [CrossRef] [PubMed]
- Karovičová, J.; Kohajdová, Z. Lactic acid fermented vegetable juices. Hortic. Sci. 2003, 30, 152–158. [Google Scholar] [CrossRef]
- De, V.W.; Stouthamer, A.H. Pathway of glucose fermentation in relation to the taxonomy of bifidobacteria. J. Bacteriol. 1967, 93, 574–576. [Google Scholar]
- Zhai, Z.Y.; Douillard, F.P.; An, H.; Wang, G.H.; Guo, X.H.; Luo, Y.B.; Hao, Y. Proteomic characterization of the acid tolerance response in Lactobacillus delbrueckii subsp. Bulgaricus CAUH1 and functional identification of a novel acid stress-related transcriptional regulator Ldb0677. Environ. Microbiol. 2014, 16, 1524–1537. [Google Scholar] [CrossRef] [PubMed]
- Mousavi, Z.E.; Mousavi, S.M.; Razavi, S.H.; Emam-Djomeh, Z.; Kiani, H. Fermentation of pomegranate juice by probiotic lactic acid bacteria. World J. Microbiol. Biotechnol. 2011, 27, 123–128. [Google Scholar] [CrossRef]
- Jelovac, N.; Perković, A.; Pupovac, M.; Trontel, A.; Slavica, A. Catabolism of amino acids in the cells of lactic acid bacteria. Biotechnol. Nutr. 2011, 6, 25–26. [Google Scholar]
- Hebert, E.M.; Raya, R.R.; de Giori, G.S. Nutritional requirements of Lactobacillus delbrueckii subsp. lactis in a chemically defined medium. Curr. Microbiol. 2004, 49, 341–345. [Google Scholar] [CrossRef] [PubMed]
- Van de Guchte, M.; Serror, P.; Chervaux, C.; Smokvina, T.; Ehrlich, S.D.; Maguin, E. Stress responses in lactic acid bacteria. Antonie Leeuwenhoek 2002, 82, 187–216. [Google Scholar] [CrossRef] [PubMed]
- Garcia-Ruiz, A.; Gonzalez-Rompinelli, E.M.; Bartolome, B.; Moreno-Arribas, M.V. Potential of wine-associated lactic acid bacteria to degrade biogenic amines. Int. J. Food Microbiol. 2001, 148, 115–120. [Google Scholar] [CrossRef] [PubMed]
- Lu, S.; Li, K. Biogenic amines in dry fermented sausages and the factors influencing their accumulation. Acta Agric. Boreal.-Occident. Sin. 2005, 14, 148–153. [Google Scholar]
- Ávila, M.; Hidalgo, M.; Sánchez-Moreno, C.; Pelaez, C.; Requena, T.; Pascual-Teresa, S.d. Bioconversion of anthocyanin glycosides by Bifidobacteria and Lactobacillus. Food Res. Int. 2009, 42, 1453–1461. [Google Scholar] [CrossRef]
- Filannino, P.; Bai, Y.; Di Cagno, R.; Gobbetti, M.; Gänzle, M.G. Metabolism of phenolic compounds by Lactobacillus spp. during fermentation of cherry juice and broccoli puree. Food Microbiol. 2015, 46, 272–279. [Google Scholar] [CrossRef]
- Hunaefi, D.; Gruda, N.; Riedel, H.; Akumo, D.N.; Saw, N.M.M.T.; Smetanska, I. Improvement of antioxidant activities in red cabbage sprouts by lactic acid bacterial fermentation. Food Biotechnol. 2013, 27, 279–302. [Google Scholar] [CrossRef]
- Suthanthangjai, W.; Kilmartin, P.A.; Phillips, A.R.J.; Davies, K.; Ansell, J. Bioconversion of pinot noir anthocyanins into bioactive phenolic compounds by lactic acid bacteria. Nutr. Aging 2014, 2, 145–149. [Google Scholar]
- Liang, N.N.; Han, S.; Fei, H.E.; Liu, Y.; Wang, P.Y.; Wang, J.H. Correlation analysis of anthocyanin compositions and CIELab parameters during the process of wine fermentation by several red grape varieties. China Brew. 2014, 31, 48–55. [Google Scholar]
- Schanda, J. CIE Colorimetry; Wiley-Blackwell: Hoboken, NJ, USA, 2007. [Google Scholar]
- Di Cagno, R.; Minervini, G.; Rizzello, C.G.; De Angelis, M.; Gobbetti, M. Effect of lactic acid fermentation on antioxidant, texture, color and sensory properties of red and green smoothies. Food Microbiol. 2011, 28, 1062–1071. [Google Scholar] [CrossRef] [PubMed]
 ”“
”“ ” and “
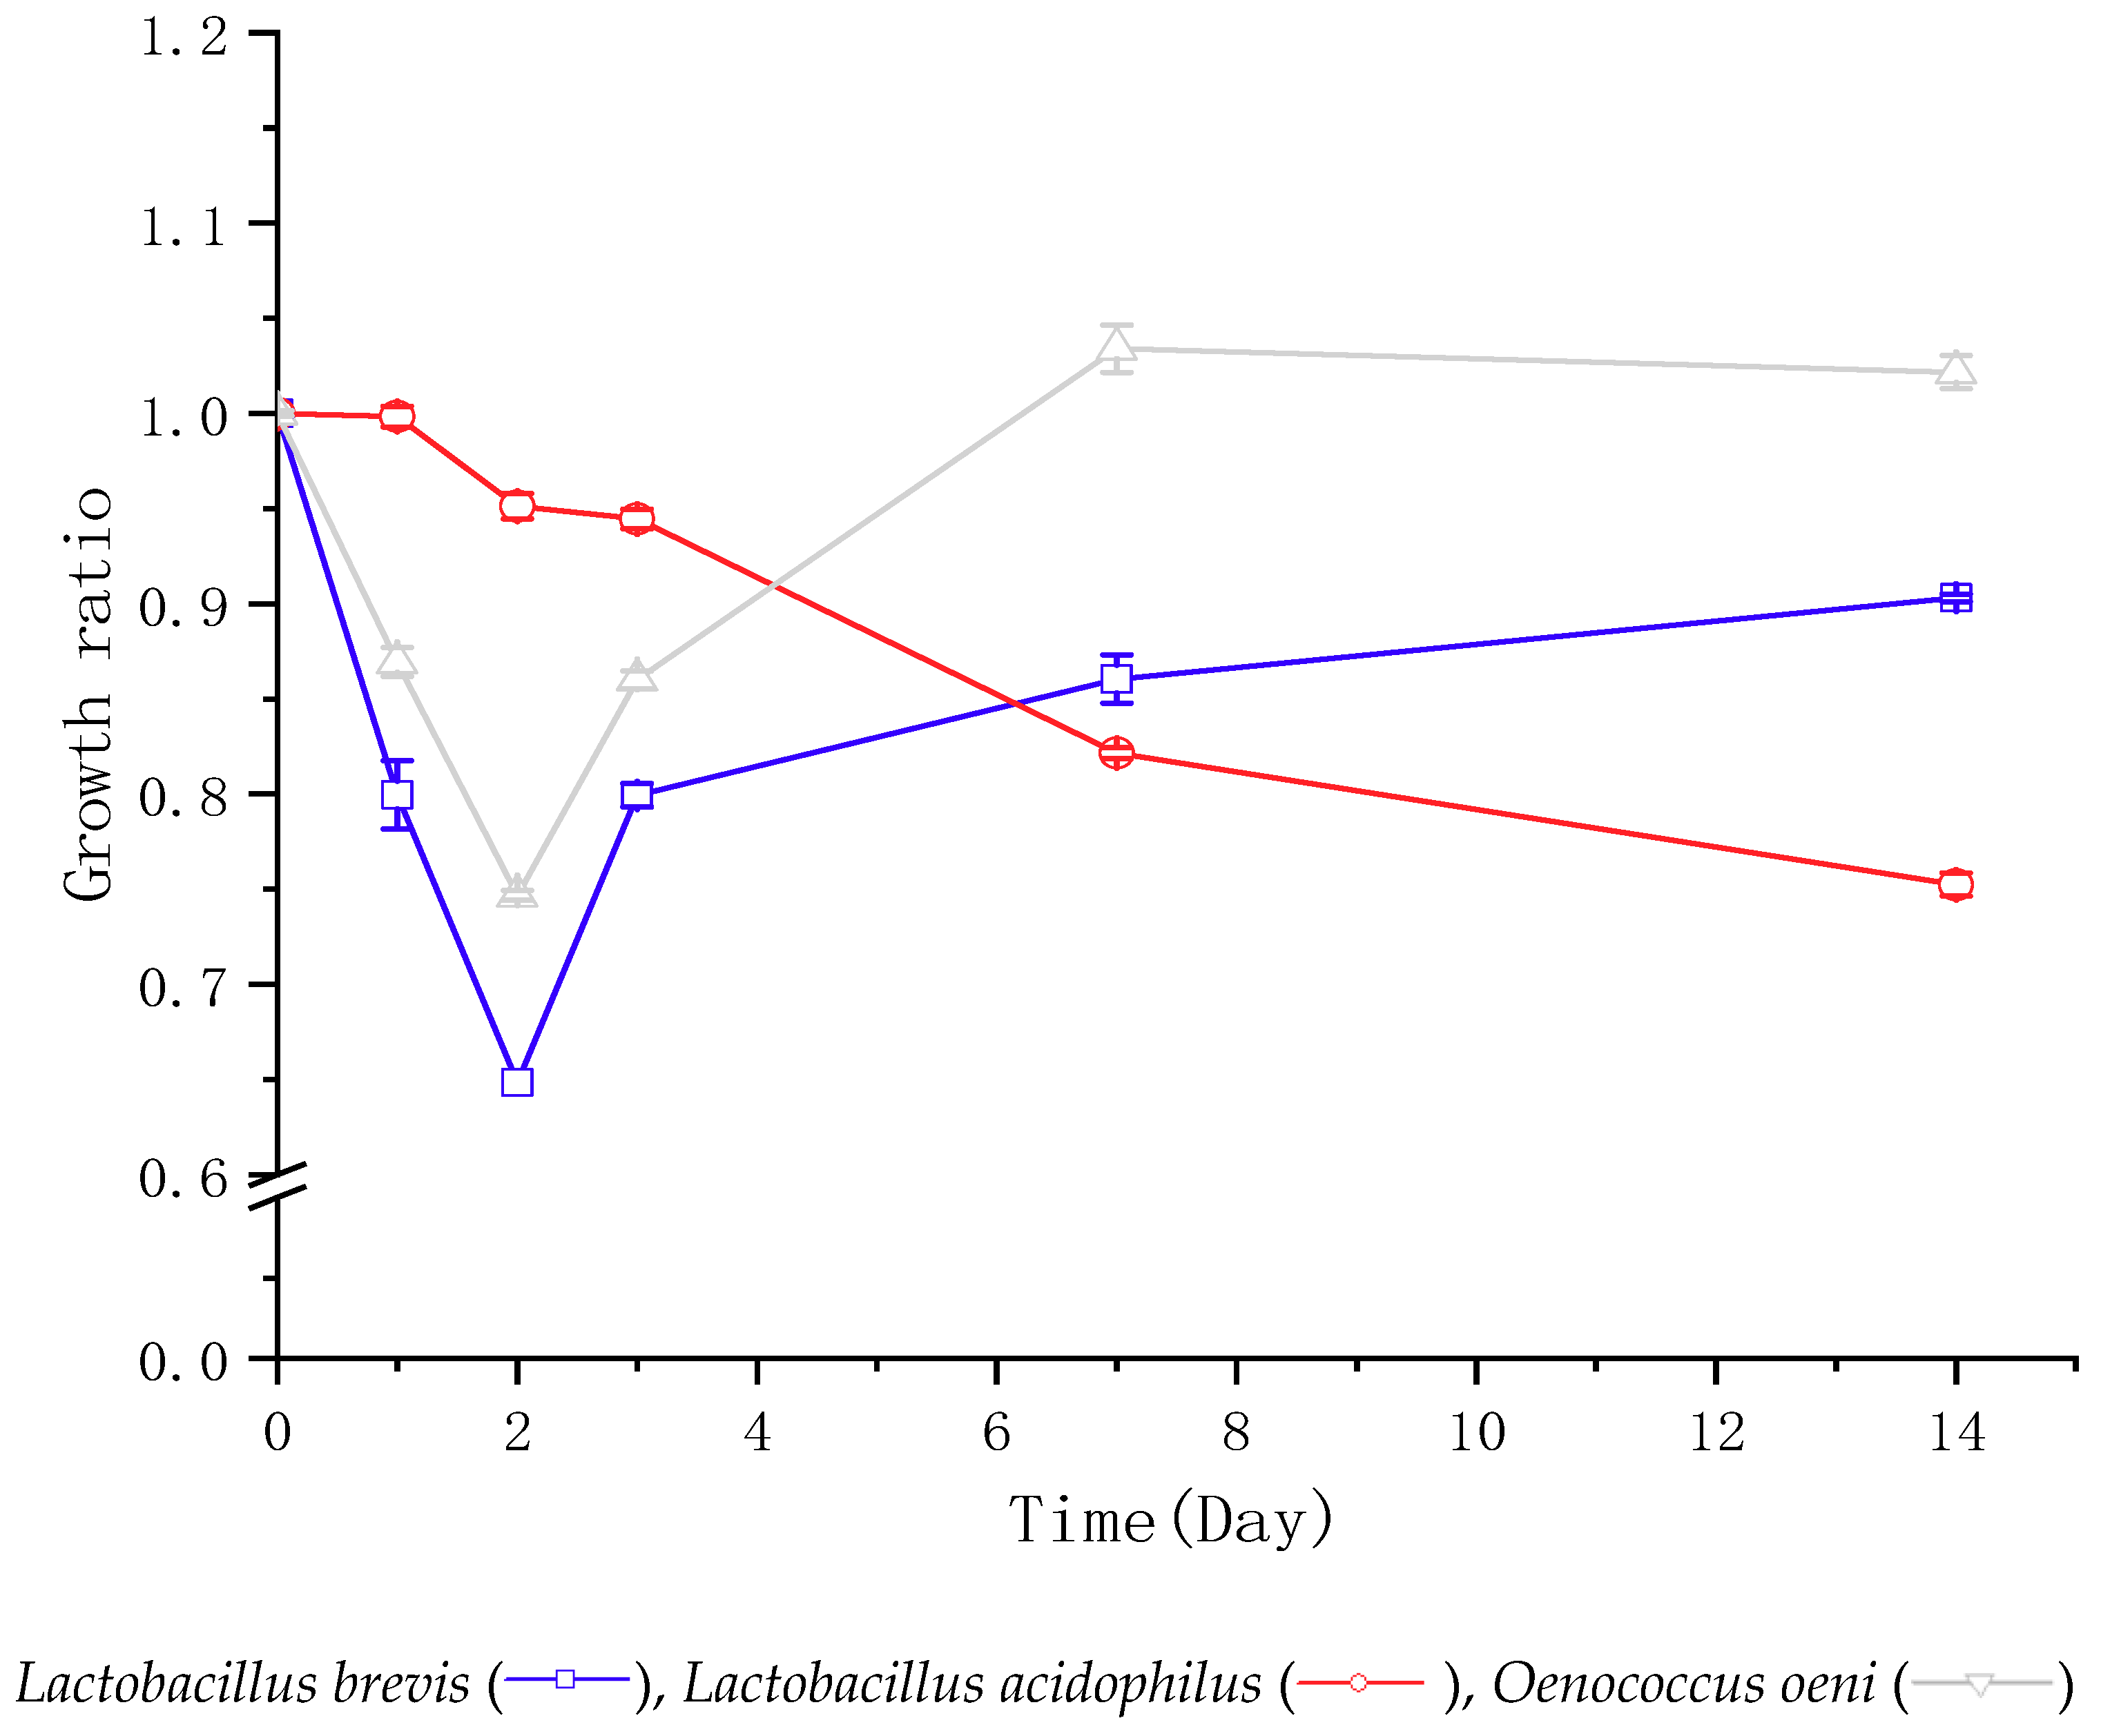
 ” represent the growth pattern of Lactobacillus brevis, Lactobacillus acidophilus, and Oenococcus oeni, respectively. The growth is calculated using the CFU at each sampling day over its initial CFU before inoculation. The data are the mean ± standard deviation of triplicate tests.
”“” and “” represent the growth pattern of Lactobacillus brevis, Lactobacillus acidophilus, and Oenococcus oeni, respectively. The growth is calculated using the CFU at each sampling day over its initial CFU before inoculation. The data are the mean ± standard deviation of triplicate tests.
” represent the growth pattern of Lactobacillus brevis, Lactobacillus acidophilus, and Oenococcus oeni, respectively. The growth is calculated using the CFU at each sampling day over its initial CFU before inoculation. The data are the mean ± standard deviation of triplicate tests.
”“” and “” represent the growth pattern of Lactobacillus brevis, Lactobacillus acidophilus, and Oenococcus oeni, respectively. The growth is calculated using the CFU at each sampling day over its initial CFU before inoculation. The data are the mean ± standard deviation of triplicate tests.
 ” and “
 ” shows the variables mainly affected by strain or time, respectively; the compounds colored with “
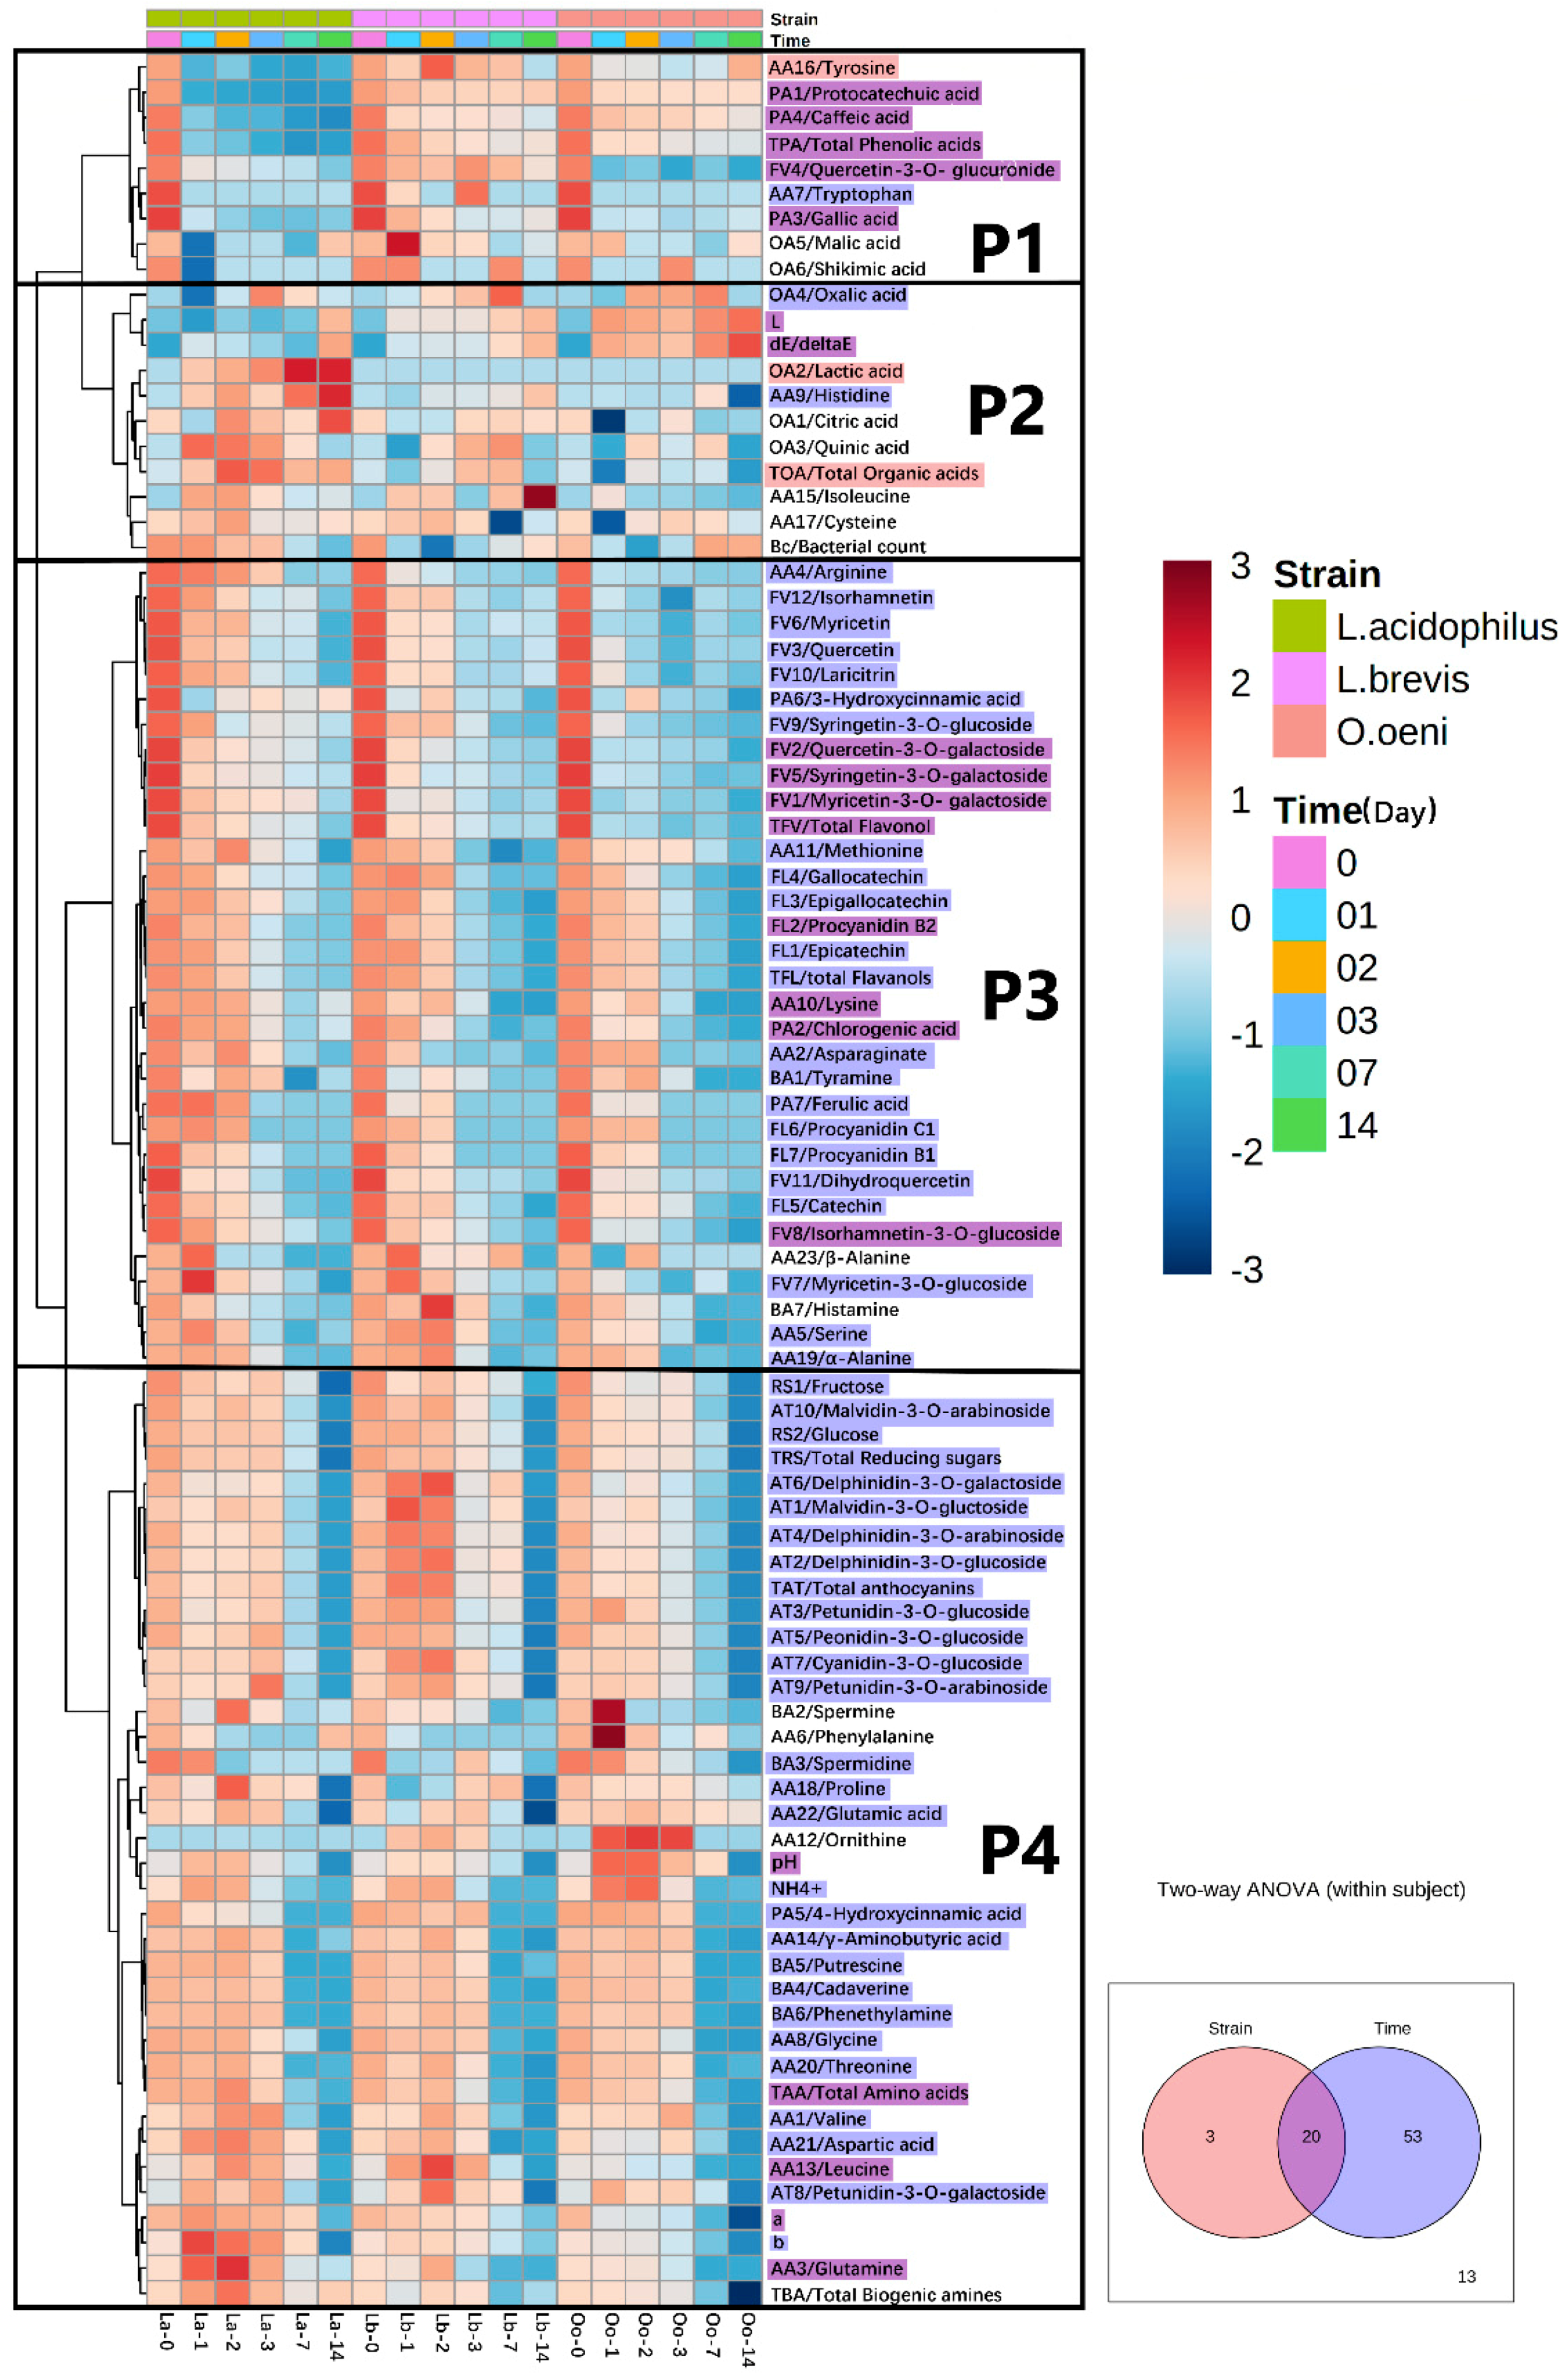
 ” show the variables affected by both strain difference and time (p < 0.05). Compounds without color are not affected by the main effects.
” and “” shows the variables mainly affected by strain or time, respectively; the compounds colored with “” show the variables affected by both strain difference and time (p < 0.05). Compounds without color are not affected by the main effects.
” show the variables affected by both strain difference and time (p < 0.05). Compounds without color are not affected by the main effects.
” and “” shows the variables mainly affected by strain or time, respectively; the compounds colored with “” show the variables affected by both strain difference and time (p < 0.05). Compounds without color are not affected by the main effects.
 ”, “
”, “ ” and “
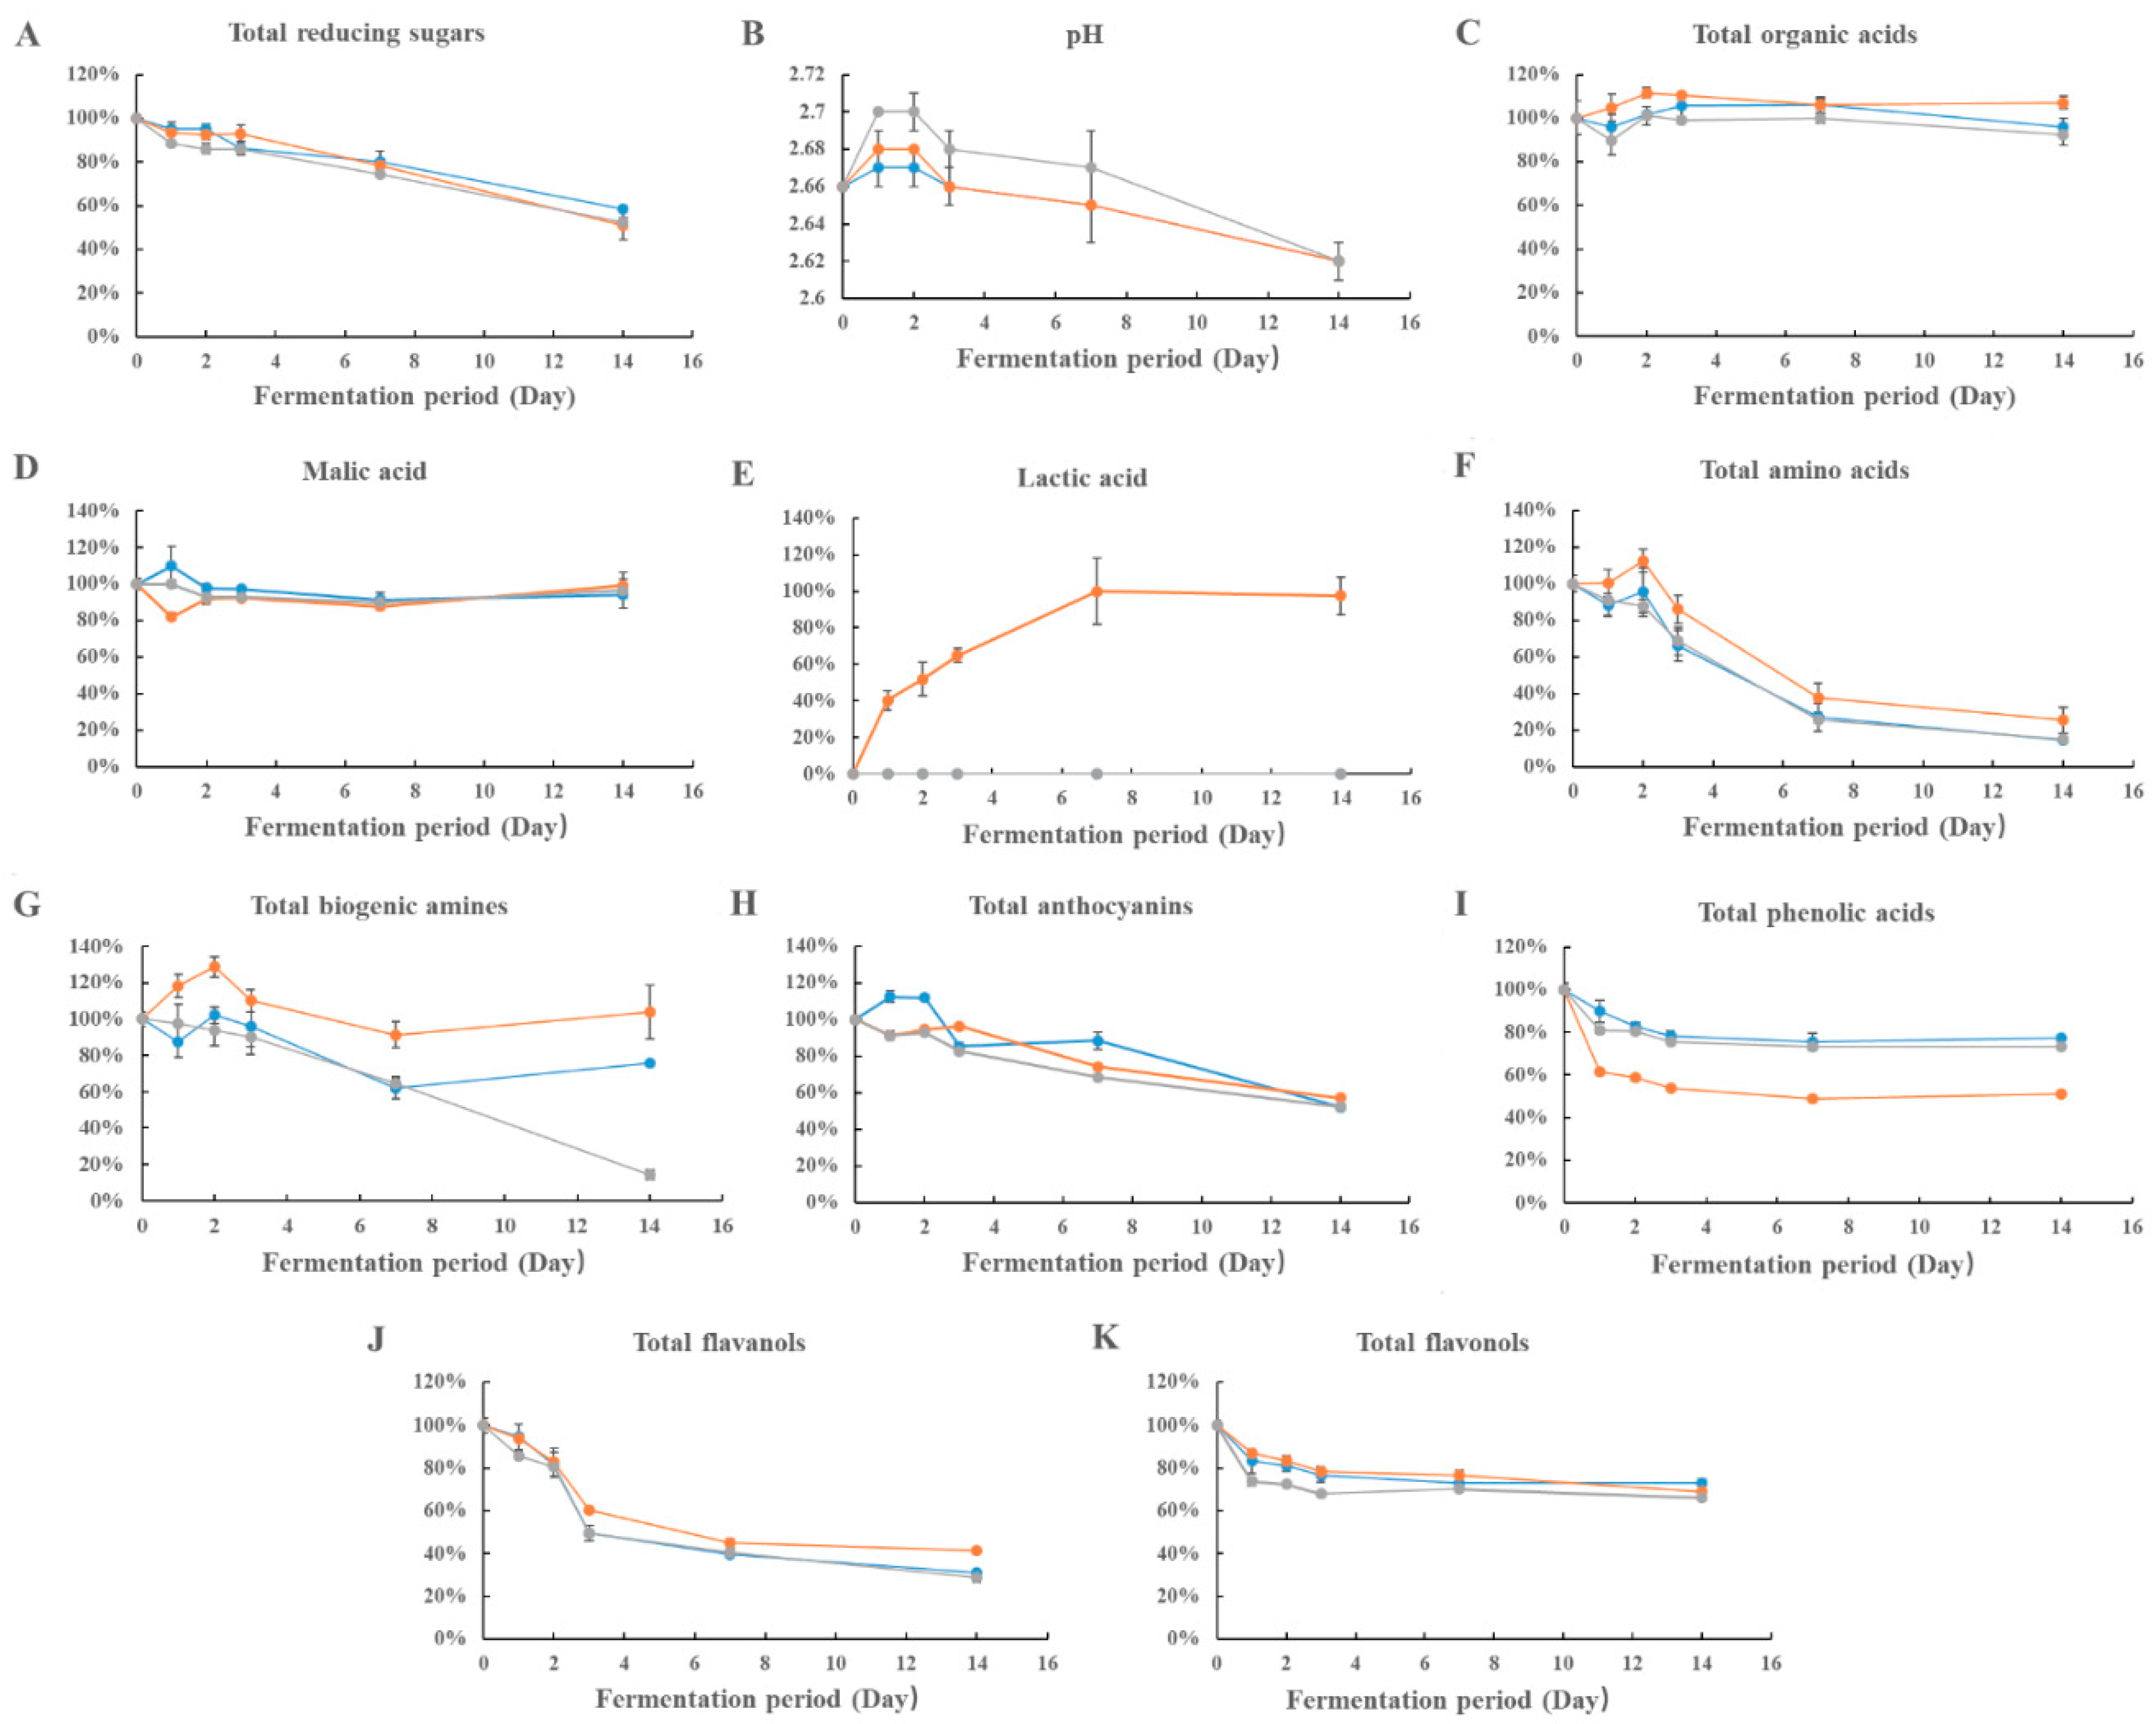
 ” represent the growth pattern of Lactobacillus brevis, Lactobacillus acidophilus, and Oenococcus oeni, respectively. The data are the mean ± standard deviation of triplicate tests.
”, “” and “” represent the growth pattern of Lactobacillus brevis, Lactobacillus acidophilus, and Oenococcus oeni, respectively. The data are the mean ± standard deviation of triplicate tests.
” represent the growth pattern of Lactobacillus brevis, Lactobacillus acidophilus, and Oenococcus oeni, respectively. The data are the mean ± standard deviation of triplicate tests.
”, “” and “” represent the growth pattern of Lactobacillus brevis, Lactobacillus acidophilus, and Oenococcus oeni, respectively. The data are the mean ± standard deviation of triplicate tests.


| Compound (mg/L) | Strain | Time (Day) | |||||
|---|---|---|---|---|---|---|---|
| 0 | 1 | 2 | 3 | 7 | 14 | ||
| Malvidin-3-O-gluctoside | L. brevis | 108.23 ± 0.18 Ac | 131.09 ± 2.45 Bd | 123.60 ± 0.56 Bd | 94.68 ± 2.60 Ab | 102.51 ± 5.59 Bbc | 63.83 ± 1.66 Aa |
| L. acidophilus | 108.23 ± 0.18 Acd | 101.67 ± 0.12 Ac | 109.22 ± 2.95 Ad | 106.43 ± 1.74 Bcd | 83.24 ± 0.13 Ab | 67.68 ± 1.62 Aa | |
| O. oeni | 108.23 ± 0.18 Ae | 99.37 ± 2.16 Ad | 104.37 ± 1.26 Ade | 92.24 ± 0.48 Ac | 77.34 ± 1.73 Ab | 64.00 ± 0.65 Aa | |
| Delphinidin-3-O-glucoside | L. brevis | 82.04 ± 0.52 Abc | 90.59 ± 4.51 Bc | 93.82 ± 1.17 Bc | 69.29 ± 2.57 ABb | 72.10 ± 4.46 Bb | 38.88 ± 1.10 ABa |
| L. acidophilus | 82.04 ± 0.52 Ad | 73.10 ± 1.28 Ac | 74.31 ± 0.20 Ac | 76.02 ± 0.59 Bc | 59.07 ± 0.14 Ab | 42.65 ± 1.03 Ba | |
| O. oeni | 82.04 ± 0.52 Ae | 73.46 ± 2.17 Ad | 73.31 ± 0.14 Ad | 65.34 ± 1.09 Ac | 52.90 ± 1.02 Ab | 38.34 ± 0.38 Aa | |
| Petunidin-3-O-glucoside | L. brevis | 65.75 ± 0.55 Ac | 68.51 ± 0.80 Bc | 68.34 ± 1.24 Bc | 53.54 ± 1.05 Ab | 55.31 ± 2.23 Bb | 35.21 ± 0.04 Aa |
| L. acidophilus | 65.75 ± 0.55 Ae | 57.59 ± 1.02 Ac | 59.74 ± 0.21 Ac | 62.36 ± 0.02 Bd | 49.01 ± 0.37 Ab | 39.14 ± 0.55 Ca | |
| O. oeni | 65.75 ± 0.55 Ae | 68.51 ± 0.80 Be | 61.36 ± 0.99 Ad | 54.33 ± 0.22 Ac | 46.13 ± 1.07 Ab | 36.98 ± 0.08 Ba | |
| Delphinidin-3-O-arabinoside | L. brevis | 19.46 ± 0.30 Ac | 21.42 ± 0.80 Bc | 21.07 ± 0.16 Bc | 15.84 ± 0.27 Ab | 16.09 ± 0.84 Bb | 8.86 ± 0.26 Ba |
| L. acidophilus | 19.46 ± 0.30 Ad | 17.05 ± 0.61 Ac | 17.01 ± 0.10 Ac | 17.86 ± 0.25 Bc | 13.26 ± 0.25 Ab | 9.86 ± 0.22 Aa | |
| O. oeni | 19.46 ± 0.30 Ad | 16.41 ± 0.81 Ac | 16.58 ± 0.24 Ac | 15.11 ± 0.01 Ac | 12.58 ± 0.17 Ab | 8.61 ± 0.09 Ba | |
| Peonidin-3-O-glucoside | L. brevis | 16.45 ± 0.18 Ac | 16.47 ± 0.05 Bc | 16.08 ± 0.09 Ac | 13.14 ± 0.03 Ab | 12.62 ± 0.42 Bb | 7.72 ± 0.05 Aa |
| L. acidophilus | 16.45 ± 0.18 Ad | 14.71 ± 0.14 Ac | 15.19 ± 0.05 Acd | 16.38 ± 0.59 Bd | 11.73 ± 0.20 ABb | 9.20 ± 0.21 Ba | |
| O. oeni | 16.45 ± 0.18 Ae | 15.19 ± 0.17 Ad | 15.2 ± 0.42 Ad | 13.60 ± 0.05 Ac | 11.18 ± 0.14 Ab | 8.17 ± 0.02 Aa | |
| Delphinidin-3-O-galactoside | L. brevis | 15.07 ± 0.03 Abcd | 16.96 ± 1.32 Bcd | 18.13 ± 0.95 Bd | 12.33 ± 0.35 Bb | 14.11 ± 0.83 Bbc | 7.30 ± 0.27 Aa |
| L. acidophilus | 15.07 ± 0.03 Ae | 12.73 ± 0.13 Ac | 12.77 ± 0.06 Ac | 13.39 ± 0.09 Cd | 10.57 ± 0.09 Ab | 7.50 ± 0.08 Aa | |
| O. oeni | 15.07 ± 0.03 Ae | 11.92 ± 0.59 Acd | 12.80 ± 0.11 Ad | 11.23 ± 0.09 Ac | 9.63 ± 0.20 Ab | 6.90 ± 0.08 Aa | |
| Cyanidin-3-O-glucoside | L. brevis | 14.72 ± 0.17 Ac | 17.30 ± 0.36 Bd | 18.05 ± 0.36 Bd | 14.43 ± 0.09 Bc | 12.04 ± 0.65 Bb | 6.39 ± 0.12 Aa |
| L. acidophilus | 14.72 ± 0.17 Ac | 14.56 ± 0.10 Ac | 14.63 ± 0.23 Ac | 15.59 ± 0.52 Bc | 11.80 ± 0.17 Bb | 7.85 ± 0.04 Ba | |
| O. oeni | 14.72 ± 0.17 Ad | 14.86 ± 0.54 Ad | 14.57 ± 0.23 Ad | 13.10 ± 0.04 Ac | 9.87 ± 0.09 Ab | 6.48 ± 0.16 Aa | |
| Petunidin-3-O-galactoside | L. brevis | 3.71 ± 0.12 Ab | 4.24 ± 0.03 Abc | 5.13 ± 0.12 Bc | 4.26 ± 0.10 Abc | 4.04 ± 0.44 Ab | 2.10 ± 0.06 Aa |
| L. acidophilus | 3.71 ± 0.12 Ab | 4.62 ± 0.05 Bc | 4.34 ± 0.08 Ac | 4.65 ± 0.07 Bc | 3.30 ± 0.06 Ab | 2.60 ± 0.18 Ba | |
| O. oeni | 3.71 ± 0.12 Abc | 4.62 ± 0.08 Bd | 4.18 ± 0.15 Acd | 4.27 ± 0.10 ABd | 3.55 ± 0.13 Ab | 2.24 ± 0.06 ABa | |
| Petunidin-3-O-arabinoside | L. brevis | 3.55 ± 0.01 Abc | 3.90 ± 0.08 Bcd | 4.04 ± 0.17 Bd | 3.39 ± 0.02 Bb | 3.12 ± 0.11 Bb | 1.45 ± 0.03 Aa |
| L. acidophilus | 3.55 ± 0.01 Ac | 3.39 ± 0.10 Ac | 3.47 ± 0.02 Ac | 4.35 ± 0.02 Cd | 2.65 ± 0.03 Ab | 1.89 ± 0.07 Ba | |
| O. oeni | 3.55 ± 0.01 Ad | 3.60 ± 0.11 ABd | 3.53 ± 0.05 Ad | 3.09 ± 0.10 Ac | 2.53 ± 0.09 Ab | 1.58 ± 0.07 Aa | |
| Malvidin-3-O-arabinoside | L. brevis | 2.14 ± 0.12 Ad | 1.90 ± 0.06 Ad | 2.10 ± 0.05 Bd | 1.59 ± 0.02 Ac | 1.17 ± 0.07 Bb | 0.50 ± 0.01 Ba |
| L. acidophilus | 2.14 ± 0.12 Ad | 1.81 ± 0.02 Ac | 1.94 ± 0.05 Bcd | 1.79 ± 0.00 Bc | 1.17 ± 0.02 Bb | 0.51 ± 0.02 Ba | |
| O. oeni | 2.14 ± 0.12 Ad | 1.69 ± 0.06 Ac | 1.54 ± 0.02 Ac | 1.60 ± 0.02 Ac | 0.96 ± 0.02 Ab | 0.43 ± 0.01 Aa | |
| Total | L. brevis | 331.13 ± 1.34 Acd | 372.39 ± 10.13 Be | 370.37 ± 0.71 Bde | 282.48 ± 6.87 8Ab | 293.11 ± 15.65 Bbc | 172.23 ± 3.56 Aa |
| L. acidophilus | 331.13 ± 1.34 Ae | 301.24 ± 3.58 Ac | 312.61 ± 3.1 Acd | 318.82 ± 2.31 Bde | 245.82 ± 0.83 Ab | 188.88 ± 3.94 Ba | |
| O. oeni | 331.13 ± 1.34 Ae | 301.82 ± 7.91 Ad | 307.44 ± 3.06 Ad | 273.90 ± 2.17 Ac | 226.68 ± 4.65 Ab | 173.71 ± 1.48 Aa | |
| Compound | Strain | Time (Day) | |||||
|---|---|---|---|---|---|---|---|
| 0 | 1 | 2 | 3 | 7 | 14 | ||
| L* value | L. brevis | 46.34 ± 1.18 Aa | 44.95 ± 0.94 Aa | 46.69 ± 1.54 Aa | 45.97 ± 0.77 Aa | 46.41 ± 0.65 Aa | 51.02 ± 1.94 Ab |
| L. acidophilus | 46.34 ± 1.18 Aa | 49.05 ± 0.47 Bb | 49.14 ± 1.56 ABb | 49.14 ± 0.93 Bb | 50.29 ± 0.90 Bb | 51.00 ± 0.38 Ab | |
| O. oeni | 46.34 ± 1.18 Aa | 51.90 ± 0.51 Cbc | 51.55 ± 0.70 Cb | 51.10 ± 0.98 Cb | 52.31 ± 0.14 Cbc | 53.04 ± 0.64 Ac | |
| a* value | L. brevis | 60.34 ± 0.02 Ab | 60.66 ± 0.06 Cb | 60.47 ± 0.17 Cb | 60.37 ± 0.12 Cb | 60.06 ± 0.05 Cb | 58.71 ± 1.01 Aa |
| L. acidophilus | 60.34 ± 0.02 Ac | 60.19 ± 0.05 Bc | 60.06 ± 0.28 Bc | 59.92 ± 0.16 Bbc | 59.37 ± 0.14 Bab | 58.85 ± 0.72 Aa | |
| O. oeni | 60.34 ± 0.02 Ad | 59.61 ± 0.15 Ac | 59.55 ± 0.11 Ac | 59.40 ± 0.20 Ac | 58.69 ± 0.17 Ab | 57.56 ± 0.38 Aa | |
| b* value | L. brevis | 2.24 ± 0.71 Ab | 4.64 ± 0.29 Bc | 4.14 ± 0.80 Bc | 3.62 ± 0.22 Bc | 2.50 ± 0.15 Bb | −0.60 ± 0.90 Aa |
| L. acidophilus | 2.24 ± 0.71 Ab | 2.68 ± 0.26 Ab | 2.60 ± 0.83 Ab | 2.22 ± 0.44 Ab | 1.55 ± 0.68 Aab | 0.73 ± 1.16 Aa | |
| O. oeni | 2.24 ± 0.71 Ac | 2.06 ± 0.48 Ac | 2.00 ± 0.25 Ac | 1.61 ± 0.39 Ac | 0.61 ± 0.44 Ab | −0.47 ± 0.38 Aa | |
| ΔE* value | L. brevis | — | 2.85 ± 0.70 Ab | 2.73 ± 0.54 Aab | 1.55 ± 0.38 Aab | 0.64 ± 0.26 Aa | 5.75 ± 2.20 Ac |
| L. acidophilus | — | 2.76 ± 0.46 Aa | 2.92 ± 1.56 Aa | 2.86 ± 0.96 Aa | 4.17 ± 0.84 Bab | 5.21 ± 0.73 Ab | |
| O. oeni | — | 5.63 ± 0.55 Bab | 5.28 ± 0.71 Bab | 4.90 ± 1.05 Ba | 6.42 ± 0.22 Cb | 7.75 ± 0.81 Cc | |
© 2019 by the authors. Licensee MDPI, Basel, Switzerland. This article is an open access article distributed under the terms and conditions of the Creative Commons Attribution (CC BY) license (http://creativecommons.org/licenses/by/4.0/).
Share and Cite
Chen, Y.; Ouyang, X.; Laaksonen, O.; Liu, X.; Shao, Y.; Zhao, H.; Zhang, B.; Zhu, B. Effect of Lactobacillus acidophilus, Oenococcus oeni, and Lactobacillus brevis on Composition of Bog Bilberry Juice. Foods 2019, 8, 430. https://doi.org/10.3390/foods8100430
Chen Y, Ouyang X, Laaksonen O, Liu X, Shao Y, Zhao H, Zhang B, Zhu B. Effect of Lactobacillus acidophilus, Oenococcus oeni, and Lactobacillus brevis on Composition of Bog Bilberry Juice. Foods. 2019; 8(10):430. https://doi.org/10.3390/foods8100430
Chicago/Turabian StyleChen, Yuqi, Xiaoyu Ouyang, Oskar Laaksonen, Xiaoyu Liu, Yuan Shao, Hongfei Zhao, Bolin Zhang, and Baoqing Zhu. 2019. "Effect of Lactobacillus acidophilus, Oenococcus oeni, and Lactobacillus brevis on Composition of Bog Bilberry Juice" Foods 8, no. 10: 430. https://doi.org/10.3390/foods8100430
APA StyleChen, Y., Ouyang, X., Laaksonen, O., Liu, X., Shao, Y., Zhao, H., Zhang, B., & Zhu, B. (2019). Effect of Lactobacillus acidophilus, Oenococcus oeni, and Lactobacillus brevis on Composition of Bog Bilberry Juice. Foods, 8(10), 430. https://doi.org/10.3390/foods8100430