
Synchronous Front-Face Fluorescence Spectra: A Review of Milk Fluorophores

1
Centre d’Innovació, Recerca i Transferència en Tecnologia dels Aliments (CIRTTA), Department of Animal and Food Sciences, Universitat Autònoma de Barcelona, Bellaterra, (Cerdanyola del Vallès), 08193 Barcelona, Spain
2
Department of Food Science and Nutrition, California State University, Fresno, 5300 N CampusDrive M/S FF17, Fresno, CA 93740, USA
*
Author to whom correspondence should be addressed.
Foods 2024, 13(5), 812; https://doi.org/10.3390/foods13050812
Submission received: 17 January 2024
/
Revised: 26 February 2024
/
Accepted: 3 March 2024
/
Published: 6 March 2024
(This article belongs to the Special Issue Development of Fluorescent and Infrared Spectroscopy Methods' Applications in Food Analysis)
Abstract
:Milk is subjected to different industrial processes, provoking significant physicochemical modifications that impact milk’s functional properties. As a rapid and in-line method, front-face fluorescence can be used to characterize milk instead of conventional analytical tests. However, when applying fluorescence spectroscopy for any application, it is not always necessary to determine which compound is responsible for each fluorescent response. In complex matrixes such as milk where several variables are interdependent, the unique identification of compounds can be challenging. Thus, few efforts have been made on the chemical characterization of milk’ fluorescent spectrum and the current information is dispersed. This review aims to organize research findings by dividing the milk spectra into areas and concatenating each area with at least one fluorophore. Designations are discussed by providing specific information on the fluorescent properties of each compound. In addition, a summary table of all fluorophores and references cited in this work by area is provided. This review provides a solid foundation for further research and could serve as a central reference.
1. Introduction
Milk is a complex matrix of water, fat, protein, lactose, minerals, traces of pigments, enzymes, and vitamins. Milk composition may vary considerably between breeds and even between individuals of the same breed, as well as seasonal changes, age, stage of lactation, and feeding [1]. In addition, milk is subjected to different processes, such as homogenization or heat treatments, which impact milk functional properties such as emulsification, coagulation, foaming, and film formation [2,3].
Milk characterization, which implies various test analyses, is necessary for dairy processing to ensure milk functional quality. Most of them are time- and material-consuming, not feasible for in-, on- or at-line monitoring, and require a qualified workforce [4]. On the contrary, front-face fluorescence spectroscopy has shown great potential to assess dairy products and displays various advantages over other methods since it is a fast, sensitive, and reliable technique that does not destroy the sample, making it suitable for in-, on- or at-line process control [5]. Indeed, it has been demonstrated that it can distinguish between different levels of heat treatment [6,7], identify the geographical origin of the milk [8], differentiate between homogenized and non-homogenized milk [9], predict functional properties of whey proteins [10], predict particle size of caseins [11], predict the concentration of lactulose [12], native whey protein, aggregate whey protein [11], hydroxymethylfurfural, sulfhydryl groups [13], riboflavin, ascorbic acid [14], furosine [15], as well as, model the kinetics of retinol loss during thermal processing [16], and predict storage time in infant milk formula [17].
Some milk compounds are naturally fluorescent, known as fluorophores, where each fluorophore has its specific excitation and emission profile [18] and could show slight changes in protein and lipid structure [19,20], providing milk quality information. Various studies presented the spectrum behavior of each fluorophore, but separately. It means that milk’s fluorophores were scanned by setting a specific excitation wavelength and displaying an emission spectrum [6,8,9,17,21] or using a range of different excitations, where a single emission was recorded [3,9,22]. However, several measures should be performed on multi-component samples, such as milk, to assess more than one fluorophore. This requires knowing the optimum emission or excitation wavelength for each fluorophore previously, which will change depending on the milk’s conditions.
Synchronous fluorescence is an excellent way to collect fluorescence from all fluorophores at once. It scans both a range of excitation and emission simultaneously with a fixed interval between the excitation and emission wavelengths [23,24].
The combination of synchronous spectroscopy with NIR spectroscopy or fluorescence enhancers can improve sensitivity and specificity in detecting trace substances in complex matrices [25,26]. Synchronous fluorescence fingerprints could act as the identity card of food products. The non-specific fingerprinting approach relies on the implementation of instrumental methods to obtain a multivariate description of the chemical composition of the sample and on the statistical approaches to extract meaningful information, known as chemometric models. Machine learning approaches, like support vector machines or artificial neural networks, can complement traditional chemometric methods in spectral data analysis and wavelength peak identification [27]. As a result, it can provide broader information, and no specific wavelength is necessary. Most synchronous fluorescence studies on milk have focused on a specific application. For example, the synchronous fluorescence method has been used to identify between different milk species [28], detect the presence of reconstituted milk in raw milk and in pasteurized milk [29], quantify protein content [30], classify the types of protein leaks in permeate streams [30] and identify the impact of milk heat treatment on coagulation [31]. Some studies have attempted to assign the observed peaks to a compound by referring to other researches [32,33]. Indeed, to the best of our knowledge, no study has systematically assigned or related each peak, that shows up on whole synchronous fluorescence spectra of milk, to a specific fluorophore. Therefore, this study aims to organize literature information by dividing the spectra into areas and concatenating each area with at least one compound based on the fluorescent properties.
2. General Fluorophores Features
A fluorophore is a type of molecule that can re-emit light of other frequencies after being stimulated by another light excitation. Fluorophore molecules absorb at higher and emit lower energy radiation where fluorophore’s electrons perform the energy transition. The general principle can be illustrated by a Jablonski diagram (Figure 1), in which an electron’s energy transition between energy states is presented as vertical lines, but not all transitions are allowed. The energy involved in an electron’s transition is the energy difference between the starting energy level and the final level, according to the equation: ; where is the Planck constant and υ is the light frequency.
A fluorophore can absorb energy by photons of light, which should have higher energy than the ground state (S0) to promote an electron at some higher vibrational level of either S1 or S2. This excited state is unstable, and thus, a vibrational relaxation or internal conversion occurs, where there is a first loss of energy but no light emission. This energy is liberated as vibrational energy, which is converted into heat absorbed by closed molecules. A final relaxation occurs when the electron returns to the ground state. During this transition, light is emitted. Therefore, the energy released is always smaller than the energy acquired by the electron in the first place. Since high-wavelength radiation is less energetic than short-wavelength radiation, the emission wavelength is always greater than the excitation one. The wavelength difference between the peak of the excitation and that of the emission is known as Stokes Shift (Figure 2 [5,34]).
A fluorophore can absorb and emit photons of light with different levels over the distribution of wavelengths, corresponding to different vibrational transitions, displayed as spectra. In general, the chemical configuration of fluorophores contains one or more rings, usually aromatic structures, and sometimes certain carbonyl groups with aliphatic chains [35]. Fluorophores are classified into two general groups: intrinsic and extrinsic [34]. The intrinsic group is molecules that occur naturally, while the extrinsic group is synthetic or modified molecules that are added to display fluorescence. Variations in temperature and environment, such as pH, solute concentration, solvent polarity, and color, may modify the fluorophore fluorescence features. For example, when the environment is less polar, the emission peak shifts to shorter wavelengths (blue-shift) and its intensity increases, but the change is tiny in a non-polar environment [36]. Consequently, a fluorophore is sensitive to the environment and could be used as a marker of surroundings. In addition, the fluorescence intensity response of a fluorophore can decrease due to a phenomenon called fluorescence quenching, which is when an excited fluorophore transfers energy to another molecule in a solution [37]. Thus, fluorescence offers several advantages for the characterization of food products due to its sensitivity to molecular interactions, chemical reactions, and changes in the environment of molecules.
3. Fluorescence Measurements
3.1. Fluorescence Geometry
Fluorescence measurements can be performed using two different geometries: the right angle and the front-face fluorescence. Regarding the first geometry, the excitation light travels through the sample and the detector is positioned at a right angle to the center of the sample, as shown in Figure 3 Therefore, it can be applied only in transparent samples, and a dilution should be performed on turbid samples. Alternatively, the second geometry requires the sample be placed with its surface oriented between 30° to 60° with respect to the axis of inflection (Figure 2). In this manner, the emission and the excitation occur on the same cuvette face, which means that the front-face can be used for opaque liquids, such as milk or solid samples. Consequently, there is no need for sample manipulation, and it is suitable for in/on/at-line applications [34,36]. This configuration permits the implementation of this technology into miniaturized instrumentation, compact spectral sensors, and handheld systems or portable devices.
Most of the studies reporting the use of fluorescence in milk have been performed by using the so-called classical front-face fluorescence spectroscopy with wavelength ranges detecting molecules such as tryptophan and Maillard compounds. Many studies focused on assessing the potential of front-face fluorescence spectroscopy to characterize and/or differentiate heat treated and commercial milk [7,9,11,13,15,22,38]. Front-face fluorescence spectroscopy has also been assessed to identify milk geographic origin [8], feeding systems [39], differentiate between Sicilo–Sarde and Comisana Ewe’s Milk [40], and to detect adulteration of goat milk powder with bovine milk powder [41].
3.2. Fluorescence Measurements
There are different ways to collect fluorescent measurements from a sample to display its spectra (emission spectrum, excitation spectrum, and total excitation–emission spectrum). The most conventional is when the excitation monochromator is set at a single wavelength, and the emission spectrum of a sample is scanned. Usually, the molecule is excited at its absorption maximum (λexmax). The inverse is another way where a range of different excitations is used, and a single emission is recorded. In this case, the fluorescence measurement collects the emission maximum (λemmax). Only one excitation and one emission spectrum are usually enough to characterize a pure compound. However, samples with multiple fluorophores, such as milk, may require scanning multiple times at different excitations and emissions. It also implies that previous knowledge of each fluorophore’s appropriate excitation/emission.
The Excitation–Emission Matrix (EEM) way increases the information, where a range of emission spectra is scanned at different excitation wavelengths, and three-dimensional data is obtained (excitation, emission, and intensity). In this method, some information needs to be removed before data analysis. For example: (1) when the excitation wavelength is higher than the emission. It is because there is no fluorescent response. (2) when the excitation and emission wavelengths are equal. It constitutes the scattered light, known as 1st order light. According to measurement principles, the second order light should also be deleted. This happens when the emission wavelength is twice that of the excitation wavelength. (3) when values are under 230 nm and over 810 nm for excitation and emission, respectively. It is highly recommended to be removed because they are regions with low sensibility. Thus, this method requires data preprocessing since not all information is fluorescent response [42,43,44].
On the contrary, the excitations and emissions are simultaneously scanned in synchronous measurements with a fixed interval between excitation and emission wavelengths, named delta (Δλ). This method allows spectral simplification and always maintains the excitation smaller than the emission wavelength. In other words, the light scattered is excluded by itself [23,42,45]. Regarding the use of front-face synchronous fluorescence spectroscopy, studies have focused on milk heat treatment [46,47,48,49], and milk quality by detecting species adulteration [26,28,33,50].
4. Synchronous Front-Face Fluorescence of Milk
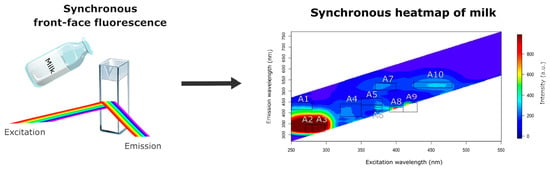
Milk contains various natural fluorescent compounds, some of which are essential for nutritional value and technological functionality. These compounds include amino acids, cofactors, and vitamins, among others, which serve as intrinsic fluorophores. This section aims to organize the literature information on milk fluorophores based on the front-face fluorescence response of reconstituted skimmed cow milk powder (“low heated”, spray-dried, pH = 6.5, solubility = 99%, WPNI ≥ 7 mg·g−1 and 800 cfu·g−1 milk; Chr. Hansen SL, Jernholmen, Denmark). From the heatmap of milk excitation-emission matrix spectra (250–550 nm and 300–750 nm, respectively), ten areas of interest were detected (Figure 4), and each area was concatenated with at least one fluorophore. A summary table of the potential fluorophores is provided at the end of the discussion.
4.1. Area 1 (Exc. 250–280 nm/Em. 420–450 nm)
The literature does not provide information on the fluorescence response of this area in cow milk. However, fluorophores that emit over 390 nm have been attributed to carotenoids and retinol (vitamin A) in yogurt and cheese samples [51]. Carotenoids are synthesized naturally in plants but not in animals. Carotenoids are a group of pigments that are naturally found in plants, algae, and some bacteria. They are responsible for the yellow, orange, and red colors of fruits and vegetables, and are known to have numerous health benefits. One of the lesser-known sources of carotenoids is milk, particularly cow milk. The most abundant carotenoid is β-carotene, also known as provitamin A, and it can form two retinol molecules [52]. Therefore, β-carotene is metabolized easily into retinol. Both are fluorescent in milk and are considered relevant molecules in food due to their nutritional value [50]. Carotenoids and retinol are fat soluble; they can be found mainly in the fat globule of milk [53], but it has been demonstrated that retinol forms water-soluble complexes with whey proteins such as α-Lactalbumin and β-Lactoglobulin [54,55]. In addition, although reconstituted skimmed milk was used, traces of retinol may still be in the reconstituted milk since the fat content of milk powder was 1.25%. Another feature of carotenoids and retinol is that they are sensitive, especially in the presence of light and heat [52]. Moreover, the absorption of light by β-carotene may affect the measured fluorescence of retinol [20]. In various studies, by setting the emission wavelength to ~410 nm, a peak at ~300 nm was observed in the excitation spectra, attributed to retinol [3,9,22].
4.2. Areas 2 and 3 (Exc. 270–280 nm/Em. 323–355 nm and Exc. 280–298 nm/Em. 323–355 nm)
These two areas are small, with only a 10 nm range in excitation. Notice that they differ in the excitation wavelength since the emission wavelengths are identical. Some of the intrinsic fluorescence of milk proteins is due to three aromatic amino acids: phenylalanine (Phe), tyrosine (Tyr), and tryptophan (Trp), which are generally used as markers to assess protein. They emit from 250 to 440 nm, but their emission wavelengths overlap [37], making it hard to evaluate them separately. The quantum yield of Phe is too low to be detected (0.02) and can be observed only in the absence of Tyr and Trp [56]. Although the fluorescence intensity of Tyr is higher than Trp in solution, these two amino acids’ quantum yields are almost identical: 0.14 and 0.13, respectively. It occurs because the Trp emission spectrum is wider than Tyr, which gives the appearance of a lower quantum yield [37]. Several studies in milk reported the emission fluorescence spectrum of Trp at an excitation of 290 nm and obtained a peak intensity of around 340 nm [6,8,9,17]. It has been demonstrated that conformational changes in protein could be studied mainly by changes in the fluorescence intensity of Trp but also of Tyr [57]. In addition, Trp has been used in milk to identify thermal treatments [6], distinguish between species [51] and establish changes in casein micelle during pH changes [21]. For example, Ayala et al. [6] found that the fluorescence intensity of Trp decreased and observed a shift toward larger wavelengths, called redshift, which was observed when there was an increase in the intensity of thermal treatments in skim milk by assessing the wavelengths: 290/340 nm (excitation/emission) (Figure 5). The synchronous response of yogurt from different milk species showed a standout peak around 280–300 nm and 320–350 nm in excitation and emission, respectively. This peak distinguished yogurt produced with buffalo milk from those of cow, goat, and ewe, and was attributed to Trp [51]. In contrast, the fluorescence emission of Trp (305–400 nm) was measured during the acidification of reconstituted milk, and a redshift was detected on the emission maximum [21]. Tryptophan is very sensitive to the environment. Its fluorescent spectrum is well characterized and widely used to assess milk. Just to cite a few examples: it has been observed that tryptophan spectra could be used to distinguish between different levels of heat treatment [6,7], to identify the geographical origin of milk [5,33], to differentiate between homogenized and non-homogenized milk [9], to check milk authenticity [58], to investigate protein interactions [59] and to predict storage time in infant milk formula [17].
According to Andersen and Mortensen [20], emissions between 305 and 400 nm are spectroscopic parameters widely used to explain and detect protein structure changes such as: conformational transitions, associations, and denaturation. When Tyr is in proteins, its fluorescence is lower than Trp even if Tyr residues are equal to or greater than Trp. An explanation for this could be the position of Tyr in a tertiary structure, resulting in Tyr residues hiding. Another possibility could be that Tyr transfers energy to Trp during the excitation, inducing a quenching of Tyr [34]. A study recording 3D fluorescence spectra of pure grade Tyr, at the excitation range of 200–450 nm and emission range of 200–500 nm, found two peaks with the strongest intensity was at 280/305 nm excitation/emission [60]. In addition, Christensen et al. [18] suggested wavelengths of 276 and 302 nm for Tyr excitation and emission, respectively. Therefore, Tyr was expected to emit at a slightly shorter wavelength than Trp. However, Murillo et al. [61] observed two peaks with almost the same emission ~331 nm in spectra of different whey samples (excitation/emission ranges of 220–320/260–435 nm). A chromatographic study was used to prove that whey fluorescence in these areas was due to the presence of Tyr and Trp. Consequently, area 2, with average excitation/emission wavelengths of 278/338 nm, could be attributed to Tyr. Meanwhile, area 3, with average excitation/emission wavelengths of 285/337 nm, would be associated with Trp.
4.3. Area 4 (Exc. 320–350 nm/Em. 390–445 nm)
Ma and Amamcharla [30] analyzed the fluorescence spectra of milk and whey permeate powders recording the emission spectra from 300 to 500 nm and the corresponding excitation wavelengths from 220 to 360 nm. They attributed the fluorescence at 310–350 and 380–430 nm excitation/emission to Maillard products, which are a series of compounds that form through chemical chain reactions between amino groups of amino acids and reducing sugars. One consequence of these glycation reactions in proteins is the formation of covalently cross-linked aggregates, and some of them are fluorescent [62]. For the sake of simplicity, the Maillard reaction can be divided into three main stages: early, advanced, and final. These stages are interrelated and are affected by the conditions [63]. In milk, Maillard reactions occur during heat treatment or storage [64]. Pentosidine is a cross-link molecule formed between a modified lysine residue and arginine [65]. It is considered as a representative of the advanced glycation end products (AGEs) and is a fluorescent molecule [66]. It excites at 335 nm and emits at 385 nm when isolated and in its native form [65]. These fluorescence values are very close to those found in the present study. It should be remembered and considered that the milk used is from low-heat skim milk powder, which means that it had previously been subjected to a heat treatment during the dehydration process. Moreover, pentosidine has been detected in milk samples such as UHT, sterilized, evaporated, and powdered [67]. Therefore, it makes sense to attribute area 4 to pentosidine.
Another compound that could be related to the fluorescence obtained in area 4 is dityrosine, which is a specific product of protein oxidation. This fluorescent molecule is proposed as a marker of oxidative conditions. Solution of pure dityrosine exhibited emission and excitation spectra with one peak, around 315 nm for the emission when excited at 400 nm [68].
The values of excitation and emission observed in area 4 were considerably similar to those detected by Blecker et al. [31], where synchronous measurements were performed on renneted skim raw milk and presented a peak around 333/393 nm (excitation/emission). This peak was attributed to pyridoxine (vitamin B6), a water-soluble fluorescent vitamin presents in small amounts in cow milk [69]. Christensen et al. [18] proposed the same vitamin as a characteristic fluorophore of food samples, with similar wavelength values, around 328/393 nm. Another vitamin that could contribute with its fluorescence to area 4 is retinol. Its maximum emission wavelength is located at around 412 nm in milk samples when the excitation is set at 321 nm [9]. However, Ali et al. [49] suggests that the emission peak at 410 nm indirectly corresponds to retinol in buffalo milk. As mentioned for area 1, retinol is a fat-soluble vitamin, but it can form hydrophilic compounds when retinol binds to whey proteins.
As set out above, many molecules could be responsible for the fluorescence of area 4 such as Maillard compounds, i.e., pentosidine, dityrosine, vitamin B6 or retinol.
4.4. Area 5 (Exc. 350–380 nm/Em. 440–470 nm)
Area 5 could also be attributed to Maillard compounds. Indeed, some fluorescent products from the Maillard reaction can be observed in different food systems with excitations and emissions of 340–370 and 420–470 nm, respectively [62]. Obayashi et al. [70] suggested that some AGEs could be excited from 340 to 370 nm and emitted from 420 to 440 nm wavelength. In another study, with camel milk, the emission spectra of Maillard compounds (380–680 nm) were obtained by exciting at 360 nm, and presented three peaks at 450, 480, and 510 nm [22]. It must be noticed that peak wavelengths of 360/450 nm (excitation/emission) are very similar to those of area 5. The molecular structure of many AGEs has not yet been specified. In parallel, medical studies on human skin ageing used excitation and emission wavelengths of 370 and 440 nm to assess the accumulation of AGEs [71,72]. In addition, the same excitation/emission wavelengths were used by Wu et al. [73] to measure the fluorescence associated with AGEs produced after incubating D-glucose and bovine serum albumin (BSA). Specifically, there is a fluorescent compound with excitation/emission wavelengths of 366/440 nm called pentodilysine, an AGE product resulting from the interaction between pentoses or ascorbic acid and lysine residues, all of them available in milk [74].
Another fluorophore that excites and emits close to area 5 is NADH, an enzyme cofactor found in milk. The excitation/emission of NADH in water is 340/460 nm, but upon binding of NADH to protein, its fluorescence may change depending on the protein [37]. Its emission fluorescent response was assessed in camel milk after thermal treatments by setting the excitation wavelength at 340 nm [22]. A peak located at 450 nm in the emission spectra, whose intensity decreased as the heat treatment increased, was observed and was attributed to NADH. In the same line, Kulmyrzaev et al. [38] used front-face fluorescence at an excitation of 360 nm to characterize milk after different thermal treatments. These authors found two peaks and suggested that the smallest one, at wavelengths of 360/460 nm (excitation/emission), could be NADH. In conclusion, area 5 of milk identified in the present research could be attributed to either Maillard compounds, specifically pentodilysine, or to NADH.
4.5. Areas 6, 7, and 8 (Exc. 368–380 nm/Em. 415–430 nm; Exc. 370–400 nm/Em. 505–535 nm; Exc. 390–410 nm/Em. 410–430 nm)
Since AGEs can be excited from 340 up to 370 nm emitting from 420 to 440 nm [70], area 6 could also be related to these molecules. Indeed, Birlouez-Aragon et al. [75] used 350/440 nm (excitation/emission) in the milk fraction soluble at pH 4.6 to assess the global formation of Maillard compounds after different heat treatment processes were applied to milk samples. In addition, fluorescence in infant formulas was measured during storage by setting 415 nm in emission and the excitation from 200 to 400 nm, to assess AGEs compounds [76]. Three peaks in the excitation spectra were observed: 270, 315/325 and 350 nm, where the highest wavelength (350 nm) is near the values obtained for area 6. However, the authors did not specify the compound which was responsible for the fluorescence. A molecule that can fit in this area is pyrropyridine since its excitation/emission is 370/455 nm [77]. It is an AGE product resulting from the reaction of 3 deoxyglucosone and lysine, both compounds available in milk. Although the excitation wavelength value is similar to that of area 6, the emission from pyrropyridine is much higher. Maillard compounds have not been fully established, and fluorescent products even less, mainly due to the great number of compounds that can be formed, and the complexity of the pathways involved. Consequently, a deeper investigation would be necessary to relate this area to a specific compound.
According to Yang et al. [78], riboflavin, also known as vitamin B2, excites at 370 nm and emits at 525 nm, which fits with area 7. However, riboflavin has three well defined peaks located at around 270/525 nm, 370/525 nm and 450/525 nm, which could correspond to other areas of the present study thus area 7 will be discussed in Section 4.7.
Area 8 was also attributed to riboflavin, which could correspond to the other peak of this compound. Its discussion can be found in Section 4.7, together with areas 7 and 10.
4.6. Area 9 (Exc. 410–430 nm/Em. 410–450 nm)
It must be noticed that this area has a difference of a few nanometers between excitation and emission. The emission area from 400 to 500 nm is complex because the fluorescence observed here may be from compounds degraded by light, such as: riboflavin or retinol, and Maillard compounds [20]. The compound, which possesses fluorescent attributes, is closest to area 9 is lumichrome, whose fluorescence response in the emission range is around 444–479 nm [79]. Lumichrome occurs naturally in milk exposed to light since it is a photo-chemical degradation product from riboflavin [80]. Hence, lumichrome is in the group of the flavins. Most of the flavins excite in similar values than riboflavin. Andersen and Mortensen [20] point out that the excitation maximum of lumichrome is similar as the excitation maximum of riboflavin, and thus, about 450 nm. Koziol [81] reported that water solution of lumichrome excites at 219, 261 and 354 nm, which means that area 1 and 5 may be also involved while in 2 N NaOH solution excites at 224, 266, 340, and 432 nm, where area 9 may be also implicated.
4.7. Area 10 (Exc. 425–480 nm/Em. 515–540 nm)
After analyzing the fluorescent behavior of areas 7, 8 and 10, it was hypothesized that the fluorescent response is due to riboflavin, which is known for its strong fluorescence in dairy products [20]. A study on the fluorescence spectra of riboflavin in aqueous solution scanned at an excitation wavelength from 200 to 550 nm and an emission range of 450–650 nm, showed three excitation peaks: 270, 370 and 450 nm at the same emission wavelength, 525 nm [78]. This emission wavelength matched with the emission values of areas 7 and 10, which were 505–535 nm and 515–540 nm, respectively. Notice that these two areas had the highest emission values compared with the other areas studied. The maximum intensities were observed at about 380/520 nm and 463/528 nm (excitation/emission) for area 7 and 10, respectively. Alvarado [13] and Ayala [15] explored the riboflavin by exciting at 267, 370 and 450 nm, and emission peaks were found at around 535, 507 and 522 nm, respectively. Consequently, area 7 could be attributed to the second emission peak of riboflavin and area 10 to the third one. Bhattacharjee et al. [82] present the spectra of milk and pure riboflavin excited at 420 nm and emitted at 520 nm, showing the third peak of the riboflavin belonging to area 10. Regarding the first peak, it is essential to highlight that in this study, the first peak of riboflavin, located around 267/535 nm (excitation/emission), was out of the scanning range since the Delta stop was set at 220 nm. Therefore, at 267 nm of excitation, the maximum emission scanned was 487 nm.
As was mentioned before, in area 8 a saturation occurred. However, since it was a small area, it could be characterized. Karoui et al. [8], with an excitation wavelength of ~380 nm, reported one peak in milk emission spectrum at 520 nm and a smaller one at ~420 nm, which was present in milk samples produced in lowlands but absent in milk from mid-mountain and mountain areas. Therefore, the peak at 380/420 nm (excitation/emission), attributed to riboflavin, could fit with area 8. Alvarado [13] showed the emission spectra of the riboflavin from heat-treated skimmed milk samples, but the excitation was lower (370 nm) than that of Karoui et al. [8]. As a result, two peaks were also observed in the emission spectrum, one at about 485 nm and the other at 522 nm (Figure 6).
Riboflavin contains a nitrogen base, called flavin group, which is fluorescent. The same group is present in the coenzyme flavin adenine dinucleotide (FADH2). This coenzyme is water-soluble and photostable. In addition, it has been demonstrated that the fluorescent intensity of FADH2 increases when it is in a disintegration state [81]. Only the reduced form is highly fluorescent and occurs naturally in milk. As for riboflavin, FADH2 emits at high wavelengths. According to Albani [34], FADH2 excites at ~450 nm and emits at 515 nm. These values fit also with the fluorescence response of area 10. In another study, milk heat-treated samples were characterized by recording the excitation spectra setting the emission wavelength at 518 nm. In this study, two peaks were observed where the second peak, located at ~445 nm, was associated with the FADH2 molecule [38]. Therefore, the fluorescence observed in area 10 could be attributed either to riboflavin or to FADH2 coenzyme.
4.8. Other Compounds
Other intrinsic fluorophores that can be found in milk are chlorophyll and chlorophyll metabolites. When cows feed on grass, the milk they produce has a higher concentration of chlorophyll. Chlorophyll compounds are present in almost all milk products in variable amounts. Their emission peaks are found between 600 and 700 nm with excitation lights of 380 nm [83] or 420 nm [82]. It has been demonstrated that the fluorescence of chlorophyll can help to discriminate the milk of grass-fed cows from that of cows fed with conventional grain [82]. A specific type of chlorophyll metabolite called pheophorbide can also be detected by fluorescence spectroscopy. This metabolite is known to exhibit a peak at around 675 nm, along with a smaller peak at around 720 nm. Based on these findings conducted by Bhattacharjee et al. [82], the chlorophyll metabolite content significantly increases when cows consume grass as their main source of food.
Below, Table 1 summarizes the potential fluorophores for each area.
5. Conclusions
Considering that milk is a complex product containing many fluorescent molecules, it is convenient to evaluate the synchronous spectrum by areas. Each area was concatenated with at least one compound through literature review facilitating the characterization of the whole spectrum of milk.
This review revealed that only a limited number of investigations have been conducted to chemically verify, or even indirectly verify, the compound in question. As a result, a substantial portion of the available knowledge is based on the analysis of fluorescent responses in other systems, such as other food or pharmaceutical matrix.
This study, by compiling all the information on milk fluorescence response in just one work, lays the foundation for any study on the synchronous fluorescence of milk and could serves as a central reference. However, it must be born in mind that, for many fluorophores, confirmation through quantification is missing.
Author Contributions
Conceptualization, A.Z. and M.C.; methodology, P.F., A.Z. and M.C.; software, P.F.; validation, A.Z.; formal analysis, P.F.; investigation, P.F. and A.Z.; resources, M.C.; data curation, P.F.; writing—original draft preparation, P.F.; writing—review and editing, A.Z. and M.C.; visualization, P.F.; supervision, A.Z. and M.C.; project administration, M.C.; funding acquisition, A.Z. and M.C. All authors have read and agreed to the published version of the manuscript.
Funding
This research was partially supported by SENESCYT (Secretaría de Educación Superior, Ciencia, Tecnología e Innovación of the Ecuadorian Government), grant number [106-2017 (SENESCYT-SDFC-DSEFC-2017-3855-O)]. The mentioned funds corresponded to P. Freire’s PhD fellowship.
Institutional Review Board Statement
Not applicable.
Informed Consent Statement
Not applicable.
Data Availability Statement
Not applicable.
Conflicts of Interest
The authors declare no conflicts of interest.
References
- Massouras, T.; Charmanta, A.-A.; Koutsouli, P.; Masoura, M.; Politis, I.; Hettinga, K. The Effect of Milking Frequency, Breed, and Stage of Lactation on the Milk Fat Globule Size and Fatty Acid Composition in Sheep’s Milk. Foods 2023, 12, 2446. [Google Scholar] [CrossRef]
- O’Connell, J.E.; Fox, P.F. Heat Treatment of Milk: Heat Stability of Milk. In Encyclopedia of Dairy Sciences; Fuquay, J.W., Ed.; Academic Press: San Diego, CA, USA, 2011; pp. 744–749. ISBN 978-0-12-374407-4. [Google Scholar]
- Liu, J.; Zamora, A.; Castillo, M.; Saldo, J. Modeling of the Changes in Bovine Milk Caused by Ultra-High Pressure Homogenization Using Front-Face Fluorescence Spectroscopy. J. Food Eng. 2018, 233, 88–97. [Google Scholar] [CrossRef]
- Babu, K.S.; Amamcharla, J.K. Application of Front-Face Fluorescence Spectroscopy as a Tool for Monitoring Changes in Milk Protein Concentrate Powders during Storage. J. Dairy Sci. 2018, 101, 10844–10859. [Google Scholar] [CrossRef]
- Karoui, R.; Blecker, C. Fluorescence Spectroscopy Measurement for Quality Assessment of Food Systems—A Review. Food Bioprocess Technol. 2011, 4, 364–386. [Google Scholar] [CrossRef]
- Ayala, N.; Zamora, A.; Rinnan, Å.; Saldo, J.; Castillo, M. The Effect of Heat Treatment on the Front-Face Fluorescence Spectrum of Tryptophan in Skim Milk. J. Food Compos. Anal. 2020, 92, 103569. [Google Scholar] [CrossRef]
- Schamberger, G.P.; Labuza, T.P. Evaluation of Front-Face Fluorescence for Assessing Thermal Processing of Milk. J. Food Sci. 2006, 71, C69–C74. [Google Scholar] [CrossRef]
- Karoui, R.; Martin, B.; Dufour, É. Potentiality of Front-Face Fluorescence Spectroscopy to Determine the Geographic Origin of Milks from the Haute-Loire Department (France). Le Lait 2005, 85, 223–236. [Google Scholar] [CrossRef]
- Dufour, E.; Riaublanc, A. Potentiality of Spectroscopic Methods for the Characterisation of Dairy Products. I. Front-Face Fluorescence Study of Raw, Heated and Homogenised Milks. Le Lait 1997, 77, 657–670. [Google Scholar] [CrossRef]
- Teng, Y.T.; Freire, P.; Zamora, A.; Castillo, M. Tryptophan Front-Face Fluorescence and Functional Properties of Whey: A Preliminary Study. LWT 2022, 163, 113589. [Google Scholar] [CrossRef]
- Taterka, H. Optical Prediction Models of Whey Protein Denaturation in Thermally Treated Milk for the Development for an Inline Sensor; Universitat Autònoma de Barcelona: Bellaterra, Spain, 2016. [Google Scholar]
- Ayala, N.; Zamora, A.; González, C.; Saldo, J.; Castillo, M. Predicting Lactulose Concentration in Heat-Treated Reconstituted Skim Milk Powder Using Front-Face Fluorescence. Food Control 2017, 73, 110–116. [Google Scholar] [CrossRef]
- Alvarado, U. Aplicación de Indicadores Nativos de Fluorescencia para la Evaluación Rápida de Daño Térmico en el Procesado de Leche; Veterinary of the Universitat Autònoma de Barcelona: Bellaterra, Spain, 2016. [Google Scholar]
- Alvarado, U.; Zamora, A.; Arango, O.; Saldo, J.; Castillo, M. Prediction of Riboflavin and Ascorbic Acid Concentrations in Skimmed Heat-Treated Milk Using Front-Face Fluorescence Spectroscopy. J. Food Eng. 2022, 318, 110869. [Google Scholar] [CrossRef]
- Ayala, O. Application of Native Fluorescence Tracers for Quick Evaluation of Thermal Damage in Milk; Universitat Autònoma de Barcelona: Bellaterra, Spain, 2018. [Google Scholar]
- Liu, J.; Zamora, A.; Castillo, M.; Saldo, J. Using Front-Face Fluorescence Spectroscopy for Prediction of Retinol Loss in Milk during Thermal Processing. LWT 2018, 87, 151–157. [Google Scholar] [CrossRef]
- Henihan, L.E.; O’Donnell, C.P.; Esquerre, C.; Murphy, E.G.; O’Callaghan, D.J. Quality Assurance of Model Infant Milk Formula Using a Front-Face Fluorescence Process Analytical Tool. Food Bioprocess Technol. 2018, 11, 1402–1411. [Google Scholar] [CrossRef]
- Christensen, J.; Nørgaard, L.; Bro, R.; Engelsen, S.B. Multivariate Autofluorescence of Intact Food Systems. Chem. Rev. 2006, 106, 1979–1994. [Google Scholar] [CrossRef] [PubMed]
- Shaikh, S.; O’Donnell, C. Applications of Fluorescence Spectroscopy in Dairy Processing: A Review. Curr. Opin. Food Sci. 2017, 17, 16–24. [Google Scholar] [CrossRef]
- Andersen, C.M.; Mortensen, G. Fluorescence Spectroscopy: A Rapid Tool for Analyzing Dairy Products. J. Agric. Food Chem. 2008, 56, 720–729. [Google Scholar] [CrossRef]
- Lopez, C.; Dufour, E. The Composition of the Milk Fat Globule Surface Alters the Structural Characteristics of the Coagulum. J. Colloid Interface Sci. 2001, 233, 241–249. [Google Scholar] [CrossRef] [PubMed]
- Kamal, M.; Karoui, R. Monitoring of Mild Heat Treatment of Camel Milk by Front-Face Fluorescence Spectroscopy. LWT—Food Sci. Technol. 2017, 79, 586–593. [Google Scholar] [CrossRef]
- Li, Y.-Q.; Li, X.-Y.; Shindi, A.A.F.; Zou, Z.-X.; Liu, Q.; Lin, L.-R.; Li, N. Synchronous Fluorescence Spectroscopy and Its Applications in Clinical Analysis and Food Safety Evaluation. In Reviews in Fluorescence 2010; Geddes, C.D., Ed.; Springer: New York, NY, USA, 2012; pp. 95–117. ISBN 978-1-4419-9828-6. [Google Scholar]
- Radotić, K.; Stanković, M.; Bartolić, D.; Natić, M. Intrinsic Fluorescence Markers for Food Characteristics, Shelf Life, and Safety Estimation: Advanced Analytical Approach. Foods 2023, 12, 3023. [Google Scholar] [CrossRef]
- Boubellouta, T.; Galtier, V.; Dufour, É. Structural Changes of Milk Components during Acid-Induced Coagulation Kinetics as Studied by Synchronous Fluorescence and Mid-Infrared Spectroscopy. Appl. Spectrosc. 2011, 65, 284–292. [Google Scholar] [CrossRef]
- Durakli Velioglu, S.; Ercioglu, E.; Boyaci, I.H. Rapid Discrimination between Buffalo and Cow Milk and Detection of Adulteration of Buffalo Milk with Cow Milk Using Synchronous Fluorescence Spectroscopy in Combination with Multivariate Methods. J. Dairy Res. 2017, 84, 214–219. [Google Scholar] [CrossRef] [PubMed]
- Freire, P.; Freire, D.; Licon, C.C. A Comprehensive Review of Machine Learning and Its Application to Dairy Products. Crit. Rev. Food Sci. Nutr. 2024, 1–16. [Google Scholar] [CrossRef] [PubMed]
- Genis, D.O.; Sezer, B.; Bilge, G.; Durna, S.; Boyaci, I.H. Development of Synchronous Fluorescence Method for Identification of Cow, Goat, Ewe and Buffalo Milk Species. Food Control 2020, 108, 106808. [Google Scholar] [CrossRef]
- Liu, H.; Liu, W.; Han, D.; Wang, S. Detection of the Presence of Reconstituted Milk in Raw Milk and in Pasteurized Milk Using Synchronous Fluorescence Spectroscopy. Food Anal. Methods 2017, 10, 2078–2084. [Google Scholar] [CrossRef]
- Ma, Y.B.; Amamcharla, J.K. Front-Face Fluorescence Spectroscopy Combined with Chemometrics to Detect High Proteinaceous Matter in Milk and Whey Ultrafiltration Permeate. J. Dairy Sci. 2019, 102, 8756–8767. [Google Scholar] [CrossRef] [PubMed]
- Blecker, C.; Habib-Jiwan, J.M.; Karoui, R. Effect of Heat Treatment of Rennet Skim Milk Induced Coagulation on the Rheological Properties and Molecular Structure Determined by Synchronous Fluorescence Spectroscopy and Turbiscan. Food Chem. 2012, 135, 1809–1817. [Google Scholar] [CrossRef]
- Elgarhi, H.-E.; El-Aidie, S.; Hamdy, S.; Abbas, K. Identification of Milk Types Using Two Different Fluorescence Spectroscopy Techniques. Egypt. J. Food Sci. 2020, 48, 73–80. [Google Scholar] [CrossRef]
- Fotakis, C.; Mousdis, G.; Langi, P.; Kalantzi, K.; Hatzigeorgiou, A.; Proestos, C. Front Face Synchronous Fluorescence as a Tool for the Quality Assurance of Greek Milk. Arab. J. Chem. 2020, 13, 7875–7885. [Google Scholar] [CrossRef]
- Albani, J.R. Principles and Applications of Fluorescence Spectroscopy; Blackwell Science: Oxford, UK, 2007. [Google Scholar]
- Chatterjee, D.P.; Pakhira, M.; Nandi, A.K. Fluorescence in “Nonfluorescent” Polymers. ACS Omega 2020, 5, 30747–30766. [Google Scholar] [CrossRef]
- Hofmann, A. Spectroscopic Techniques. In Principles and Techniques of Biochemistry and Molecular Biology; Wilson, K., Walker, J., Eds.; Cambridge University Press: Cambridge, UK, 2010; ISBN 9780521516358. [Google Scholar]
- Lakowicz, J.R. Principles of Fluorescence Spectroscopy, 3rd ed.; Springer: Boston, MA, USA, 2006. [Google Scholar]
- Kulmyrzaev, A.A.; Levieux, D.; Dufour, É. Front-Face Fluorescence Spectroscopy Allows the Characterization of Mild Heat Treatments Applied to Milk. Relations with the Denaturation of Milk Proteins. J. Agric. Food Chem. 2005, 53, 502–507. [Google Scholar] [CrossRef]
- Hammami, M.; Rouissi, H.; Salah, N.; Selmi, H.; Al-Otaibi, M.; Blecker, C.; Karoui, R. Fluorescence Spectroscopy Coupled with Factorial Discriminant Analysis Technique to Identify Sheep Milk from Different Feeding Systems. Food Chem. 2010, 122, 1344–1350. [Google Scholar] [CrossRef]
- Zaïdi, F.; Rouissi, H.; Dridi, S.; Kammoun, M.; de Baerdemaeker, J.; Karoui, R. Front-Face Fluorescence Spectroscopy as a Rapid and Non-Destructive Tool for Differentiating between Sicilo-Sarde and Comisana Ewe’s Milk during Lactation Period: A Preliminary Study. Food Bioprocess Technol. 2008, 1, 143–151. [Google Scholar] [CrossRef]
- Brandao, M.P.; Anjos, V.d.C.d.; Bell, M.J.V. Time resolved fluorescence of cow and goat milk powder. Spectrochim. Acta Part A Mol. Biomol. Spectrosc. 2017, 171, 193–199. [Google Scholar] [CrossRef] [PubMed]
- Dufour, É. Recent Advances in the Analysis of Dairy Product Quality Using Methods Based on the Interactions of Light with Matter. Int. J. Dairy Technol. 2011, 64, 153–165. [Google Scholar] [CrossRef]
- Sugiyama, J.; Fujita, K. Detection of Food Safety Using Fluorescence Fingerprint. Hitachi Sci. Instrum. News 2014, 5, 17–22. [Google Scholar]
- Yu, J.; Xiao, K.; Xue, W.; Shen, Y.; Tan, J.; Liang, S. Excitation-emission Matrix (EEM) Fluorescence Spectroscopy for Characterization of Organic Matter in Membrane Bioreactors Principles Methods and Applications. Front. Front. Environ. Sci. Eng. 2020, 14, 31. [Google Scholar] [CrossRef]
- Dankowska, A. Advances in Fluorescence Emission Spectroscopy for Food Authenticity Testing. In Advances in Food Authenticity Testing; Downey, G., Ed.; Woodhead Publishing: Amsterdam, The Netherlands, 2016; pp. 117–145. ISBN 9780081002209. [Google Scholar]
- Bouvellouta, T.; Dufour, É. Effects of Mild Heating and Acidification on the Molecular Structure of Milk Components as Investigated by Synchronous Front-Face Fluorescence Spectroscopy Coupled with Parallel Factor Analysis. Appl. Spectrosc. 2008, 62, 490–496. [Google Scholar] [CrossRef] [PubMed]
- Hougaard, A.B.; Lawaetz, A.J.; Ipsen, R.H. Front Face Fluorescence Spectroscopy and Multi-Way Data Analysis for Characterization of Milk Pasteurized Using Instant Infusion. LWT—Food Sci. Technol. 2013, 53, 331–337. [Google Scholar] [CrossRef]
- Fragkoulis, N.; Samartzis, P.C.; Velegrakis, M. Commercial Milk Discrimination by Fat Content and Animal Origin Using Optical Absorption and Fluorescence Spectroscopy. Int. Dairy J. 2021, 123, 105181. [Google Scholar] [CrossRef]
- Ali, H.; Saleem, M.; Ullah, R.; Khan, S.; Atta, B.M.; Bilal, M. Thermal Effects on Biochemical Signatures of UHT, Pasteurized and Domestically Boiled Buffalo Milk Detected by Synchronous Fluorescence Spectroscopy. J. Fluoresc. 2019, 29, 485–493. [Google Scholar] [CrossRef]
- Ullah, R.; Khan, S.; Ali, H.; Bilal, M. Potentiality of Using Front Face Fluorescence Spectroscopy for Quantitative Analysis of Cow Milk Adulteration in Buffalo Milk. Spectrochim. Acta Part A Mol. Biomol. Spectrosc. 2020, 225, 117518. [Google Scholar] [CrossRef]
- Ozer, D.; Bilge, G.; Sezer, B.; Durna, S.; Hakki, I. Identification of Cow, Buffalo, Goat and Ewe Milk Species in Fermented Dairy Products Using Synchronous Fluorescence Spectroscopy. Food Chem. 2019, 284, 60–66. [Google Scholar] [CrossRef]
- Combs, G.F.; McClung, J.P. Vitamin A. In The Vitamins, 5th ed.; Combs, G.F., McClung, J.P., Eds.; Academic Press: Cambridge, MA, USA, 2017; pp. 109–159. ISBN 978-0-12-802965-7. [Google Scholar]
- MacGibbon, A.K.H. General Characteristics of Milk Lipids☆. In Encyclopedia of Dairy Sciences, 3rd ed.; McSweeney, P.L.H., McNamara, J.P., Eds.; Academic Press: Oxford, UK, 2022; pp. 814–820. ISBN 978-0-12-818767-8. [Google Scholar]
- Futterman, S.; Heller, J. The Enhancement of Fluorescence and the Decreased Susceptibility to Enzymatic Oxidation of Retinol Complexed with Bovine Serum Albumin, β-Lactoglobulin, and the Retinol-Binding Protein of Human Plasma. J. Biol. Chem. 1972, 247, 5168–5172. [Google Scholar] [CrossRef]
- Le, T.T. Thermal Denaturation and Aggregation of Whey Proteins. In Encyclopedia of Dairy Sciences; McSweeney, P.L.H., McNamara, J.P., Eds.; Elsevier: Oxford, UK, 2022; pp. 623–628. ISBN 978-0-12-818767-8. [Google Scholar]
- Teale, F.W. The Ultraviolet Fluorescence of Proteins in Neutral Solution. Biochem. J. 1960, 76, 381–388. [Google Scholar] [CrossRef]
- Bhattacharya, M.; Mukhopadhyay, S. Studying Protein Misfolding and Aggregation by Fluorescence Spectroscopy. In Reviews in Fluorescence 2015; Geddes, C., Ed.; Springer: Cham, Switzerland, 2016; pp. 1–27. ISBN 9783319246093. [Google Scholar]
- Lelis, C.A.; Galvan, D.; Tessaro, L.; de Andrade, J.C.; Mutz, Y.S.; Conte-Junior, C.A. Fluorescence Spectroscopy in Tandem with Chemometric Tools Applied to Milk Quality Control. J. Food Compos. Anal. 2022, 109, 104515. [Google Scholar] [CrossRef]
- Singh, R.; Amamcharla, J.K. Effect of PH on Heat-Induced Interactions in High-Protein Milk Dispersions and Application of Fluorescence Spectroscopy in Characterizing These Changes. J. Dairy Sci. 2021, 104, 3899–3915. [Google Scholar] [CrossRef]
- Grigoryan, K.R.; Shilajyan, H.A. Fluorescence 2D and 3D Spectra Analysis of Tryptophan, Tyrosine and Phenylalanine. Chem. Biol. 2017, 51, 3–7. [Google Scholar]
- Murillo Pulgarín, J.; Alañón, A.; Alañón, M.T. Fluorescence Characteristics of Several Whey Samples Subjected to Different Treatments and Conditions. Anal. Chim. Acta 2005, 536, 153–158. [Google Scholar] [CrossRef]
- Matiacevich, S.B.; Santagapita, P.R.; Buera, M.P. Fluorescence from the Maillard Reaction and Its Potential Applications in Food Science. Crit. Rev. Food Sci. Nutr. 2005, 45, 483–495. [Google Scholar] [CrossRef] [PubMed]
- de Oliveira, F.C.; dos Reis Coimbra, J.S.; de Oliveira, E.B.; Zuñiga, A.D.G.; Rojas, E.E.G. Food Protein-Polysaccharide Conjugates Obtained via the Maillard Reaction: A Review. Crit. Rev. Food Sci. Nutr. 2016, 56, 1108–1125. [Google Scholar] [CrossRef] [PubMed]
- Nursten, H. Maillard Reactions. In Encyclopedia of Dairy Sciences; Roginski, H., Ed.; Elsevier: Oxford, UK, 2002; pp. 1657–1672. ISBN 978-0-12-227235-6. [Google Scholar]
- Sell, D.R.; Monnier, V.M. Structure Elucidation of a Senescence Cross-Link from Human Extracellular Matrix: Implication of Pentoses in the Aging Process. J. Biol. Chem. 1989, 264, 21597–21602. [Google Scholar] [CrossRef]
- Wei, Q.; Liu, T.; Sun, D.W. Advanced Glycation End-Products (AGEs) in Foods and Their Detecting Techniques and Methods: A Review. Trends Food Sci. Technol. 2018, 82, 32–45. [Google Scholar] [CrossRef]
- Henle, T.; Schwarzenbolz, U.; Klostermeyer, H. Detection and Quantification of Pentosidine in Foods. Eur. Food Res. Technol. 1997, 204, 95–98. [Google Scholar] [CrossRef]
- Harms, G.S.; Pauls, S.W.; Hedstrom, J.F.; Johnson, C.K. Fluorescence and Rotational Dynamics of Dityrosine. J. Fluoresc. 1997, 7, 283–292. [Google Scholar] [CrossRef]
- Schmidt, A.; Schreiner, M.G.; Mayer, H.K. Rapid Determination of the Various Native Forms of Vitamin B6 and B2 in Cow’s Milk Using Ultra-High Performance Liquid Chromatography. J. Chromatogr. A 2017, 1500, 89–95. [Google Scholar] [CrossRef] [PubMed]
- Obayashi, H.; Nakano, K.; Shigeta, H.; Yamaguchi, M.; Yoshimori, K.; Fukui, M.; Fujii, M.; Kitagawa, Y.; Nakamura, N.; Nakamura, K.; et al. Formation of Crossline as a Fluorescent Advanced Glycation End Productin Vitroandin Vivo. Biochem. Biophys. Res. Commun. 1996, 226, 37–41. [Google Scholar] [CrossRef] [PubMed]
- Na, R.; Stender, I.-M.; Henriksen, M.; Wulf, H.C. Autofluorescence of Human Skin Is Age-Related After Correction for Skin Pigmentation and Redness. J. Investig. Dermatol. 2001, 116, 536–540. [Google Scholar] [CrossRef] [PubMed]
- Beisswenger, P.J.; Howell, S.; Mackenzie, T.; Corstjens, H.; Muizzuddin, N.; Matsui, M.S. Two Fluorescent Wavelengths, 440ex/520em Nm and 370ex/440em Nm, Reflect Advanced Glycation and Oxidation End Products in Human Skin without Diabetes. Diabetes Technol. Ther. 2012, 14, 285–292. [Google Scholar] [CrossRef] [PubMed]
- Wu, J.T.; Tu, M.-C.; Zhung, P. Advanced Glycation End Product (AGE): Characterization of the Products from the Reaction between D-Glucose and Serum Albumin. J. Clin. Lab. Anal. 1996, 10, 21–34. [Google Scholar] [CrossRef]
- Graham, L.; Peters, R.; Nagaraj, R.H.; Sayre, L.M.; Monnier, V.M. Structure and Biological Significance of Pentodilysine, a Novel Fluorescent Advanced Maillard Reaction Protein Crosslink. In The Maillard Reaction in Foods and Medicine; O’Brien, J., Nursten, H.E., Crabbe, M.J.C., Ames, J.M., Eds.; Woodhead Publishing: Cambrige, UK, 2005; p. 410. ISBN 978-1-85573-791-4. [Google Scholar]
- Birlouez-Aragon, I.; Nicolas, M.; Metais, A.; Marchond, N.; Grenier, J.; Calvo, D. A Rapid Fluorimetric Method to Estimate the Heat Treatment of Liquid Milk. Int. Dairy J. 1998, 8, 771–777. [Google Scholar] [CrossRef]
- Ferrer, E.; Alegría, A.; Farré, R.; Clemente, G.; Calvo, C. Fluorescence, Browning Index, and Color in Infant Formulas during Storage. J. Agric. Food Chem. 2005, 53, 4911–4917. [Google Scholar] [CrossRef]
- Morales, F.J.; Boekel, M.A.J.S. Van A Study on Advanced Maillard Reaction in Heated Casein/Sugar Solutions: Colour Formation. J. Agric. Food Chem. 1997, 6946, 907–915. [Google Scholar]
- Yang, H.; Xiao, X.; Zhao, X.S.; Hu, L.; Xue, X.F.; Ye, J.S. Study on Fluorescence Spectra of Thiamine and Riboflavin. MATEC Web Conf. 2016, 63, 03013. [Google Scholar] [CrossRef]
- Karoui, R.; Mazerolles, G.; Dufour, É. Spectroscopic Techniques Coupled with Chemometric Tools for Structure and Texture Determinations in Dairy Products. Int. Dairy J. 2003, 13, 607–620. [Google Scholar] [CrossRef]
- Wold, J.P.; Jørgensen, K.; Lundby, F. Nondestructive Measurement of Light-Induced Oxidation in Dairy Products by Fluorescence Spectroscopy and Imaging. J. Dairy Sci. 2002, 85, 1693–1704. [Google Scholar] [CrossRef] [PubMed]
- Koziol, J. Fluorometric Analyses of Riboflavin and Its Coenzymes. In Methods Enzymol; Academic Press: Cambridge, MA, USA, 1971; Volume 18, pp. 253–285. [Google Scholar]
- Bhattacharjee, U.; Jarashow, D.; Casey, T.A.; Petrich, J.W.; Rasmussen, M.A. Using Fluorescence Spectroscopy to Identify Milk from Grass-Fed Dairy Cows and to Monitor Its Photodegradation. J. Agric. Food Chem. 2018, 66, 2168–2173. [Google Scholar] [CrossRef]
- Wold, J.P.; Veberg, A.; Nilsen, A.; Iani, V.; Juzenas, P.; Moan, J. The Role of Naturally Occurring Chlorophyll and Porphyrins in Light-Induced Oxidation of Dairy Products. A Study Based on Fluorescence Spectroscopy and Sensory Analysis. Int. Dairy J. 2005, 15, 343–353. [Google Scholar] [CrossRef]
Figure 1.
A simplified Jablonski diagram to illustrate fluorescence process.

Figure 2.
Excitation and emission spectra.

Figure 3.
Principles of right-angle and front-face fluorescence configurations.

Figure 4.
Areas of interest established on heatmap fluorescence of reconstituted skimmed milk powder (“low heated”, spray-dried, pH = 6.5, solubility = 99%, WPNI ≥ 7 mg·g−1 and 800 cfu·g−1 milk; Chr. Hansen SL, Jernholmen, Denmark). Milk spectra were acquired at 20 °C on a fluorescence spectrophotometer (Cary Eclipse Fluorescence Spectrophotometer, Agilent Technologies, Santa Clara, CA, USA) equipped with 15 W lamp “press Xenon lamp” and a “front-face” geometry accessory at 35° (Solid Sample Holder Accessory and Cuvette Kit, Agilent Technologies). The excitation was scanned from 250 to 550 nm at 600 volts with 1 nm intervals and an initial Delta of 20 nm, a Delta increment of 10 nm from the corresponding excitation wavelength and a Delta stop of 220 nm (excitation and emission slit widths of 5 nm); A1–A10: areas 1 to 10.

Figure 5.
Schematic figure showing the decomposition of the decrease in total fluorescence intensity of tryptophan (ΔI) into two fractions, one associated with the change of the peak height (ΔIF) and another with the displacement of the emission maximum (ΔIλ). Change in the peak wavelength (Δλ) can be seen as a shift from λ0 to λT with intensities shown as Iλ0 and IλT. Reprinted with permission from Ref. [6]. Copyright 2020, Elsevier.

Figure 6.
Emission spectra excited at 370 nm of reconstituted skim milk powder heat treated at 80 °C at six holding times.Reprinted with permission from Ref. [13]. Copyright 2016, Universitat Autònoma de Barcelona.
Figure 6.
Emission spectra excited at 370 nm of reconstituted skim milk powder heat treated at 80 °C at six holding times.Reprinted with permission from Ref. [13]. Copyright 2016, Universitat Autònoma de Barcelona.


Table 1.
Summary table of the fluorophores and references cited in this work by area.
| Area | Fluorophore | Excitation Wavelength (nm) | Emission Wavelength (nm) | Reference |
|---|---|---|---|---|
| A1 | Carotenoids | >390 | 300–550 | [51] |
| Vit A | 321 shoulders 292/308 | 412 | [9] | |
| Vit A | 307/320 | 410 | [22] | |
| A2 | Tyr | 276 | 302 | [18] |
| Tyr | 280 | 305 | [60] | |
| A3 | Trp | 290 | 340 | [6,8,9,17] |
| A4 | AGEs | 310–350 | 380–430 | [30] |
| Pentosidine | 335 | 385 | [65] | |
| Dityrosine | 315 | 400 | [68] | |
| Vit B6 | 333 | 393 | [31] | |
| Vit B6 | 328 | 393 | [18] | |
| Vit A | 321 | 412 | [9] | |
| A5 | AGEs | 340–370 | 420–440 | [70] |
| AGEs | 340–370 | 420–470 | [62] | |
| AGEs | 370 | 440 | [71,72,73] | |
| Pentodilysine | 366 | 440 | [77] | |
| NADH | 360 | 460 | [38] | |
| NADH | 340 | 450 | [22] | |
| NADH | 340 | 460 | [37] | |
| A6 | AGEs | 340–370 | 420–440 | [70] |
| AGEs | 350 | 415 | [76] | |
| pyrropyridine | 379 | 455 | [77] | |
| A7 | Rb | 370 | 525 | [78] |
| Rb | 370 | 507 | [13] | |
| A8 | Rb | 380 | 420/520 | [8] |
| Rb | 370 | 490/507 | [13] | |
| A9 | Lumichrome | 450 | 444–479 | [20] |
| A10 | Rb | 450 | 525 | [78] |
| Rb | 450 | 522 | [13] | |
| FADH2 | 450 | 515 | [34] |
A1–A10: areas 1 to 10; Vit A: vitamin A or retinol; Vit B6: vitamin B6 or pyridoxine; Tyr: tyrosine; Trp: tryptophan; AGEs: advanced glycation end products; Rb: riboflavin; FADH2: coenzyme flavin adenine dinucleotide.
Disclaimer/Publisher’s Note: The statements, opinions and data contained in all publications are solely those of the individual author(s) and contributor(s) and not of MDPI and/or the editor(s). MDPI and/or the editor(s) disclaim responsibility for any injury to people or property resulting from any ideas, methods, instructions or products referred to in the content. |
© 2024 by the authors. Licensee MDPI, Basel, Switzerland. This article is an open access article distributed under the terms and conditions of the Creative Commons Attribution (CC BY) license (https://creativecommons.org/licenses/by/4.0/).
Share and Cite
MDPI and ACS Style
Freire, P.; Zamora, A.; Castillo, M. Synchronous Front-Face Fluorescence Spectra: A Review of Milk Fluorophores. Foods 2024, 13, 812. https://doi.org/10.3390/foods13050812
AMA Style
Freire P, Zamora A, Castillo M. Synchronous Front-Face Fluorescence Spectra: A Review of Milk Fluorophores. Foods. 2024; 13(5):812. https://doi.org/10.3390/foods13050812
Chicago/Turabian StyleFreire, Paulina, Anna Zamora, and Manuel Castillo. 2024. "Synchronous Front-Face Fluorescence Spectra: A Review of Milk Fluorophores" Foods 13, no. 5: 812. https://doi.org/10.3390/foods13050812
Note that from the first issue of 2016, this journal uses article numbers instead of page numbers. See further details here.