
Comprehensive Evaluation of Ten Actinidia arguta Wines Based on Color, Organic Acids, Volatile Compounds, and Quantitative Descriptive Analysis

 ,
,
Abstract
:1. Introduction
2. Materials and Methods
2.1. Materials and Reagents
2.1.1. Sample Preparation
2.1.2. Reagents
2.2. Instrumentation and Equipment
2.3. Methodology
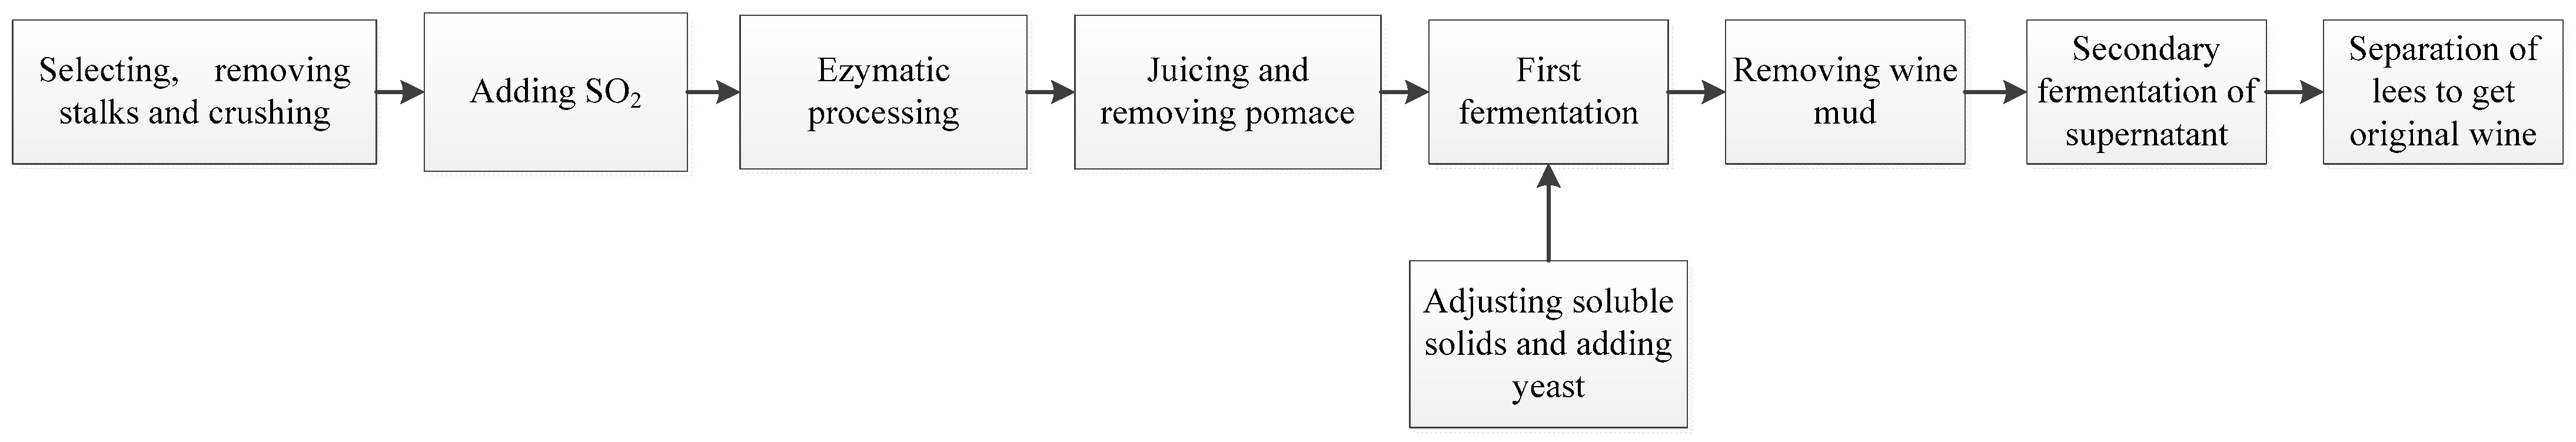
2.3.1. Winemaking
Fermentation Flow
Process Stages
- (1)
- Selecting: Selection of high-quality A. arguta fruit with uniform ripeness, free of pests and diseases, and free of deterioration for processing.
- (2)
- Crushing: We used artificial crushing, causing the fruit to break evenly and added potassium metabisulfite at 0.1 g/L. (Potassium metabisulfite was dissolved with a small amount of distilled water and then added). The crushed fruit was stirred well and then rested for 30 min.
- (3)
- Enzymatic processing: To improve the juice yield of A. arguta, pectinase was added at 0.1–1%, and the enzyme treatment was carried out at room temperature for 12–24 h. The enzyme was used in the treatment of A. arguta.
- (4)
- Juicing: The enzymatically processed pulp was pressed to extract the A. arguta juice.
- (5)
- Adjusting soluble solids: We measured the soluble solid content of the A. arguta juice, calculated the amount of added sugar according to the formula below, and adjusted the soluble solid level to 20° Brix.
- (1)
- Activated yeast: Yeast was added to 5% warm sugar water and placed in a 37 °C constant-temperature water bath for 20 min with stirring to facilitate activation. The activation was complete after foam was abundant.
- (2)
- First fermentation: The A. arguta juice was added to a 20 L fermenter, and the amount added was not more than 2/3 of the volume of the fermenter. The activated yeast was added at 250 mg/L and stirred well. Three parallel groups were established for each treatment. Fermentation was carried out at (18 ± 2) °C for 7 days. During the fermentation period, the mash was stirred 1–2 times a day, and changes in soluble solids were monitored. At the end of fermentation, the bottom of the mash was removed.
- (3)
- Secondary fermentation: The filtered fermentation juice was placed in an airtight chamber at 15 °C for one month for post-fermentation.
2.3.2. Measurement of Basic Physicochemical Indicators
2.3.3. Measurement of Color
2.3.4. Measurement of Organic Acids
2.3.5. Measurement of Volatile Composition
2.3.6. Odor Activity Value (OAV) Calculation
2.4. Sensory Evaluation
2.5. Statistical Analysis
3. Results and Discussion
3.1. Basic Physicochemical Indicators Analysis
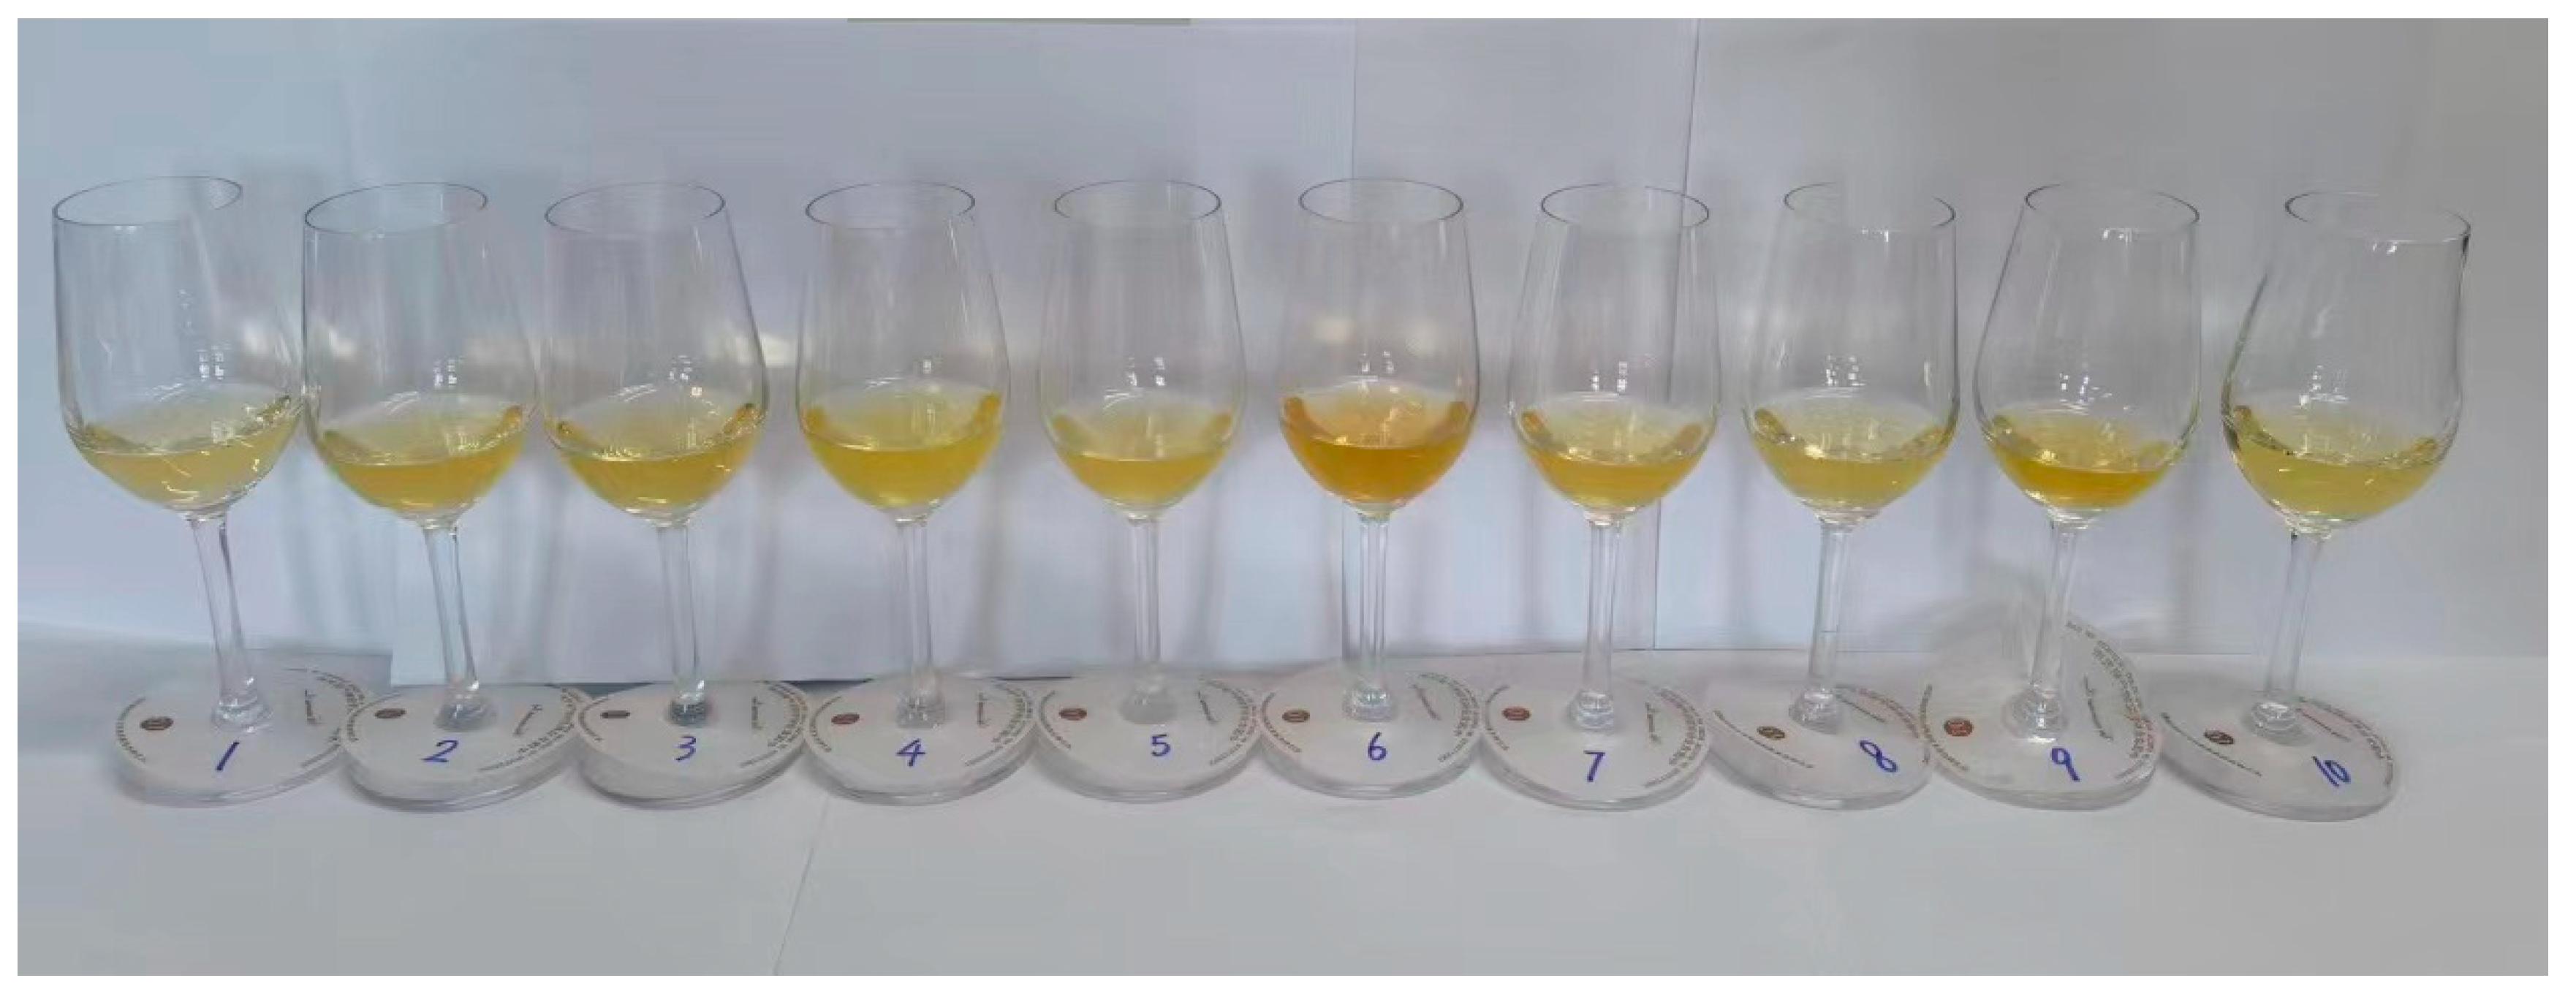
3.2. CIELab Parameters Analysis
3.3. Organic Acids Analysis
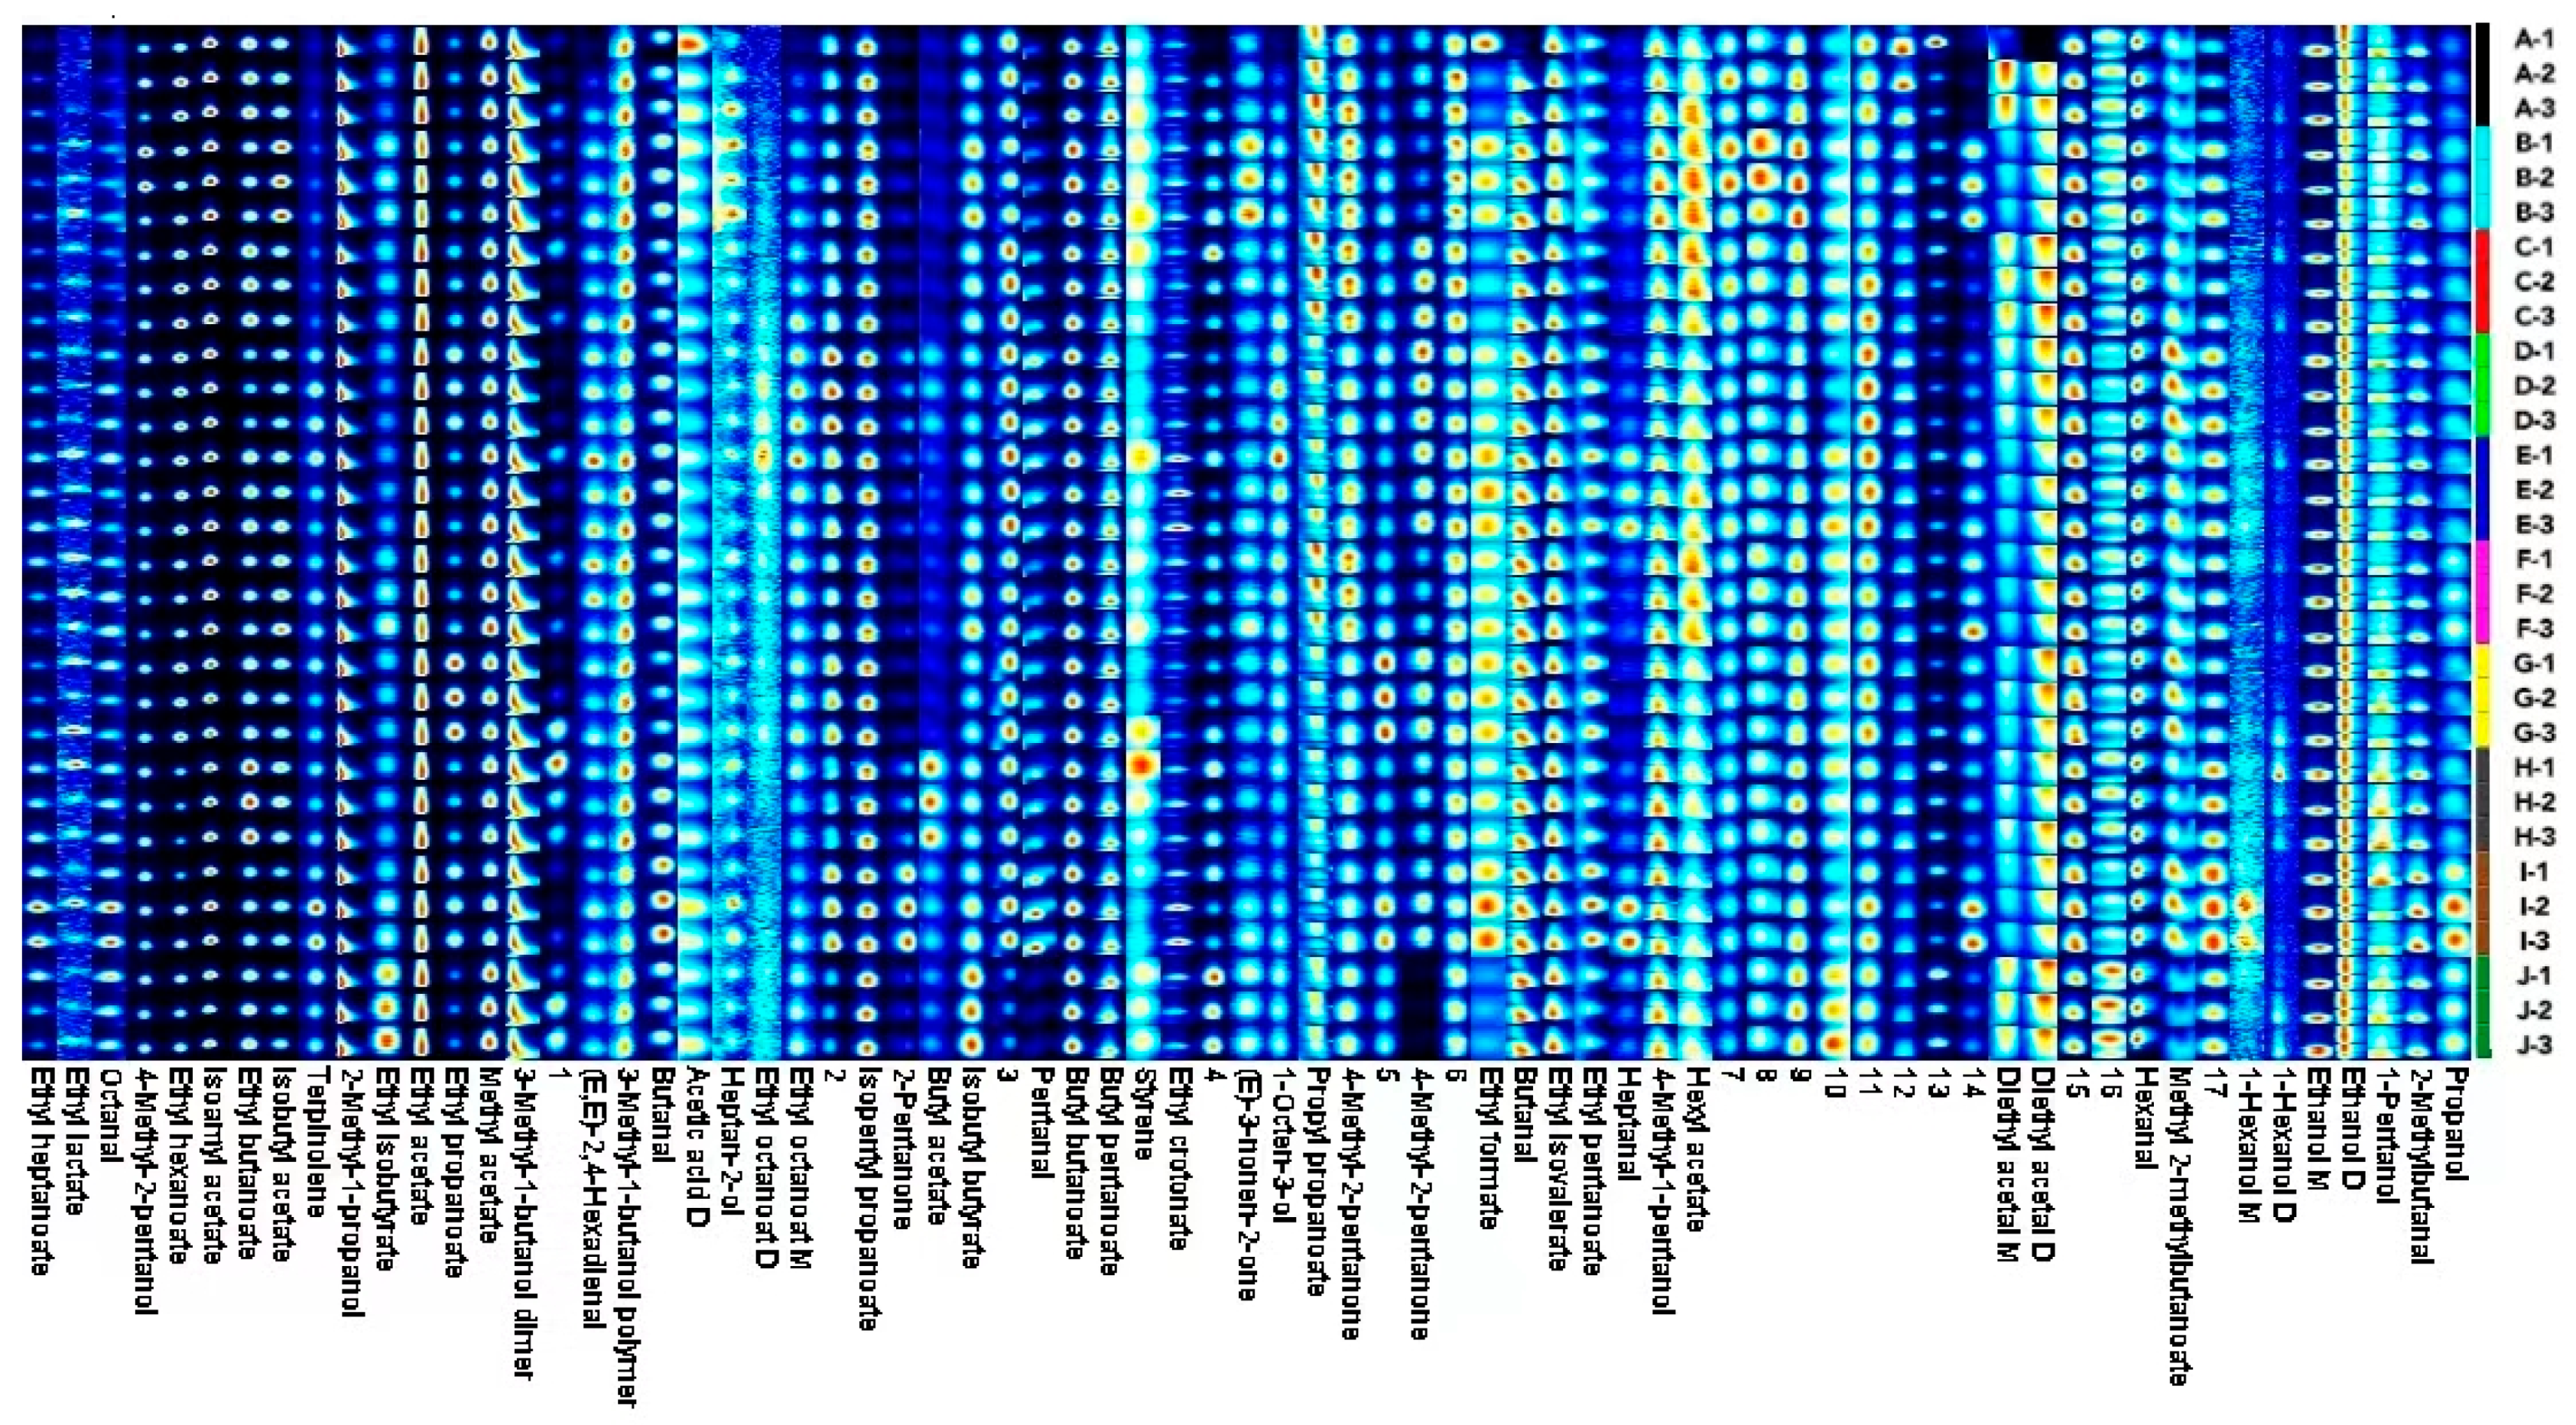
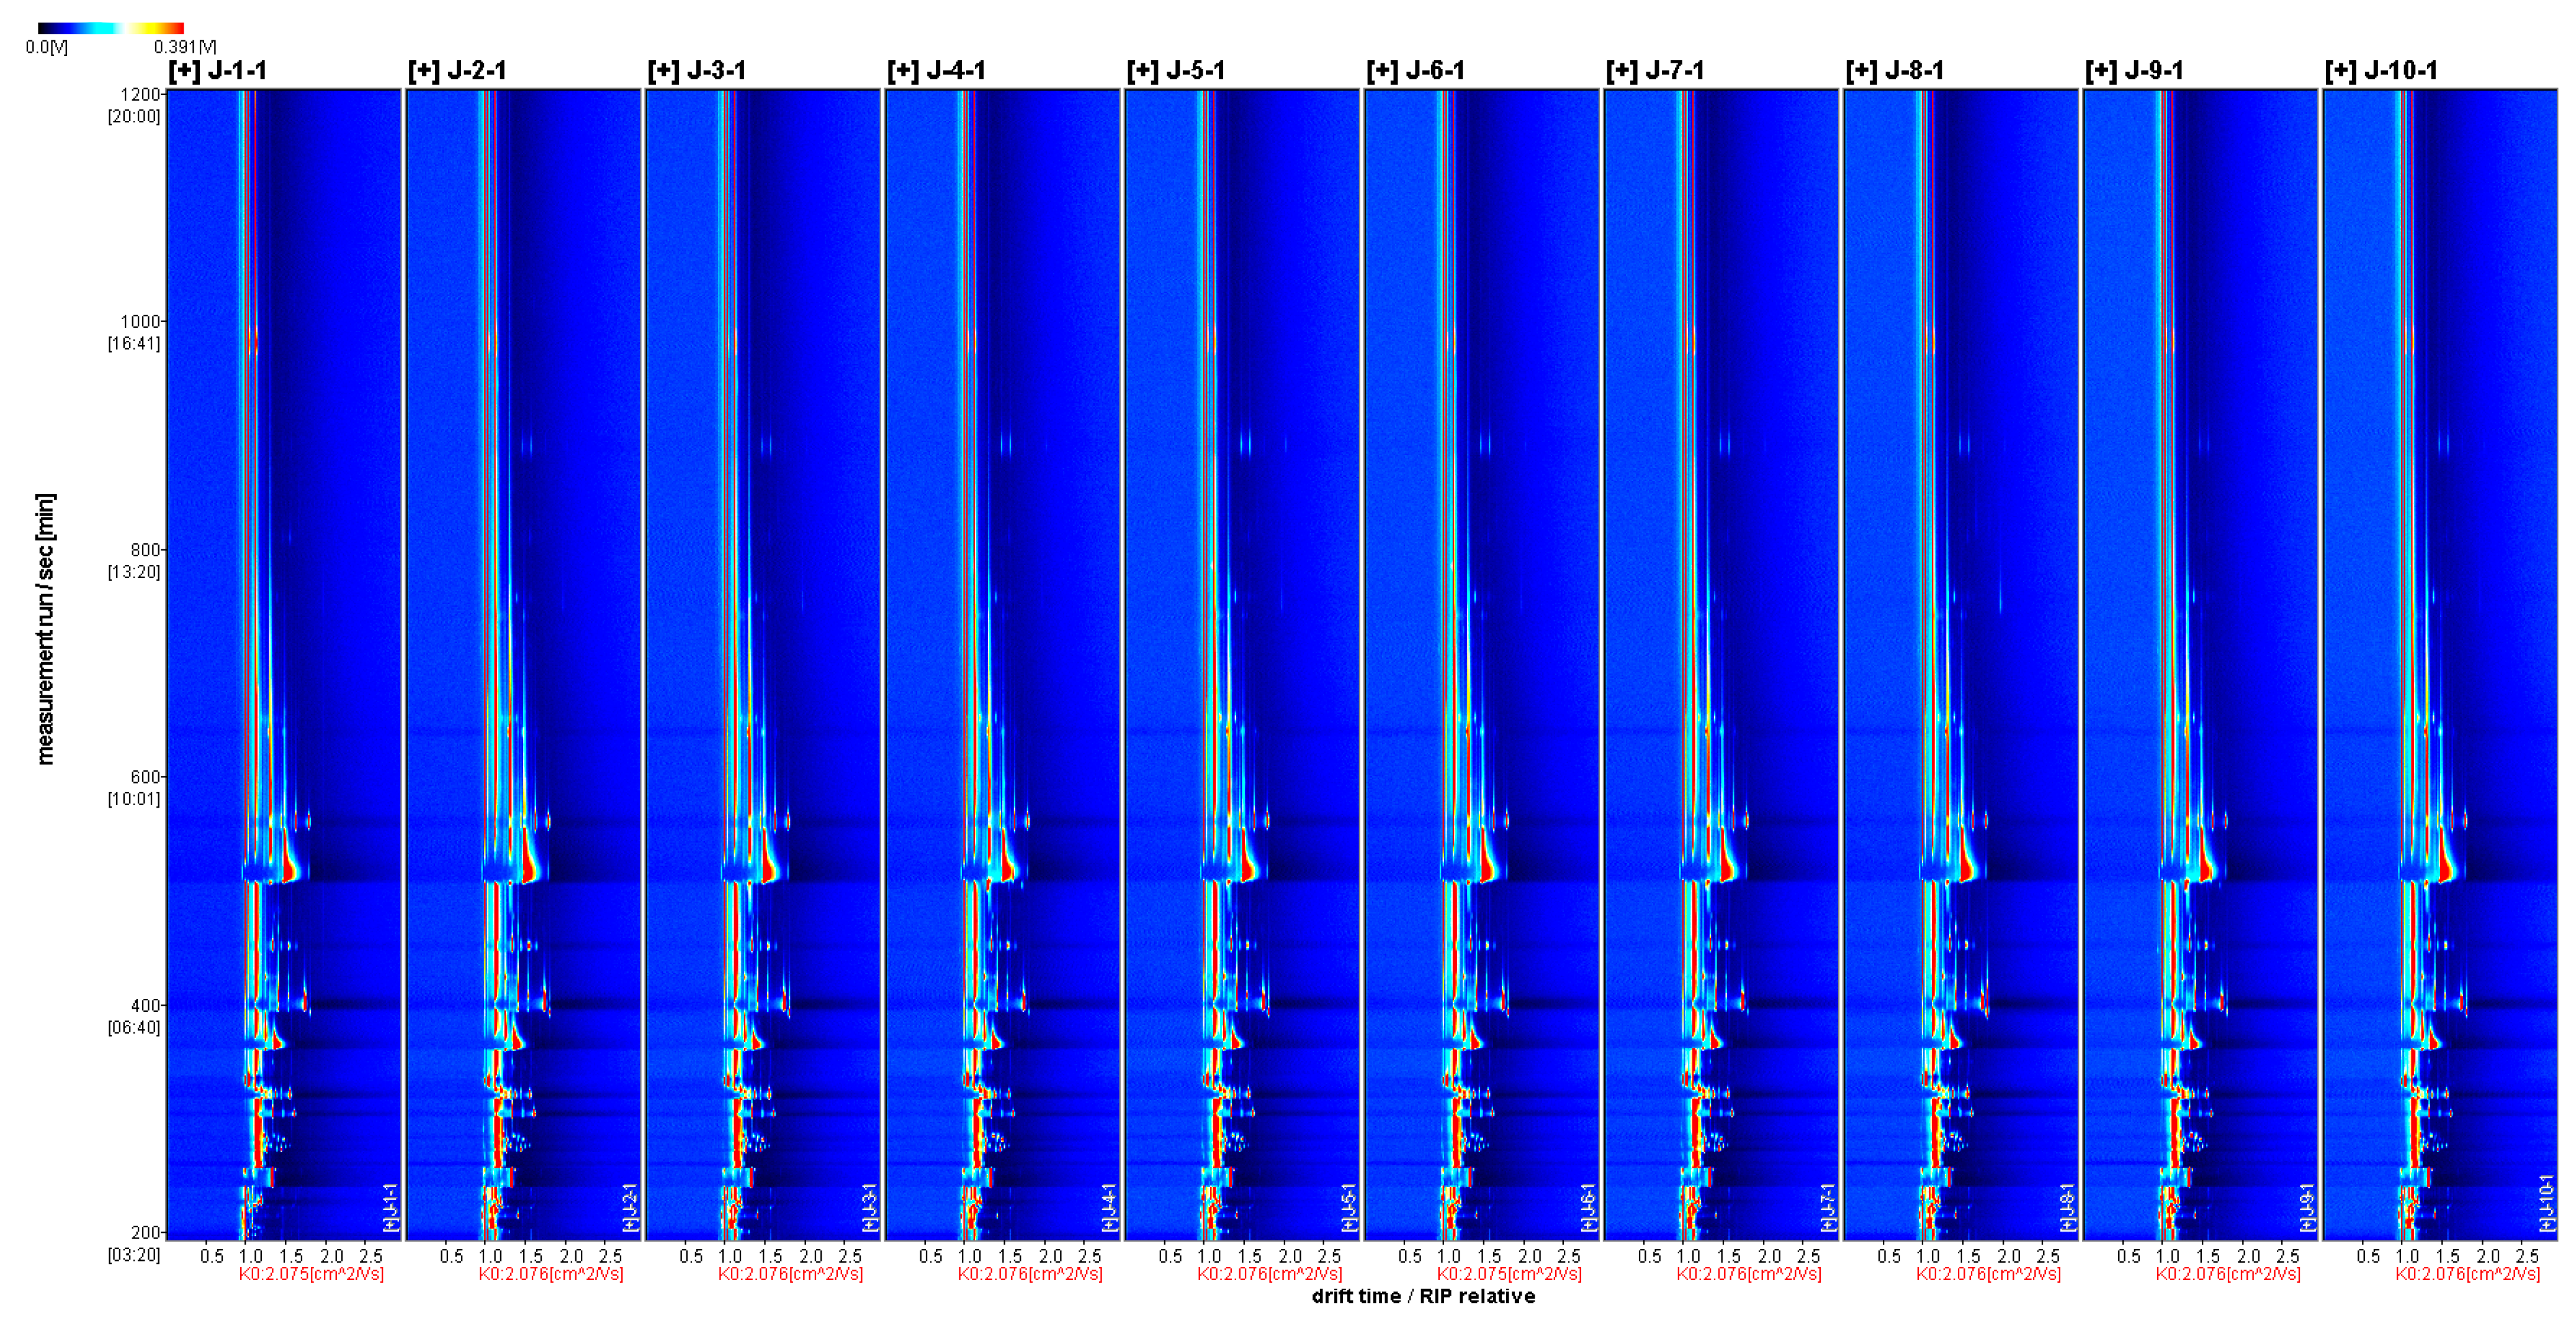
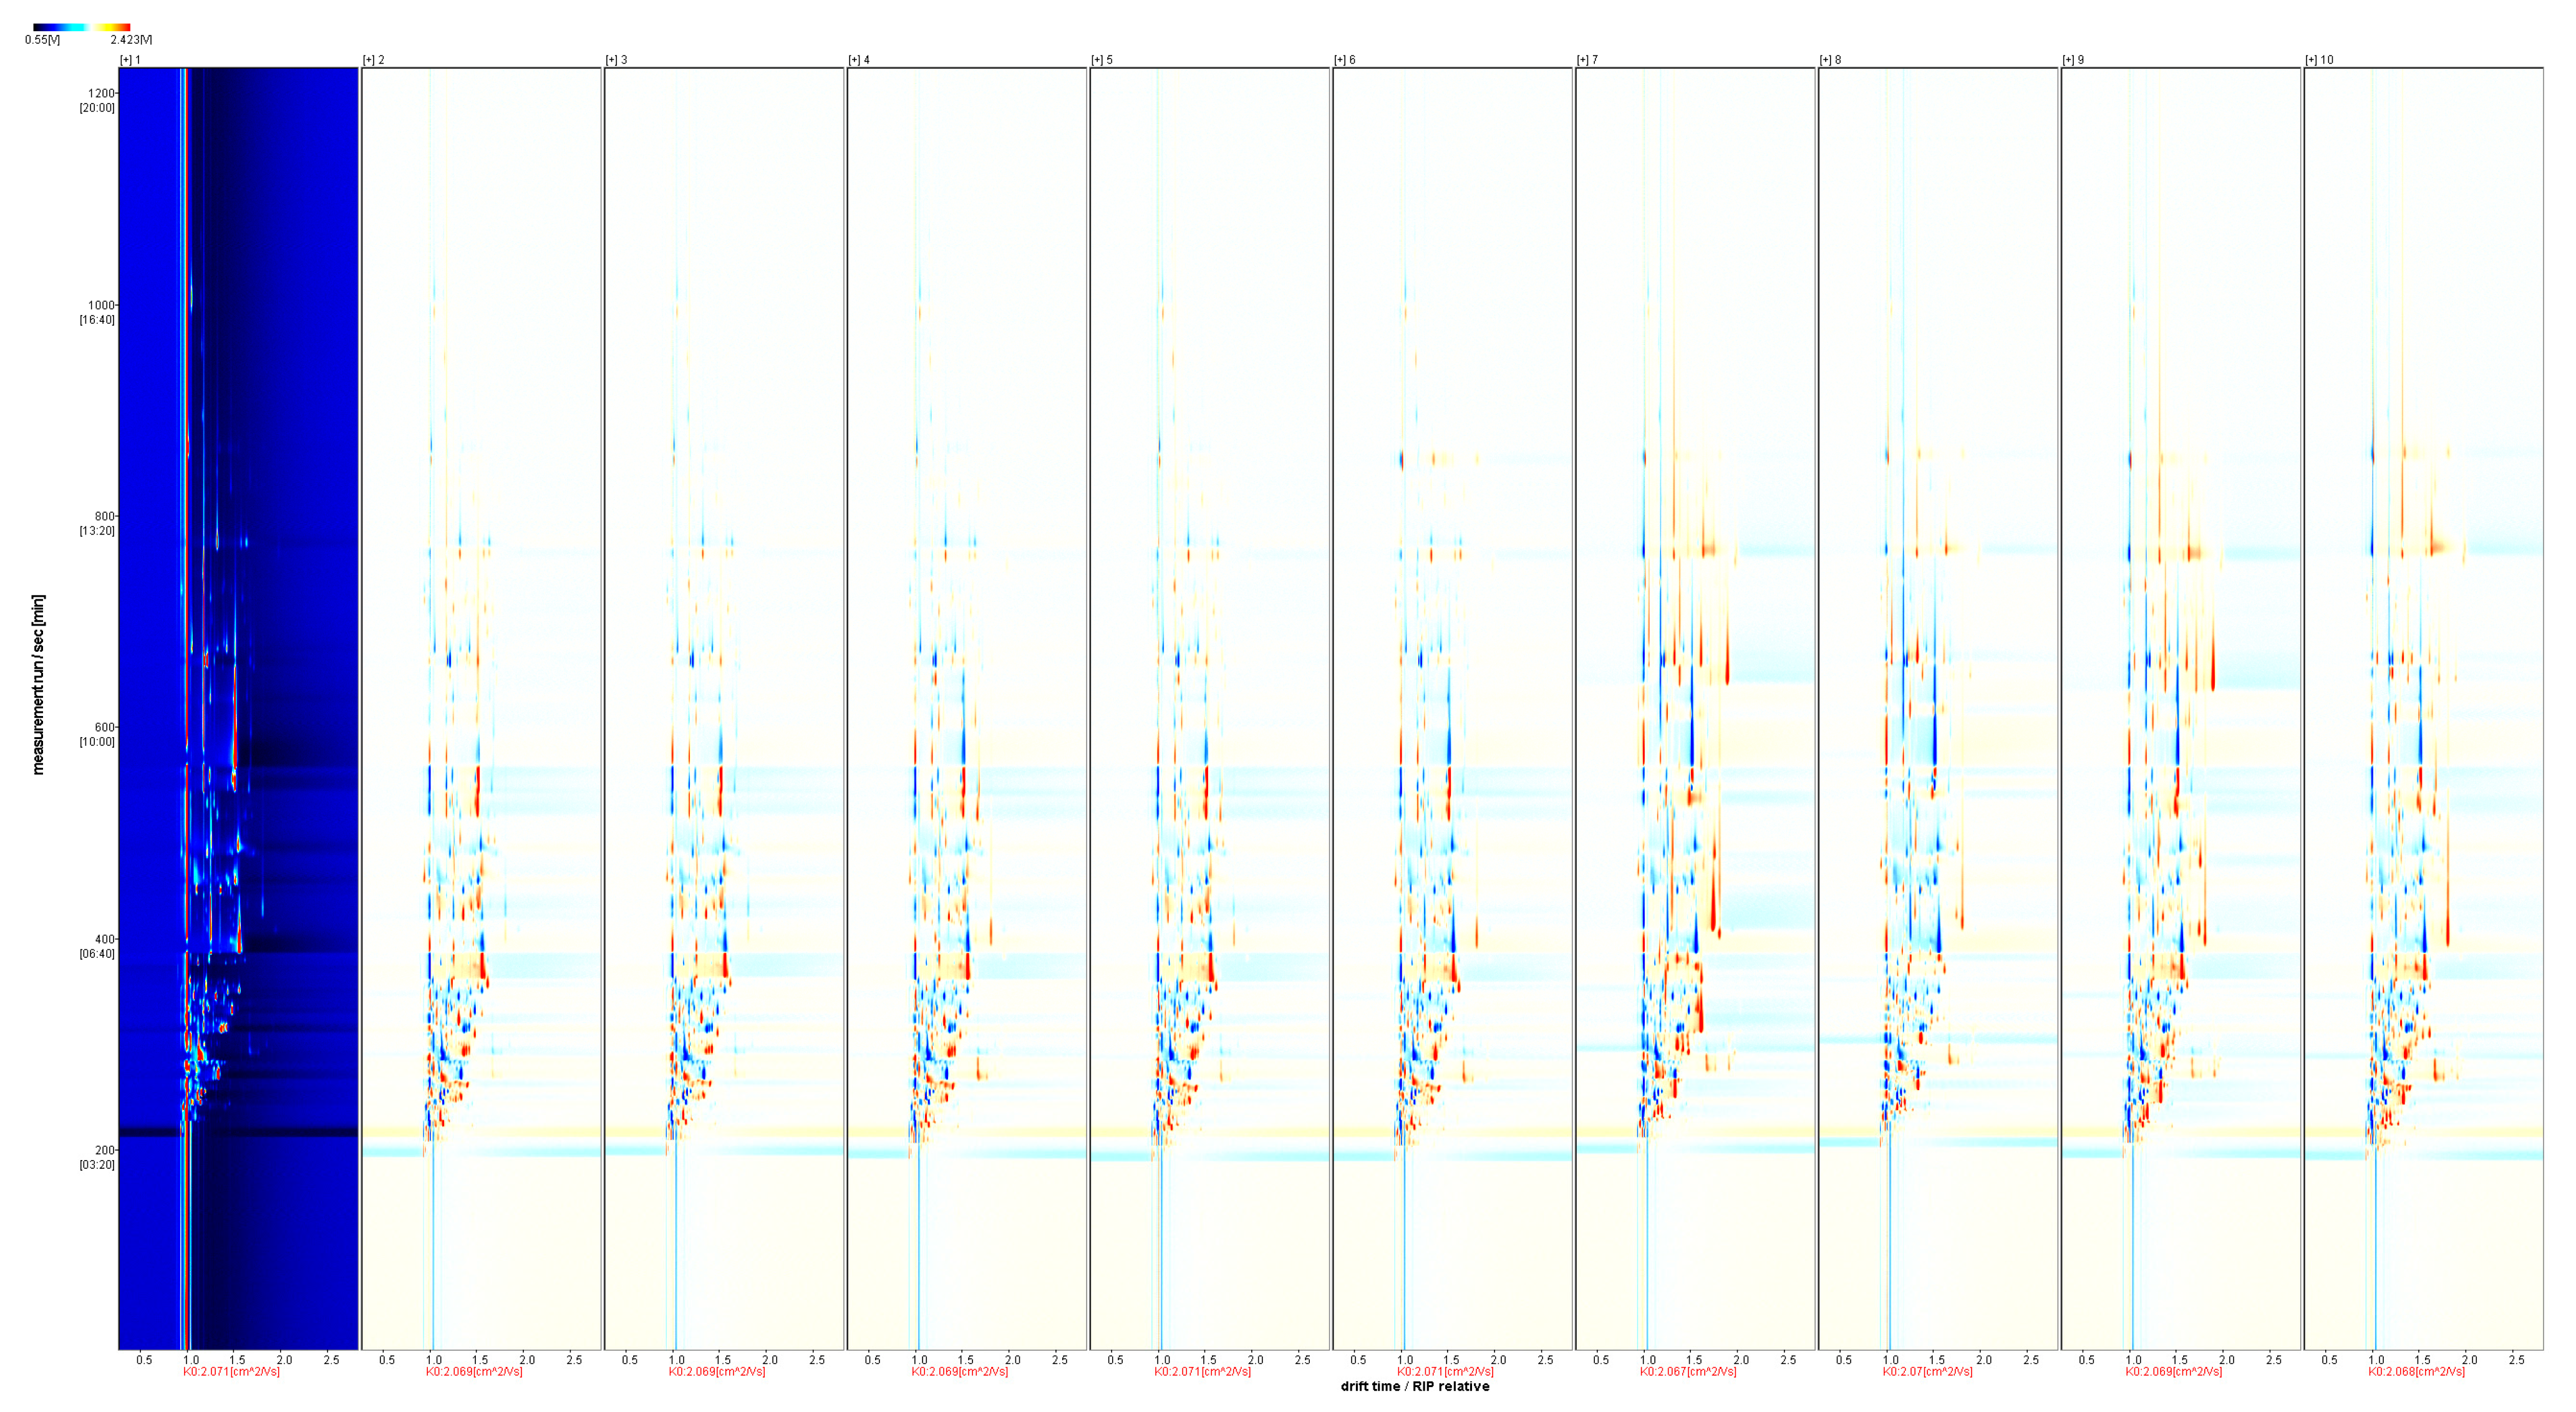
3.4. HS-GC-IMS Analysis of Different A. arguta Wines
3.5. Analysis of the Differences in the Volatile Compositions of Different A. arguta Wines
3.5.1. Alcohols
3.5.2. Esters
3.5.3. Aldehydes
3.5.4. Ketones
3.5.5. Acids
3.5.6. Terpenoids
3.6. Multivariate Statistical Analysis
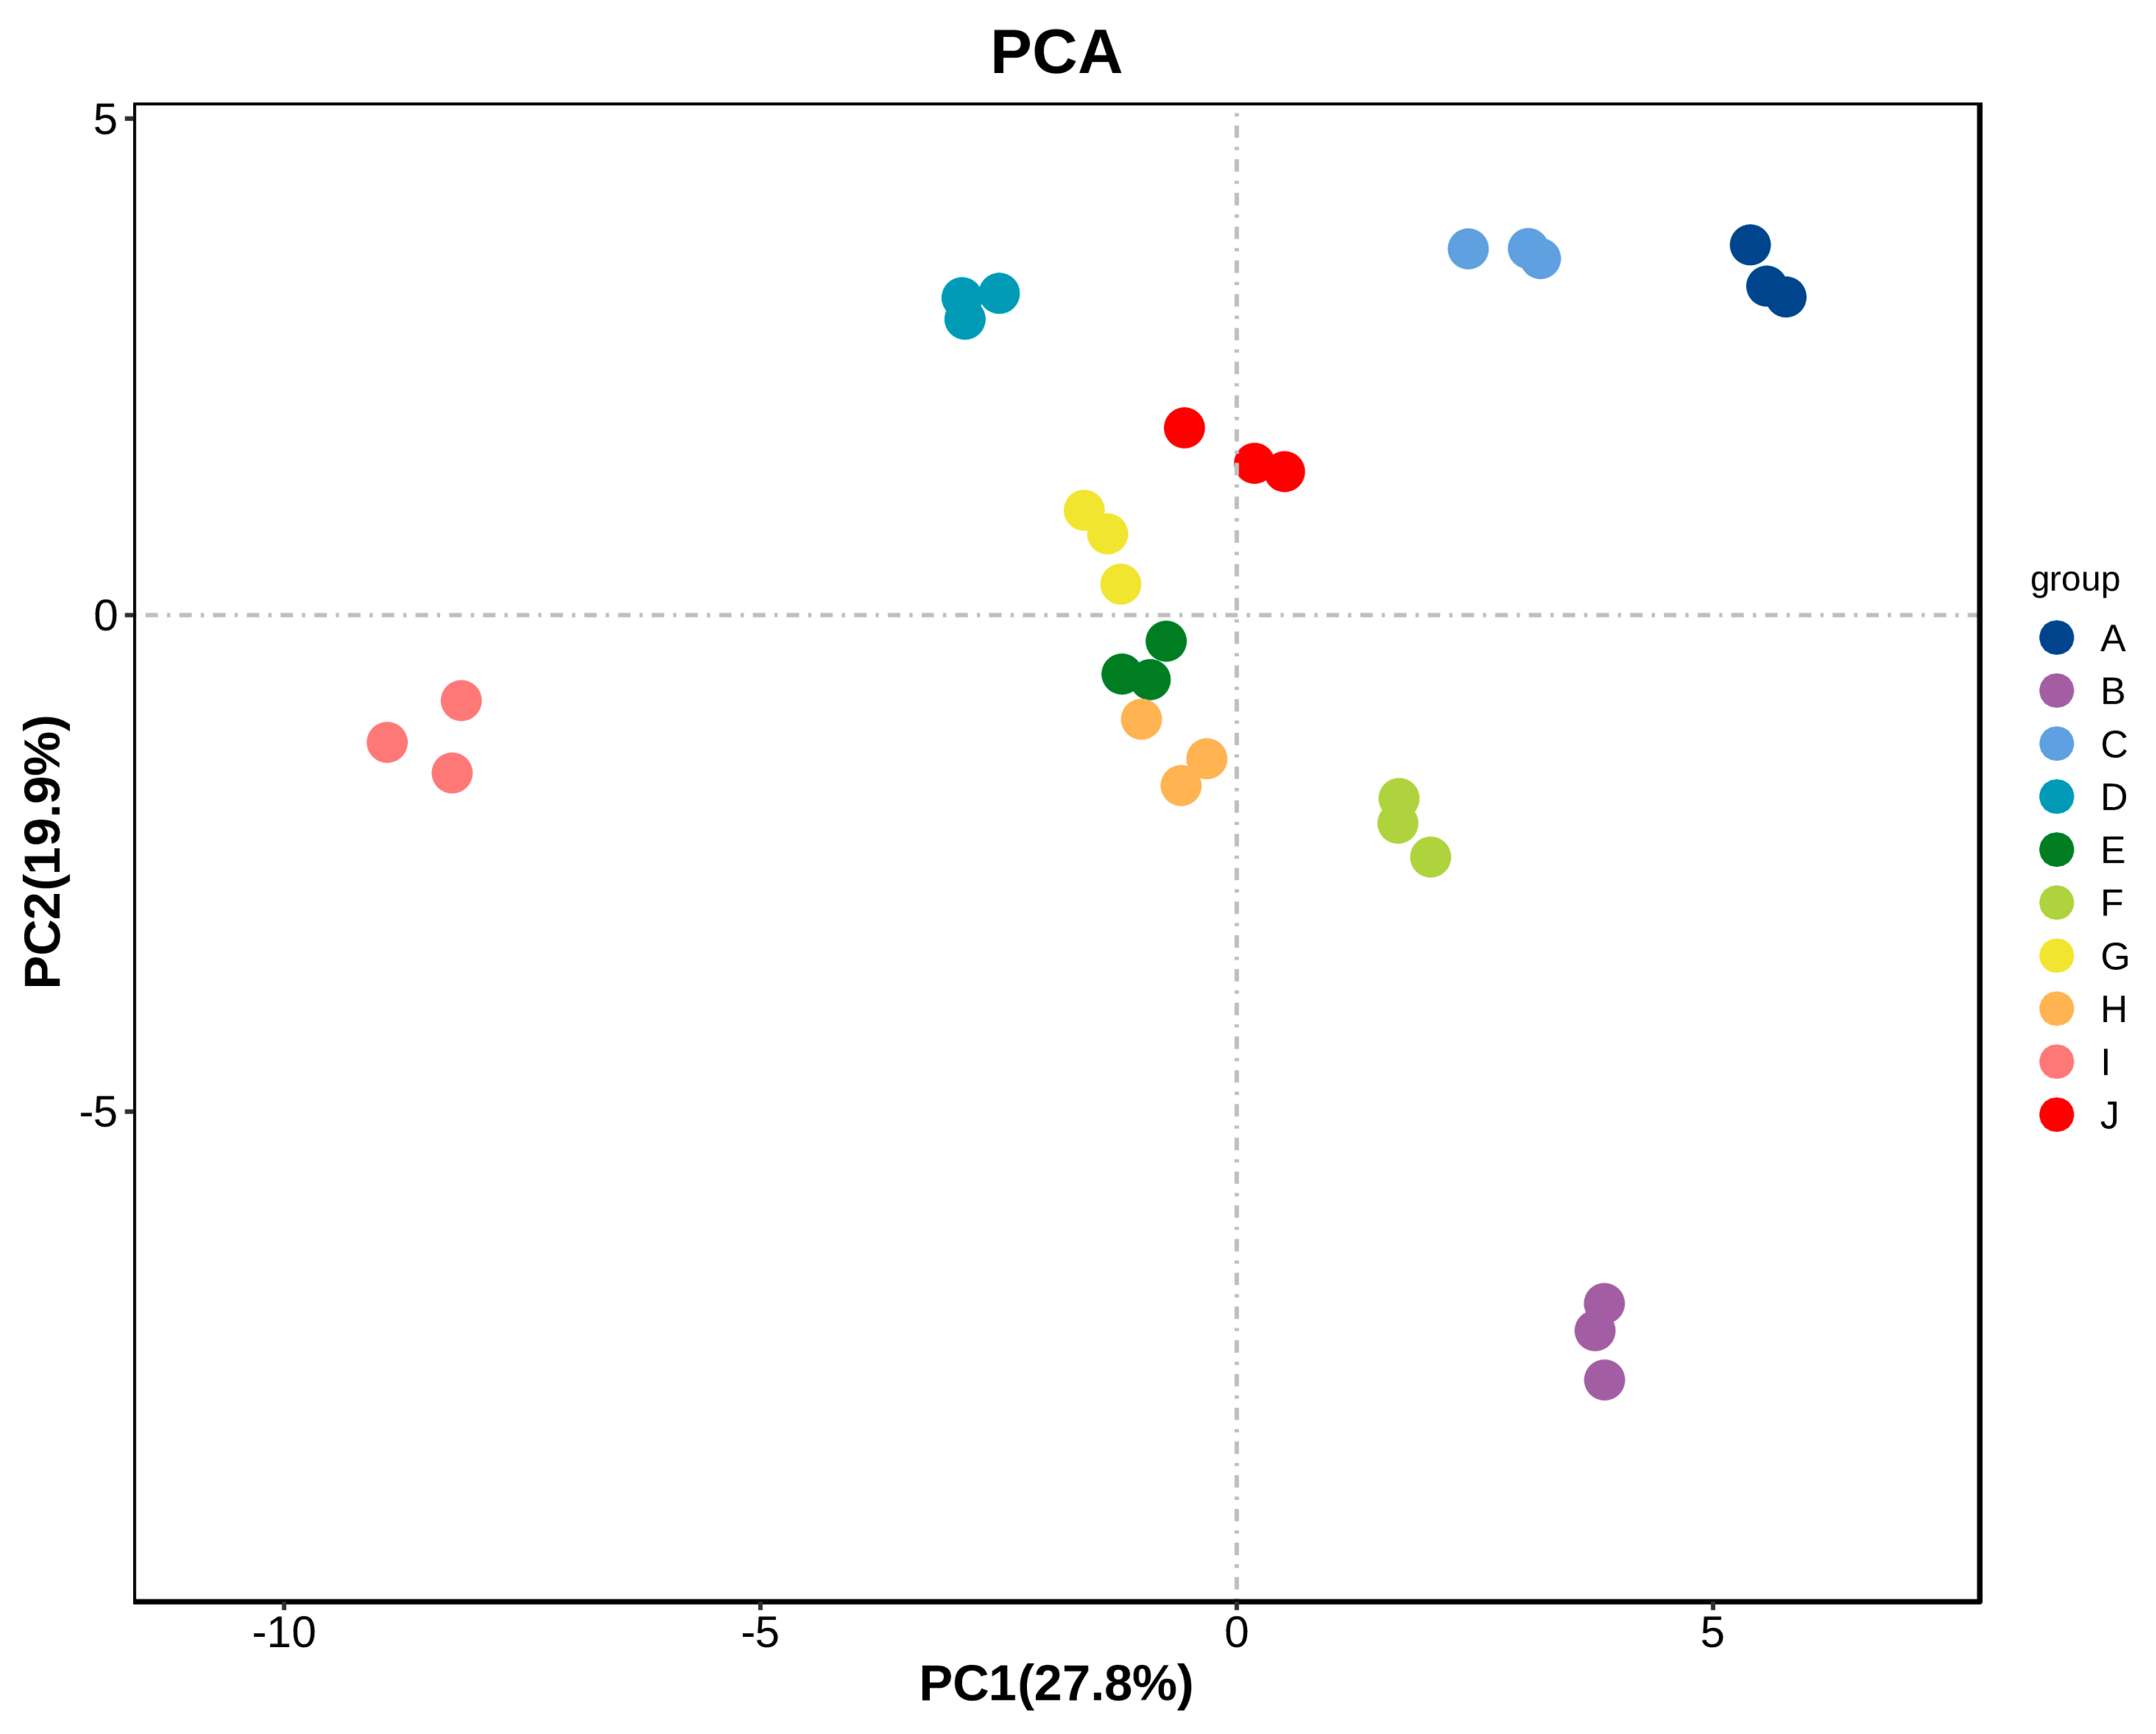
3.6.1. Principal Component Analysis (PCA)
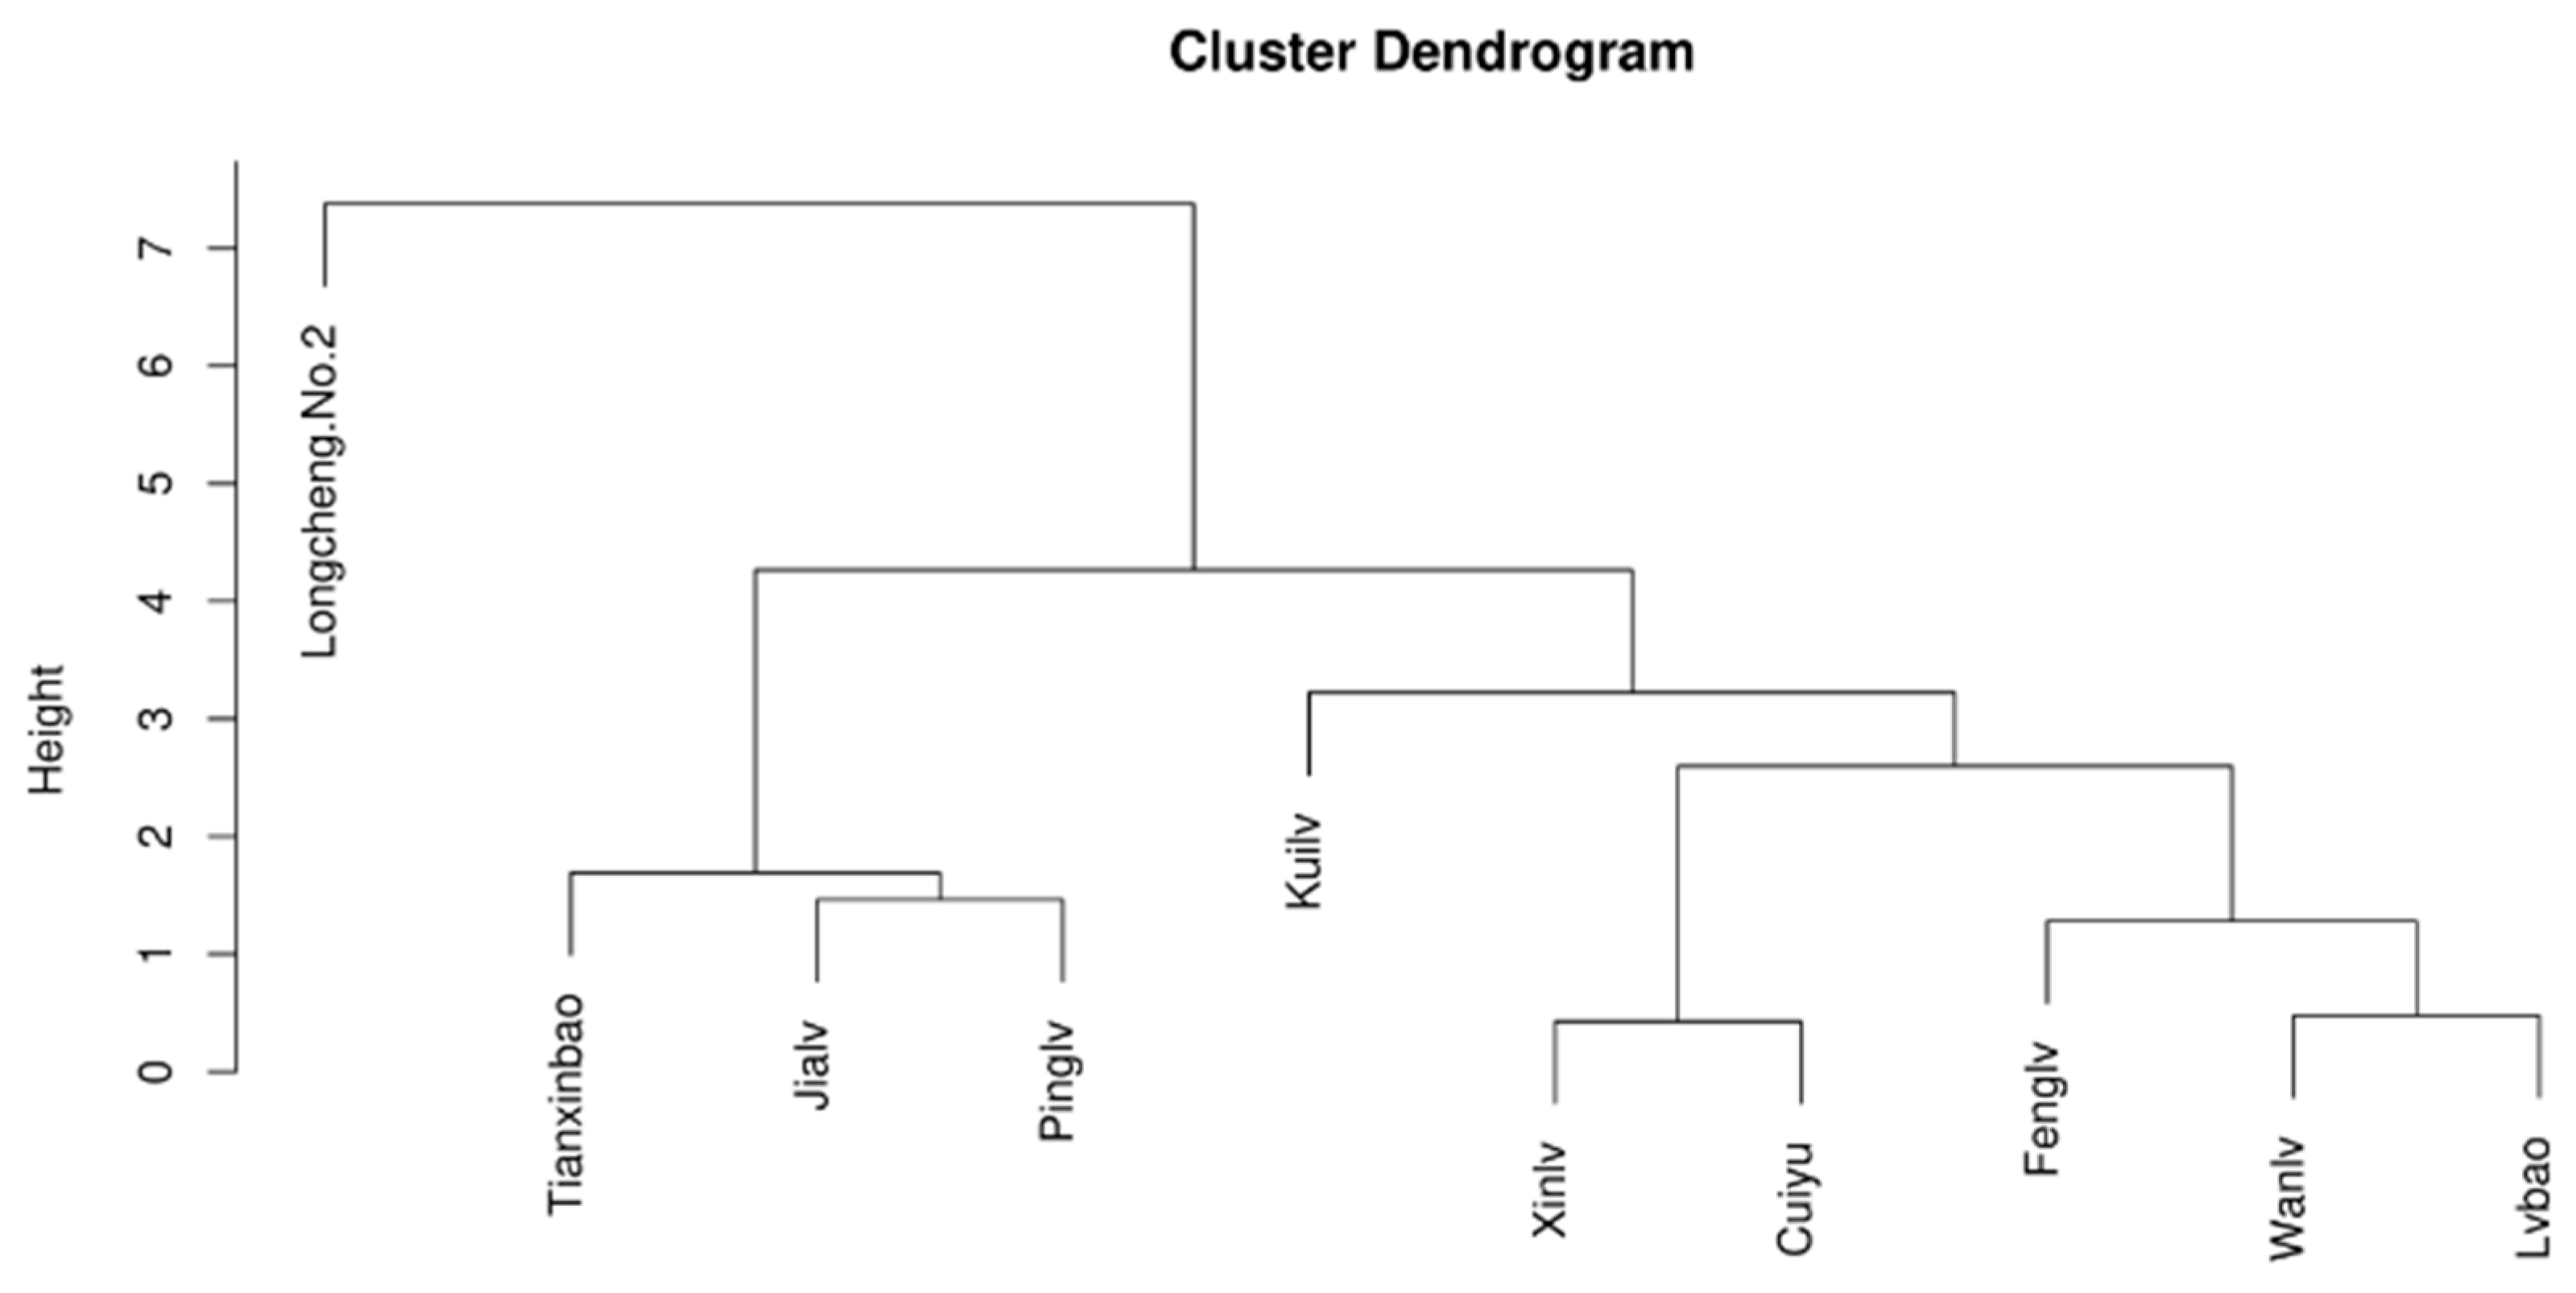
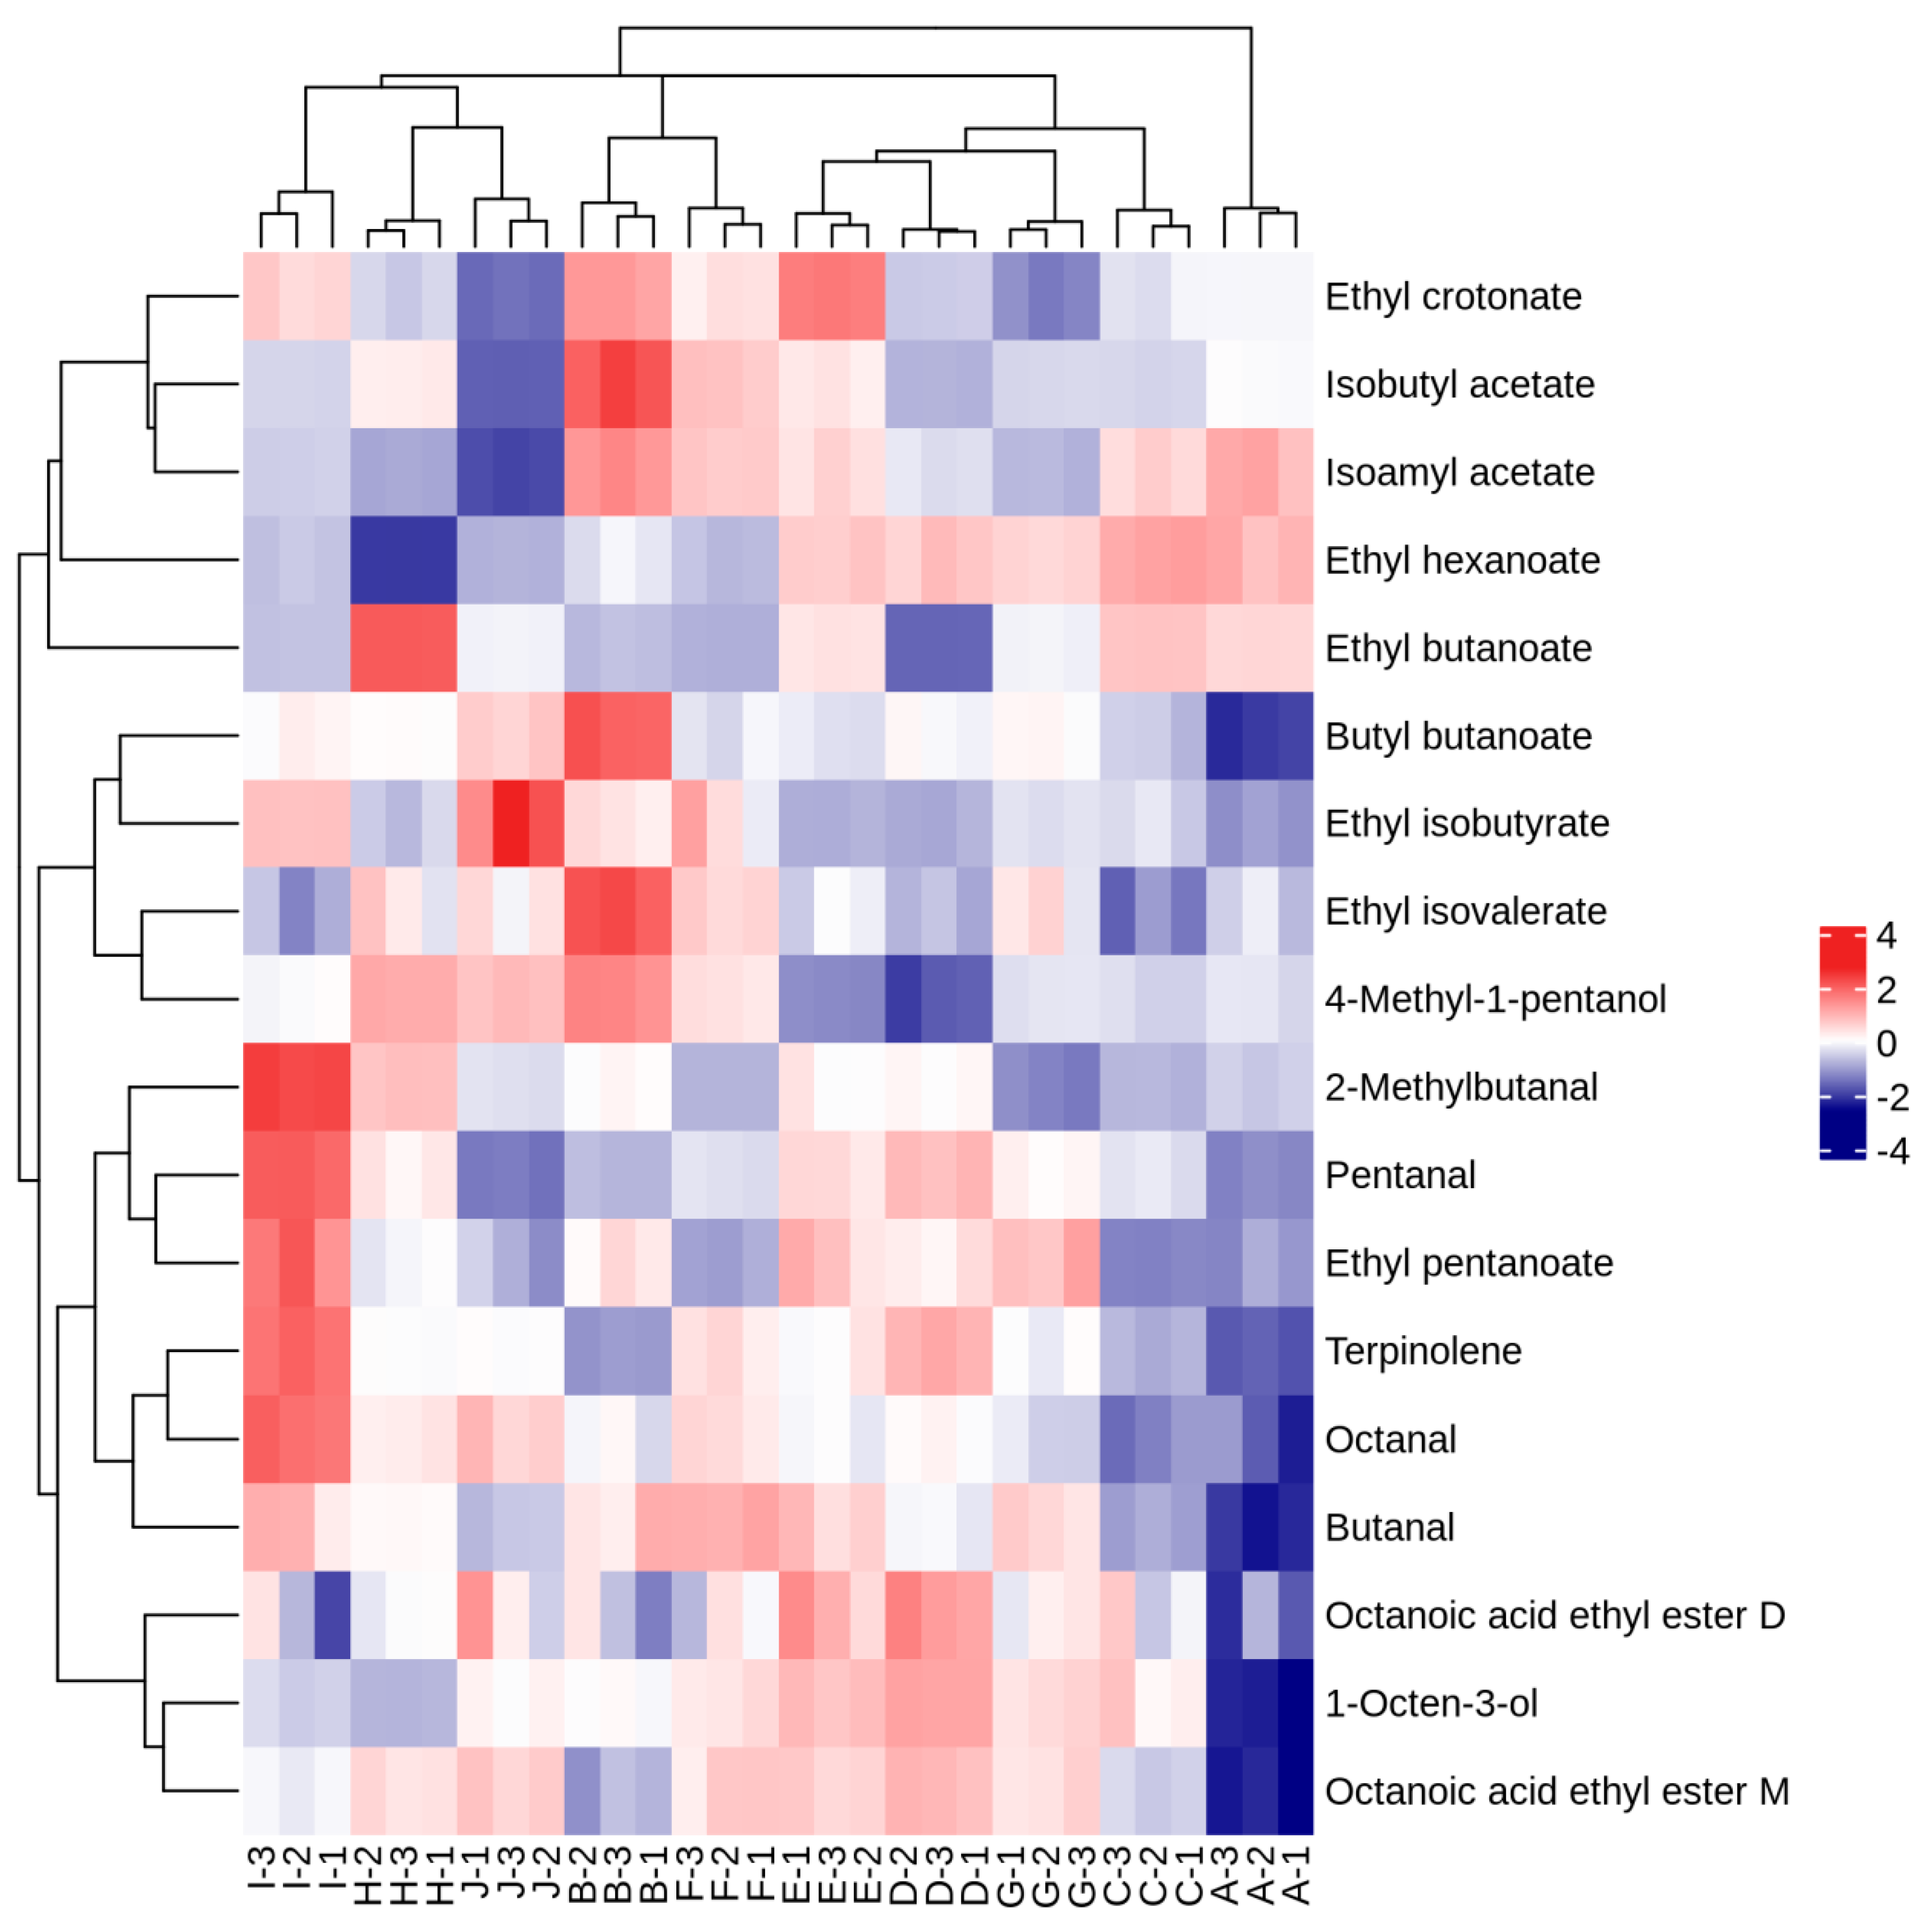
3.6.2. Hierarchical Cluster Analysis
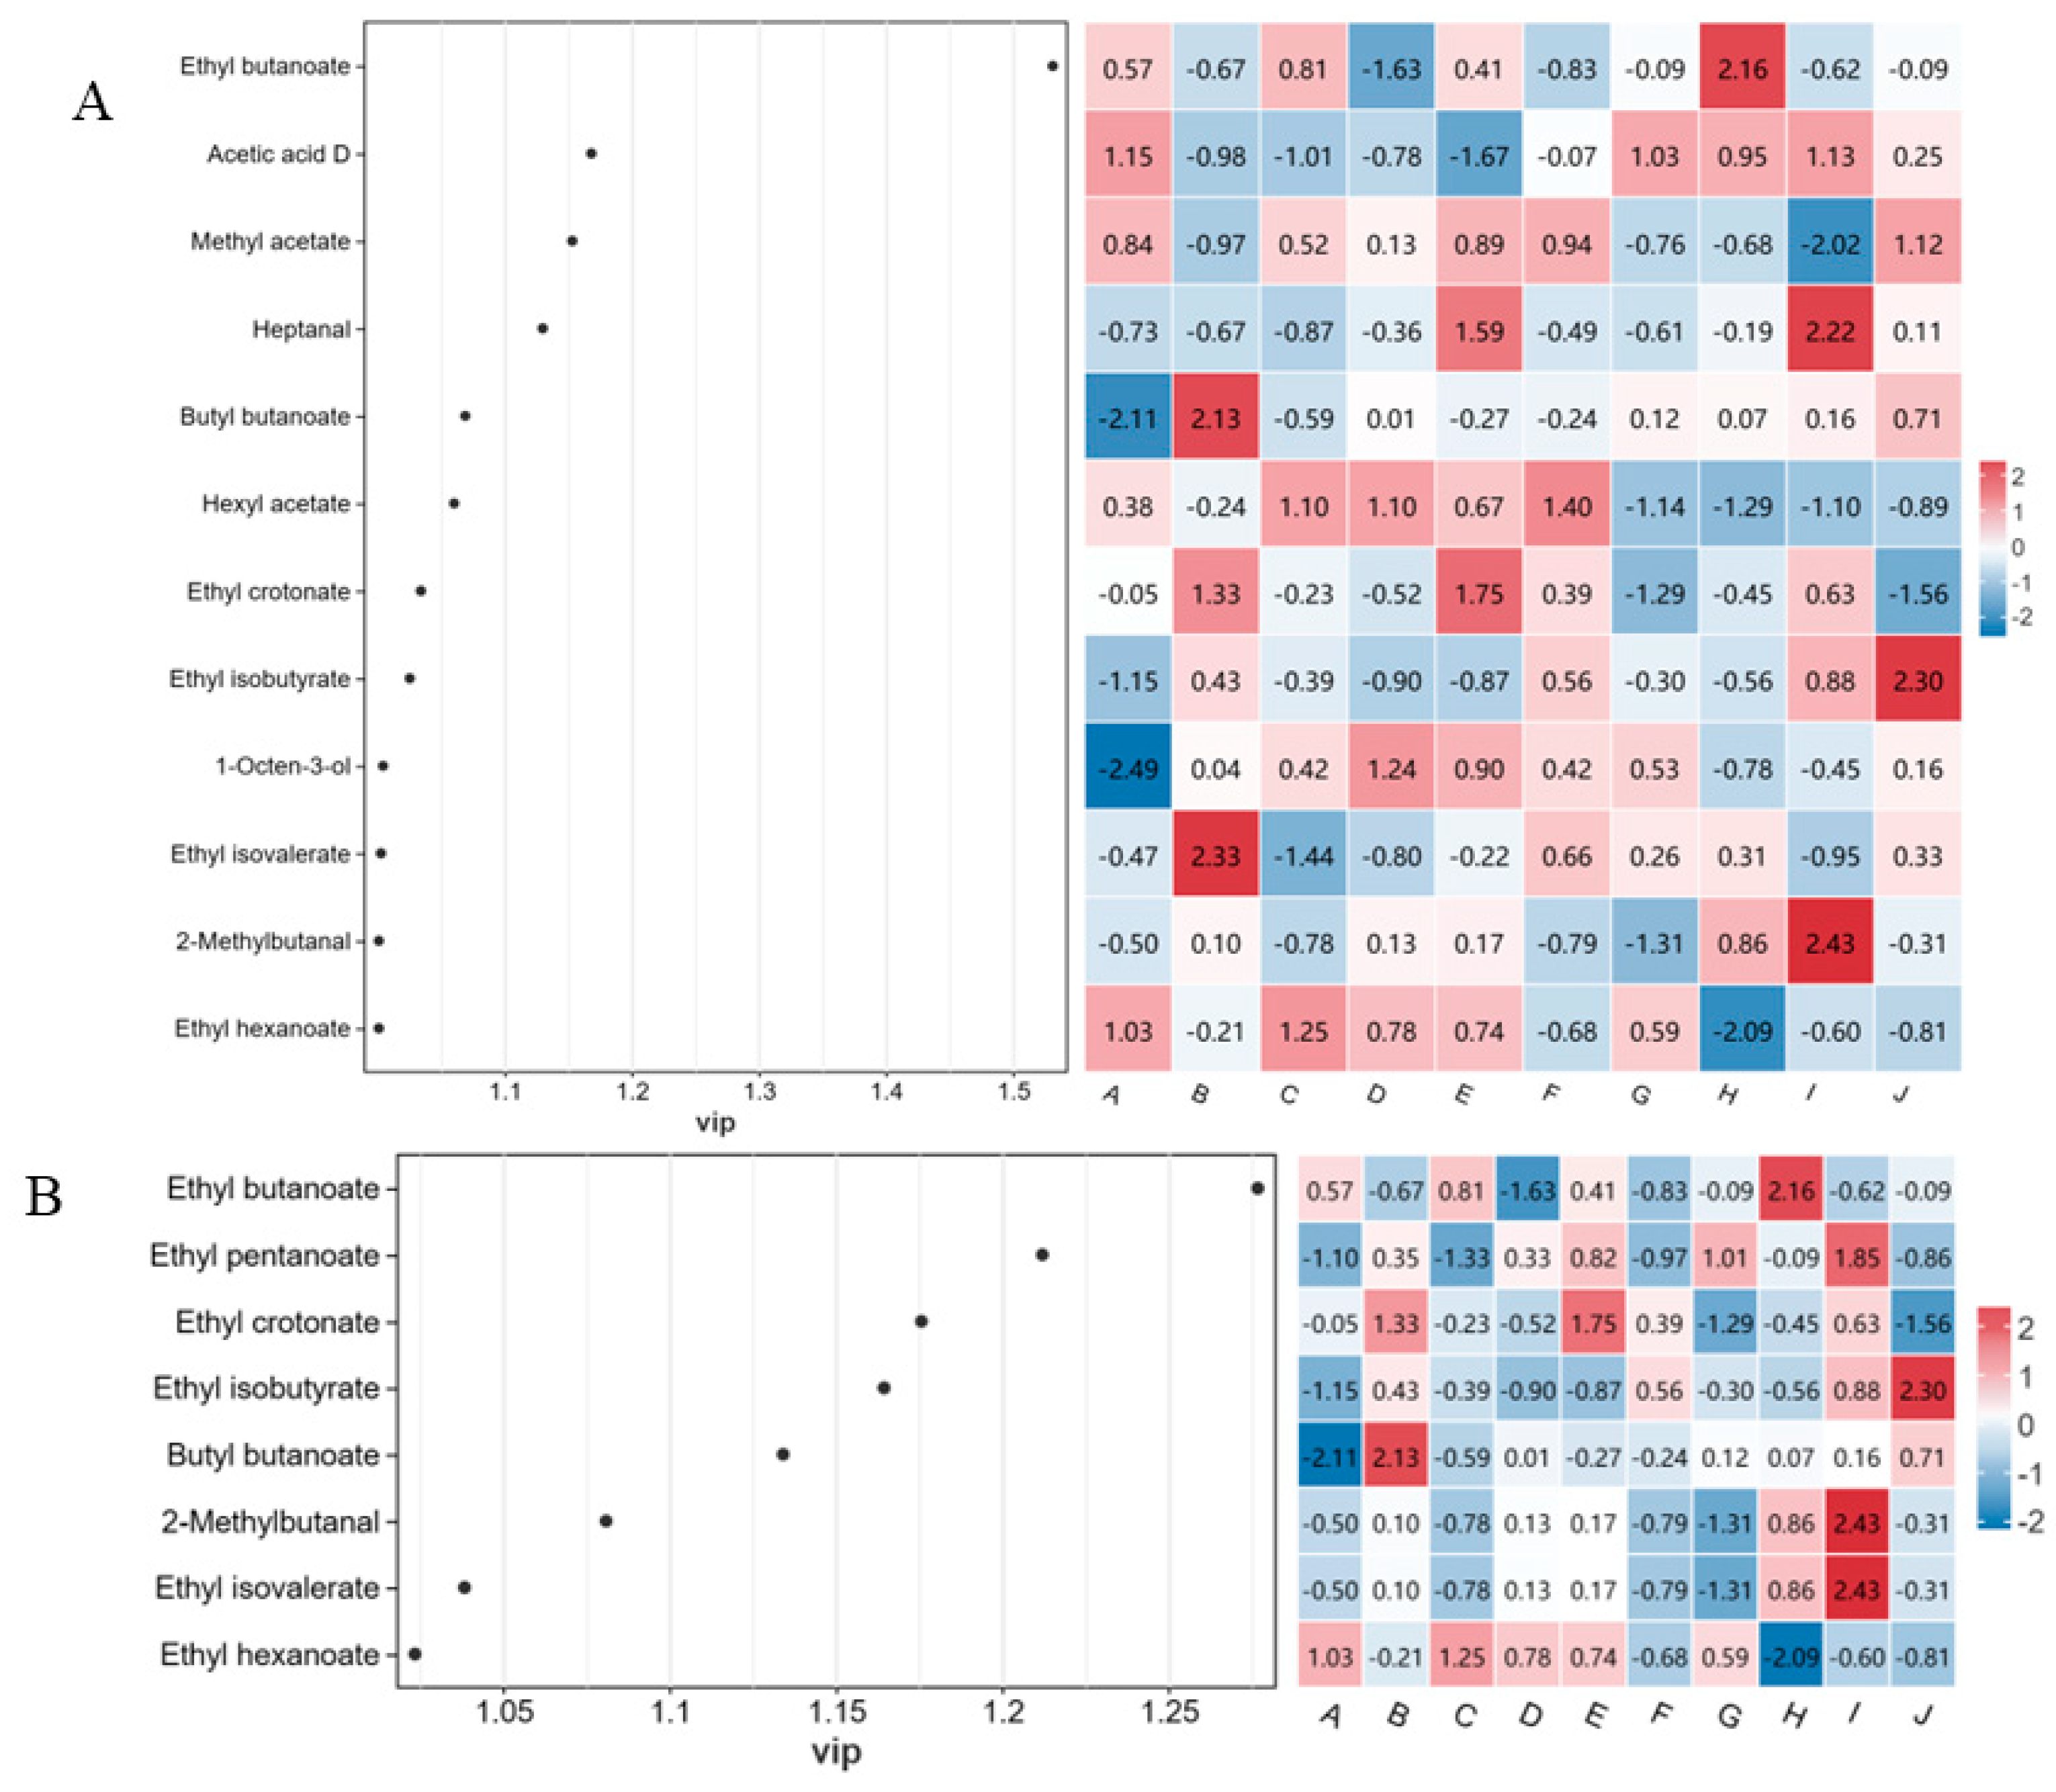
3.6.3. OPLS-DA Analysis
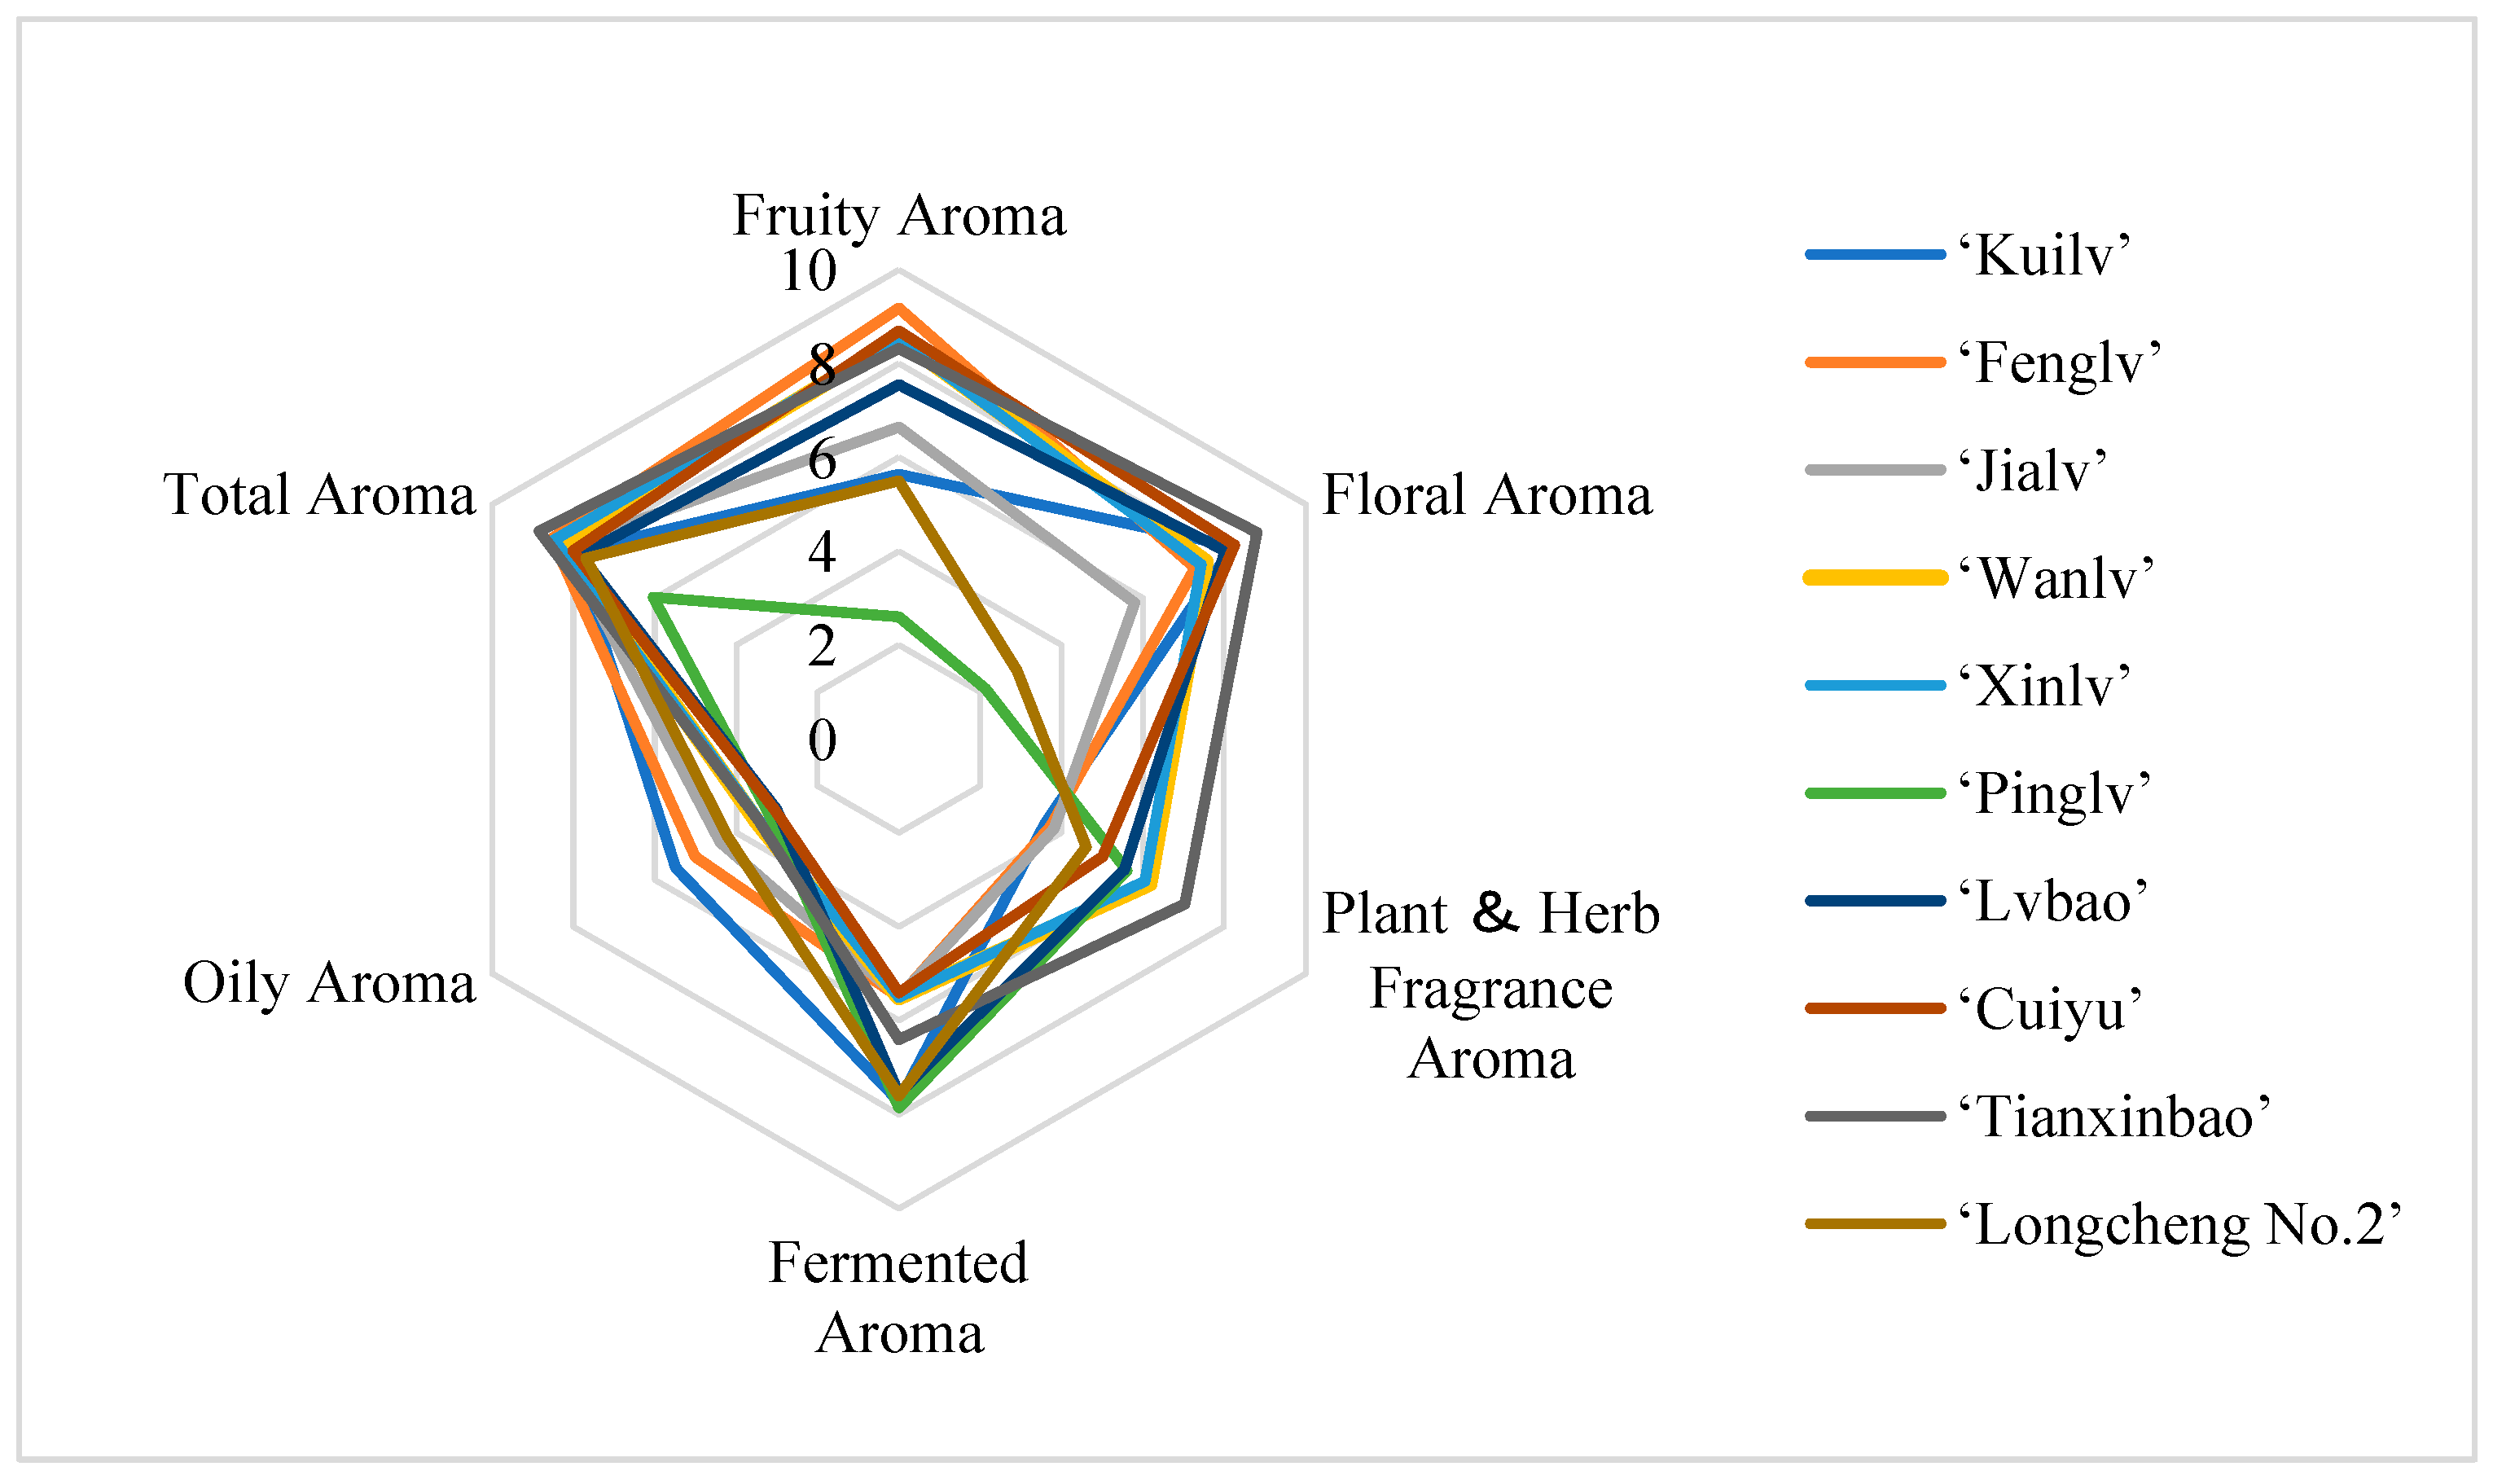
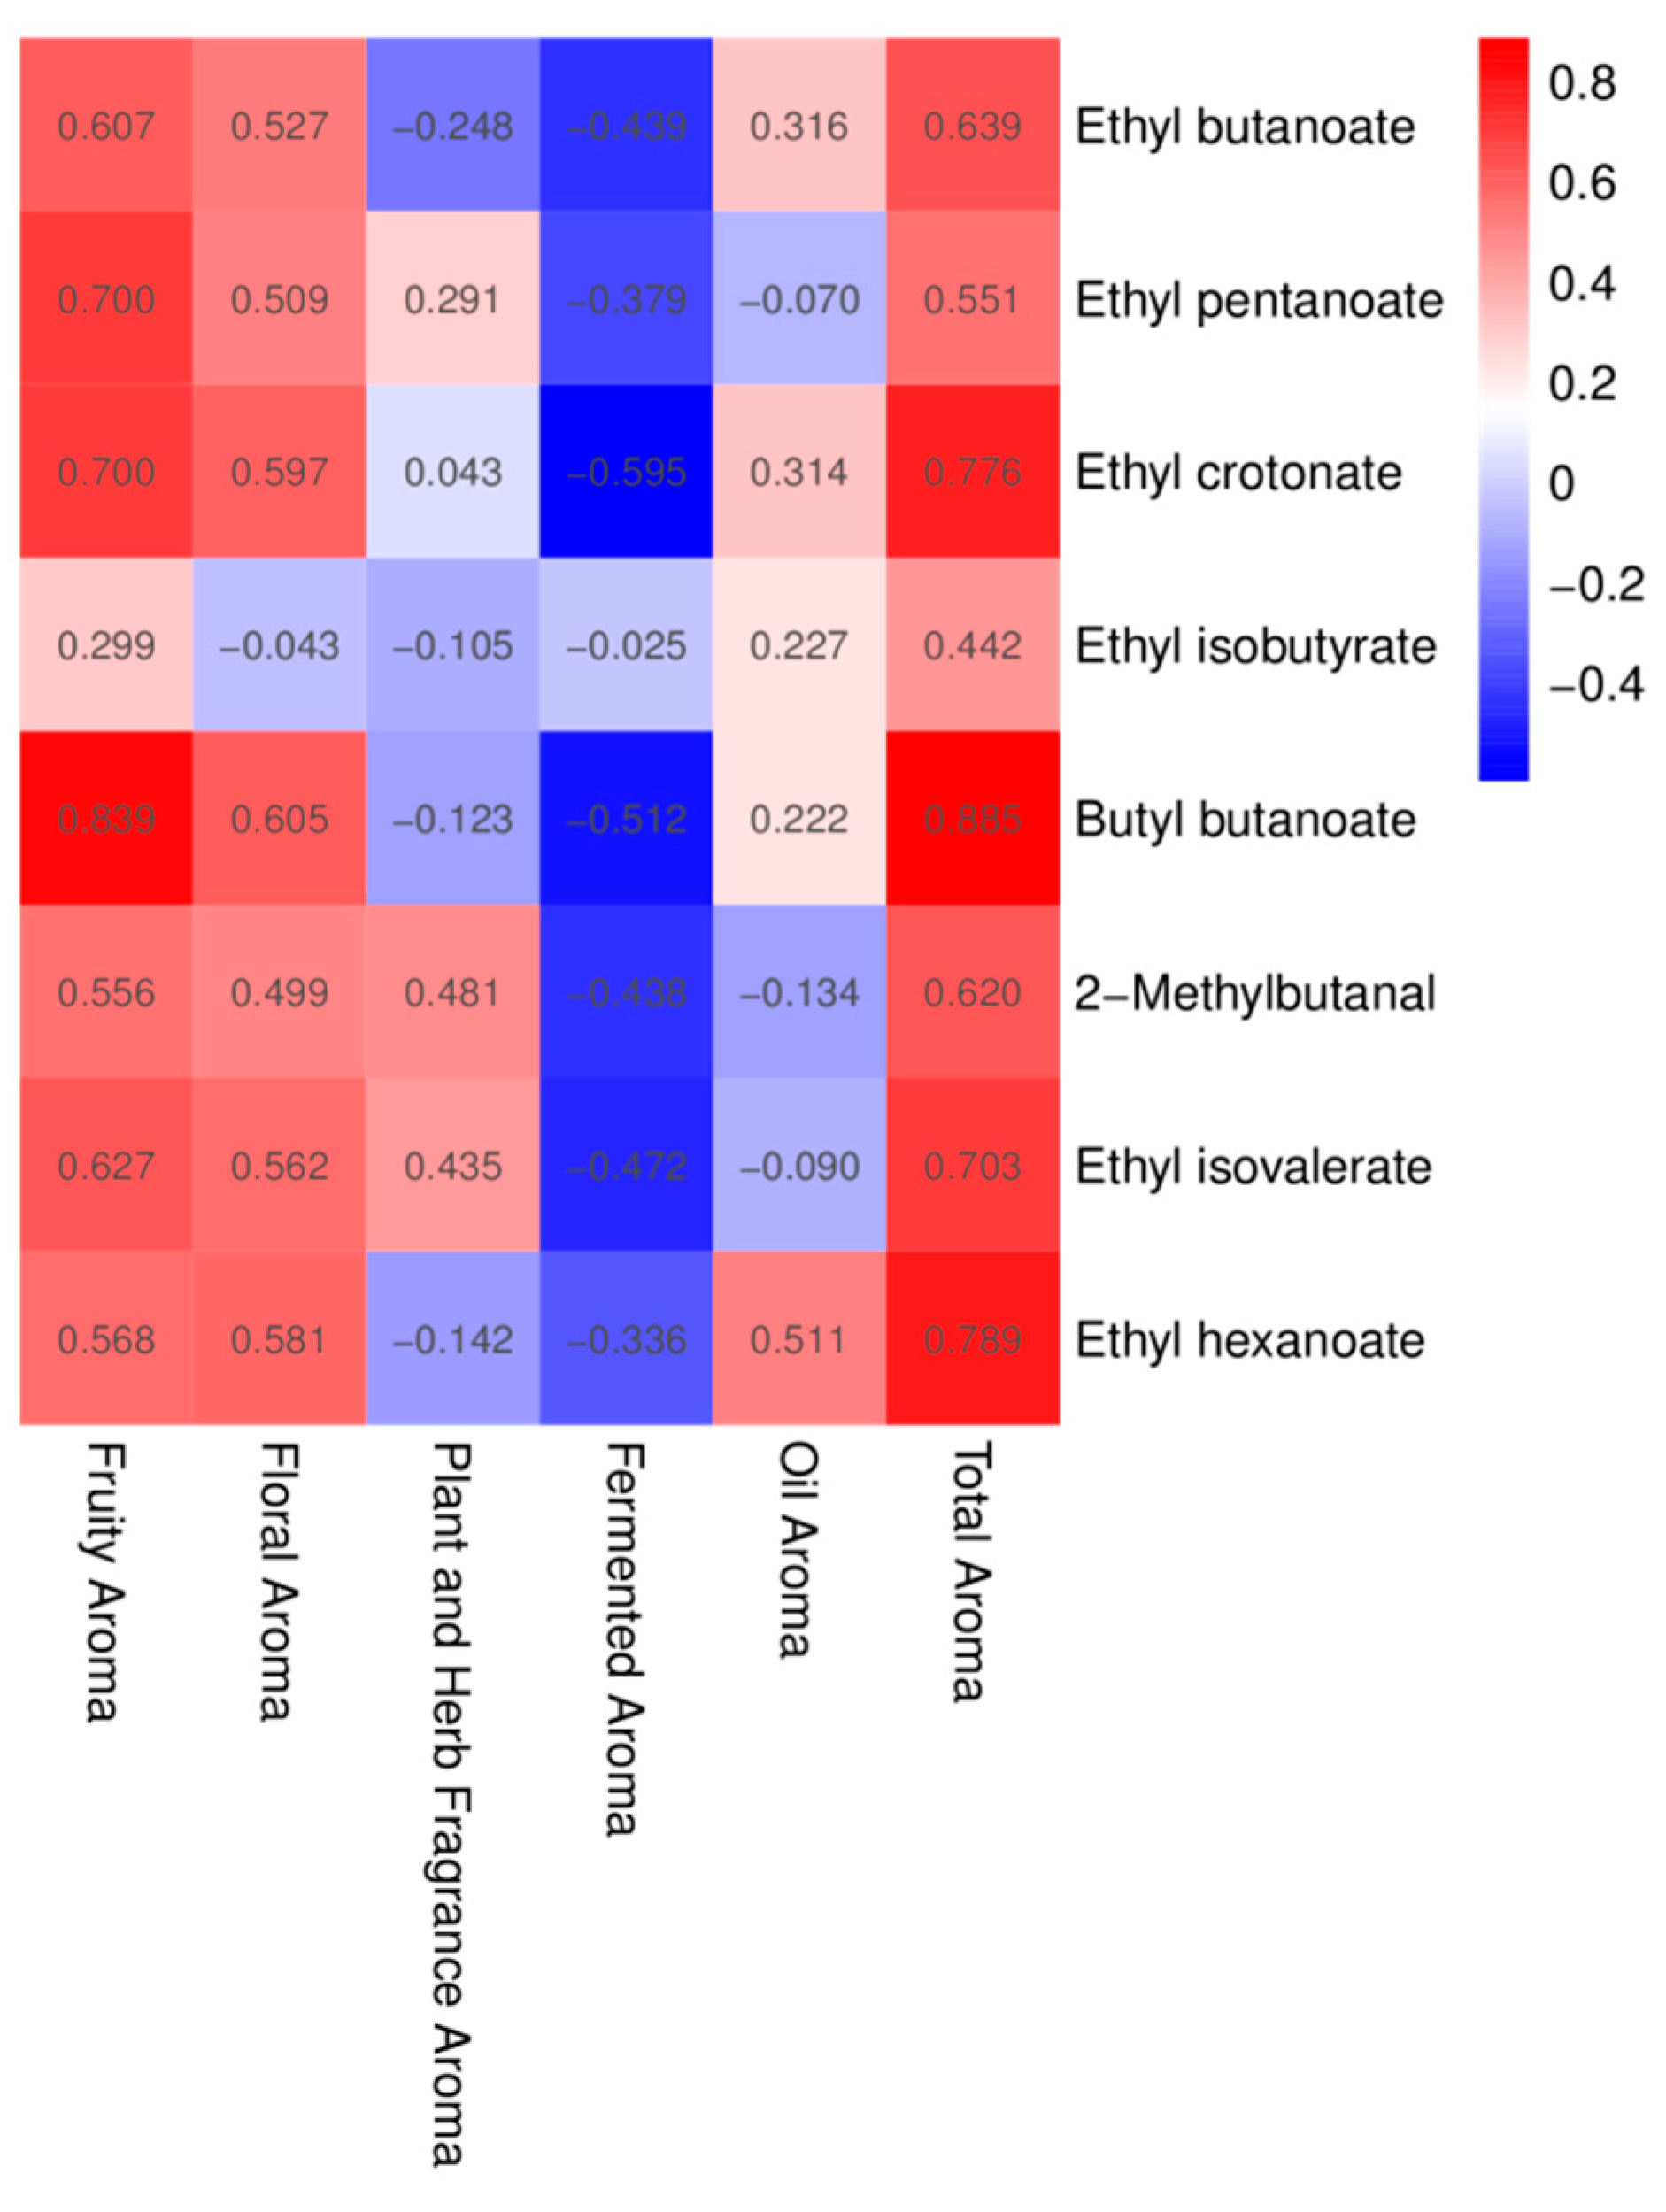
3.7. Characterization of Flavor Profiles and Differential Aroma Compounds of Different Varieties of A. arguta Wine
3.8. Sensory Evaluation Characteristics of A. arguta Wine
4. Conclusions
Supplementary Materials
Author Contributions
Funding
Informed Consent Statement
Data Availability Statement
Conflicts of Interest
References
- Lai, J.J.; Li, Z.Z.; Man, Y.P.; Lei, R.; Wang, Y.C. Genetic diversity of five wild Actinidia arguta populations native to China as revealed by SSR markers. Sci. Hortic. 2015, 191, 101–107. [Google Scholar] [CrossRef]
- Baranowska-Wojcik, E.; Szwajgier, D. Characteristics and pro-health properties of mini kiwi (Actinidia arguta). Hort. Environ. Biotech. 2019, 60, 217–225. [Google Scholar] [CrossRef]
- Zhang, M.; Wang, H.X.; Lou, X.; Zhao, L.N.; Yan, D.L. Characterization of world Actinidia arguta variety resources and breeding trends. Chin. J. Ecol. 2017, 36, 3289–3297. [Google Scholar] [CrossRef]
- Hale, I.L.; Connolly, B.A. Actinidia arguta: A new record of a naturalized introduction in connecticut. Rhodora 2014, 116, 352–355. [Google Scholar] [CrossRef] [PubMed]
- Pinto, D.; Delerue-Matos, C.; Rodrigues, F. Bioactivity, phytochemical profile and pro-healthy properties of Actinidia arguta: A review. Food Res. Int. 2020, 136, 109449. [Google Scholar] [CrossRef]
- Latocha, P.; Krupa, T.; Wolosiak, R.; Worobiej, E.; Wilczak, J. Antioxidant activity and chemical difference in fruit of different Actinidia sp. Int. J. Food Sci. Nutr. 2010, 61, 381–394. [Google Scholar] [CrossRef]
- Niu, Q.; Shen, J.; Liu, Y.; Nie, C.Y.; Skypchenko, N.V.; Liu, D.J. Research Progress on main active constituents and pharmacological activities of Actinidia arguta. Sci. Technol. Food Ind. 2019, 40, 333–338+344. [Google Scholar] [CrossRef]
- Liu, Q.; Jia, D.F.; Huang, C.H.; Zhong, M.; Miao, G.L.; Xu, X.B. Research progress on germplasm resources of Actinidia arguta. No. Hort. 2020, 132–137. [Google Scholar]
- Shi, C.H.; Li, D.W.; Zhao, Y.Q. Advances in research on chemical comstituens of Actinidia arguta and their pharmacological activities. Drug Clin. 2011, 26, 203–207. [Google Scholar]
- Wen, J.L.; Cao, W.Y.; Wang, Y.; He, Y.L.; Sun, Y.N.; Yuan, P.Q.; Sun, B.W. Comprehensive evaluation of fruit quality of Actinidia arguta based on principal component analysis and cluster analysis. Sci. Technol. Food Ind. 2023, 1–16. [Google Scholar] [CrossRef]
- Latocha, P. The Nutritional and Health Benefits of Kiwiberry (Actinidia arguta)—A Review. Plant Foods Hum. Nutr. 2017, 72, 325–334. [Google Scholar] [CrossRef] [PubMed]
- Latocha, P.; Jankowski, P.; Radzanowska, J. Genotypic difference in postharvest characteristics of hardy kiwifruit (Actinidia arguta and its hybrids), as a new commercial crop Part I. Sensory profiling and physicochemical differences. Food Res. Int. 2011, 44, 1936–1945. [Google Scholar] [CrossRef]
- Latocha, P.; Lata, B.; Stasiak, A. Phenolics, ascorbate and the antioxidant potential of kiwiberry vs. common kiwifruit: The effect of cultivar and tissue type. J. Funct. Foods 2015, 19, 155–163. [Google Scholar] [CrossRef]
- Huang, G.H. Main varieties and cultivation techniques of Actinidia arguta. No. Fruits 2020, 44–47. [Google Scholar] [CrossRef]
- Xiong, S.; Sun, X.; Tian, M.; Xu, D.; Jiang, A. 1-Methylcyclopropene treatment delays the softening of Actinidia arguta fruit by reducing cell wall degradation and modulating carbohydrate metabolism. Food Chem. 2023, 411, 135485. [Google Scholar] [CrossRef]
- Wen, J.L.; Lu, W.P.; Cao, W.Y.; He, Y.L.; Yang, Y.M. Research progress on nutritional component and quality influencing factors of Actinidia arguta wine. China Brew. 2023, 42, 13–18. [Google Scholar]
- Ding, Y.P.; Liu, Y.X.; Skypchenko, N.V.; Liu, D.J. Research progress in the brewing of Actinidia arguta wine. China Brew. 2021, 40, 28–31. [Google Scholar]
- Ding, Y.P.; Wang, M.Z.; Liu, Y.X.; Skypchenko, N.V.; Liu, D.J. Research progress on the product development and utilization of Actinidia arguta. Food Ferment. Ind. 2023, 49, 308–314. [Google Scholar] [CrossRef]
- Pang, M.; Cai, S.L.; Liu, Q. Research progress in the study of organic acids in wine and their analytical methods. J. Food Saf. Qual. 2019, 10, 1588–1593. [Google Scholar]
- Al-Othman, Z.A.; Al-Warthan, A.; Ali, I. Advances in enantiomeric resolution on monolithic chiral stationary phases in liquid chromatography and electrochromatography. J. Sep. Sci. 2014, 37, 1033–1057. [Google Scholar] [CrossRef]
- Ali, I.; Al-Othman, Z.A.; Nagae, N.; Gaitonde, V.D.; Dutta, K.K. Recent trends in ultra-fast HPLC: New generation superficially porous silica columns. J. Sep. Sci. 2012, 35, 3235–3249. [Google Scholar] [CrossRef] [PubMed]
- Bottcher, S.; von Baum, H.; Hoppe-Tichy, T.; Benz, C.; Sonntag, H.G. An HPLC assay and a microbiological assay to determine levofloxacin in soft tissue, bone, bile and serum. J. Pharm. Biomed. Anal. 2001, 25, 197–203. [Google Scholar] [CrossRef] [PubMed]
- Cao, W.; Shu, N.; Wen, J.; Yang, Y.; Jin, Y.; Lu, W. Characterization of the Key Aroma Volatile Compounds in Nine Different Grape Varieties Wine by Headspace Gas Chromatography-Ion Mobility Spectrometry (HS-GC-IMS), Odor Activity Values (OAV) and Sensory Analysis. Foods 2022, 11, 2767. [Google Scholar] [CrossRef] [PubMed]
- Zhao, N.; Zhang, Y.Z.; Liu, D.; Zhang, J.; Qi, Y.M.; Xu, J.N.; Wei, X.Y.; Fan, M.T. Free and bound volatile compounds in ‘Hayward’ and ‘Hort16A’ kiwifruit and their wines. Eur. Food Res. Technol. 2020, 246, 875–890. [Google Scholar] [CrossRef]
- Jiang, H.; Duan, W.; Zhao, Y.; Liu, X.; Wen, G.; Zeng, F.; Liu, G. Development of a Flavor Fingerprint Using HS-GC-IMS for Volatile Compounds from Steamed Potatoes of Different Varieties. Foods 2023, 12, 2252. [Google Scholar] [CrossRef]
- Li, M.; Yang, R.; Zhang, H.; Wang, S.; Chen, D.; Lin, S. Development of a flavor fingerprint by HS-GC-IMS with PCA for volatile compounds of Tricholoma matsutake Singer. Food Chem. 2019, 290, 32–39. [Google Scholar] [CrossRef]
- Jin, Y.; Shu, N.; Xie, S.; Cao, W.; Xiao, J.; Zhang, B.; Lu, W. Comparison of ‘Beibinghong’ dry red wines from six producing areas based on volatile compounds analysis, mineral content analysis, and sensory evaluation analysis. Eur. Food Res. Technol. 2021, 247, 1461–1475. [Google Scholar] [CrossRef]
- Dong, Y.Y.; Liang, C.Y.; Jin, T.Y. Effect of three kinds of yeasts on Actinidia arguta wine quality. Food Sci. Technol. 2013, 38, 142–145. [Google Scholar] [CrossRef]
- Zhang, B.X.; Qin, H.Y.; Liu, Y.X.; Yang, Y.M.; Fan, S.T.; Wang, Z.X.; Zhao, Y.; Ai, J. Optimization of the Production Technology of Whole-Pulp Hardy Kiwi Wine and Analysis of Its Components. Liquor-Mak. Sci. Technol. 2017, 7, 65–69+73. [Google Scholar] [CrossRef]
- Ding, Y.P.; Wang, M.Z.; Liu, Y.X.; Wen, F.T.; Liu, F.T.; Liu, W.; Skypchenko, N.V.; Liu, D.J. Comparison of the quality Actinidia arguta fruit wine fermented by single yeast and mixed yeasts. China Brew. 2023, 42, 145–150. [Google Scholar]
- Han, D.; Wu, M.; Wang, H.; Guo, L.Q. Optimization of fermentation technology of Actinidia arguta wine. China Brew. 2016, 35, 145–148. [Google Scholar]
- Li, X.Z.; Liu, C.J. Research of fermenting process of Actinidia arguta wine. Sci. Technol. Food Ind. 2014, 35, 207–210+215. [Google Scholar] [CrossRef]
- Zhang, B.X.; Qin, H.Y.; Wang, Y.L.; Li, J.Q.; Li, C.Y.; Zhao, Y.; Fan, S.T. Analysis of aroma composition in dry wine made from different varieties of Actinidia arguta. Spec. Wild Econ. Anim. Plant Res. 2022, 148, 1–7. [Google Scholar] [CrossRef]
- Wang, Z.; Mi, S.; Wang, X.; Mao, K.; Liu, Y.; Gao, J.; Song, Y. Characterization and discrimination of fermented sweet melon juice by different microbial strains via GC-IMS-based volatile profiling and chemometrics. Food Sci. Hum. Wellness 2023, 12, 1241–1247. [Google Scholar] [CrossRef]
- Park, K.L.; Hong, S.W.; Kim, Y.J. Manufacturing and physicochemical properties of wine using hardy kiwi fruit (Actinidia arguta). Korean J. Microbiol. Biotechnol. 2013, 41, 327–334. [Google Scholar] [CrossRef]
- Shu, N. Study on Fermentation Characteristics and Dry Red Wine Brewing Technology of New Grape New Vitis Amurensis Cultivar ‘Beiguohong’. Master’s Thesis, Chinese Academy of Agricultural Sciences, Beijing, China, 2019. (In Chinese). [Google Scholar]
- Li, R.J.; Liang, J.; Wang, D.; Huang, T.Z.; Zhang, L.; Yang, S.X.; Luo, A.W. Comparative analysis of antioxidant compounds and antioxidant activities in vitro of different kiwifruit Juice. Sci. Technol. Food Ind. 2022, 43, 311–318. [Google Scholar] [CrossRef]
- Berenguer, M.; Vegara, S.; Barrajon, E.; Saura, D.; Valero, M.; Marti, N. Physicochemical characterization of pomegranate wines fermented with three different Saccharomyces cerevisiae yeast strains. Food Chem. 2016, 190, 848–855. [Google Scholar] [CrossRef]
- Zhang, X.; Guo, Y.T.; Sun, S.G.; He, S.J.; Qin, S.R.; Zuo, Y. Study on the correlation of color change factors Kiwi wine fermentation production. Food Res. Dev. 2019, 40, 99–104. [Google Scholar]
- Shi, Y.Z.; Pan, Y.; Du, F.; Zhao, Z.Y.; Li, Z.W.; Wang, Y.Y.; Yuan, X.L.; Zhang, Z.F.; Pang, X.L.; Wang, J. Identification and discrimination of characteristic aroma components of different cigar leaves based on Static Headspace/Gas Chromatography-Ion Mobility Spectrometry combined with relative odor activity value and multivariate statistical analysis. J. Inst. Anal. 2023, 42, 674–683. [Google Scholar] [CrossRef]
- Dal-Seong, G.; Kushal, S.; Ki-Woon, K.; Dong-Wook, K.; Min-Ho, O. Endothelium-Dependent Relaxation Effects of Actinidia arguta Extracts in Coronary Artery: Involvement of eNOS/Akt Pathway. J. Nanosci. Nanotechnol. 2020, 20, 5381–5384. [Google Scholar] [CrossRef]
- Xiao, Z.B.; Zhou, X.; Niu, Y.W.; Zhao, F.F. The analysis of the characteristic aroma components of cherry wine by Gas Chromatography-Olfactometry (GC-O) and odor activity values. J. Chin. Inst. Food Sci. Technol. 2017, 17, 246–254. [Google Scholar]
- Xie, L.J.; Cheng, G.; Zhang, J.; Lin, L.; Zhang, Y.; Xie, T.L.; Zhou, Y.M. Analysis of aroma characteristics of spirits of ‘Guipu No.3’ grape skin residue. Sci. Technol. Food Ind. 2018, 39, 16–22. [Google Scholar]
- Zhao, Y. Analysis of Characteristic Aroma Substances of Kiwifruit Juice and the Effect of Sterilization on Aroma Composition. Master’s Thesis, Shaanxi Normal University, Xi’an, China, 2021. (In Chinese). [Google Scholar]
- Wang, P.P. Study on the Perceptual Interaction among Aroma Compounds in Cherry Wines. Master’s Thesis, Shanghai Institute of Technology, Shanghai, China, 2019. (In Chinese). [Google Scholar]
- Zhou, W.J.; Zhang, F.; Wang, P.; Zhan, P.; Tian, H.L. GC-MS/GC-O combined with chemometric for the screening and identification of aroma characteristic of Korla pear wine. Food Sci. 2018, 39, 222–227. [Google Scholar]
- Chen, H.M.; Wang, S.S.; Yin, H.N.; Dong, Z.; Yuan, C.L. Effect of different fermentation methods on the quality of wines made from wild kiwifruit. Food Sci. 2018, 39, 233–240. [Google Scholar]
- Silva, H.L.A.; Balthazar, C.F.; Silva, R.; Vieira, A.H.; Costa, R.G.B.; Esmerino, E.A.; Freitas, M.Q.; Cruz, A.G. Sodium reduction and flavor enhancer addition in probiotic prato cheese: Contributions of quantitative descriptive analysis and temporal dominance of sensations for sensory profiling. J. Dairy Sci. 2018, 101, 8837–8846. [Google Scholar] [CrossRef] [PubMed]
- Ma, J.; Zhou, J.Z.; Zhang, T.; Zhang, T.; Zhou, Z.Y.; Nian, G.F. Characterization of volatile flavor compounds of plant-based almond yogurt based on GC-IMS. Food Ferment. Ind. 2023, 1–11. [Google Scholar] [CrossRef]
- Li, H.M.; Sun, S.Y.; Huang, P.P.; Sun, X.M.; Che, C.Y.; Liu, W.L. Mixed-culture cherry wine fermentation with Torulaspora delbrueckii WA19 and Saccharomyces cerevisiae F33. Food Sci. 2018, 39, 123–130. [Google Scholar] [CrossRef]
- Yin, X.L.; Gong, L.J.; Zhong, W.; Li, E.H. Effect of mixed fermentation with Saccharomyces cerevisiae and Torulaspora delbrueckii on the aroma of Kiwifruit wine. Food Sci. 2021, 42, 216–223. [Google Scholar] [CrossRef]
- Qin, Y.; Wu, B.; Qin, H.; He, M.X. Development and research status of fruit wine in China. China Brew. 2020, 39, 1–6. [Google Scholar] [CrossRef]
- Ba, T.; Ren, Y.L.; Dong, X.Q.; Bourgeois, A. Theoretical and practical exploration on the application of professional winemaking tannins in wine. Sino-Overseas Grapevine Wine 2011, 11, 53–57. [Google Scholar] [CrossRef]
- Yin, Z.Y.; Guan, J.F.; Zhao, J.L.; Liu, J.L.; Zhao, G.Q. Research progress on quality evaluation system of fruit fermented wine. Food Mach. 2023, 39, 234–240. [Google Scholar]
- Teng, Z.J. Study on the Color Change and Coloration Mechanism by Yeast and Pyruvic Acid during the Wine Fermentation. Master’s Thesis, Jinan University, Guangzhou, China, 2022. (In Chinese). [Google Scholar] [CrossRef]
- Robles, A.; Fabjanowicz, M.; Chmiel, T.; Plotka-Wasylka, J. Determination and identification of organic acids in wine samples. Problems and challenges. TrAC—Trends Anal. Chem. 2019, 120, 14. [Google Scholar] [CrossRef]
- Esteves, V.I.; Lima, S.S.F.; Lima, D.L.D.; Duarte, A.C. Using capillary electrophoresis for the determination of organic acids in Port wine. Anal. Chim. Acta. 2004, 513, 163–167. [Google Scholar] [CrossRef]
- Huang, J.; Li, H.; Wang, Y.; Wang, X.; Ren, Y.; Yue, T.; Gao, Z. Evaluation of the quality of fermented kiwi wines made from different kiwifruit cultivars. Food Biosci. 2021, 42, 101051. [Google Scholar] [CrossRef]
- Jiang, H.X.; Guo, J.H.; Shi, X.T.; Wei, Y.X. The research status of organic acid composition analysis and acid reduction technology in fruit wine. Mod. Food. 2020, 10–14. [Google Scholar] [CrossRef]
- Rao, Y.Y.; Sang, Y.; Tang, L.L.; Chen, S.R.; Feng, J.W.; Fu, M.R.; Liu, Y.M.; Wang, J.L. Dynamic changes in aroma, functional components and hypoglycemic effect in Vitro of red raspberry wine during fermentation. Food Sci. 2020, 41, 222–230. [Google Scholar]
- Matich, A.J.; Young, H.; Allen, J.M.; Wang, M.Y.; Fielder, S.; McNeilage, M.A.; MacRae, E.A. Actinidia arguta: Volatile compounds in fruit and flowers. Phytochemistry 2003, 63, 285–301. [Google Scholar] [CrossRef]
- Lin, X.; Hu, X.; Wu, W.; Liu, S.; Li, C. Evaluation of the volatile profile of wax apple (Syzygium samarangense) wines fermented with different commercial Saccharomyces cerevisiae strains. Food Sci. Biotechnol. 2019, 28, 657–667. [Google Scholar] [CrossRef]
- Wei, J.; Wang, S.; Zhang, Y.; Yuan, Y.; Yue, T. Characterization and screening of non-Saccharomyces yeasts used to produce fragrant cider. LWT-Food Sci. Technol. 2019, 107, 191–198. [Google Scholar] [CrossRef]
- Peng, W.; Meng, D.; Yue, T.; Wang, Z.; Gao, Z. Effect of the apple cultivar on cloudy apple juice fermented by a mixture of Lactobacillus acidophilus, Lactobacillus plantarum, and Lactobacillus fermentum. Food Chem. 2021, 340, 127922. [Google Scholar] [CrossRef]
- Fleet, G.H. Yeast interactions and wine flavour. Int. J. Food Microbiol. 2003, 86, 11–22. [Google Scholar] [CrossRef] [PubMed]
- Zhang, S.; Petersen, M.A.; Liu, J.; Toldam-Andersen, T.B. Influence of Pre-Fermentation Treatments on Wine Volatile and Sensory Profile of the New Disease Tolerant Cultivar Solaris. Molecules 2015, 20, 21609–21625. [Google Scholar] [CrossRef] [PubMed]


| Name | Standard Curves | R2 |
|---|---|---|
| Oxalic Acid | f(x) = 15,184x + 28.758 | 0.9994 |
| Malic Acid | f(x) = 917.66x + 19.027 | 0.9995 |
| Shikimic Acid | f(x) = 65,935x + 474.72 | 0.9995 |
| Lactic Acid | f(x) = 683.52x − 60.731 | 0.9997 |
| Acetic Acid | f(x) = 749.42x + 3.8359 | 0.999 |
| Citric Acid | f(x) = 1487x − 4.2267 | 0.9998 |
| Succinic Acid | f(x) = 752.1x + 1.774 | 0.9995 |
| Quinic Acid | f(x) = 611.85x − 0.598 | 0.9998 |
| Gas-Ion Transport Spectral Unit | Automatic Headspace Injection Unit | ||
|---|---|---|---|
| Analysis time | 30 min | Inlet volume | 100 μL |
| Column type | MXT-WAX, length 30 m, inside diameter 0.53 mm, film thickness 1 μm | Incubation time | 10 min |
| Column temperature | 60 °C | Incubation temperature | 60 °C |
| Carrier Gas/Drift Gas | N2 (99.999% pure) | Injection needle temperature | 85 °C |
| IMS temperature | 45 °C | Incubation speed | 500 r/min |
| Time | E1 (Drift Gas) | E2 (Carrier Gas) | Recording |
|---|---|---|---|
| 00:00,000 | 150 mL/min | 2 mL/min | rec |
| 02:00,000 | 2 mL/min | - | |
| 10:00,000 | 10 mL/min | - | |
| 20:00,000 | 100 mL/min | - | |
| 30:00,000 | 100 mL/min | Stop |
| Variety | Alcohol by Volume (v/v) | Residual Sugar (g/L) | Titratable Acid (g/L) | Dry Extract (g/L) | Vitamin C (mg/L) | Total Phenols (mg/L) | Total Flavonoids (mg/L) | Tannin (g/L) |
|---|---|---|---|---|---|---|---|---|
| ‘Kuilv’ | 8.80 ± 0.20 bc | 1.49 ± 0.05 bcd | 13.07 ± 0.12 b | 48.01 ± 0.17 b | 913.46 ± 11.65 a | 816.10 ± 2.87 a | 304.14 ± 11.11 d | 1.35 ± 0.12 b |
| ‘Fenglv’ | 10.07 ± 0.21 a | 1.32 ± 0.04 de | 11.16 ± 0.07 d | 40.65 ± 0.12 c | 826.68 ± 10.68 c | 562.45 ± 1.66 f | 418.04 ± 2.57 b | 1.29 ± 0.05 b |
| ‘Jialv’ | 7.17 ± 0.15 e | 1.45 ± 0.05 bcd | 10.36 ± 0.19 f | 30.02 ± 0.25 e | 706.23 ± 15.54 d | 693.58 ± 11.95 c | 477.12 ± 7.27 a | 1.73 ± 0.12 b |
| ‘Wanlv’ | 9.13 ± 0.25 b | 1.58 ± 0.09 bc | 10.77 ± 0.11 e | 31.62 ± 0.17 d | 661.27 ± 1.96 e | 781.64 ± 2.87 b | 277.48 ± 8.40 e | 1.74 ± 0.16 b |
| ‘Xinlv’ | 8.93 ± 0.14 bc | 1.61 ± 0.21 b | 12.69 ± 0.13 c | 40.19 ± 0.17 c | 231.29 ± 3.48 i | 488.73 ± 15.99 g | 335.65 ± 4.20 c | 1.20 ± 0.23 b |
| ‘Pinglv’ | 9.83 ± 0.15 a | 1.37 ± 0.01 cde | 8.86 ± 0.20 g | 23.30 ± 0.29 f | 305.63 ± 2.06 h | 305.92 ± 6.63 i | 219.32 ± 4.20 f | 1.16 ± 0.12 b |
| ‘Lvbao’ | 8.10 ± 0.20 d | 1.92 ± 0.05 a | 10.29 ± 0.09 f | 12.25 ± 0.25 h | 432.46 ± 1.68 f | 797.92 ± 8.91 ab | 335.65 ± 4.87 c | 1.78 ± 0.28 b |
| ‘Cuiyu’ | 8.37 ± 0.15 cd | 1.21 ± 0.03 e | 10.85 ± 0.15 de | 23.09 ± 0.17 f | 394.65 ± 1.33 g | 375.79 ± 4.39 h | 202.36 ± 4.17 g | 4.63 ± 0.37 a |
| ‘Tianxinbao’ | 9.20 ± 0.26 b | 1.84 ± 0.12 a | 11.14 ± 0.17 d | 49.59 ± 0.30 a | 861.28 ± 1.11 b | 659.12 ± 5.98 d | 301.72 ± 12.59 d | 4.28 ± 0.42 a |
| ‘Longcheng No2’ | 8.93 ± 0.21 bc | 1.83 ± 0.03 a | 13.81 ± 0.14 a | 20.24 ± 0.30 g | 869.58 ± 2.52 b | 598.82 ± 4.39 e | 224.17 ± 4.20 f | 4.46 ± 0.04 a |
| Variety | L* | a* | b* | C*ab | h*ab | ΔE*ab |
|---|---|---|---|---|---|---|
| ‘Kuilv’ | 31.65 ± 0.02 a | 2.48 ± 0.01 e | 5.08 ± 0.03 a | 5.66 ± 0.04 a | 64.01 ± 0.09 a | |
| ‘Fenglv’ | 30.95 ± 0.02 e | 2.73 ± 0.02 b | 4.02 ± 0.01 f | 4.88 ± 0.02 d | 65.19 ± 0.33 a | 1.33 ± 0.02 d |
| ‘Jialv’ | 31.18 ± 0.06 d | 2.60 ± 0.05 d | 4.44 ± 0.10 d | 5.14 ± 0.11 c | 61.14 ± 0.80 a | 0.84 ± 0.11 e |
| ‘Wanlv’ | 31.58 ± 0.01 b | 2.34 ± 0.03 g | 5.06 ± 0.03 a | 5.58 ± 0.02 a | 64.16 ± 0.03 a | 0.19 ± 0.01 h |
| ‘Xinlv’ | 31.29 ± 0.02 c | 2.63 ± 0.01 cd | 4.59 ± 0.02 c | 5.29 ± 0.02 b | 60.19 ± 0.03 a | 0.66 ± 0.02 f |
| ‘Pinglv’ | 30.14 ± 0.01 f | 2.88 ± 0.01 a | 3.15 ± 0.00 i | 4.27 ± 0.01 f | 47.59 ± 0.03 c | 2.51 ± 0.00 a |
| ‘Lvbao’ | 30.98 ± 0.03 e | 2.82 ± 0.02 a | 3.75 ± 0.03 g | 4.70 ± 0.03 e | 53.03 ± 0.05 b | 1.56 ± 0.03 c |
| ‘Cuiyu’ | 31.59 ± 0.01 b | 2.38 ± 0.02 fg | 4.30 ± 0.01 e | 4.91 ± 0.01 d | 61.07 ± 0.17 a | 0.83 ± 0.01 e |
| ‘Tianxinbao’ | 31.22 ± 0.01 d | 2.67 ± 0.02 c | 3.41 ± 0.01 h | 4.33 ± 0.01 f | 51.97 ± 0.18 b | 1.76 ± 0.01 b |
| ‘Longcheng No2′ | 31.65 ± 0.03 a | 2.43 ± 0.03 ef | 4.81 ± 0.04 b | 5.38 ± 0.04 b | 63.34 ± 0.11 a | 0.31 ± 0.05 g |
| Variety | Oxalic Acid (g/L) | Quinic Acid (g/L) | Malic Acid (g/L) | Shikimic Acid (g/L) | Lactic Acid (g/L) | Acetic Acid (g/L) | Citric Acid (g/L) | Succinic Acid (g/L) |
|---|---|---|---|---|---|---|---|---|
| ‘Kuilv’ | 0.05 ± 0 de | 4.2 ± 0.31 d | 0.83 ± 0.05 f | 0.05 ± 0 b | 0.22 ± 0.02 d | 0.63 ± 0.06 ef | 6.52 ± 0.19 b | 2.41 ± 0.24 a |
| ‘Fenglv’ | 0.07 ± 0 a | 4.27 ± 0.32 d | 2.02 ± 0.11 b | N.A. | 0.14 ± 0.01 g | 1.1 ± 0.12 a | 4.95 ± 0.33 e | N.A. |
| ‘Jialv’ | 0.04 ± 0 ef | 3.62 ± 0.17 ef | 1.77 ± 0.13 c | 0.01 ± 0 e | 0.13 ± 0.02 h | 0.76 ± 0.11 cd | 3.45 ± 0.32 f | 1.53 ± 0.21 b |
| ‘Wanlv’ | 0.01 ± 0 g | 3.54 ± 0.34 f | 1.07 ± 0.12 e | 0.06 ± 0 a | 0.24 ± 0.05 c | 0.53 ± 0.01 f | 5.39 ± 0.41 c | 0.32 ± 0.02 d |
| ‘Xinlv’ | 0.06 ± 0.01 bcd | 5.34 ± 0.46 b | 1.49 ± 0.23 d | N.A. | 0.28 ± 0.04 b | 0.87 ± 0.03 b | 5.13 ± 0.41 d | N.A. |
| ‘Pinglv’ | 0.04 ± 0 ef | 2.82 ± 0.22 g | 1.67 ± 0.14 c | N.A. | 0.19 ± 0.01 f | 0.66 ± 0.05 e | 3.12 ± 0.31 g | 0.72 ± 0.01 c |
| ‘Lvbao’ | 0.06 ± 0 bc | 3.7 ± 0.33 e | 1.36 ± 0.11 d | 0.04 ± 0 c | 0.27 ± 0.05 b | 0.71 ± 0.02 de | 5.2 ± 0.61 d | N.A. |
| ‘Cuiyu’ | 0.05 ± 0.01 de | 5.04 ± 0.27 c | 1.72 ± 0.1 c | N.A. | 0.2 ± 0.01 e | 0.84 ± 0.02 cd | 5.06 ± 0.72 de | N.A. |
| ‘Tianxinbao’ | 0.03 ± 0 f | 3.71 ± 0.35 e | 2.92 ± 0.34 a | 0.01 ± 0 e | 0.8 ± 0.07 a | 0.7 ± 0.01 de | 3.2 ± 0.21 g | N.A. |
| ‘Longcheng No2′ | 0.07 ± 0 a | 7.04 ± 0.78 a | 1.12 ± 0.16 e | 0.02 ± 0 d | 0.2 ± 0.01 e | 0.57 ± 0.01 f | 7.45 ± 0.81 a | 0.35 ± 0.02 d |
| No. | CAS# | Aromatic Substances | Volatile Compound Content of A. arguta Wine (μg/L) | |||||||||
|---|---|---|---|---|---|---|---|---|---|---|---|---|
| ‘Kuilv’ | ‘Fenglv’ | ‘Jialv’ | ‘Wanlv’ | ‘Xinlv’ | ‘Pinglv’ | ‘Lvbao’ | ‘Cuiyu’ | ‘Tianxinbao’ | ‘Longcheng No2’ | |||
| 1 | C111273 | 1-Hexanol D | 145.09 ± 2.46 c | 147.11 ± 2.01 c | 133.64 ± 3.87 d | 127.3 ± 2.07 d | 130.14 ± 0.68 d | 149.72 ± 3.87 c | 132.7 ± 3.19 d | 191.94 ± 3.56 a | 130.47 ± 1.83 d | 171.09 ± 4.63 b |
| 2 | C111273 | 1-Hexanol M | 9.29 ± 1.03 b | 9.91 ± 0.45 b | 8.5 ± 0.80 b | 8.89 ± 0.76 b | 9.66 ± 0.63 b | 8.91 ± 0.61 b | 8.93 ± 0.29 b | 9.95 ± 0.45 b | 18.77 ± 1.01 a | 9.28 ± 0.62 b |
| 3 | C3391864 | 1-Octen-3-ol | 55.09 ± 3.71 g | 123.52 ± 1.30 e | 133.86 ± 5.96 cd | 155.97 ± 0.20 a | 146.71 ± 1.47 b | 133.79 ± 1.90 cd | 136.58 ± 1.83 c | 102.73 ± 1.52 f | 110.3 ± 1.42 f | 126.58 ± 1.64 de |
| 4 | C71410 | 1-Pentanol | 303.24 ± 2.43 c | 318.58 ± 0.78 b | 274.69 ± 2.59 e | 259.09 ± 4.63 f | 268.42 ± 1.05 e | 300.9 ± 2.24 cd | 295.52 ± 2.68 d | 333.92 ± 2.73 a | 268.56 ± 1.34 e | 293.75 ± 1.85 d |
| 5 | C78831 | 2-Methyl-1-propanol | 2623.85 ± 22.25 d | 3183.39 ± 12.10 a | 2563.98 ± 26.25 e | 2578.19 ± 20.02 de | 2749.31 ± 24.17 c | 2819.84 ± 14.94 b | 2830.67 ± 42.55 b | 2852.69 ± 47.72 b | 2554.27 ± 42.17 e | 2767.72 ± 15.11 c |
| 6 | C71238 | Propanol | 16.63 ± 1.00 e | 21.43 ± 0.94 cd | 19.34 ± 0.27 de | 21.6 ± 2.25 cd | 18.83 ± 0.90 de | 28.15 ± 0.91 b | 19.66 ± 0.95 de | 23.31 ± 0.34 c | 39.11 ± 5.06 a | 28.35 ± 1.19 b |
| 7 | C123513 | 3-Methyl-1-butanol D | 5649.02 ± 41.99 c | 6117.13 ± 7.42 a | 5452.48 ± 24.93 d | 4851.22 ± 3.23 f | 5449.16 ± 40.45 d | 5851.85 ± 31.64 b | 5603.09 ± 20.09 c | 5848.77 ± 13.68 b | 5286.4 ± 33.96 e | 5853.18 ± 29.09 b |
| 8 | C123513 | 3-Methyl-1-butanol M | 192.2 ± 3.29 bc | 205.6 ± 6.01 a | 181.63 ± 1.48 d | 165.9 ± 1.64 e | 190.93 ± 3.53 c | 199.08 ± 2.49 b | 196.63 ± 6.69 bc | 193.26 ± 1.42 bc | 164.74 ± 3.64 e | 183.62 ± 4.02 d |
| 9 | C626891 | 4-Methyl-1-pentanol | 6344.69 ± 32.84 f | 6872.77 ± 31.17 a | 6307.65 ± 26.88 f | 5909.16 ± 57.48 h | 6075.88 ± 9.42 g | 6546.95 ± 21.67 d | 6351.96 ± 12.58 f | 6747.97 ± 13.06 b | 6425.46 ± 19.77 e | 6675.33 ± 20.01 c |
| 10 | C64175 | Ethanol D | 8151.3 ± 30.97 e | 8054.36 ± 37.78 f | 8037.14 ± 23.47 f | 7865.83 ± 34.79 g | 8450.76 ± 39.19 b | 8542.87 ± 30.77 a | 8422.18 ± 37.46 bc | 8345.27 ± 30.99 d | 8360.43 ± 9.23 d | 8369.77 ± 26.68 cd |
| 11 | C64175 | Ethanol M | 1048.36 ± 21.15 de | 947.6 ± 6.40 f | 1081.72 ± 27.19 cd | 1058.4 ± 20.07 de | 934.56 ± 32.34 f | 1030.47 ± 24.05 e | 1126.24 ± 20.23 bc | 1242.37 ± 23.92 a | 1141.39 ± 35.61 b | 1155.72 ± 37.15 b |
| 12 | C543497 | Heptan-2-ol | 44.67 ± 2.31 b | 52 ±1.72 a | 37.85 ±0.31 d | 37.33 ± 1.76 d | 35.64 ± 1.20 d | 43.87 ± 2.30 bc | 38.51 ± 2.86 d | 38.83 ± 3.58 | 40.02 ± 1.29 cd | 36.85 ± 3.76 d |
| Alcohols | Subtotal | 24,583.41 | 26,053.39 | 24,232.49 | 23,038.88 | 24,459.99 | 25,656.39 | 25,162.66 | 25,931.00 | 24,539.92 | 25,671.24 | |
| Percentage | 58.50% | 59.23% | 57.59% | 57.18% | 57.59% | 59.14% | 59.35% | 60.09% | 58.64% | 60.98% | ||
| 1 | C108645 | Ethyl isovalerate | 1198.58 ± 16.51 de | 1349.46 ± 9.09 a | 1145.87 ± 16.17 f | 1180.59 ± 6.31 de | 1211.71 ± 25.04 cd | 1259.43 ± 31.36 b | 1237.8 ± 25.04 bc | 1240.61 ± 31.36 bc | 1172.35 ± 20.84 ef | 1241.42 ± 18.72 bc |
| 2 | C123864 | Butyl acetate | 61.56 ±3.98 e | 61.14 ±2.92 e | 61.41 ±3.09 e | 107.41 ± 3.01 b | 72.67 ±4.06 d | 75.15 ±1.42 d | 60.72 ± 2.37 e | 191.15 ± 0.60 a | 103.37 ± 2.72 b | 91.61 ± 1.01 c |
| 3 | C109217 | Butyl butanoate | 430.68 ± 5.20 g | 586.35 ±5.15 a | 486.49 ± 6.20 f | 508.48 ± 5.14 c | 498.34 ± 3.59 d | 499.25 ± 6.93 d | 512.5 ± 3.70 c | 510.66 ± 0.59 c | 514.09 ± 5.29 c | 534.23 ± 3.94 b |
| 4 | C591684 | Butyl pentanoate | 1077.42 ± 7.44 a | 1056.86 ± 7.04 ab | 1028.18 ± 11.02 b | 1026.08 ± 19.38 b | 1037.14 ± 32.04 b | 1030.17 ± 6.87 b | 962.33 ± 38.21 c | 968.18 ± 7.32 c | 949.46 ± 7.34 c | 847.15 ± 2.48 d |
| 5 | C106365 | Propyl propanoate | 849.69 ± 8.57 b | 855 ± 4.21 ab | 862.66 ± 2.36 a | 725.97 ± 3.67 e | 753.5 ± 1.50 d | 851.73 ± 7.96 ab | 688.08 ± 11.31 f | 731.76 ± 7.8 e | 647.75 ± 6.29 g | 804.99 ± 3.53 c |
| 6 | C141786 | Ethyl acetate | 3724.14 ± 11.93 b | 3527.12 ± 24.55 e | 3764.08 ± 24.44 a | 3552.94 ± 32.66 de | 3575.24 ± 21.14 d | 3684.5 ± 13.56 c | 3538.78 ± 6.77 e | 3582.56 ± 10.85 d | 3445.42 ± 10.96 f | 3693.5 ± 5.31 bc |
| 7 | C105544 | Ethyl butanoate | 945.79 ± 1.95 c | 704.05 ± 11.05 f | 992.39 ± 2.44 b | 518.57 ± 1.50 h | 915.19 ± 5.89 d | 673.36 ± 3.51 g | 817.04 ± 4.19 e | 1253.93 ± 39.15 a | 714.35 ± 2.77 f | 816.73 ± 2.59 e |
| 8 | C623701 | Ethyl crotonate | 292.46 ± 4.19 e | 346.73 ± 3.37 b | 285.51 ± 5.96 f | 273.79 ± 0.84 g | 363.13 ± 1.64 a | 309.71 ± 5.30 d | 243.5 ± 5.11 h | 273.34 ± 5.14 g | 319.28 ± 5.13 c | 233.9 ± 1.82 i |
| 9 | C109944 | Ethyl formate | 28.50 ± 1.85 g | 73.86 ± 3.36 b | 40.2 ± 3.12 f | 58.6 ± 2.21 cd | 85.91 ± 6.08 a | 52.87 ± 3.01 e | 63.65 ± 0.05 c | 55.11 ± 4.01 de | 86.44 ± 3.30 a | 24.22 ± 0.24 g |
| 10 | C106309 | Ethyl heptanoate | 82.52 ± 6.25 g | 91.64 ± 6.46 f | 96.75 ± 4.79 ef | 107.41 ± 5.53 d | 142.18 ± 4.58 b | 101.89 ± 5.93 de | 103.74 ± 4.95 de | 143.7 ± 5.41 b | 215.64 ± 2.30 a | 123.69 ± 5.99 c |
| 11 | C123660 | Ethyl hexanoate | 1193.43 ± 38.82 b | 944.86 ± 31.15 d | 1236.77 ± 18.10 a | 1143.27 ± 34.24 c | 1135.09 ± 15.98 c | 849.78 ± 16.17 ef | 1106.02 ± 7.84 c | 564.1 ± 5.50 g | 865.11 ± 12.96 e | 823.85 ± 2.15 f |
| 12 | C97621 | Ethyl isobutyrate | 10.94 ± 0.68 d | 20.02 ± 0.86 b | 15.31 ± 1.04 c | 12.4 ± 0.52 cd | 12.55 ± 0.29 cd | 20.78 ± 4.37 b | 15.85 ± 0.27 c | 14.32 ± 1.07 cd | 22.66 ± 0.11 b | 30.81 ± 3.87 a |
| 13 | C97643 | Ethyl lactate | 26.94 ± 2.46 b | 32.61 ± 2.09 a | 32.65 ± 2.31 a | 35.73 ± 2.45 a | 35.13 ± 1.88 a | 34.32 ± 1.48 a | 35.98 ± 1.20 a | 35.52 ± 1.35 a | 27.57 ± 0.94 b | 33.15 ± 2.46 a |
| 14 | C539822 | Ethyl pentanoate | 175.07 ± 4.43 d | 204.57 ± 4.98 c | 170.41 ± 0.79 d | 204.16 ± 3.76 c | 214.25 ± 8.36 b | 177.8 ± 2.03 d | 217.95 ± 5.67 b | 195.69 ± 3.03 c | 235.02 ± 8.11 a | 179.98 ± 7.89 d |
| 15 | C105373 | Ethyl propanoate | 156.7 ± 2.90 g | 205.86 ± 0.48 e | 226.22 ± 3.87 d | 307.81 ± 1.34 c | 189.52 ± 4.48 f | 205.99 ± 2.85 e | 466.85 ± 1.69 a | 194.97 ± 5.97 f | 329.05 ± 1.80 b | 138.19 ± 3.99 h |
| 16 | C142927 | Hexyl acetate | 123.26 ± 2.82 bc | 117 ± 1.70 cd | 130.5 ± 7.31 ab | 130.52 ± 2.94 ab | 126.17 ± 2.19 ab | 133.44 ± 3.12 a | 107.96 ± 2.78 e | 106.45 ± 3.04 e | 108.36 ± 7.52 e | 110.44 ± 6.37 de |
| 17 | C123922 | Isoamyl acetate | 2557.4 ± 49.64 b | 2639.16 ± 31.28 a | 2437.83 ± 26.12 cd | 2239.54 ± 17.14 e | 2421.28 ± 31.75 d | 2478.3 ± 9.91 c | 2131.07 ± 14.08 g | 2096.37 ± 10.39 g | 2192.69 ± 5.34 f | 1864.17 ± 10.89 h |
| 18 | C110190 | Isobutyl acetate | 523.86 ± 3.13 d | 741.09 ± 20.25 a | 482.42 ± 2.10 e | 445.05 ± 1.36 f | 556.1 ± 7.76 c | 601.03 ± 8.64 b | 484.68 ± 2.27 e | 551.64 ± 3.01 c | 481.35 ± 1.35 e | 359.86 ± 5.39 g |
| 19 | C539902 | Isobutyl butyrate | 59.4 ± 1.55 ef | 86.59 ± 2.35 b | 64.14 ± 1.33 d | 58.2 ± 1.11 f | 64.47 ± 1.85 d | 76.33 ± 0.65 c | 62.43 ± 0.56 de | 64.73 ± 3.27 d | 76.7 ± 2.48 c | 101.90 ± 1.88 a |
| 20 | C105680 | Isopentyl propanoate | 423.87 ± 6.91 cd | 483.67 ± 2.61 a | 415.18 ± 2.34 d | 391.74 ± 4.40 e | 426.74 ± 2.86 c | 447.95 ± 8.17 b | 401.61 ± 10.32 e | 418.44 ± 5.63 cd | 394.07 ± 2.51 e | 378.18 ± 2.86 f |
| 21 | C868575 | Methyl 2-methylbutanoate | 213.31 ± 1.96 e | 223.06 ± 5.62 d | 226.27 ± 3.40 d | 270.46 ± 1.75 a | 261.1 ± 5.44 b | 243.13 ± 3.68 c | 273.05 ± 6.93 a | 212.89 ± 2.24 e | 262.03 ± 5.74 b | 192.4 ± 6.02 f |
| 22 | C79209 | methyl acetate | 748.92 ± 7.20 b | 648.33 ± 5.70 f | 730.81 ± 14.57 c | 709.44 ± 2.79 d | 751.35 ± 7.85 b | 754.46 ± 2.51 ab | 660.29 ± 8.40 e | 664.46 ± 3.20 e | 590.06 ± 1.40 g | 764.05 ± 2.26 a |
| 23 | C106321 | Ethyl octanoate D | 16.08 ± 2.73 c | 19.93 ± 3.27 bc | 22.07 ±2.49 ab | 27.14 ± 0.89 a | 25.83 ± 1.89 b | 21.55 ± 2.27 abc | 22.48 ± 1.19 ab | 19.4 ± 4.59 bc | 19.09 ± 4.37 bc | 23.45 ± 3.62 ab |
| 24 | C106321 | Ethyl octanoate M | 60.93 ± 7.20 g | 108.78 ± 8.37 f | 120.73 ± 2.89 e | 162.97 ± 3.13 a | 153.13 ± 3.51 abc | 152.4 ± 8.72 abc | 148.83 ± 4.59 bc | 141.75 ± 13.83 cd | 131.69 ± 2.79 de | 155.49 ± 3.87 ab |
| Esters | Subtotal | 14,981.45 | 15,127.74 | 15,074.84 | 14,198.27 | 15,027.73 | 14,735.32 | 14,363.20 | 14,231.72 | 13,903.61 | 13,566.64 | |
| Percentage | 35.65% | 34.39% | 35.83% | 35.24% | 35.38% | 33.97% | 33.88% | 32.98% | 33.22% | 32.22% | ||
| 1 | C110623 | Pentanal | 37.91 ± 2.05 g | 53.26 ± 1.71 f | 66.77 ± 2.67 e | 101.84 ± 2.68 b | 88.51 ± 3.77 c | 65.58 ± 1.66 e | 79.42 ± 2.50 d | 83.6 ± 4.47 d | 134.93 ± 2.95 a | 32.88 ± 1.98 h |
| 2 | C111717 | Heptanal | 13.44 ± 1.06 ef | 13.94 ± 0.47 ef | 12.26 ± 1.60 f | 16.51 ± 1.23 de | 32.56 ± 4.04 b | 15.37 ± 1.54 def | 14.39 ± 1.76 ef | 17.84 ± 0.61 cd | 37.79 ± 2.23 a | 20.38 ± 1.06 c |
| 3 | C66251 | Hexanal | 192.18 ± 2.31 bc | 186.89 ± 1.80 c | 198.24 ± 1.84 ab | 196.24 ± 3.27 ab | 195.51 ± 2.01 ab | 194.37 ± 4.13 b | 195.05 ± 3.35 b | 187.43 ± 5.35 c | 198.82 ± 5.66 ab | 202.06 ± 5.62 a |
| 4 | C124130 | Octanal | 85.93 ± 12.73 f | 117.02 ± 5.30 de | 93.48 ± 4.96 f | 121.07 ± 1.94 cde | 117.56 ± 2.62 de | 128.36 ± 2.68 bc | 111.44 ± 3.73 e | 125.21 ± 1.65 bcd | 156.49 ± 2.92 a | 133.7 ± 4.35 b |
| 5 | C142836 | (E,E)-2,4-hexadienal | 40.72 ± 4.94 e | 108.47 ± 2.20 b | 110 ± 5.47 b | 129.49 ± 0.94 a | 132.42 ± 2.28 a | 127.06 ± 1.54 a | 102.34 ± 3.23 bc | 98.88 ± 2.22 cd | 94.92 ± 1.61 cd | 89.97 ± 2.87 d |
| 6 | C105577 | Diethyl acetal D | 320 ± 13.28 c | 275.63 ± 10.33 e | 364.41 ± 6.50 a | 338.29 ± 7.61 b | 294.38 ± 3.72 d | 302.45 ± 7.07 d | 336.75 ± 5.71 b | 327.97 ± 3.40 bc | 271.06 ± 1.80 e | 364.93 ± 1.29 a |
| 7 | C105577 | Diethyl acetal M | 298.7 ± 11.03 a | 171.82 ± 3.05 fg | 264.18 ± 8.81 b | 219.36 ± 4.15 d | 180.93 ± 0.61 f | 163.6 ± 4.34 g | 193.85 ± 3.40 e | 196.96 ± 3.16 e | 172.08 ± 4.30 fg | 248.68 ± 3.77 c |
| 8 | C96173 | 2-Methylbutanal | 173.69 ± 2.21 e | 194.93 ± 3.14 c | 164 ± 1.70 f | 196.06 ± 2.47 c | 197.36 ± 8.01 c | 163.5 ± 0.25 f | 145.2 ± 4.28 g | 221.99 ± 1.95 b | 277.63 ± 2.97 a | 180.68 ± 1.48 d |
| 9 | C123728 | Butanal | 821.14 ± 20.72 e | 1137.16 ± 51.77 b | 964.03 ± 10.12 d | 1060.05 ± 12.62 c | 1149.04 ± 27.91 ab | 1196 ± 10.10 a | 1132.99 ± 19.49 b | 1084.15 ± 11.53 c | 1161.91 ± 50.29 ab | 1002.75 ± 12.98 d |
| Aldehydes | Subtotal | 1983.7 | 2259.11 | 2237.36 | 2378.93 | 2388.27 | 2356.28 | 2311.42 | 2344.04 | 2505.63 | 2276.03 | |
| Percentage | 4.72% | 5.14% | 5.32% | 5.90% | 5.62% | 5.43% | 5.45% | 5.43% | 5.99% | 5.41% | ||
| 1 | C64197 | Acetic acid D | 153.84 ± 3.00 a | 126.51 ± 5.79 c | 126.04 ± 3.78 c | 129.06 ± 5.21 c | 117.59 ± 0.89 d | 138.17 ± 2.54 b | 152.28 ± 1.00 a | 151.22 ± 0.96 a | 153.64 ± 2.77 a | 142.22 ± 1.07 b |
| Subtotal | 153.84 | 126.51 | 126.04 | 129.06 | 117.59 | 138.17 | 152.28 | 151.22 | 153.64 | 142.22 | ||
| Acids | Percentage | 0.37% | 0.29% | 0.30% | 0.32% | 0.28% | 0.32% | 0.36% | 0.35% | 0.37% | 0.34% | |
| 1 | C18402830 | (E)-3-Nonen-2-one | 12.36 ± 1.19 cd | 21.21 ± 0.98 a | 12.71 ± 0.83 cd | 12.43 ± 0.45 cd | 14.69 ± 0.69 c | 18.02 ± 1.18 b | 12.88 ± 0.24 cd | 10.38 ± 0.74 d | 13.33 ± 1.24 c | 17.58 ± 0.44 b |
| 2 | C107879 | 2-Pentanone | 46.88 ± 2.35 g | 82.75 ± 1.40 d | 72.22 ± 2.76 e | 125.4 ± 7.16 b | 96.18 ± 3.50 c | 76.96 ± 3.16 e | 61.12 ± 2.49 f | 128.05 ± 1.46 b | 293.08 ± 0.21 a | 86.21 ± 1.53 d |
| 3 | C108101 | 4-Methyl-2-pentanone | 117.19 ± 2.25 c | 134.00 ± 3.42 a | 125.48 ± 1.61 b | 104.6 ± 0.40 d | 118.5 ± 2.44 c | 132.94 ± 3.94 a | 96.48 ± 3.19 e | 106.17 ± 4.65 d | 92.44 ± 6.03 e | 96.41 ± 2.52 e |
| Ketones | Subtotal | 176.43 | 237.96 | 210.41 | 242.43 | 229.37 | 227.92 | 170.48 | 244.61 | 398.86 | 200.19 | |
| Percentage | 0.42% | 0.54% | 0.50% | 0.60% | 0.54% | 0.53% | 0.40% | 0.57% | 0.95% | 0.48% | ||
| 1 | C100425 | Styrene | 30.03 ± 1.41 ab | 31.08 ± 0.32 a | 29.08 ± 2.42 abc | 24.12 ± 1.26 cd | 29.52 ± 1.93 ab | 28.5 ± 1.89 abc | 24.92 ± 4.34 bcd | 29.21 ± 4.87 abc | 22.55 ± 2.40 d | 27.42 ± 2.72 abcd |
| 2 | C586629 | Terpinolene | 112.65 ± 5.18 g | 151.71 ± 3.31 f | 167.81 ± 5.18 e | 276.89 ± 6.71 b | 223.02 ± 14.22 d | 239.74 ± 9.20 c | 212.51 ± 8.23 d | 218.97 ± 4.8 d | 326.22 ± 7.55 a | 216.72 ± 1.55 d |
| Terpenoids | Subtotal | 142.68 | 182.79 | 196.89 | 301.02 | 252.55 | 268.24 | 237.42 | 248.18 | 348.77 | 244.14 | |
| Percentage | 0.34% | 0.42% | 0.47% | 0.75% | 0.59% | 0.62% | 0.56% | 0.58% | 0.83% | 0.58% | ||
| Total | 42,021.49 | 43,987.49 | 42,078.03 | 40,288.58 | 42,475.51 | 43,382.33 | 42,397.46 | 43,150.77 | 41,850.43 | 42,100.46 | ||
| No. | Compound | Aroma Descriptors a | ‘Kuilv’ | ‘Fenglv’ | ‘Jialv’ | ‘Wanlv’ | ‘Xinlv’ | ‘Pinglv’ | ‘Lvbao’ | ‘Cuiyu’ | ‘Tianxinbao’ | ‘Longcheng No.2’ |
|---|---|---|---|---|---|---|---|---|---|---|---|---|
| (Alcohols) 1 | 1-Octen-3-ol | Cucumber, Earth, Fat, Floral, Mushroom | 2.75 | 6.18 | 6.69 | 7.80 | 7.34 | 6.69 | 6.83 | 5.14 | 5.52 | 6.33 |
| 2 | 4-Methyl-1-pentanol | Raw green flavor, Nut | 1.55 | 1.68 | 1.54 | 1.44 | 1.48 | 1.6 | 1.55 | 1.65 | 1.57 | 1.63 |
| (Esters) 1 | Ethyl isovalerate | Apple, Fruit, Pineapple, Sour | 39.95 | 44.98 | 38.2 | 39.35 | 40.39 | 41.98 | 41.26 | 41.35 | 39.08 | 41.38 |
| 2 | Butyl butanoate | Floral | 4.31 | 5.86 | 4.86 | 5.08 | 4.98 | 4.99 | 5.13 | 5.11 | 5.14 | 5.34 |
| 3 | Ethyl butanoate | Apple, Butter, Cheese, Pineapple, Strawberry | 47.29 | 35.2 | 49.62 | 25.93 | 45.76 | 33.67 | 40.85 | 62.7 | 35.72 | 40.84 |
| 4 | Ethyl crotonate | Tropical Fruit | 584.91 | 693.46 | 571.02 | 547.59 | 726.27 | 619.42 | 487.00 | 546.69 | 638.56 | 466.37 |
| 5 | Ethyl hexanoate | Apple Peel, Brandy, Fruit Gum, Overripe Fruit, Pineapple | 85.24 | 67.49 | 88.34 | 81.66 | 81.08 | 60.7 | 79 | 40.29 | 61.79 | 58.85 |
| 6 | Ethyl isobutyrate | Apple, Fruit | <1 | 1.33 | 1.02 | <1 | <1 | 1.39 | 1.06 | <1 | 1.51 | 2.05 |
| 7 | Ethyl pentanoate | Apple, Dry Fish, Herb, Nut, Yeast | 6.54 | 7.64 | 6.36 | 7.62 | 8 | 6.64 | 8.14 | 7.31 | 8.78 | 6.72 |
| 8 | Isoamyl acetate | Apple, Banana, Glue, Pear | 85.25 | 87.97 | 81.26 | 74.65 | 80.71 | 82.61 | 71.04 | 69.88 | 73.09 | 62.14 |
| 9 | Isobutyl acetate | Apple, Banana, Floral, Herb | 7.18 | 10.15 | 6.61 | 6.10 | 7.62 | 8.23 | 6.64 | 7.56 | 6.59 | 4.93 |
| 10 | Ethyl octanoate D | Apricot, Brandy, Fat, Floral, Pineapple | 3.22 | 3.99 | 4.41 | 5.43 | 5.17 | 4.31 | 4.5 | 3.88 | 3.82 | 4.69 |
| 11 | Ethyl octanoate M | Apricot, Brandy, Fat, Floral, Pineapple | 12.19 | 21.76 | 24.15 | 32.59 | 30.63 | 30.48 | 29.77 | 28.35 | 26.34 | 31.1 |
| (Aldehydes) 1 | 2-Methylbutanal | Almond, Cocoa, Fermented, Hazelnut, Malt | 133.61 | 149.94 | 126.15 | 150.82 | 151.81 | 125.77 | 111.69 | 170.76 | 213.57 | 138.99 |
| 2 | Butanal | Banana, Green, Pungent | 29.33 | 40.61 | 34.43 | 37.86 | 41.04 | 42.71 | 40.46 | 38.72 | 41.5 | 35.81 |
| 3 | Octanal | Citrus, Fat, Green, Oil, Pungent | 5.73 | 7.8 | 6.23 | 8.07 | 7.84 | 8.56 | 7.43 | 8.35 | 10.43 | 8.91 |
| 4 | Pentanal | Almond, Bitter, Malt, Oil, Pungent | <1 | <1 | <1 | <1 | <1 | <1 | <1 | <1 | 1.23 | <1 |
| (Terpenoids) 1 | Terpinolene | Pine | 2.75 | 3.7 | 4.09 | 6.75 | 5.44 | 5.85 | 5.18 | 5.34 | 7.96 | 5.29 |
Disclaimer/Publisher’s Note: The statements, opinions and data contained in all publications are solely those of the individual author(s) and contributor(s) and not of MDPI and/or the editor(s). MDPI and/or the editor(s) disclaim responsibility for any injury to people or property resulting from any ideas, methods, instructions or products referred to in the content. |
© 2023 by the authors. Licensee MDPI, Basel, Switzerland. This article is an open access article distributed under the terms and conditions of the Creative Commons Attribution (CC BY) license (https://creativecommons.org/licenses/by/4.0/).
Share and Cite
Wen, J.; Wang, Y.; Cao, W.; He, Y.; Sun, Y.; Yuan, P.; Sun, B.; Yan, Y.; Qin, H.; Fan, S.; et al. Comprehensive Evaluation of Ten Actinidia arguta Wines Based on Color, Organic Acids, Volatile Compounds, and Quantitative Descriptive Analysis. Foods 2023, 12, 3345. https://doi.org/10.3390/foods12183345
Wen J, Wang Y, Cao W, He Y, Sun Y, Yuan P, Sun B, Yan Y, Qin H, Fan S, et al. Comprehensive Evaluation of Ten Actinidia arguta Wines Based on Color, Organic Acids, Volatile Compounds, and Quantitative Descriptive Analysis. Foods. 2023; 12(18):3345. https://doi.org/10.3390/foods12183345
Chicago/Turabian StyleWen, Jinli, Yue Wang, Weiyu Cao, Yanli He, Yining Sun, Pengqiang Yuan, Bowei Sun, Yiping Yan, Hongyan Qin, Shutian Fan, and et al. 2023. "Comprehensive Evaluation of Ten Actinidia arguta Wines Based on Color, Organic Acids, Volatile Compounds, and Quantitative Descriptive Analysis" Foods 12, no. 18: 3345. https://doi.org/10.3390/foods12183345