
Preparation of Complementary Food for Infants and Young Children with Beef Liver: Process Optimization and Storage Quality

Abstract
:1. Introduction
2. Materials and Methods
2.1. Materials
2.2. Optimization of Preparation Technology of Beef Liver Paste as a Complementary Food for Infants and Young Children
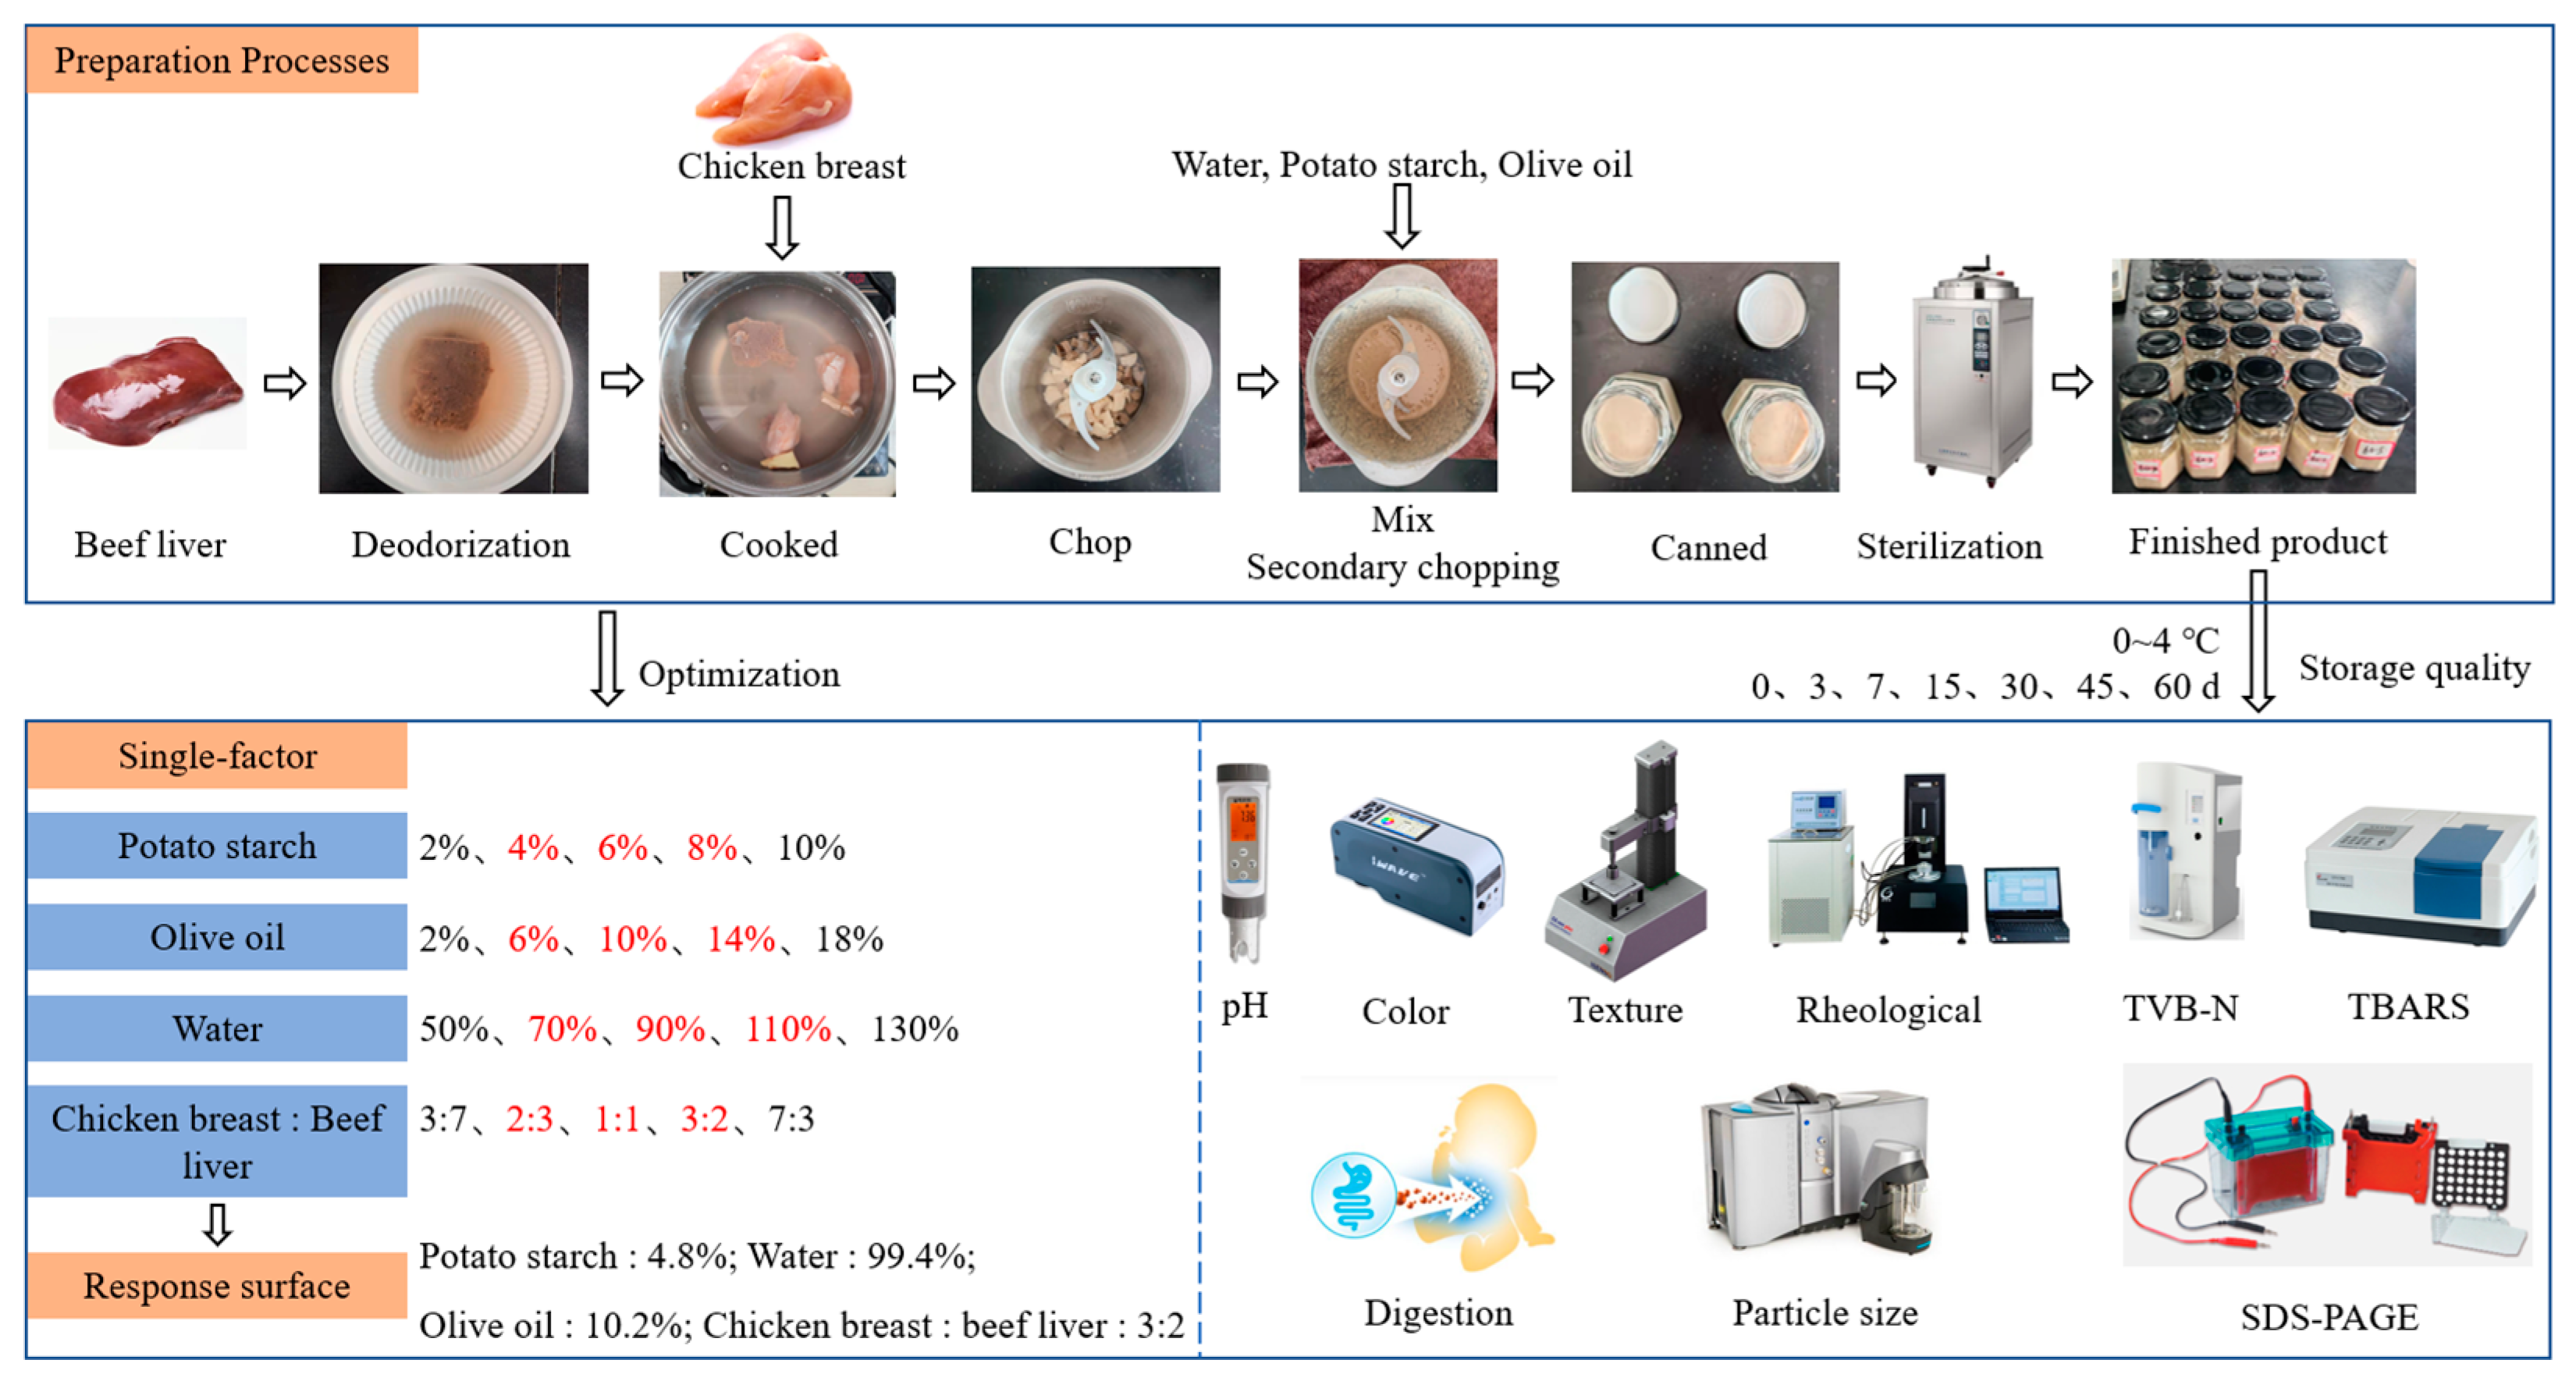
2.2.1. Preparation of Beef Liver Paste
2.2.2. Single-Factor Experiment
2.2.3. Response Surface Methodology
2.2.4. Fuzzy Modeling
2.2.5. Texture Profile Analysis
2.2.6. Determination of Nutritional Indicators of Beef Liver Paste
Chemical Composition
Amino Acid Determination
Fatty Acids
2.3. Quality Indicators for Storage of Beef Liver Paste
2.3.1. pH Value Measurement
2.3.2. Color Measurement
2.3.3. Rheological Measurement
2.3.4. TVB-N Measurement
2.3.5. TBARS Measurement
2.3.6. In Vitro Simulation of Digestion
Digestibility
Particle Size
Sodium Dodecyl Sulfate-Polyacrylamide Gel Electrophoresis (SDS-PAGE)
2.4. Statistical Analysis
3. Results and Discussion
3.1. Modeling and Optimization by Fuzzy Model
3.1.1. Sensory Evaluation Results of Fuzzy Mathematics
3.1.2. Single-Factor Experimental Results
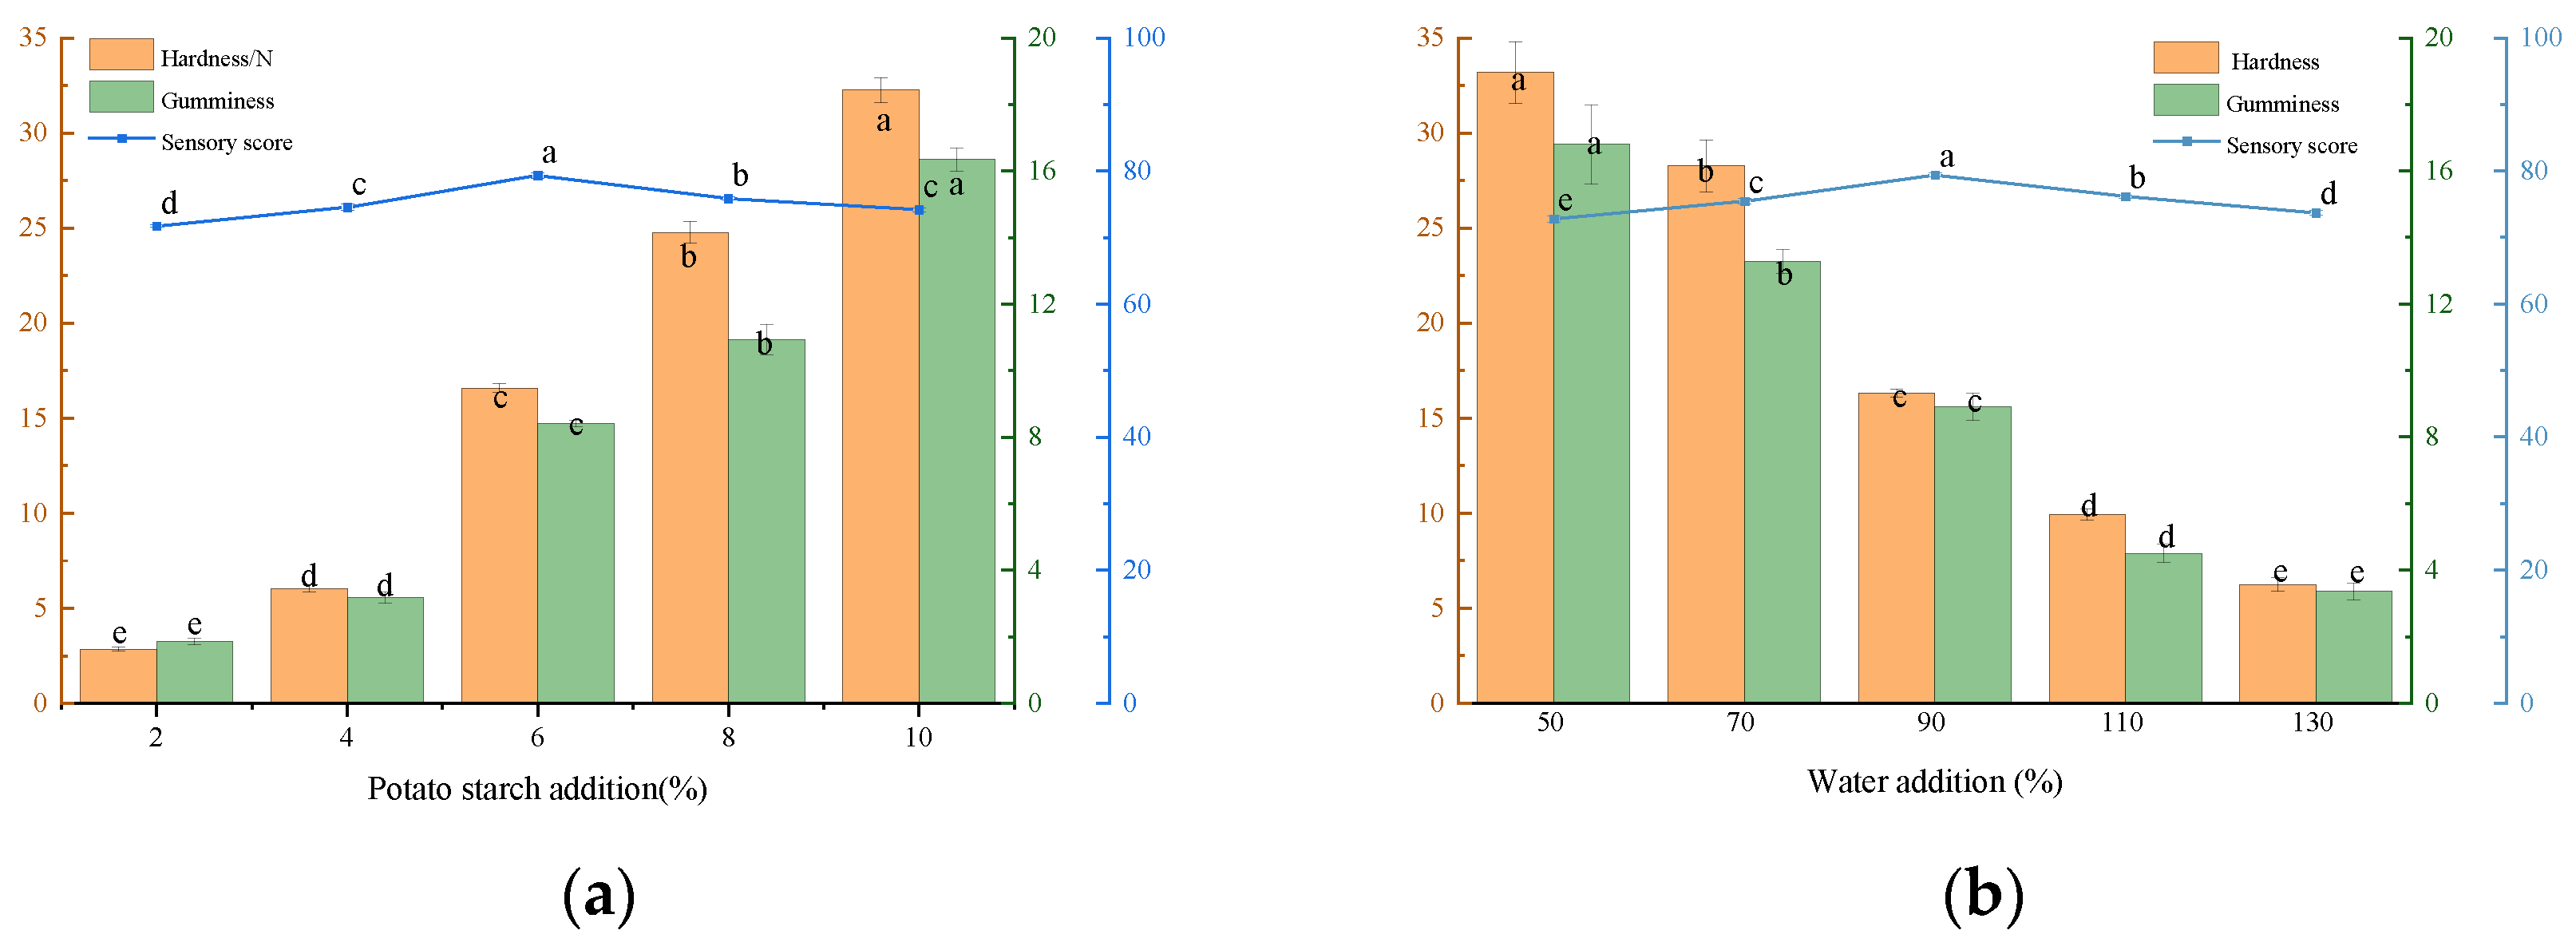
Effect of Adding Potato Starch to Beef Liver Paste on Texture and Sensory Evaluation
Effect of Adding Water to Beef Liver Paste on Texture and Sensory Evaluation
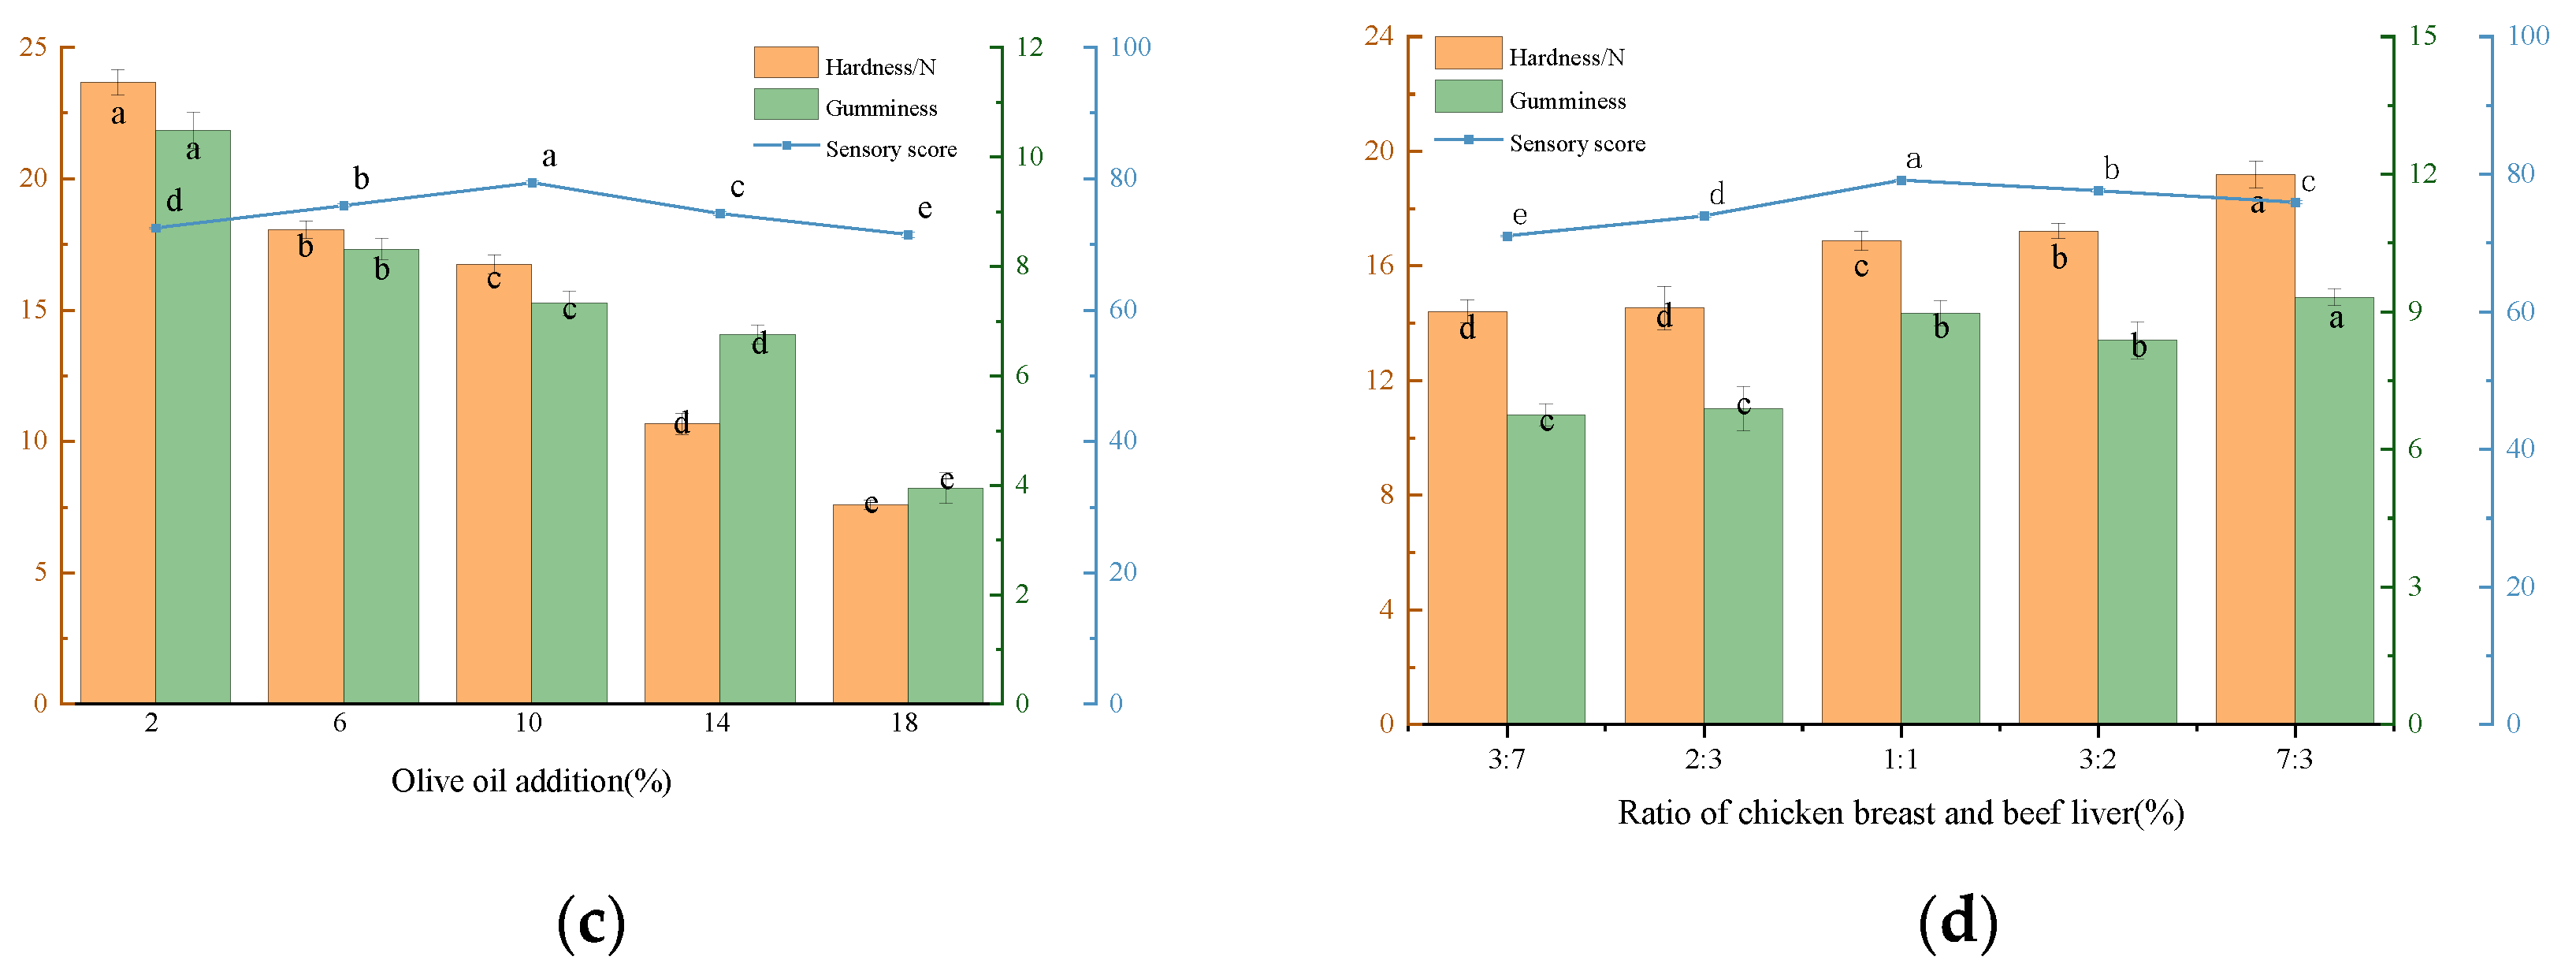
Effect of Adding Olive Oil to Beef Liver Paste on Texture and Sensory Evaluation
Effect of Adding Ratio of Chicken Breast and Beef Liver on Texture and Sensory Evaluation of Beef Liver Paste
3.1.3. Optimization
Optimization Results and Analysis of Variance
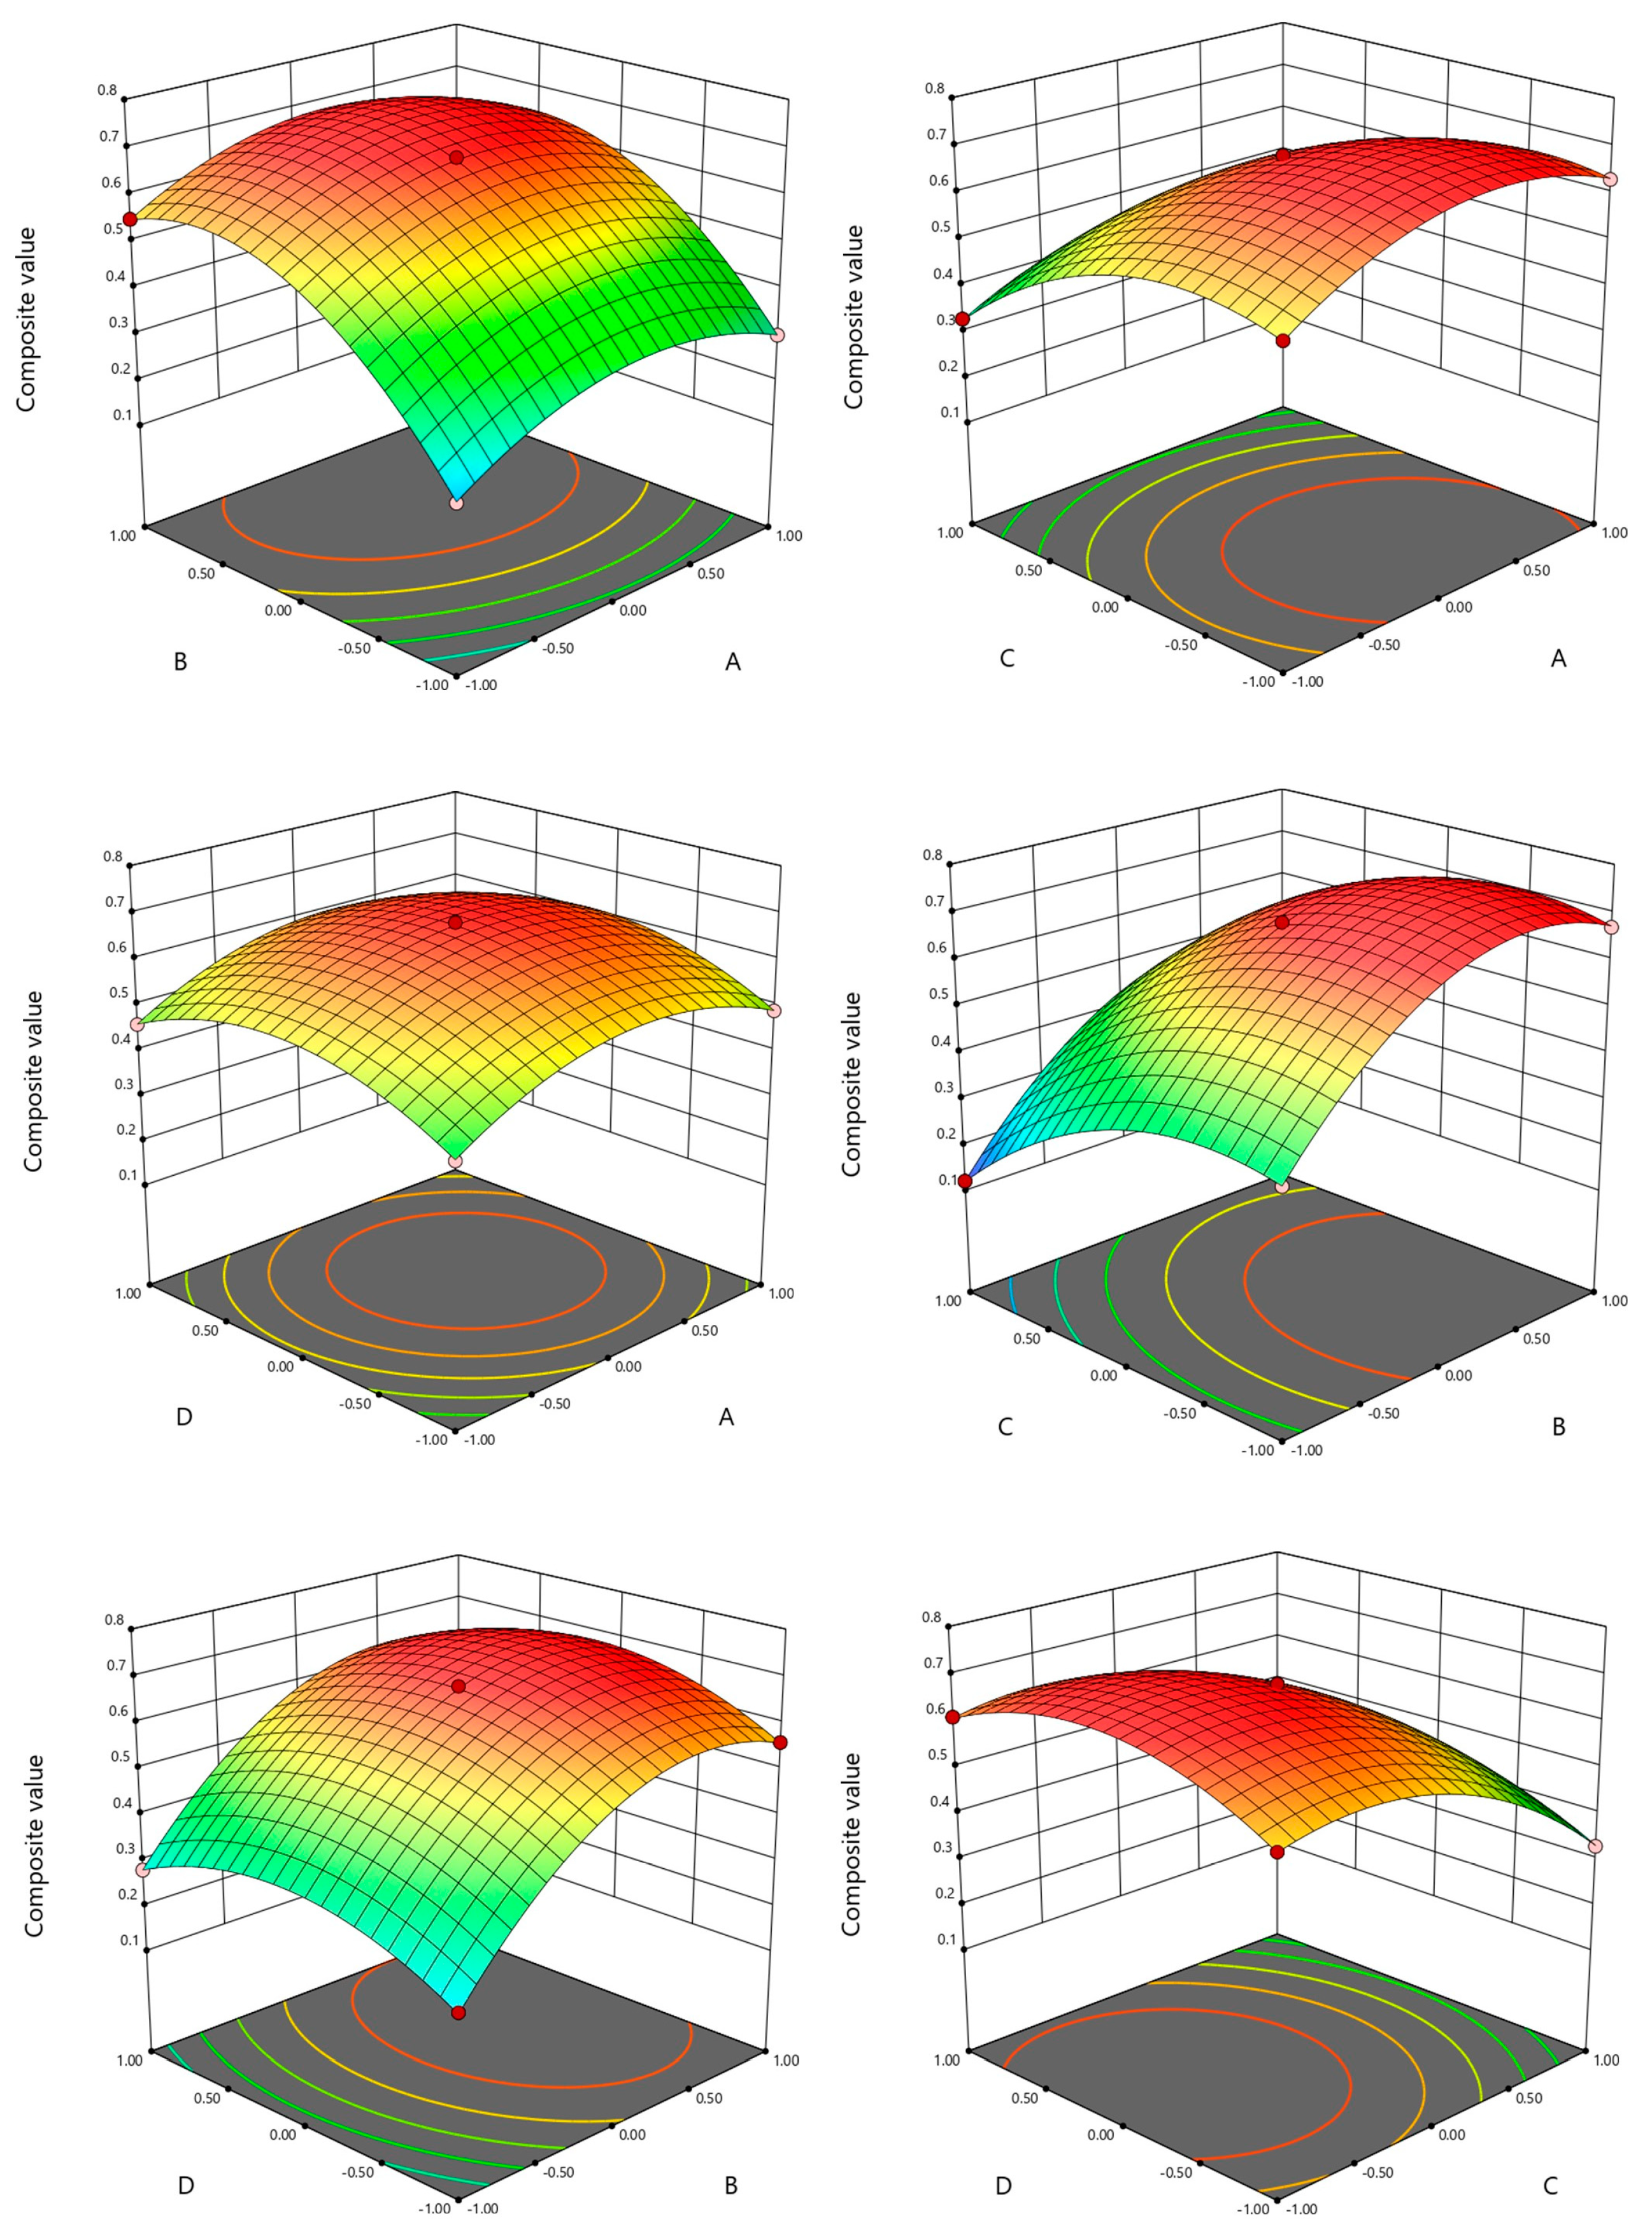
Interaction Analysis among Factors
Validation Tests
3.2. Chemical Composition
3.3. Analysis of Storage Quality of Beef Liver Paste
3.3.1. Chemical Composition and Color
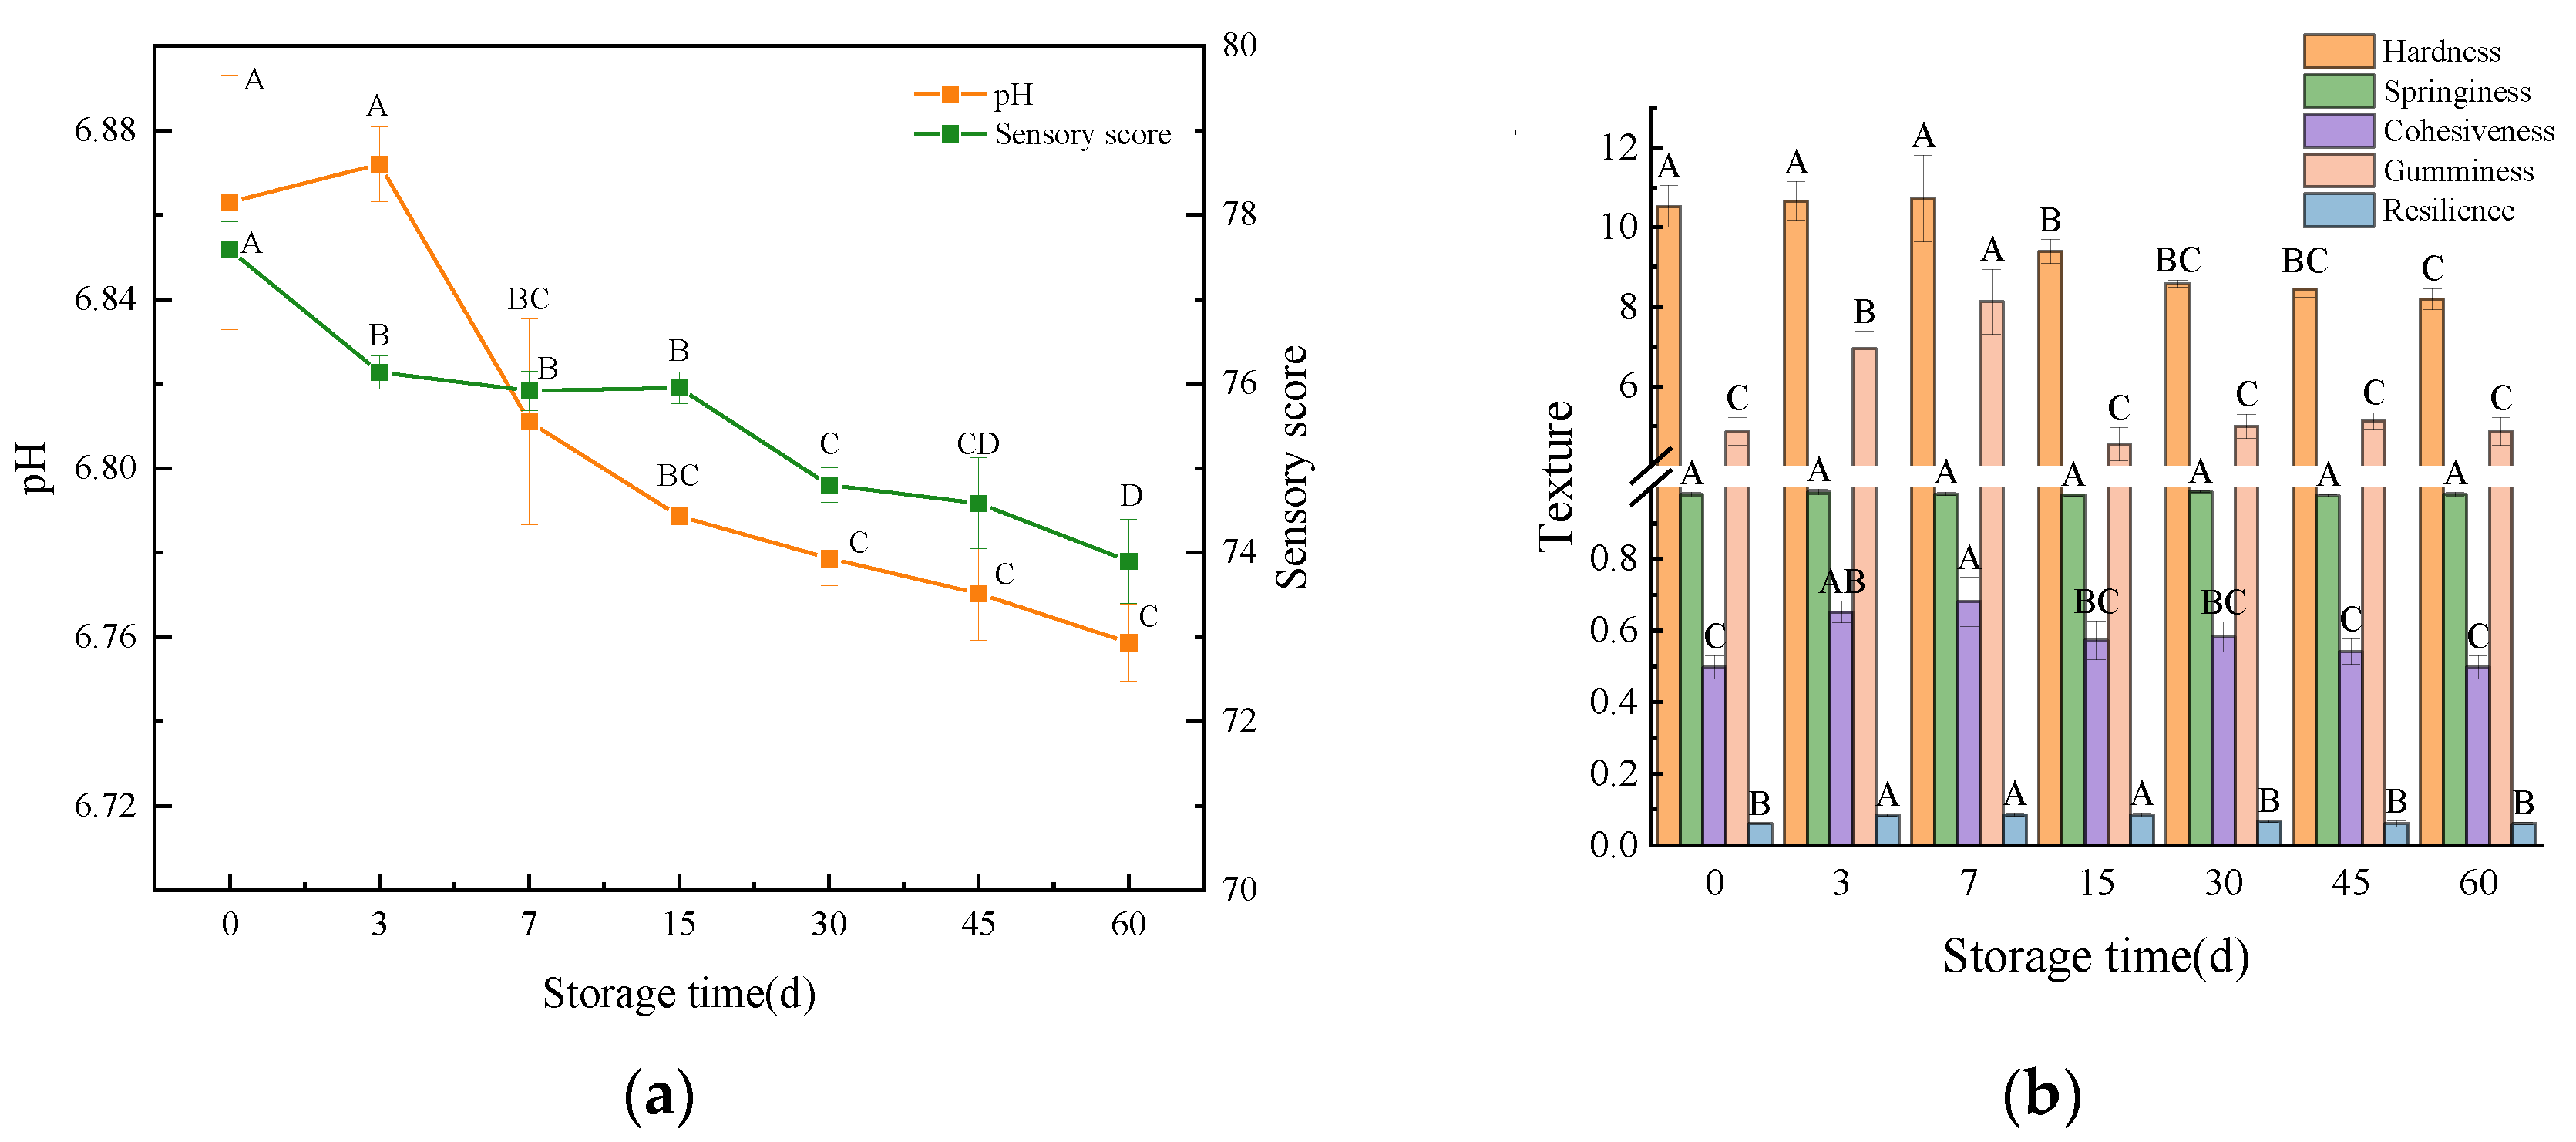
3.3.2. pH and Sensory Score
3.3.3. Texture
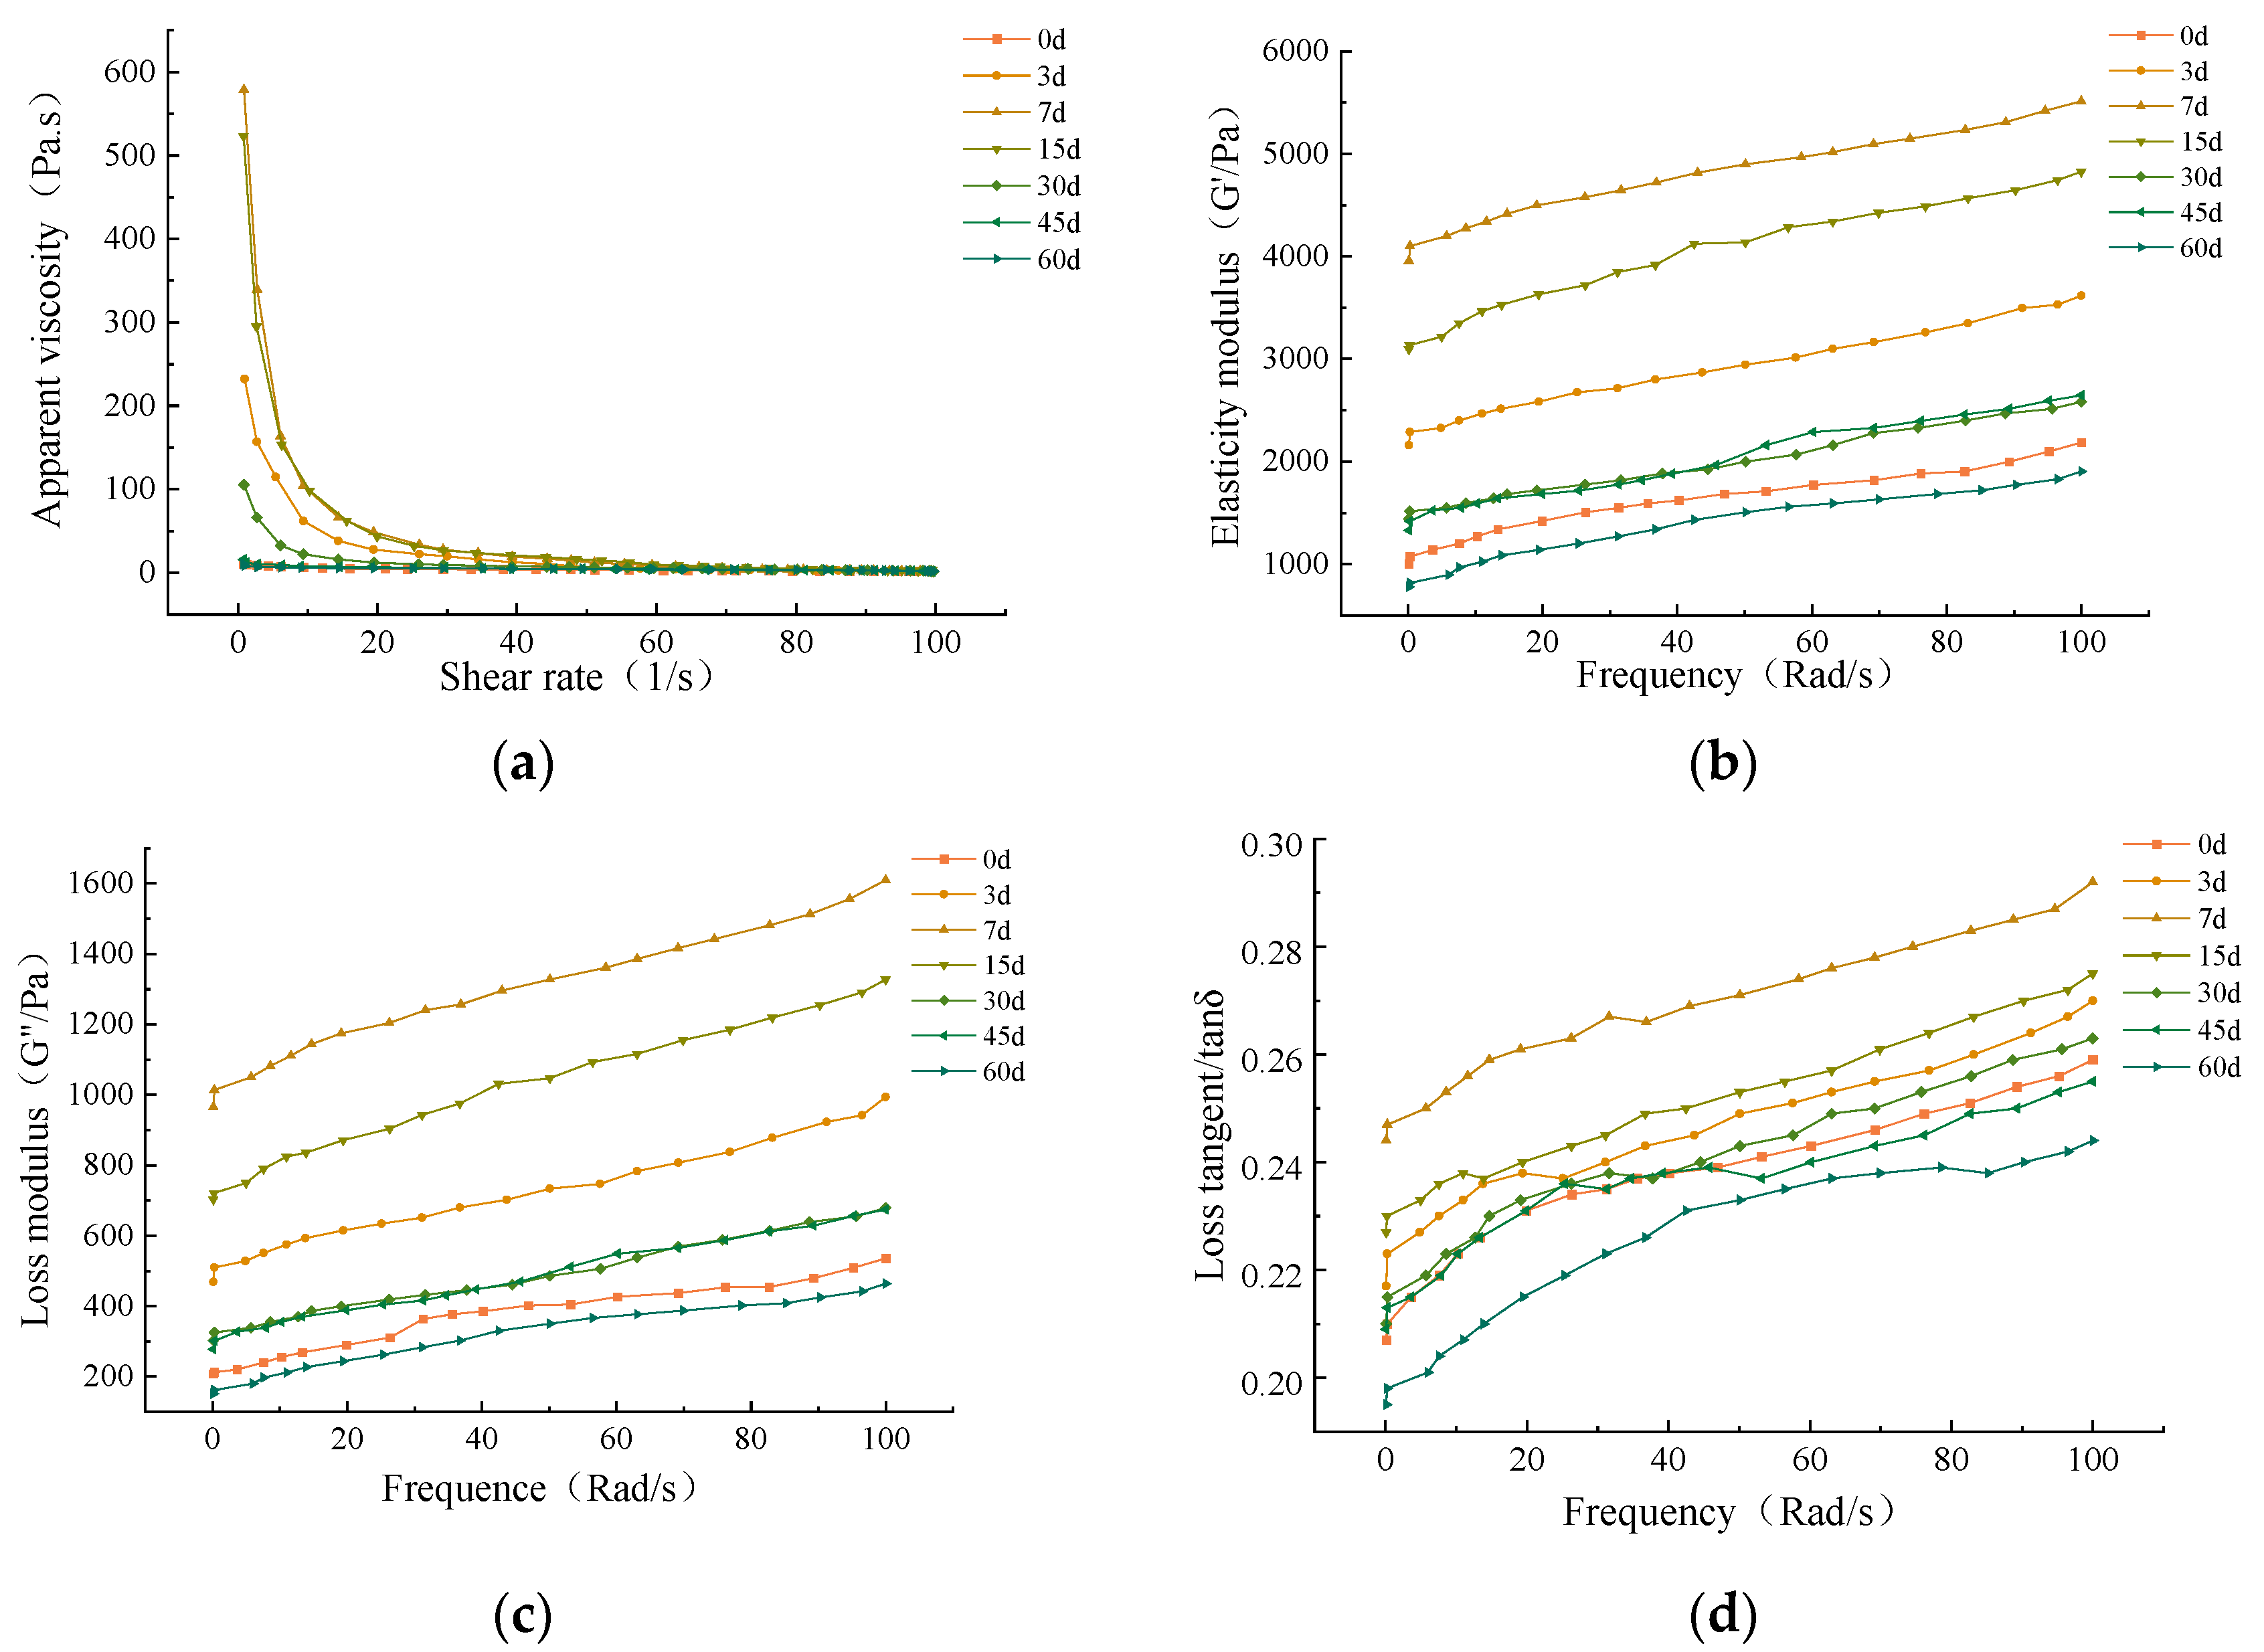
3.3.4. Rheological Properties
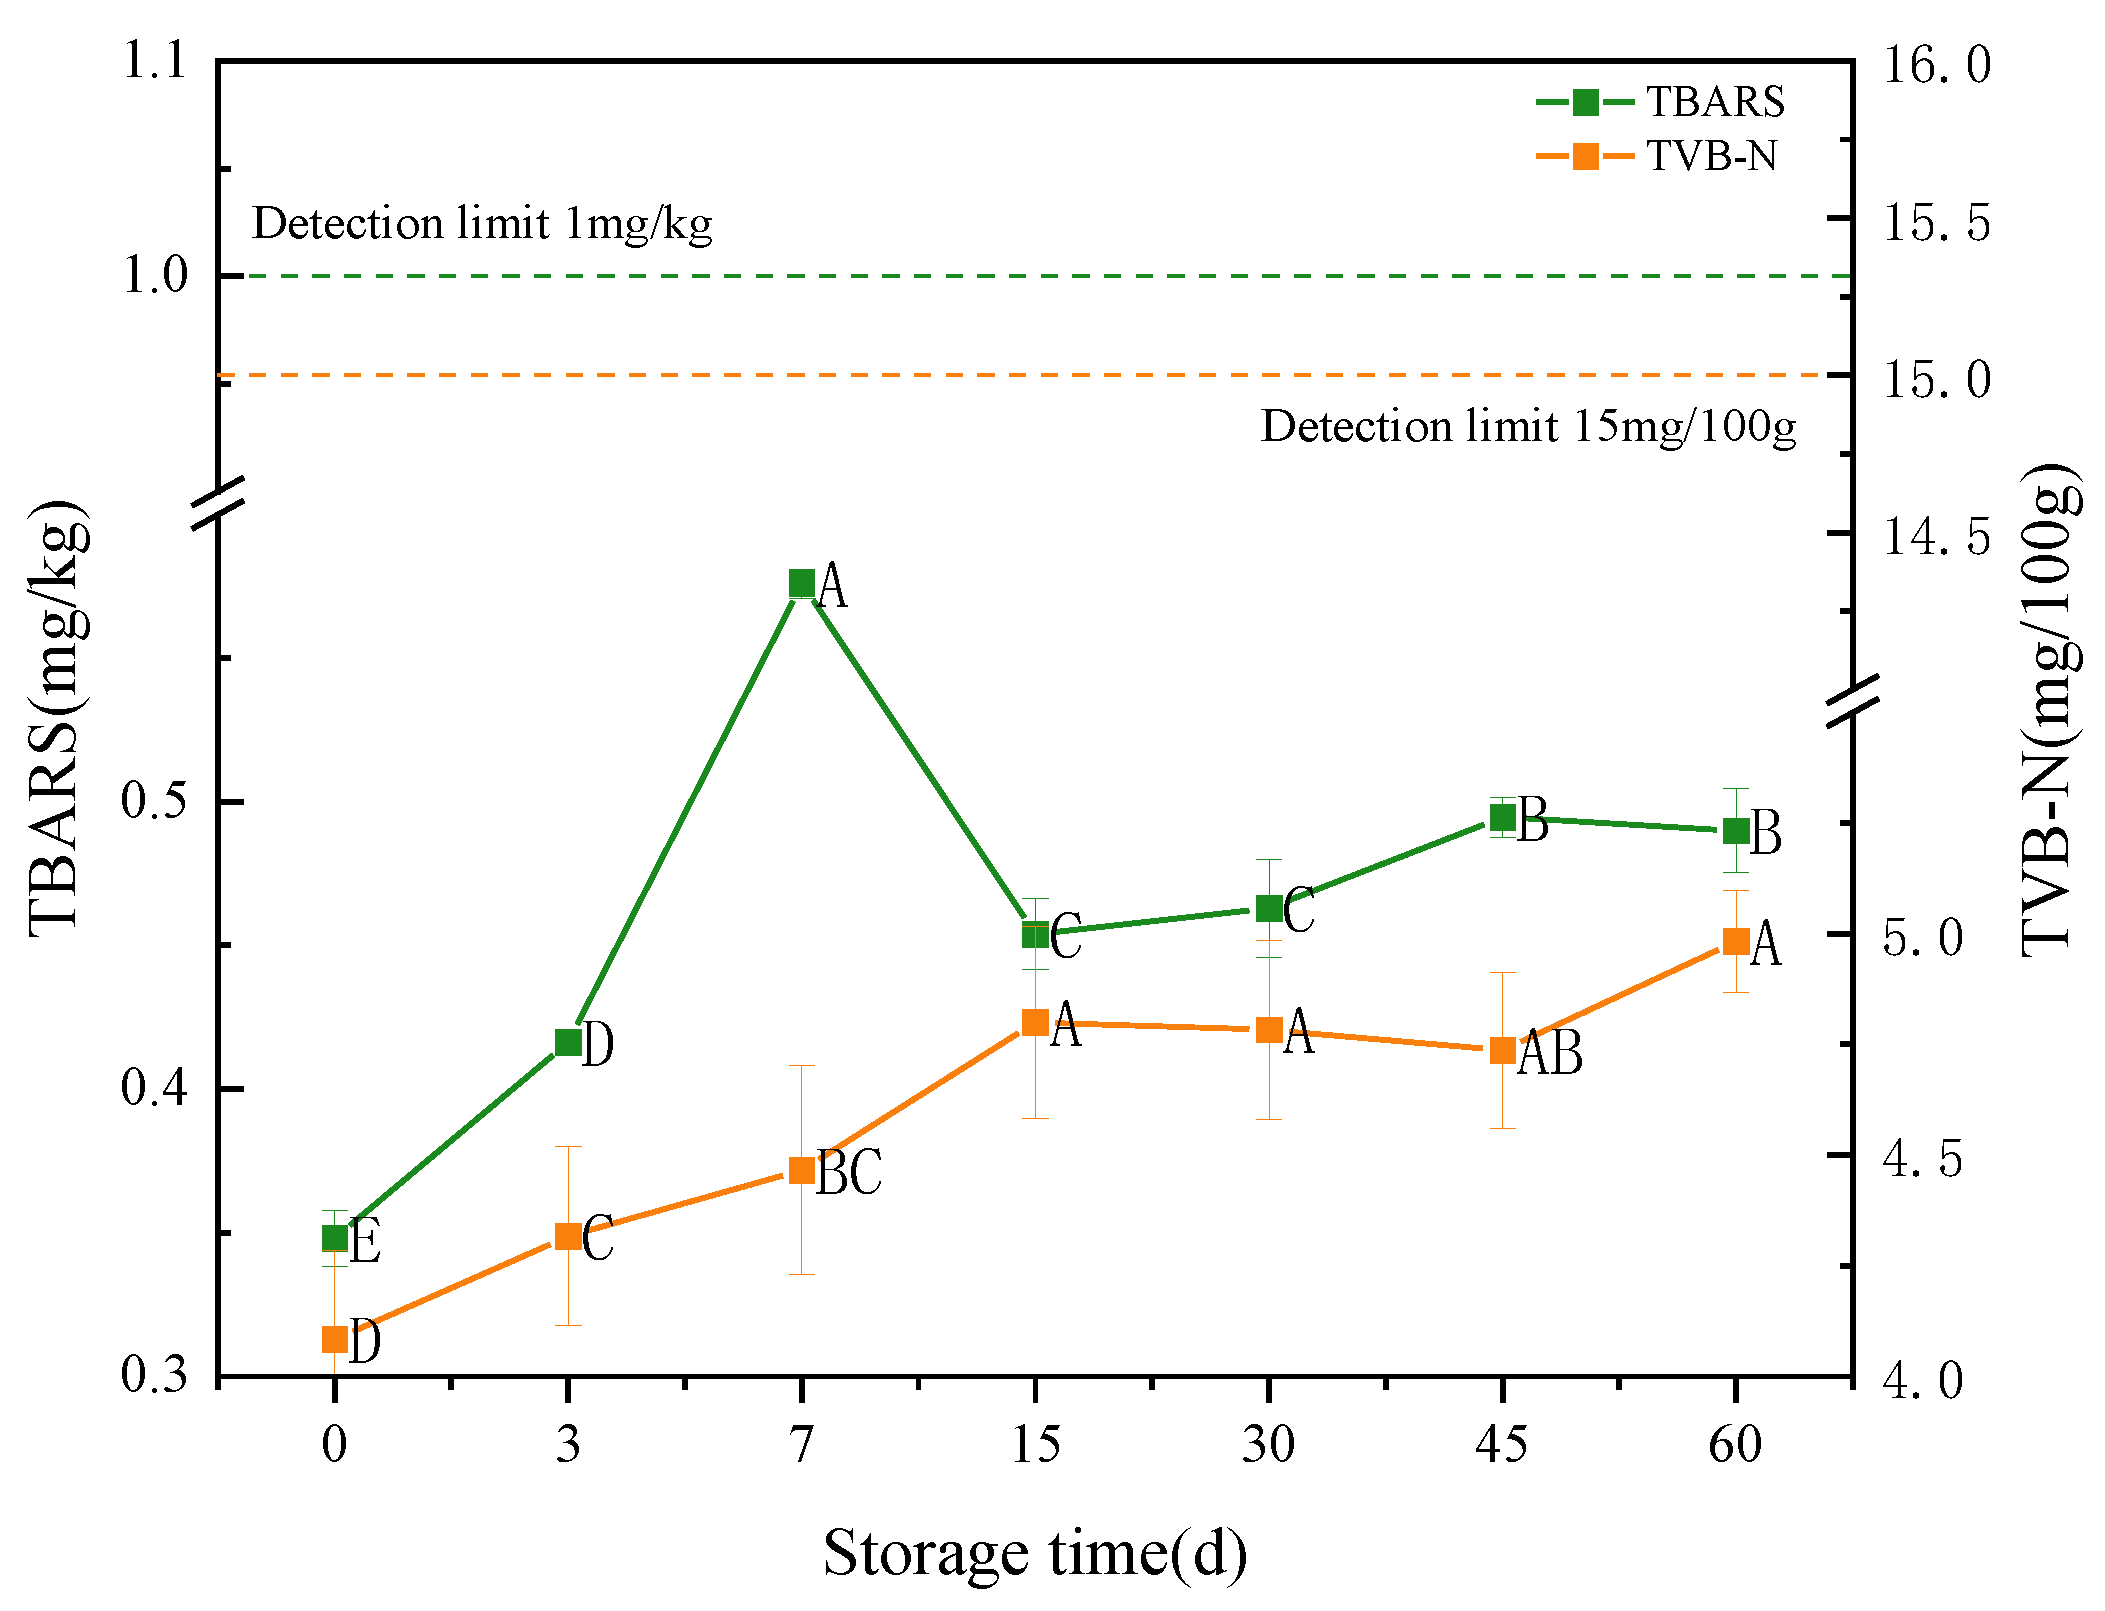
3.3.5. TBARS and TVB-N
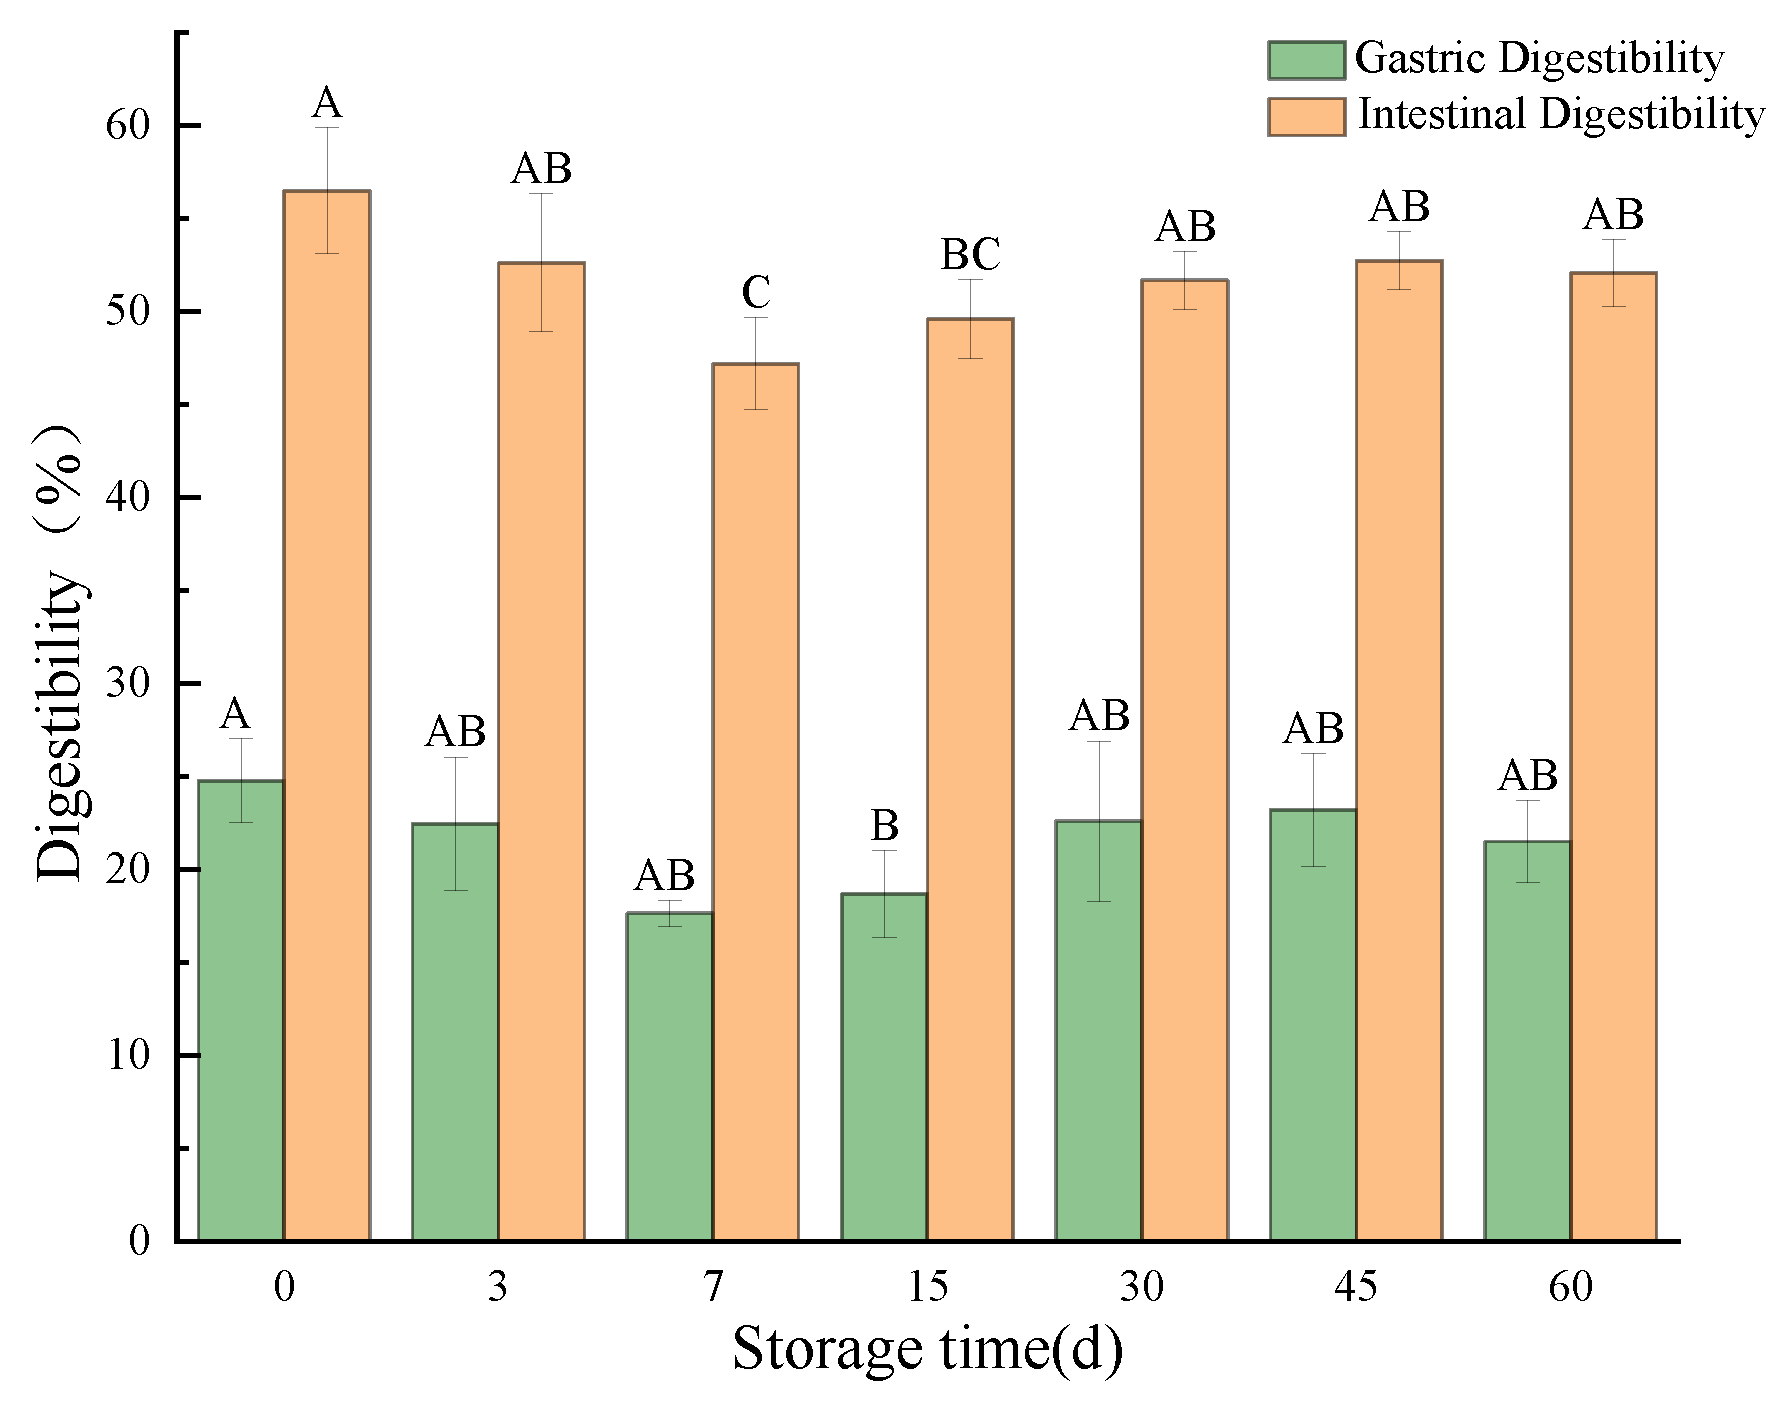
3.3.6. In Vitro Simulated Digestion Evaluation
Digestibility
Particle Size
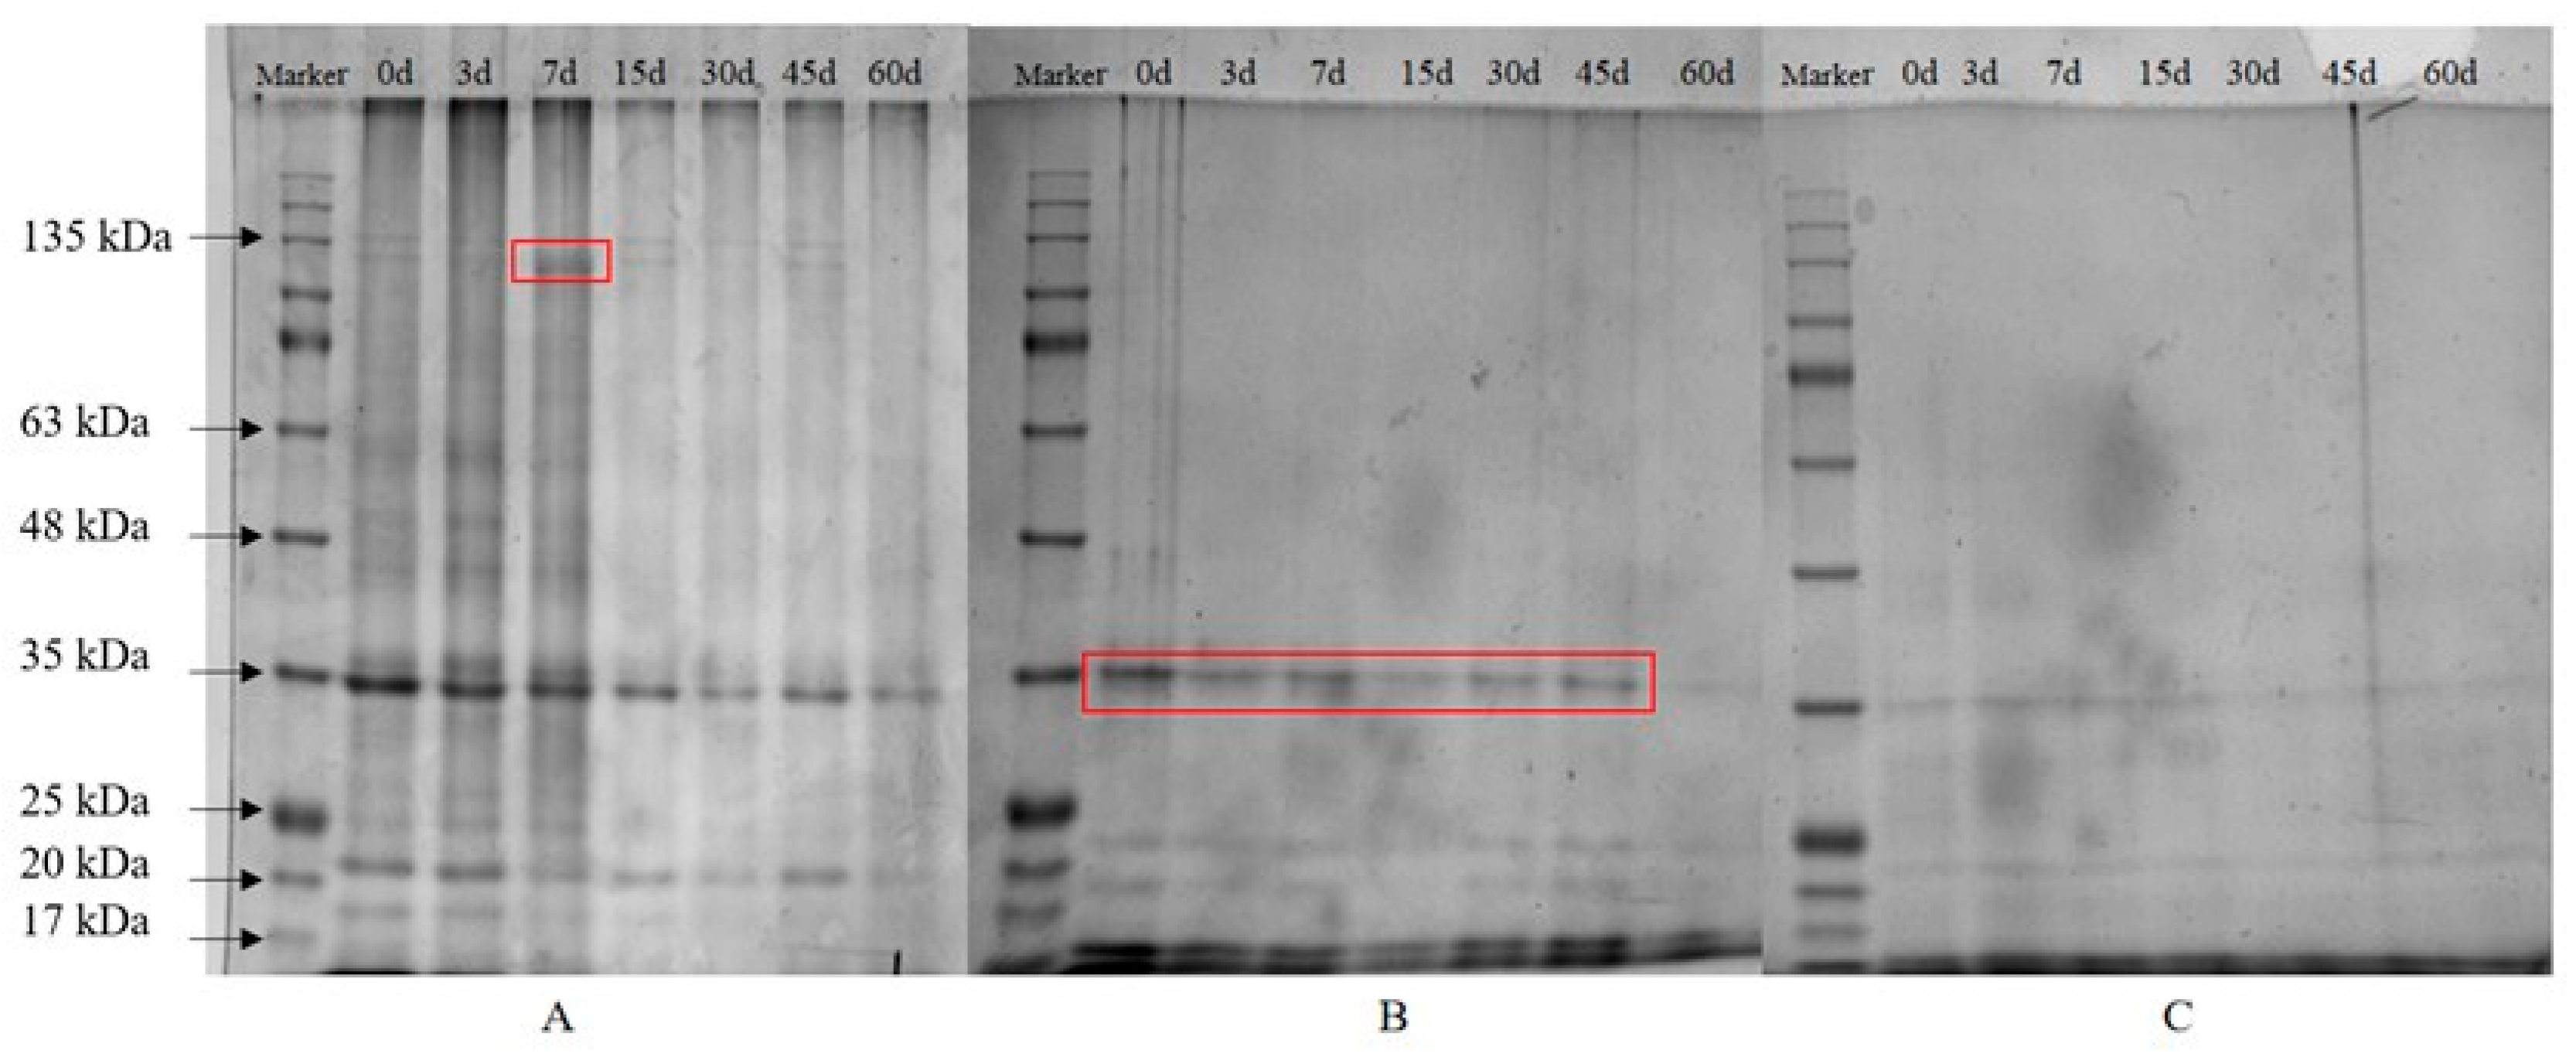
SDS-PAGE
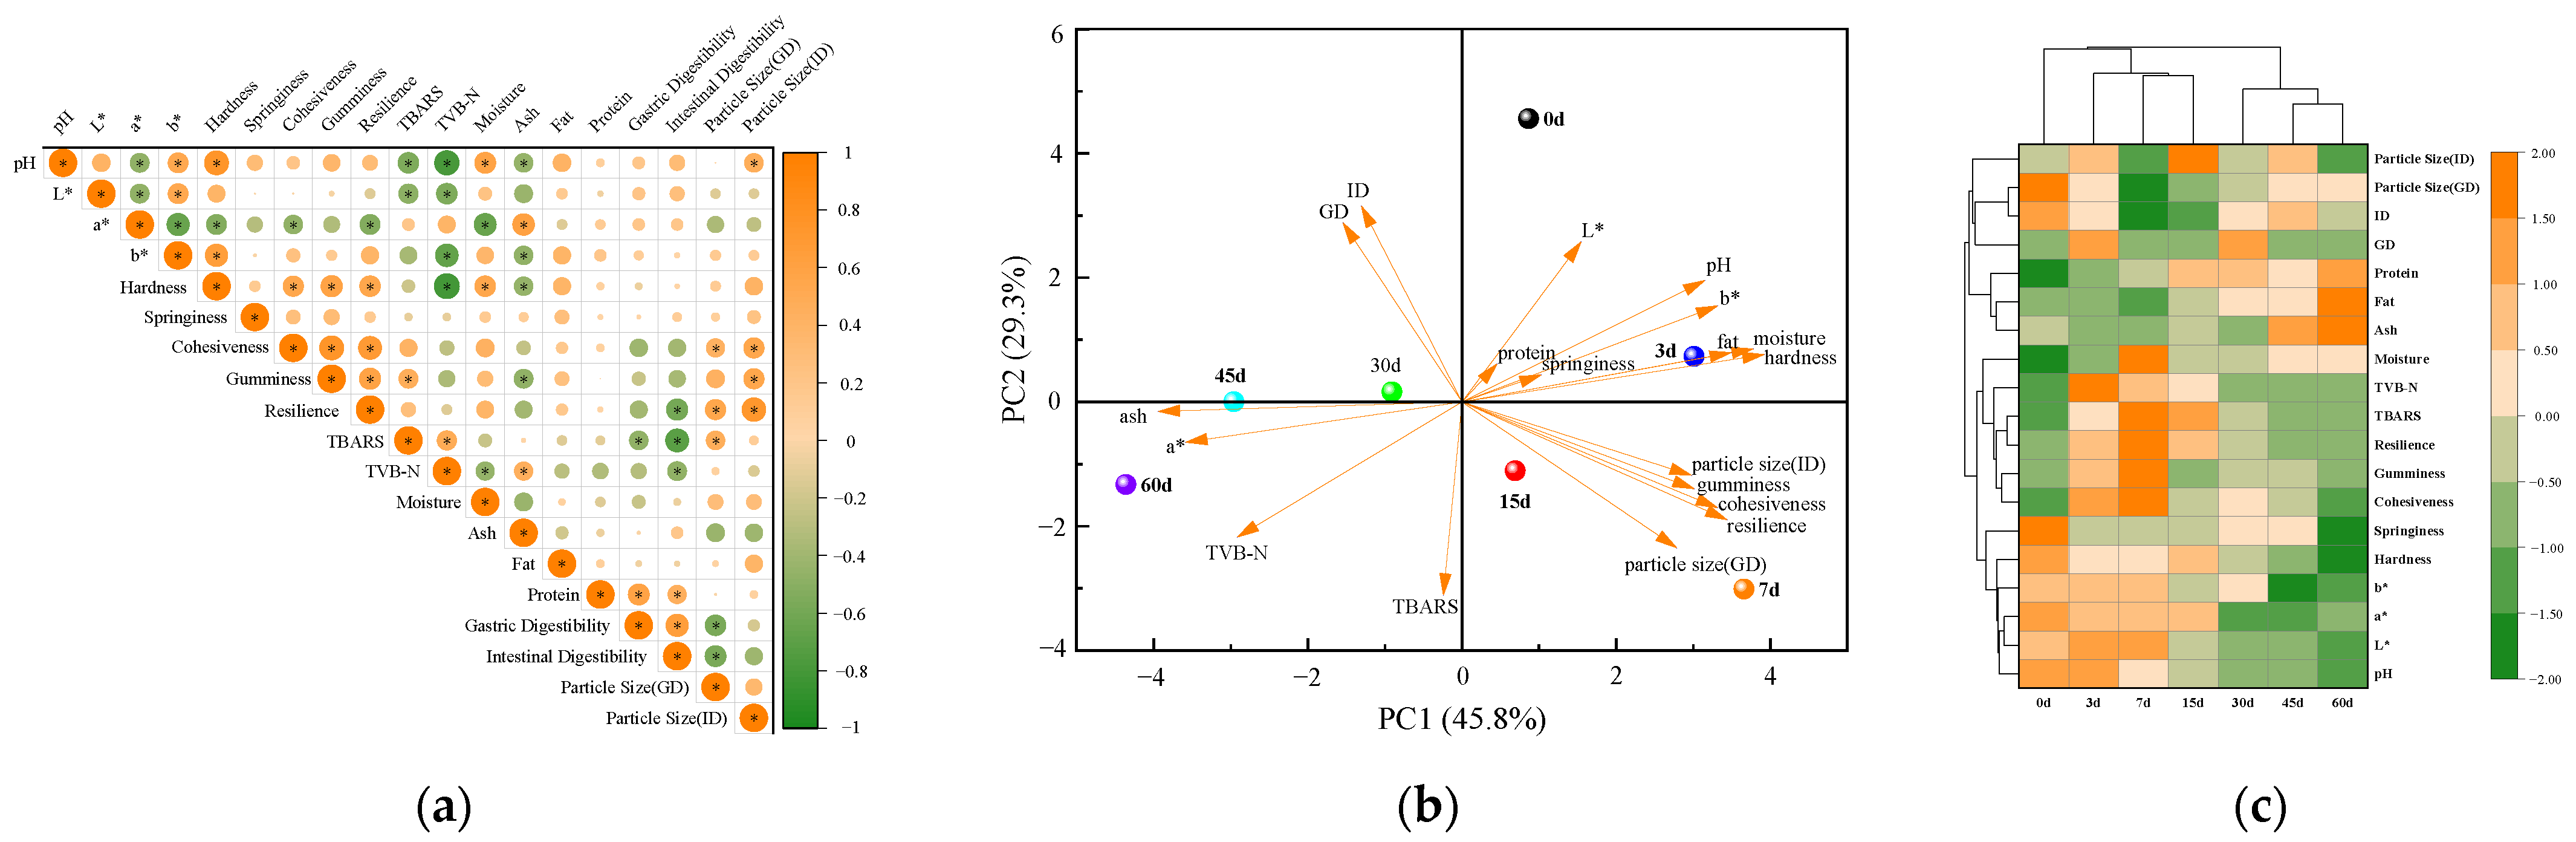
3.4. Correlation Analysis and Principal Component Analysis
3.5. Cluster Analysis
4. Conclusions
Author Contributions
Funding
Data Availability Statement
Acknowledgments
Conflicts of Interest
References
- Zielinska, M.A.; Rust, P.; Masztalerz-Kozubek, D.; Bichler, J.; Hamulka, J. Factors Influencing the Age of Complementary Feeding-A Cross-Sectional Study from Two European Countries. Int. J. Environ. Res. Public Health 2019, 16, 3799. [Google Scholar] [CrossRef] [Green Version]
- Day, L.; Cakebread, J.A.; Loveday, S.M. Food proteins from animals and plants: Differences in the nutritional and functional properties. Trends Food Sci. Technol. 2022, 119, 428–442. [Google Scholar] [CrossRef]
- Silva Ms, A.J.; Dahm Ms, O.J.; Hellberg, R.S. Bovine Liver Supplement Labeling Practices and Compliance with U.S. Regulations. J. Diet. Suppl. 2022, 19, 4–19. [Google Scholar] [CrossRef]
- Bailey, R.L.; West, K.P., Jr.; Black, R.E. The epidemiology of global micronutrient deficiencies. Ann. Nutr. Metab. 2015, 66 (Suppl. S2), 22–33. [Google Scholar] [CrossRef]
- Troen, A.M. Folate and vitamin B12: Function and importance in cognitive development. Nestle Nutr. Inst. Workshop Ser. 2012, 70, 161–171. [Google Scholar]
- Buzała, M.; Janicki, B.; Buzała, M.; Słomka, A. Heme iron in meat as the main source of iron in the human diet. J. Elem. 2015, 21, 303–314. [Google Scholar] [CrossRef]
- Wyness, L. The role of red meat in the diet: Nutrition and health benefits. Proc. Nutr. Soc. 2016, 75, 227–232. [Google Scholar] [CrossRef]
- Alao, B.; Falowo, A.; Chulayo, A.; Muchenje, V. The Potential of Animal By-Products in Food Systems: Production, Prospects and Challenges. Sustainability 2017, 9, 1089. [Google Scholar] [CrossRef] [Green Version]
- Delgado-Pando, G.; Cofrades, S.; Rodriguez-Salas, L.; Jimenez-Colmenero, F. A healthier oil combination and konjac gel as functional ingredients in low-fat pork liver pate. Meat Sci. 2011, 88, 241–248. [Google Scholar] [CrossRef]
- Eaton, J.C.; Rothpletz-Puglia, P.; Dreker, M.R.; Iannotti, L.; Lutter, C.; Kaganda, J.; Rayco-Solon, P. Effectiveness of provision of animal-source foods for supporting optimal growth and development in children 6 to 59 months of age. Cochrane Database Syst. Rev. 2019, 2, CD012818. [Google Scholar] [CrossRef] [PubMed]
- Alexy, U.; Dilger, J.J.; Koch, S. Commercial Complementary Food in Germany: A 2020 Market Survey. Nutrients 2022, 14, 3762. [Google Scholar] [CrossRef]
- Scott, J.A.; Gee, G.; Devenish, G.; Ha, D.; Do, L. Determinants and Sources of Iron Intakes of Australian Toddlers: Findings from the SMILE Cohort Study. Int. J. Environ. Res. Public Health 2019, 16, 181. [Google Scholar] [CrossRef] [PubMed] [Green Version]
- Pachón, H.; Domínguez, M.R.L.; Creed-Kanashiro, H.; Stoltzfus, R.J.J.F.; Bulletin, N. Acceptability and safety of novel infant porridges containing lyophilized meat powder and iron-fortified wheat flour. Food Nutr. Bull. 2007, 28, 35–46. [Google Scholar] [CrossRef] [PubMed] [Green Version]
- Duizer, L.M.; Diana, A.; Rathomi, H.S.; Luftimas, D.E.; Rahmannia, S.; Santi, W.; Nugraha, G.I.; Haszard, J.J.; Gibson, R.S.; Houghton, L.A. An Acceptability Trial of Desiccated Beef Liver and Meat Powder as Potential Fortifiers of Complementary Diets of Young Children in Indonesia. J. Food Sci. 2017, 82, 2206–2212. [Google Scholar] [CrossRef]
- Amaral, D.; Silva, F.A.P.d.; Bezerra, T.K.A.; Guerra, I.C.D.; Dalmás, P.S.; Pimentel, K.M.L.; Madruga, M.S. Chemical and sensory quality of sheep liver pâté prepared with ‘variety meat’. Semin. Ciências Agrárias 2013, 34, 1741–1752. [Google Scholar] [CrossRef] [Green Version]
- Demonteil, L.; Tournier, C.; Marduel, A.; Dusoulier, M.; Weenen, H.; Nicklaus, S. Longitudinal study on acceptance of food textures between 6 and 18 months. Food Qual. Prefer. 2019, 71, 54–65. [Google Scholar] [CrossRef] [Green Version]
- Amiza, M.A.; Ng, S.C. Effects of Surimi-to-Silver Catfish Ratio and Potato Starch Concentration on the Properties of Fish Sausage. J. Aquat. Food Product. Technol. 2013, 24, 213–226. [Google Scholar] [CrossRef]
- Lin, A.H. Structure and Digestion of Common Complementary Food Starches. J. Pediatr. Gastroenterol. Nutr. 2018, 66 (Suppl. S3), S35–S38. [Google Scholar] [CrossRef]
- Barbut, S.; Tiensa, B.E.; Marangoni, A.G. Partial fat replacement in liver pâté using canola oil organogel. LWT 2021, 139, 110428. [Google Scholar] [CrossRef]
- Rezler, R.; Krzywdzińska-Bartkowiak, M.; Piątek, M. The influence of the substitution of fat with modified starch on the quality of pork liver pâtés. LWT 2021, 135, 110264. [Google Scholar] [CrossRef]
- Bilska, A.; Waszkowiak, K.; Blaszyk, M.; Rudzinska, M.; Kowalski, R. Effect of liver pate enrichment with flaxseed oil and flaxseed extract on lipid composition and stability. J. Sci. Food Agric. 2018, 98, 4112–4120. [Google Scholar] [CrossRef]
- Bourlieu, C.; Menard, O.; Bouzerzour, K.; Mandalari, G.; Macierzanka, A.; Mackie, A.R.; Dupont, D. Specificity of infant digestive conditions: Some clues for developing relevant in vitro models. Crit. Rev. Food Sci. Nutr. 2014, 54, 1427–1457. [Google Scholar] [CrossRef] [PubMed]
- Lee, S.; Jo, K.; Jeong, H.G.; Choi, Y.S.; Yong, H.I.; Jung, S. Understanding protein digestion in infants and the elderly: Current in vitro digestion models. Crit. Rev. Food Sci. Nutr. 2021, 63, 975–992. [Google Scholar] [CrossRef] [PubMed]
- Guo, Z.; Ge, X.; Yu, Q.L.; Han, L.; Zhao, H.; Cao, H. Quality predictive models for bovine liver during storage and changes in volatile flavors. Int. J. Food Prop. 2018, 21, 2452–2468. [Google Scholar] [CrossRef] [Green Version]
- Box, G.E.P.; Behnken, D.W. Some New Three Level Designs for the Study of Quantitative Variables. Technometrics 1960, 2, 455–475. [Google Scholar] [CrossRef]
- Terrasa, A.M.; Dello Staffolo, M.; Tomás, M.C. Nutritional improvement and physicochemical evaluation of liver pâté formulations. LWT-Food Sci. Technol. 2016, 66, 678–684. [Google Scholar] [CrossRef] [Green Version]
- Hamed Hammad Mohammed, H.; Jin, G.; Ma, M.; Khalifa, I.; Shukat, R.; Elkhedir, A.E.; Zeng, Q.; Noman, A.E. Comparative characterization of proximate nutritional compositions, microbial quality and safety of camel meat in relation to mutton, beef, and chicken. LWT 2020, 118, 108714. [Google Scholar] [CrossRef]
- Xiong, G.; Wang, P.; Zheng, H.; Xu, X.; Zhu, Y.; Zhou, G. Effects of Plant Oil Combinations Substituting Pork Back-Fat Combined with Pre-Emulsification on Physicochemical, Textural, Microstructural and Sensory Properties of Spreadable Chicken Liver PaTE. J. Food Qual. 2016, 39, 331–341. [Google Scholar] [CrossRef]
- Sogut, E.; Seydim, A.C. The effects of chitosan- and polycaprolactone-based bilayer films incorporated with grape seed extract and nanocellulose on the quality of chicken breast fillets. LWT 2019, 101, 799–805. [Google Scholar] [CrossRef]
- Huang, X.; Sun, L.; Dong, K.; Wang, G.; Luo, P.; Tang, D.; Huang, Q. Mulberry fruit powder enhanced the antioxidant capacity and gel properties of hammered minced beef: Oxidation degree, rheological, and structure. LWT 2022, 154, 112648. [Google Scholar] [CrossRef]
- Cheng, Y.; Hu, J.; Wu, S. Chitosan based coatings extend the shelf-life of beef slices during refrigerated storage. LWT 2021, 138, 110694. [Google Scholar] [CrossRef]
- Zhang, J.; Wang, Y.; Pan, D.D.; Cao, J.X.; Shao, X.F.; Chen, Y.J.; Sun, Y.Y.; Ou, C.R. Effect of black pepper essential oil on the quality of fresh pork during storage. Meat Sci. 2016, 117, 130–136. [Google Scholar] [CrossRef] [PubMed]
- Luo, M.; Shan, K.; Zhang, M.; Ke, W.; Zhao, D.; Nian, Y.; Wu, J.; Li, C. Application of ultrasound treatment for improving the quality of infant meat puree. Ultrason. Sonochem. 2021, 80, 105831. [Google Scholar] [CrossRef] [PubMed]
- Lee, S.; Jo, K.; Hur, S.J.; Choi, Y.S.; Kim, H.J.; Jung, S. Low Protein Digestibility of Beef Puree in Infant In Vitro Digestion Model. Food Sci. Anim. Resour. 2019, 39, 1000–1007. [Google Scholar] [CrossRef] [Green Version]
- Alcázar-Alay, S.C.; Meireles, M.A.A. Physicochemical properties, modifications and applications of starches from different botanical sources. Food Sci. Technol. 2015, 35, 215–236. [Google Scholar] [CrossRef] [Green Version]
- Ilhamto, N.; Keller, H.H.; Duizer, L.M. The effect of varying ingredient composition on the sensory and nutritional properties of a pureed meat and vegetable. J. Nutr. Gerontol. Geriatr. 2014, 33, 229–248. [Google Scholar] [CrossRef] [PubMed]
- Varga-Visi, É.; Toxanbayeva, B.; Andrássyné Baka, G.; Romvári, R. Textural properties of turkey sausage using pea fiber or potato starch as fat replacers. Acta Aliment. 2018, 47, 36–43. [Google Scholar] [CrossRef]
- Tournier, C.; Bernad, C.; Madrelle, J.; Delarue, J.; Cuvelier, G.; Schwartz, C.; Nicklaus, S. Fostering infant food texture acceptance: A pilot intervention promoting food texture introduction between 8 and 15 months. Appetite 2021, 158, 104989. [Google Scholar] [CrossRef]
- Chen, J.; Lolivret, L. The determining role of bolus rheology in triggering a swallowing. Food Hydrocoll. 2011, 25, 325–332. [Google Scholar] [CrossRef]
- Delgado-Pando, G.; Cofrades, S.; Ruiz-Capillas, C.; Triki, M.; Jimenez-Colmenero, F. Low-fat pork liver pates enriched with n-3 PUFA/konjac gel: Dynamic rheological properties and technological behaviour during chill storage. Meat Sci. 2012, 92, 44–52. [Google Scholar] [CrossRef]
- Li, R.; Pande, G.; Sabir, J.S.M.; Baeshen, N.A.; Akoh, C.C. Enrichment of Refined Olive Oil with Palmitic and Docosahexaenoic Acids to Produce a Human Milk Fat Analogue. J. Am. Oil Chem. Soc. 2014, 91, 1377–1385. [Google Scholar] [CrossRef]
- Morales-Irigoyen, E.E.; Severiano-Perez, P.; Rodriguez-Huezo, M.E.; Totosaus, A. Textural, physicochemical and sensory properties compensation of fat replacing in pork liver pate incorporating emulsified canola oil. Food Sci. Technol. Int. 2012, 18, 413–421. [Google Scholar] [CrossRef] [PubMed]
- Lee, N.; Kwak, H.S.; Joo, J.-y.; Kang, J.; Lee, Y. Effects of Partial Replacement of Pork Meat with Chicken or Duck Meat on the Texture, Flavor, and Consumer Acceptance of Sausage. J. Food Qual. 2018, 2018, 6972848. [Google Scholar] [CrossRef] [Green Version]
- Kim, K.B.; Pak, W.M.; Kang, J.E.; Park, H.M.; Kim, B.R.; Ahn, D.H. Effects of Chicken Breast Meat on Quality Properties of Mackerel (Scomber japonicus) Sausage. Korean J. Food Sci. Anim. Resour. 2014, 34, 122–126. [Google Scholar] [CrossRef] [PubMed]
- Munekata, P.E.S.; Dominguez, R.; Campagnol, P.C.B.; Franco, D.; Trindade, M.A.; Lorenzo, J.M. Effect of natural antioxidants on physicochemical properties and lipid stability of pork liver pate manufactured with healthy oils during refrigerated storage. J. Food Sci. Technol. 2017, 54, 4324–4334. [Google Scholar] [CrossRef] [PubMed]
- Lorenzo, J.M.; Domínguez, R.; Agregán, R.; Gonçalves, A. Effect of fat replacement by olive oil on the physico-chemical properties, fatty acids, cholesterol and tocopherol content of pâté. Grasas Aceites 2016, 67, e133. [Google Scholar] [CrossRef]
- Ettinger, L.; Keller, H.H.; Duizer, L.M. Characterizing commercial pureed foods: Sensory, nutritional, and textural analysis. J. Nutr. Gerontol. Geriatr. 2014, 33, 179–197. [Google Scholar] [CrossRef]
- Parikh, P.; Semba, R.; Manary, M.; Swaminathan, S.; Udomkesmalee, E.; Bos, R.; Poh, B.K.; Rojroongwasinkul, N.; Geurts, J.; Sekartini, R.; et al. Animal source foods, rich in essential amino acids, are important for linear growth and development of young children in low- and middle-income countries. Matern. Child. Nutr. 2022, 18, e13264. [Google Scholar] [CrossRef]
- Tang, M.; Weaver, N.E.; Berman, L.M.; Brown, L.D.; Hendricks, A.E.; Krebs, N.F. Different Blood Metabolomics Profiles in Infants Consuming a Meat- or Dairy-Based Complementary Diet. Nutrients 2021, 13, 388. [Google Scholar] [CrossRef]
- Wani, T.A.; Masoodi, F.A.; Gani, A.; Baba, W.N.; Rahmanian, N.; Wani, I.A.; Ahmad, M. Olive oil and its principal bioactive compound: Hydroxytyrosol—A review of the recent literature. Trends Food Sci. Technol. 2018, 77, 77–90. [Google Scholar] [CrossRef]
- Estevez, M.; Ventanas, J.; Cava, R.; Puolanne, E. Characterisation of a traditional Finnish liver sausage and different types of Spanish liver pates: A comparative study. Meat Sci. 2005, 71, 657–669. [Google Scholar] [CrossRef]
- Innis, S.M. Dietary (n-3) Fatty Acids and Brain Development. J. Nutr. 2007, 137, 855–859. [Google Scholar] [CrossRef] [Green Version]
- Mishra, V.; Tarafdar, A.; Talukder, S.; Mendiratta, S.K.; Agrawal, R.K.; Jaiswal, R.K.; Bomminayuni, G.P. Enhancing the shelf life of chevon Seekh Kabab using chitosan edible film and Cinnamomum zeylanicum essential oil. J. Food Sci. Technol. 2023, 60, 1814–1825. [Google Scholar] [CrossRef]
- Elhadef, K.; Smaoui, S.; Ben Hlima, H.; Ennouri, K.; Fourati, M.; Chakchouk Mtibaa, A.; Ennouri, M.; Mellouli, L. Effects of Ephedra alata extract on the quality of minced beef meat during refrigerated storage: A chemometric approach. Meat Sci. 2020, 170, 108246. [Google Scholar] [CrossRef] [PubMed]
- Salman, A.S.M.; Hussain, A.; Sultana, S.; Bhattacharjee, D.; Jafor Bapary, M.A.; Ahmmed, M.K.; Islam, J.; Sayeed, A. Effect of Storage Conditions on the Quality Attributes of Value-added Cutlets Produced from Low-cost Silver Carp (Hypophthalmichthys molitrix). J. Aquat. Food Product. Technol. 2022, 31, 430–444. [Google Scholar] [CrossRef]
- Yuan, G.; Lv, H.; Tang, W.; Zhang, X.; Sun, H. Effect of chitosan coating combined with pomegranate peel extract on the quality of Pacific white shrimp during iced storage. Food Control 2016, 59, 818–823. [Google Scholar] [CrossRef]
- Lv, Y.; Yin, X.; Wang, Y.; Chen, Q.; Kong, B. The prediction of specific spoilage organisms in Harbin red sausage stored at room temperature by multivariate statistical analysis. Food Control 2021, 123, 107701. [Google Scholar] [CrossRef]
- Bao, Y.; Ertbjerg, P. Effects of protein oxidation on the texture and water-holding of meat: A review. Crit. Rev. Food Sci. Nutr. 2019, 59, 3564–3578. [Google Scholar] [CrossRef] [PubMed] [Green Version]
- Zhang, X.; Wang, H.; Li, X.; Sun, Y.; Pan, D.; Wang, Y.; Cao, J. Effect of cinnamon essential oil on the microbiological and physiochemical characters of fresh Italian style sausage during storage. Anim. Sci. J. 2019, 90, 435–444. [Google Scholar] [CrossRef] [PubMed]
- Turan, E.; Simsek, A. Effects of lyophilized black mulberry water extract on lipid oxidation, metmyoglobin formation, color stability, microbial quality and sensory properties of beef patties stored under aerobic and vacuum packaging conditions. Meat Sci. 2021, 178, 108522. [Google Scholar] [CrossRef]
- Bağdatli, A.; Kayaardi, S. Influence of storage period and packaging methods on quality attributes of fresh beef steaks. CyTA-J. Food 2014, 13, 124–133. [Google Scholar] [CrossRef] [Green Version]
- Faustman, C.; Sun, Q.; Mancini, R.; Suman, S.P. Myoglobin and lipid oxidation interactions: Mechanistic bases and control. Meat Sci. 2010, 86, 86–94. [Google Scholar] [CrossRef] [PubMed]
- Di Paolo, M.; Ambrosio, R.L.; Lambiase, C.; Vuoso, V.; Salzano, A.; Bifulco, G.; Barone, C.M.A.; Marrone, R. Effects of the Aging Period and Method on the Physicochemical, Microbiological and Rheological Characteristics of Two Cuts of Charolais Beef. Foods 2023, 12, 531. [Google Scholar] [CrossRef] [PubMed]
- Kim, W.; Ryu, J.-H.; Kim, Y. Application of yuba films for preserving beef patties. LWT 2020, 131, 109746. [Google Scholar] [CrossRef]
- Kılıç, B.; Şimşek, A.; Claus, J.R.; Karaca, E.; Bilecen, D. Improving lipid oxidation inhibition in cooked beef hamburger patties during refrigerated storage with encapsulated polyphosphate incorporation. LWT 2018, 92, 290–296. [Google Scholar] [CrossRef]
- Qiao, M.; Fletcher, D.L.; Smith, D.P.; Northcutt, J.K.J.P.S. The effect of broiler breast meat color on pH, moisture, water-holding capacity, and emulsification capacity. Poult. Sci. 2001, 80, 676. [Google Scholar] [CrossRef]
- Zhang, J.; Zhang, Y.; Zou, Y.; Zhang, W. Effects of ultrasound-assisted cooking on quality characteristics of spiced beef during cold storage. LWT 2021, 136, 110359. [Google Scholar] [CrossRef]
- Ali, H.A.; Mansour, E.H.; El-Bedawey, A.E.-F.A.; Osheba, A.S. Quality of canned tilapia fish luncheon as influenced by different concentrations of beef fat and storage time. J. Food Meas. Charact. 2017, 11, 1240–1247. [Google Scholar] [CrossRef]
- Amaral, D.S.; Silva, F.A.P.; Bezerra, T.K.A.; Arcanjo, N.M.O.; Guerra, I.C.D.; Dalmás, P.S.; Madruga, M.S. Effect of storage time and packaging on the quality of lamb pâté prepared with ‘variety meat’. Food Packag. Shelf Life 2015, 3, 39–46. [Google Scholar] [CrossRef]
- Unal, K.; Babaoğlu, A.S.; Erdem, N.; Dilek, N.M. The effect of pumpkin powder on the physicochemical, emulsification, and textural properties of beef. J. Food Process. Preserv. 2022, 46, e16728. [Google Scholar] [CrossRef]
- Huang, Q.; Huang, X.; Liu, L.; Song, H.; Geng, F.; Wu, W.; Luo, P. Nano eggshell calcium enhanced gel properties of Nemipterus virgatus surimi sausage: Gel strength, water retention and microstructure. Int. J. Food Sci. Technol. 2021, 56, 5738–5752. [Google Scholar] [CrossRef]
- Sun, Y.; Zhang, M.; Bhandari, B.; Bai, B. Nanoemulsion-based edible coatings loaded with fennel essential oil/cinnamaldehyde: Characterization, antimicrobial property and advantages in pork meat patties application. Food Control 2021, 127, 108151. [Google Scholar] [CrossRef]
- Krichen, F.; Hamed, M.; Karoud, W.; Bougatef, H.; Sila, A.; Bougatef, A. Essential oil from pistachio by-product: Potential biological properties and natural preservative effect in ground beef meat storage. J. Food Meas. Charact. 2020, 14, 3020–3030. [Google Scholar] [CrossRef]
- Serdaroğlu, M.; Öztürk-Kerimoğlu, B.; Zungur-Bastıoğlu, A.; Kavuşan, H.S.; Ötleş, S.; Özyurt, V.H. Lipid–Protein Oxidation and In Vitro Digestibility of Fermented Turkey Sausages as Affected by Lipid Formulation. Eur. J. Lipid Sci. Technol. 2022, 124, 2100243. [Google Scholar] [CrossRef]
- Wu, G.; Clerens, S.; Farouk, M.M. LC MS/MS identification of large structural proteins from bull muscle and their degradation products during post mortem storage. Food Chem. 2014, 150, 137–144. [Google Scholar] [CrossRef]
- Lee, S.; Choi, Y.S.; Jo, K.; Yong, H.I.; Jeong, H.G.; Jung, S. Improvement of meat protein digestibility in infants and the elderly. Food Chem. 2021, 356, 129707. [Google Scholar] [CrossRef] [PubMed]
- Zou, X.; He, J.; Zhao, D.; Zhang, M.; Xie, Y.; Dai, C.; Wang, C.; Li, C. Structural Changes and Evolution of Peptides During Chill Storage of Pork. Front. Nutr. 2020, 7, 151. [Google Scholar] [CrossRef] [PubMed]
- Gan, J.; Bornhorst, G.M.; Henrick, B.M.; German, J.B. Protein Digestion of Baby Foods: Study Approaches and Implications for Infant Health. Mol. Nutr. Food Res. 2018, 62, 1700231. [Google Scholar] [CrossRef] [PubMed]

| Items | Excellent (80–100) | Good (60–80) | Medium (40–60) | Poor (10–40) | |
|---|---|---|---|---|---|
| Taste | Fineness | Fine texture, basically no graininess | Fine taste, slightly grainy | Rough taste, grainy | Coarse taste, heavy graininess |
| Softness | Soft taste | Softer taste | Harder taste | Hard taste | |
| Residue amount | Basically no residue | A small amount of residue | Residue | A lot of residue | |
| Organizational Status | Water-separating property | Basically no water is separated from the tissue | Small amount of water separated from the tissue | Small amount of water separated from the tissue | Water is separated from the tissue and is mobile |
| Smearing property | Easy to smear | Relatively easy to smear | Harder to smear | Difficult to smear | |
| Flavor | Liver flavor is rich and basically no fishy taste | Liver flavor is relatively strong and slightly fishy | Liver flavor but not strong and fishy | Liver flavor is not strong and heavy fishy flavor | |
| Color | Shiny and light brown | Slightly shiny and grayish brown | Darker luster and Brown | Basically lusterless and dark brown | |
| Project | Evaluation Team | Total Score | ||||||||||
|---|---|---|---|---|---|---|---|---|---|---|---|---|
| 1 | 2 | 3 | 4 | 5 | 6 | 7 | 8 | 9 | 10 | |||
| Primary factor | Taste | 6 | 7 | 5 | 9 | 7 | 7 | 9 | 9 | 8 | 7 | 74 |
| Organizational status | 3 | 3 | 4 | 4 | 5 | 3 | 5 | 3 | 6 | 7 | 43 | |
| Flavor | 7 | 8 | 9 | 6 | 8 | 7 | 6 | 6 | 7 | 4 | 68 | |
| Color | 8 | 6 | 6 | 5 | 4 | 7 | 4 | 6 | 3 | 6 | 55 | |
| Total | 24 | 24 | 24 | 24 | 24 | 24 | 24 | 24 | 24 | 24 | 240 | |
| Secondary factor (Taste) | Fineness | 6 | 4 | 5 | 4 | 6 | 3 | 8 | 8 | 5 | 4 | 43 |
| Hardness | 6 | 3 | 2 | 4 | 3 | 6 | 3 | 4 | 6 | 4 | 41 | |
| Residue | 0 | 5 | 5 | 4 | 3 | 3 | 1 | 0 | 1 | 4 | 26 | |
| Total | 12 | 12 | 12 | 12 | 12 | 12 | 12 | 12 | 12 | 12 | 120 | |
| Secondary factor (Tissue state) | Water-separating property | 1 | 2 | 1 | 2 | 1 | 1 | 2 | 1 | 3 | 2 | 16 |
| Smearing property | 3 | 2 | 3 | 2 | 3 | 3 | 2 | 3 | 1 | 2 | 24 | |
| Total | 4 | 4 | 4 | 4 | 4 | 4 | 4 | 4 | 4 | 4 | 40 | |
| Run | A | B | C | D | Y1 | Y2 | Y3 | Y |
|---|---|---|---|---|---|---|---|---|
| 1 | −1 | 0 | −1 | 0 | 10.02 | 4.82 | 74.16 | 0.53 |
| 2 | 0 | 0 | 0 | 0 | 16.4 | 8.33 | 79.25 | 0.68 |
| 3 | −1 | 1 | 0 | 0 | 12.12 | 5.48 | 74.95 | 0.55 |
| 4 | 0 | 1 | 0 | −1 | 14.21 | 6.62 | 76.03 | 0.56 |
| 5 | 0 | −1 | 0 | 1 | 19.16 | 9.85 | 75.1 | 0.28 |
| 6 | 0 | 0 | 0 | 0 | 16.45 | 7.95 | 79.25 | 0.67 |
| 7 | 0 | 0 | −1 | 1 | 8.16 | 4.98 | 75.14 | 0.61 |
| 8 | 0 | 1 | 1 | 0 | 17.65 | 7.92 | 76.02 | 0.46 |
| 9 | 0 | 1 | 0 | 1 | 10.49 | 5.93 | 75.43 | 0.6 |
| 10 | 0 | 0 | 0 | 0 | 16.22 | 8.28 | 79.16 | 0.68 |
| 11 | 1 | 0 | −1 | 0 | 11.92 | 6.08 | 76.09 | 0.63 |
| 12 | 0 | 0 | 0 | 0 | 16.8 | 8.4 | 79.04 | 0.67 |
| 13 | 0 | 1 | −1 | 0 | 8.34 | 4.1 | 75.34 | 0.67 |
| 14 | 0 | −1 | 1 | 0 | 26.51 | 12.07 | 75.66 | 0.12 |
| 15 | 1 | 1 | 0 | 0 | 14.12 | 6.94 | 76.88 | 0.61 |
| 16 | 0 | 0 | 0 | 0 | 16.05 | 8.45 | 79.16 | 0.67 |
| 17 | 0 | −1 | −1 | 0 | 16.95 | 7.95 | 75.02 | 0.38 |
| 18 | 1 | 0 | 0 | −1 | 18.03 | 8.64 | 76.77 | 0.49 |
| 19 | 1 | −1 | 0 | 0 | 22.73 | 10.83 | 76.54 | 0.3 |
| 20 | −1 | 0 | 0 | 1 | 12.39 | 6.51 | 74.34 | 0.46 |
| 21 | 0 | −1 | 0 | −1 | 22.54 | 10.49 | 75.69 | 0.25 |
| 22 | −1 | −1 | 0 | 0 | 21.19 | 9.72 | 74.72 | 0.22 |
| 23 | −1 | 0 | 1 | 0 | 15.99 | 7.39 | 74.16 | 0.33 |
| 24 | 1 | 0 | 0 | 1 | 14.42 | 7.86 | 76.17 | 0.53 |
| 25 | 1 | 0 | 1 | 0 | 21.22 | 10.12 | 76.74 | 0.36 |
| 26 | 0 | 0 | 1 | 1 | 17.72 | 8.84 | 75.29 | 0.36 |
| 27 | 0 | 0 | −1 | −1 | 12.06 | 5.75 | 75.24 | 0.56 |
| 28 | −1 | 0 | 0 | −1 | 15.98 | 7.29 | 74.94 | 0.42 |
| 29 | 0 | 0 | 1 | −1 | 21.42 | 9.62 | 75.89 | 0.33 |
| Items | S.S. | D.F. | M.S. | F-Value | p-Value | Sig. |
|---|---|---|---|---|---|---|
| Model | 0.73 | 14 | 0.052 | 3734.77 | <0.0001 | ** |
| A-Ratio of chicken breast and beef liver | 0.014 | 1 | 0.014 | 1005.73 | <0.0001 | ** |
| B-Water addition | 0.3 | 1 | 0.3 | 21,598.29 | <0.0001 | ** |
| C-Potato starch addition | 0.17 | 1 | 0.17 | 12,063.93 | <0.0001 | ** |
| D-Olive oil addition | 4.41 × 10⁻³ | 1 | 4.41 × 10⁻³ | 316.5 | <0.0001 | ** |
| AB | 1.00 × 10⁻⁴ | 1 | 1.00 × 10⁻⁴ | 7.18 | 0.018 | * |
| AC | 1.23 × 10⁻³ | 1 | 1.23 × 10⁻³ | 87.95 | <0.0001 | ** |
| AD | 0 | 1 | 0 | 0 | 1 | |
| BC | 6.25 × 10⁻⁴ | 1 | 6.25 × 10⁻⁴ | 44.87 | <0.0001 | ** |
| BD | 2.50 × 10⁻⁵ | 1 | 2.50 × 10⁻⁵ | 1.79 | 0.2017 | |
| CD | 1.00 × 10⁻⁴ | 1 | 1.00 × 10⁻⁴ | 7.18 | 0.018 | * |
| A2 | 0.065 | 1 | 0.065 | 4688.06 | <0.0001 | ** |
| B2 | 0.15 | 1 | 0.15 | 11,056.41 | <0.0001 | ** |
| C2 | 0.081 | 1 | 0.081 | 5798.31 | <0.0001 | ** |
| D2 | 0.062 | 1 | 0.062 | 4457.35 | <0.0001 | ** |
| Residual | 1.95 × 10⁻⁴ | 14 | 1.39 × 10⁻⁵ | |||
| Lack of fit | 7.50 × 10⁻⁵ | 10 | 7.50 × 10⁻⁶ | 0.25 | 0.9657 | |
| Pure error | 1.20 × 10⁻⁴ | 4 | 3.00 × 10⁻⁵ | |||
| Cor total | 0.73 | 28 | ||||
| R2 | 0.9997 | |||||
| R2adj | 0.9995 | |||||
| Items | Average Composition |
|---|---|
| Composition (g/100 g) | |
| Moisture | 78.49 ± 0.04 |
| Ash | 1.13 ± 0.07 |
| Protein | 10.29 ± 0.41 |
| Fat | 5.17 ± 0.12 |
| Amino Acids (g/100 g) | |
| Isoleucine | 0.23 ± 0.01 |
| Leucine | 0.46 ± 0.02 |
| Threonine | 0.12 ± 0.01 |
| Phenylalanine | 0.17 ± 0.01 |
| Lysine | 0.27 ± 0.02 |
| Valine | 0.20 ± 0.02 |
| Histidine | 0.13± 0.01 |
| Tryptophan | ND |
| Aspartic Acid | 0.29 ± 0.01 |
| Serine | 0.14 ± 0.02 |
| Glutamic acid | 3.19 ± 0.06 |
| Cysteine | 0.03 ± 0.01 |
| Methionine | 0.02 ± 0.01 |
| Tyrosine | 0.13 ± 0.01 |
| Arginine | 0.25 ± 0.01 |
| Fatty acids (mg/100 g) | |
| C10:0 | 0.26 ± 0.01 |
| C14:0 | 1.79 ± 0.01 |
| C15:0 | 0.26 ± 0.01 |
| C16:0 | 0.34 ± 0.06 |
| C18:0 | 92.06 ± 0.57 |
| C20:0 | 3.89 ± 0.04 |
| C22:0 | 0.82 ± 0.01 |
| C16:1 | 3.28 ± 0.44 |
| C20:1 | 4.36 ± 0.22 |
| C20:5 | 1.41 ± 0.01 |
| C18:1n9c | 412.98 ± 8.54 |
| C18:3n3 | 17.60 ± 1.02 |
| C18:2n6 | 137.63 ± 2.06 |
| C20:4n6 | 22.35 ± 0.12 |
| C22:6ns | 2.31 ± 0.04 |
| ΣSFA | 99.68 ± 0.24 |
| ΣMUFA | 423.48 ± 3.98 |
| ΣPUFA | 179.81 ± 2.25 |
| ΣPUFA/ΣSFA | 0.55 ± 0.01 |
| Σn-3 | 3.71 ± 0.02 |
| Σn-6 | 0.82 ± 0.03 |
| Σn-6/Σn-3 | 0.22 ± 0.01 |
| Items | 0 d | 3 d | 7 d | 15 d | 30 d | 45 d | 60 d |
|---|---|---|---|---|---|---|---|
| Moisture (g/100 g) | 79.83 ± 0.99 A | 79.85 ± 0.17 A | 79.84 ± 0.27 A | 79.39 ± 0.20 AB | 79.57 ± 0.24 AB | 78.69 ± 0.48 B | 78.86 ± 0.48 B |
| Protein (g/100 g) | 10.57 ± 0.33 A | 10.64 ± 0.55 A | 10.50 ± 0.44 A | 10.71 ± 0.22 A | 10.57 ± 0.45 A | 10.64 ± 0.33 A | 10.50 ± 0.22 A |
| Ash (g/100 g) | 1.13 ± 0.005 B | 1.13 ± 0.036 B | 1.11 ± 0.03 B | 1.14 ± 0.02 AB | 1.15 ± 0.02 AB | 1.15 ± 0.02 AB | 1.18 ± 0.03 A |
| Fat (g/100 g) | 5.21 ± 0.14 A | 5.19 ± 0.14 A | 5.19 ± 0.12 A | 5.17 ± 0.13 A | 5.08 ± 0.15 A | 5.07 ± 0.11 A | 5.09 ± 0.13 A |
| L* | 55.13 ± 1.07 A | 52.10 ± 0.86 B | 52.20 ± 0.70 B | 51.83 ± 0.93 BC | 52.90 ± 0.62 B | 52.70 ± 0.62 B | 49.93 ± 1.17 C |
| a* | 2.60 ± 0.43 B | 2.40 ± 0.22 B | 2.47 ± 0.12 B | 2.67 ± 0.29 B | 2.33 ± 0.25 B | 3.67 ± 0.34 A | 4.17 ± 0.31 A |
| b* | 24.70 ± 0.29 A | 24.17 ± 0.33 ABC | 24.23 ± 0.17 ABC | 24.37 ± 0.25 AB | 23.97 ± 0.25 BC | 23.60 ± 0.22 CD | 23.13 ± 0.52 D |
| ΔE | - | 3.27 ± 1.61 AB | 3.05 ± 1.73 AB | 3.39 ± 1.51 AB | 2.50 ± 1.39 B | 2.92 ± 2.14 AB | 5.83 ± 0.24 A |
| Processing Group | Storage Time/d | D3.2 | D4.3 | DX(10) | DX(50) | DX(90) |
|---|---|---|---|---|---|---|
| Undigested | 0 d | 14.29 ± 0.93 C | 127.87 ± 6.23 B | 4.81 ± 0.09 B | 128.63 ± 4.84 C | 268.57 ± 12.27 B |
| 3 d | 14.83 ± 1.39 BC | 132.13 ± 8.01B | 5.11 ± 0.67 B | 140.07 ± 6.45 BC | 276.20 ± 16.85 B | |
| 7 d | 18.71 ± 0.74 A | 161.13 ± 6.58 A | 6.02 ± 0.67 A | 170.57 ± 15.72 A | 315.03 ± 33.31 A | |
| 15 d | 17.70 ± 0.71 A | 152.47 ± 9.4 A | 5.24 ± 0.15 B | 166.5 ± 10.0 A | 293.77 ± 25.79 AB | |
| 30 d | 16.07 ± 0.77 B | 139.73 ± 5.33 B | 4.77 ± 0.45 B | 147.83 ± 5.09 B | 280.87 ± 7.89 AB | |
| 45 d | 15.09 ± 0.12 BC | 138.07 ± 4.27 B | 4.82 ± 0.2 B | 148.67 ± 3.11 B | 276.20 ± 8.61 B | |
| 60 d | 14.28 ± 0.51 C | 133.51 ± 4.4 B | 4.92 ± 0.17 B | 133.23 ± 5.81 BC | 267.51 ± 10.84 B | |
| Gastric digestion | 0 d | 9.74 ± 0.91 BC | 74.23 ± 2.60 D | 3.54 ± 0.8 ABC | 27.40 ± 2.54 B | 171.03 ± 16.13 C |
| 3 d | 10.72 ± 0.58 B | 92.24 ± 10.63 B | 2.99 ± 0.16 C | 35.44 ± 10.93 AB | 183.63 ± 14.48 ABC | |
| 7 d | 12.43 ± 0.96A | 110.89 ± 9.02 A | 4.31 ± 0.41 A | 41.91 ± 6.74 AB | 203.27 ± 16.5 A | |
| 15 d | 9.95 ± 0.70 BC | 87.02 ± 6.91 BCD | 2.69 ± 0.32 C | 48.40 ± 9.53 A | 195.30 ± 8.61 AB | |
| 30 d | 10.04 ± 0.73 BC | 88.25 ± 4.71 BC | 3.94 ± 0.66 AB | 33.26 ± 3.64 B | 179.17 ± 6.12 BC | |
| 45 d | 9.70 ± 0.69 BC | 82.72 ± 8.38 BCD | 3.97 ± 0.53 AB | 31.18 ± 2.71 B | 175.47 ± 11.71 BC | |
| 60 d | 9.13 ± 0.29 C | 75.59 ± 3.07 CD | 3.10 ± 0.14 BC | 29.22 ± 4.33 B | 173.97 ± 4.59 BC | |
| Intestinal digestion | 0 d | 2.90 ± 0.42 C | 7.00 ± 1.32 C | 1.35 ± 0.04 C | 3.97 ± 0.98 B | 17.53 ± 1.22 C |
| 3 d | 3.80 ± 0.57 BC | 8.92 ± 0.81 AB | 1.63 ± 0.23 BC | 5.02 ± 0.82 AB | 23.44 ± 1.63 A | |
| 7 d | 4.93 ± 0.84 A | 10.49 ± 0.87 A | 1.96 ± 0.28 A | 6.71 ± 0.32 A | 21.02 ± 2.20 AB | |
| 15 d | 4.30 ± 0.70 AB | 9.29 ± 0.73 AB | 1.85 ± 0.19 AB | 6.09 ± 0.51 A | 20.62 ± 0.78 B | |
| 30 d | 4.15 ± 0.56 AB | 8.57 ± 1.19 BC | 1.78 ± 0.12 AB | 6.16 ± 1.40 A | 19.45 ± 1.18 AB | |
| 45 d | 3.87 ± 0.46 ABC | 8.38 ± 0.75 BC | 1.82 ± 0.05 AB | 5.47 ± 0.84 AB | 19.31 ± 1.56 AB | |
| 60 d | 4.15 ± 0.20 AB | 8.25 ± 1.11 BC | 1.67 ± 0.14 AB | 5.89 ± 0.95 A | 19.27 ± 1.55 AB |
Disclaimer/Publisher’s Note: The statements, opinions and data contained in all publications are solely those of the individual author(s) and contributor(s) and not of MDPI and/or the editor(s). MDPI and/or the editor(s) disclaim responsibility for any injury to people or property resulting from any ideas, methods, instructions or products referred to in the content. |
© 2023 by the authors. Licensee MDPI, Basel, Switzerland. This article is an open access article distributed under the terms and conditions of the Creative Commons Attribution (CC BY) license (https://creativecommons.org/licenses/by/4.0/).
Share and Cite
Shen, R.; Yang, D.; Zhang, L.; Yu, Q.; Ma, X.; Ma, G.; Guo, Z.; Chen, C. Preparation of Complementary Food for Infants and Young Children with Beef Liver: Process Optimization and Storage Quality. Foods 2023, 12, 2689. https://doi.org/10.3390/foods12142689
Shen R, Yang D, Zhang L, Yu Q, Ma X, Ma G, Guo Z, Chen C. Preparation of Complementary Food for Infants and Young Children with Beef Liver: Process Optimization and Storage Quality. Foods. 2023; 12(14):2689. https://doi.org/10.3390/foods12142689
Chicago/Turabian StyleShen, Ruheng, Dawei Yang, Li Zhang, Qunli Yu, Xiaotong Ma, Guoyuan Ma, Zhaobin Guo, and Cheng Chen. 2023. "Preparation of Complementary Food for Infants and Young Children with Beef Liver: Process Optimization and Storage Quality" Foods 12, no. 14: 2689. https://doi.org/10.3390/foods12142689