Article

Rapid and Sensitive Detection of Polycyclic Aromatic Hydrocarbons in Tea Leaves Using Magnetic Approach

1
State Key Laboratory of Quality Research in Chinese Medicine, Macau University of Science and Technology, Taipa, Macao 999078, China
2
Key Laboratory of Grains and Oils Quality Control and Processing, Collaborative Innovation Center for Modern Grain Circulation and Safety, College of Food Science and Engineering, Nanjing University of Finance and Economics, Nanjing 210023, China
3
Faculty of Medicine, Macau University of Science and Technology, Avenida Wai Long Taipa, Macao 999078, China
4
Zhuhai Resproly Pharmaceutical Technology Co., Ltd., Blk 11, International Health Port, No. 628, Airport West Road, Jinwan District, Zhuhai 519040, China
5
Guangdong-Hong Kong-Macau Joint Laboratory for Contaminants Exposure and Health, Guangzhou 510006, China
*
Authors to whom correspondence should be addressed.
Foods 2023, 12(11), 2270; https://doi.org/10.3390/foods12112270
Submission received: 28 April 2023 / Revised: 29 May 2023 / Accepted: 2 June 2023 / Published: 5 June 2023
(This article belongs to the Section Food Analytical Methods)

Abstract

:
A rapid and efficient method using an alkyl-functionalized magnetic nanoparticles-based extraction technique combined with Ultra-High Performance Liquid Chromatography was developed for the detection of trace amounts of polycyclic aromatic hydrocarbons in tea leaves. As a popular coating for chromatographic column packing materials, C18-alkyl has been demonstrated to be effective in separating polycyclic aromatic hydrocarbons. Additionally, the magnetism of the nanomaterials accelerates the extraction process while their high surface ratio enables desirable dispersity in the sample matrix. Meanwhile, the adsorbents can be washed and reused 30 times without compromising recovery, which greatly reduces the budget. The effects of various parameters were investigated and optimized, and the recoveries for five analytes were in the range of 84.8–105.4%. The RSD of intra-day and inter-day were below 11.9% and 6.8%, respectively. The limits of detection and limits of quantification ranged from 1.69–9.97 ng g−1 and 5.12–30.21 ng g−1, indicating satisfactory sensitivity. Thus, the proposed methodology is rapid, highly efficient, and economical, and it expands the application of magnetic cleanup approaches in complex food matrices.

1. Introduction

Tea is one of the most widely consumed beverages worldwide, and its status as the national drink of China has been recognized since ancient times. The global spread of Chinese tea leaves during the 16th century, facilitated by increased cultural exchange and trade, firmly cemented tea’s place as an important beverage. In particular, tea has had a profound impact on British culture, with many individuals consuming large quantities of it. Numerous scientific studies have identified potential health benefits associated with tea consumption, including cholesterol reduction, anti-microbial and hepatoprotective effects, and prevention of cardiovascular disease and cancer [1]. Residual chemical contaminants present in tea leaves due to air pollution deposition pose potential health hazards for consumers. Heavy metals and pesticide residues are among the primary pollutants that have undergone extensive investigation, and their detection and monitoring are crucial [2]. Based on the correlation between medicine and food, tea has been utilized for medicinal purposes in China for an extended period. Various active components present in tea exhibit antiviral properties; for example, some polyphenols have inhibitor potential by binding to the active site of SARS-CoV-2 RdRp, which means that it might serve as a precaution and treatment as a candidate drug for COVID-19 [3].
Polycyclic Aromatic Hydrocarbons (PAHs) are chemical structures composed of two to seven benzene rings, which can take a linear, angular, or agglomerated form, mainly due to the carbon-containing compounds, bioaccumulation in the food chain, and industrial food processing. At present, there are more than 100 known PAHs, while 16 PAHs are listed by the US Environmental Protection Agency as being regulated. The maximum residue limits (MRLs) of benzo(a)pyrene and four PAHs in certain foodstuffs, such as oils, fats, and smoked products, have been specified by the current EU regulation to be 2–5 μ g kg−1 and 10–30 μ g kg−1, respectively [4]. These compounds possess teratogenic, mutagenic, and carcinogenic properties, and their stable structure makes them slow to degrade [5]. The aromatic’s stable structure makes it hard for the PAHs to degrade. PAHs have been detected in a variety of food matrices, such as seafood, oil, barbecue, and so on [4,6]. While the content of PAHs is present in low amounts, research has shown a link between their presence and the development of various types of malignant tumors in laboratory animals and humans [7].
Most people drink tea without washing the tea leaves, which makes tea drinks a potential source of daily exposure to PAHs. Because of its long growth cycle and complex processing process, tea is susceptible to environmental pollutants. The main source of PAH contamination in tea stems from the absorption of PAHs from the atmosphere by tea leaves during their growing and drying stages [8]. When the electric heating drying mode replaces the conventional drying mode, PAHs in fresh leaves are one of the main sources of PAH contamination in tea due to the amplification effect during the processing [9]. Furthermore, tea plants are subject to PAH contamination during cultivation, primarily through the presence of these carcinogens in the air and soil. PAHs in the air may be adsorbed onto the surface of fresh tea leaves or directly absorbed into the tissues of the tea plants. Meanwhile, the roots of tea plants absorb PAHs present in the soil, which then migrate to the leaves [10]. Notably, evidence indicates that the contamination levels of PAHs in different teas differed. A survey conducted by Duedahl-Olesen (2015) showed that after detecting four PAHs in 18 tea leaves, the highest four PAH levels with a maximum of 115 ng g−1 were found in black tea leaves [11]. Li et al. (2011) reported that the mean PAHs of unfermented tea (green tea), semi-fermented tea (oolong tea), and fully fermented tea (black tea and Pu-erh tea) were 206.0 ng g−1, 153.0 ng g−1, and 202.8 ng g−1, which were obtained by rapid screening of three PAHs in a variety of tea samples [12]. Previous research had established that PAHs were detected in tea leaves sold in different regions. Adisa et al. (2015) analyzed and evaluated a total of 18 PAH congeners in an evaluation of 28 different dry tea samples sold in the U.S. The sum of the 18 PAH congeners, recorded as dry mass, ranged between 101 and 1337 ng g−1 [13]. Khiadani et al. (2013) showed that the average total PAHs in eight black teas commonly found in Iran ranged from 139 to 2082 ng g−1. Four rings of PAH compounds accounted for 46% of the total PAH compounds, they were the dominant compounds, and no PAHs with five or six rings were found [14]. Sadowska-Rociek et al. (2014) tested 22 different types of tea in Poland, detecting a total of 8 PAHs with a total content ranging from 30.1 to 147.1 ng g−1. Among them, white tea and green tea had a lower PAH content of 11.8 and 10.6 ng g−1, respectively, while black tea and red tea had a higher content of 16.9 and 17.0 ng g−1, respectively [15].
The determination of polycyclic aromatic hydrocarbons (PAHs) in matrices commonly involves sample extraction and preparation prior to chromatography analysis. The efficacy of the extraction methods is critical in developing high-accuracy analyses. To deal with the diversity and complexity of food matrices, many pretreatment techniques have been developed to separate and absorb PAHs, including solid-phase extraction (SPE), solid-phase microextraction (SPME), and stir-bar sorptive extraction (SBSE) [16,17]. However, there are several drawbacks to the methods: SPE is laborious, difficult, expensive, and not environmentally friendly; SPME is expensive, time-consuming, and has small sorption phase volumes, while method automation and memory effects in SBSE are restrictive. Furthermore, the low amounts of PAHs in complex samples make them difficult to detect using current methods.
Recently, a proposed methodology combined with magnetic nanoparticles has been developed [18]. In many fields, magnetic solid-phase extraction (MSPE) has attracted increasing interest due to its simplicity, time-saving potential, and high accuracy in sample preparation [19]. Normally, magnetic nanoparticles (MNPs) are synthesized by grafting inorganic magnetic cores with organic functional groups [20]. Due to their excellent adsorption properties and stability, nano forms of the material are used in various research areas. J. Ding et al. (2010) reported the synthesis of magnetic material Fe3O4@3-(Trimethoxysilyl)propyl methacrylate@ionic liquid nanoparticles (Fe3O4@MPS@IL NPs) and applied as the adsorbent of seven heavy molecular weight PAHs from tea soup samples [21]. Additionally, magnetic nanoparticles coated with other substances, such as diphenyl functionalization Fe3O4 nanoparticles and carbon-ferromagnetic nanocomposites, have been utilized to absorb PAHs from different matrices [22].
However, the use of MSPE to determine trace analytes in solid samples is scarce. Additionally, there is a need to enhance the technique’s adaptation to complex matrix systems so that they can better assist highly demanding modern separation tasks. The aim of the proposed study is to extend the application of magnetic adsorbents in bulk and complex solid food samples, thereby allowing for simple, costless, and highly effective sample pretreatment. Alkyl groups with 18 carbons (C18), as a widely-used chromatographic material, are proven by many to be effective in the preconcentration of various organic contaminants due to their high adsorption capacity, outstanding stability, and strong separation power. Additionally, octadecylsilyl (ODS) is the most widely used reagent to graft C18 alkyl groups onto inorganic magnetic nanoparticles with the aid of a silica encapsulation layer in between [23,24]. This study aims to develop an extraction technique utilizing self-prepared C18-coated magnetic nanoparticles (C18/MNPs) to detect PAHs in tea samples. The use of MSPE in conjunction with UPLC results in a highly efficient preconcentration process for PAHs in tea, which is cost-effective, environmentally friendly, and highly accurate. The C18/MNPs are a valuable addition to the analytical tools available.

2. Materials and Methods

2.1. Real Sample

Tea leaves (Tianfeng, Fujian, China) (Camellia sinensis (Camellia, C. sinensis, Theaceae)) were purchased from the local supermarket in Macau in Oct 2021. The shelf life of the tea leaves is 540 days. The sample was first ground using a mortar and pestle before passing through a 24-mesh sieve. The portion of the sample that remained above the sieve’s cutoff was subjected to further grinding and sieving, and the process was repeated three times to ensure that the final particle size of the sample was below 0.85 μm. The as-prepared sample powder was then stored in a refrigerator to prevent moisture absorption prior to usage.

2.2. Chemicals and Standards

PAHs standards of benzo[b]fluoranthene (99.4%), ben-zo[a]anthracene (99.0%), fluorene, anthracene (99.9%), and pyrene (98.5%), as shown in Table 1, were acquired from Manhage Bio-technology (Beijing, China). Analytical grade sodium hydroxide (NaOH), Iron (Ⅱ) chloride tetrahydrate, and Iron (III) chloride hexahydrate were obtained from Macklin. Tetraethyl orthosilicate (TEOS), isopropyl alcohol, ammonia, anhydrous toluene, triethylamine, chloro(diethyl)octadecylsilane (ODS, 95% v/v), hydrochloric acid (HCl, 37% v/v), and potassium bromide (KBr) came from Sigma Macau. Methanol (CH4O, polarity:6.6), 95% ethanol (C2H6O, polarity:4.3), acetonitrile (CH3CN, polarity:6.2), and acetic acid (CH3COOH, polarity:6.2) came from Macklin (Shanghai, China). Acidified acetonitrile (3% acetic acid, v/v) was prepared personally. Ultra-high performance liquid chromatography was from Shimadzu. HPLC-grade acetonitrile and methanol were provided by Anaqua (Cleveland, OH, USA).

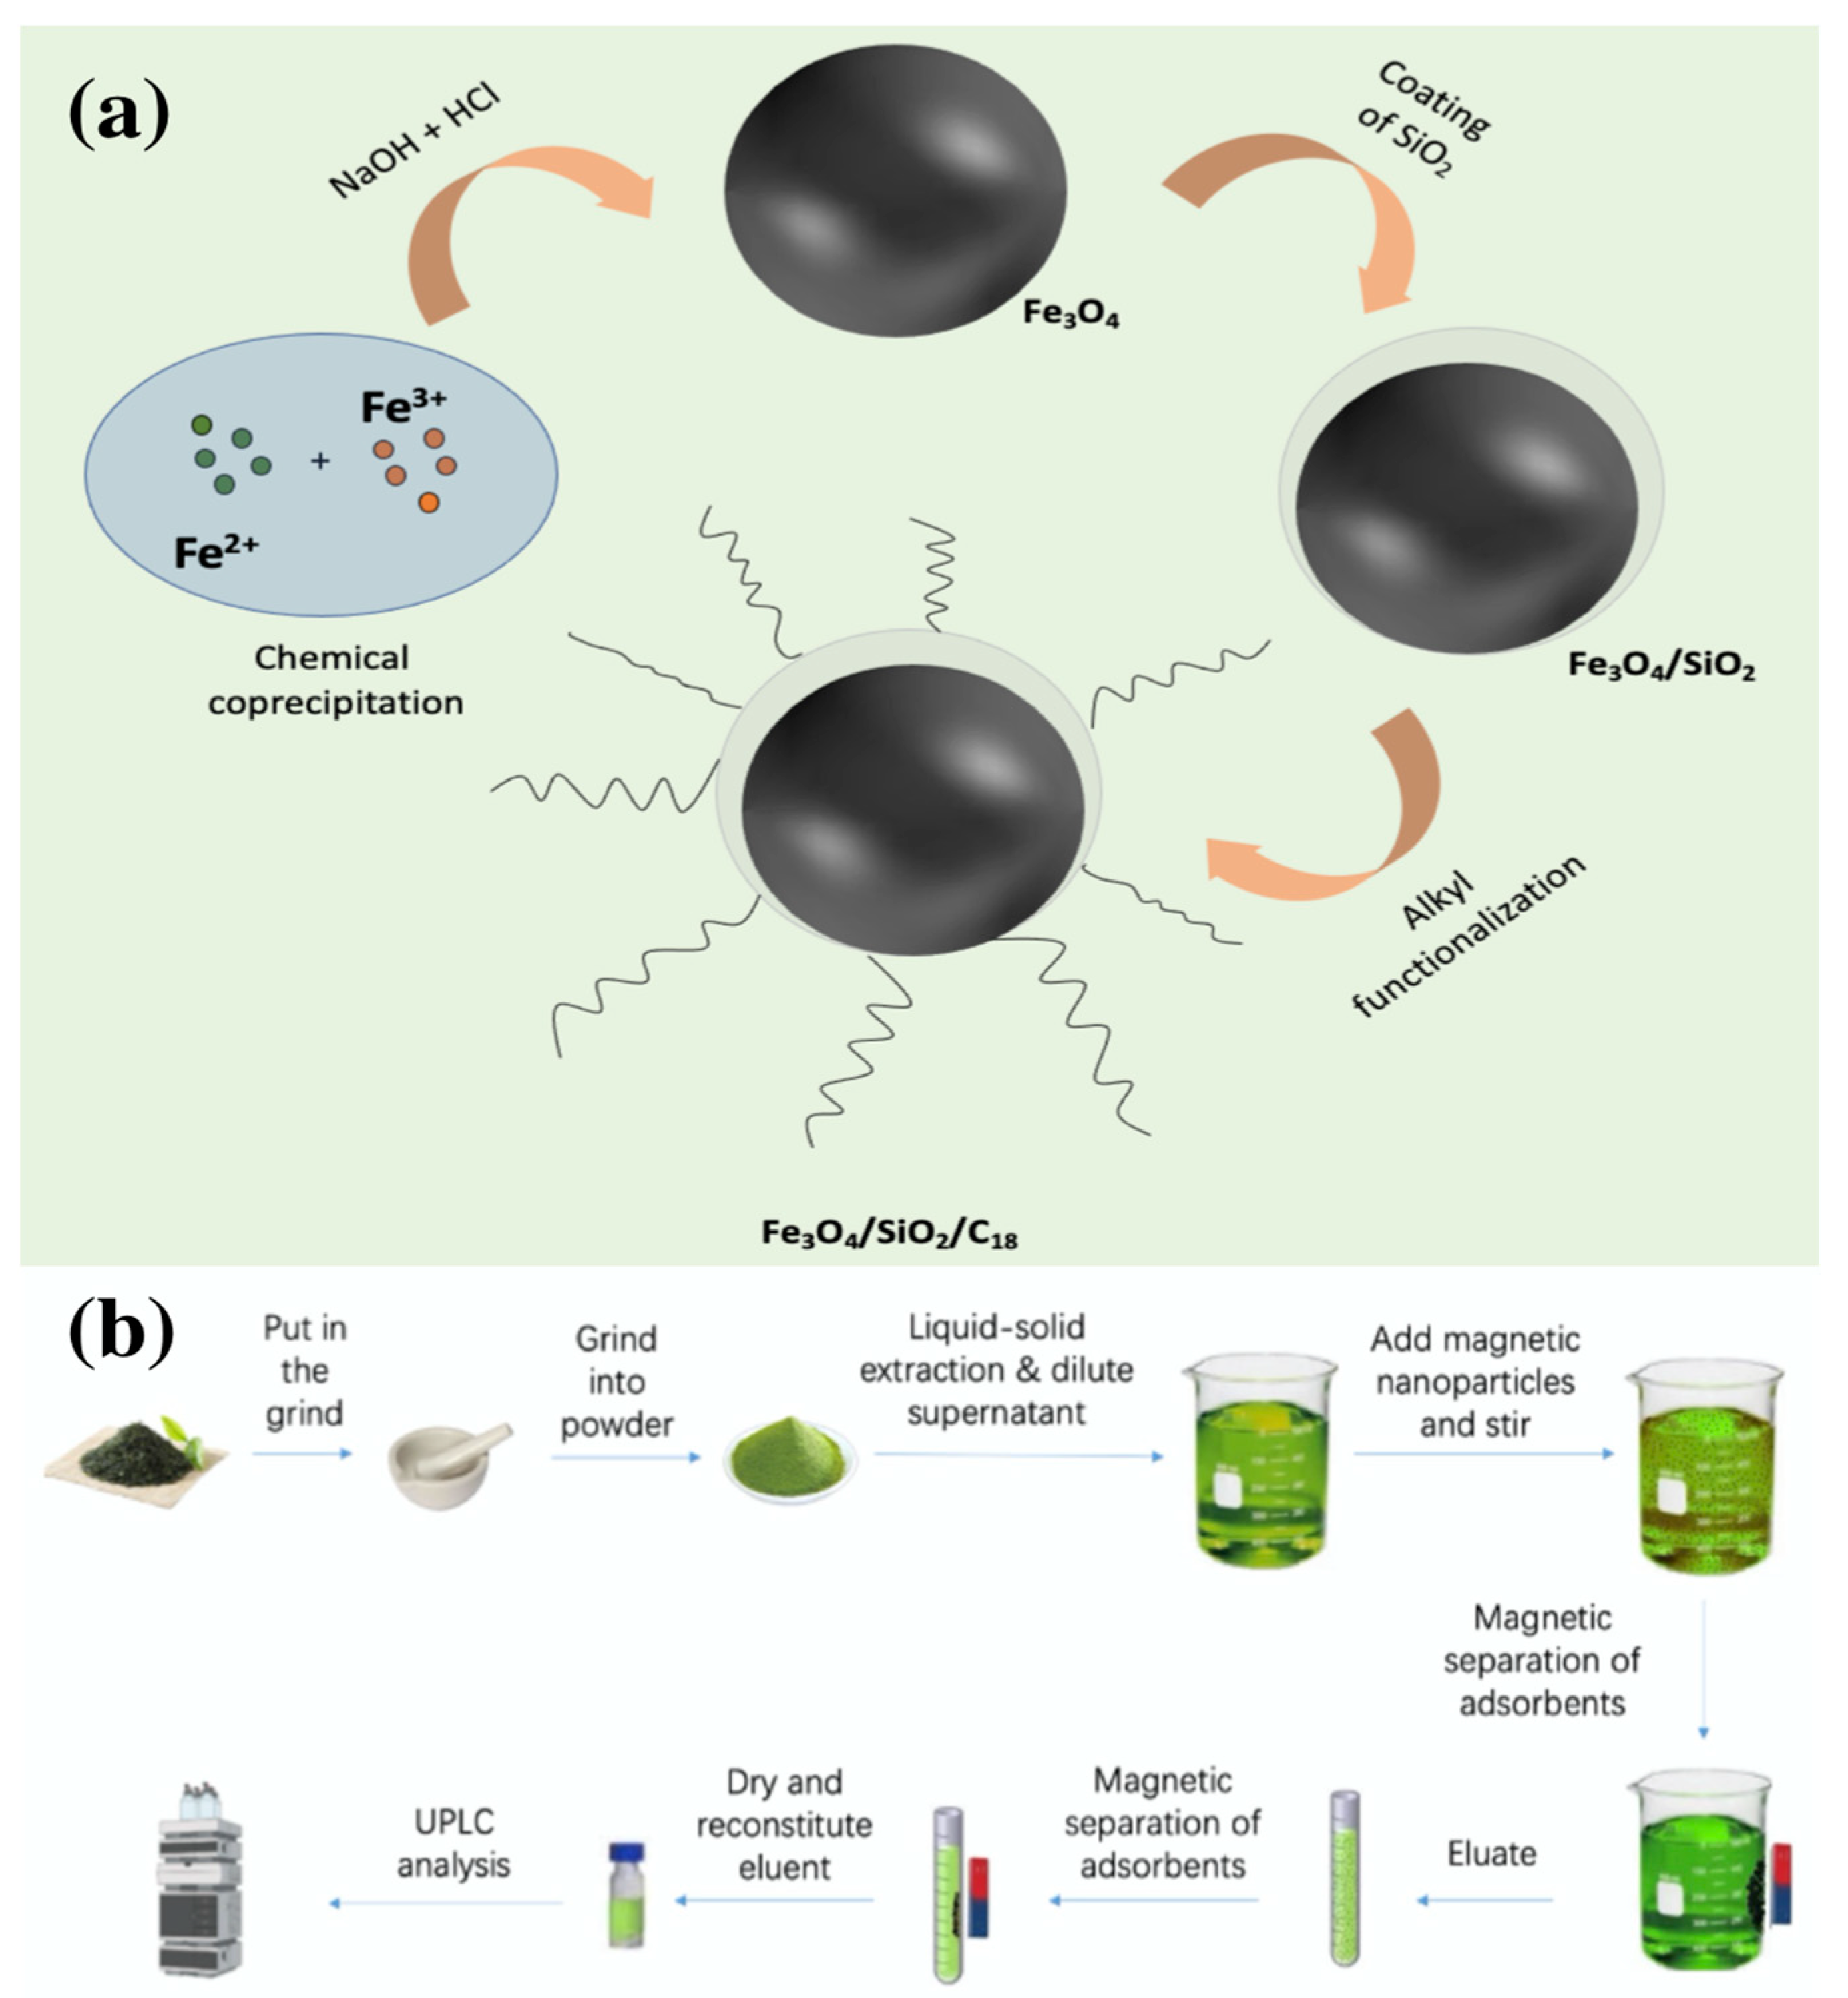
2.3. Preparation and Characterization of C18/MNPs

2.3.1. Synthesis of C18/MNPs

The C18/MNPs were prepared by chemical co-precipitation, salinization, and alkylation method [25].
Figure 1a shows that under the alkaline environment, using chemical co-precipitation to prepare the MNPs, FeCl2·4H2O (3.25 g) and FeCl3 (5.65 g) were added to DI water with HCl, respectively, followed by ultrasonication. The iron salt solution was added to NaOH solution (1.5 M) using a dropping funnel, stirred vigorously and heated to 80 °C in a water bath, and refluxed with nitrogen gas. The synthesis reaction was carried out for 2 h and washed three times with DI water.
Then, the successfully synthesized MNPs were added to a mixture of DI water (6 mL), isopropanol (43 mL), and ammonia (25 wt%, 1.25 mL) and stirred for 15 min. TEOS (125 μL) was put into the solution with nitrogen gas. At room temperature, the solution was stirred for 4 h, washed thrice, and dried in a vacuum oven.
In short, the magnetic silica nanoparticles’ surface was covered on the surface by organic coatings through the alkyl. Dried magnetic silica microspheres (0.6 g) were added to anhydrous toluene (30 mL) and heated to boiling. Triethylamine (0.6 mL) and ODS (0.9 g) were added to the mixture and refluxed for 5 h. The successfully synthesized C18/MNPs were washed and dried.

2.3.2. Characterization of C18/MNPs

The functional groups, hydrophobicity, roughness, particle size, and magnetic strength of the synthesized C18/MNPs, were analyzed by Fourier transform infrared spectroscopy (FT-IR), Brunaue–Emmett–Teller (BET), static contact angle (SCA), vibrating sample magnetometer (VSM), zeta-potential analysis, and the laser particle size analyzer. For FT-IR, small amounts of the nanoparticles were ground together with KBr at a 1:130 (w/w) ratio, and then they were pressed into flakes. The specific surface area and pore diameter were determined using Brunauer–Emmett–Teller surface area analyzer and a Micromeritics ASAP 2460 V3.01. Surface water contact angles of the scaffolds were measured using a contact angle meter (KRUSS DSA100) at in-room temperature, using a vibrating sample magnetometer (Lake Shore 7404) to collect the magnetization curves. For the size and surface zeta potential, the Nano-Particle size and Zeta Potential Analyzer (Malvern, Zetasizer nano ZS) were used. C18/MNPs were dispersed in deionized water, and zeta potential analysis and laser particle size analysis were performed after 30 min of ultrasound due to its easy magnetic aggregation.

2.4. C18/MNPs-Based Extraction Procedure for the Preconcentration and Detection of Five Kinds of PAHs in Tea

2.4.1. Configuration of Standard Solution and Preparation of Spike Samples

Five kinds of PAHs were dissolved in acetonitrile to obtain spiked samples at concentrations of 300 ng mL−1. Spike samples (0.5, 1, 5, 10, 20, 30, 50, 100, 200, 300 ng g−1) were prepared by adding PAHs standard solution to the tea powder with a vortex to help mix. For example, a spiked sample at 10 ng g−1 was prepared by adding 500 μL of 300 ng mL−1 standard solution to 15 g of tea powder.

2.4.2. Preconcentration Procedures

Figure 1b displays the protocol for the preconcentration of PAHs in tea samples with the aid of the self-prepared magnetic nanoparticles: First, acetonitrile (30 mL) was used to extract 15 g of tea powder with the aid of a 10 min vortex. After filtration, the supernatant was taken, and DI water (70 mL) was diluted. The C18/MNPs (110 mg) were added to adsorb PAHs, and the mixture vortexed for 30 min. The C18/MNPs absorbed the targeted analytes with a 3 × 15 mm (diameter/thickness) ultrapowerful Nd-Fe-B permanent magnet alloy (flux density, B = 200 roT). The acidified acetonitrile (5 mL) was added to the C18/MNPs and vortexed for 90 s. The C18/MNPs were separated and blown dry using a nitrogen-blowing apparatus at 35 °C (2 Nm3 h−1). Acetonitrile (200 μL) was used to reconstitute the residue for UPLC analysis.

2.5. Recycling of C18/MNPs

The used C18/MNPs were transferred into a beaker with the aid of methanol. After ultrasound treatment for 30 min, the MNPs were precipitated by an external strong permanent magnet. The C18/MNPs were washed thrice with methanol and water, dried overnight in an oven at 60.0 °C, and then stored in sealed centrifuge tubes for subsequent use.

2.6. UPLC Analysis

The UPLC analysis used a Luna 5u C18 column (150 mm length, 4.6 mm id, 100 Å pore size, Phenomenex, CA, USA) in a UPLC system equipped with a single-wavelength UV detector (Shimadzu, Japan). Analysis entailed maintaining the column oven at 30 °C, injecting 10 μL of the sample, and employing a flow rate of 0.3 mL min−1. The detection wavelength was set at 254 nm in order to achieve clear peaks for each PAH according to an existing method and our preliminary experiments [26]. Water and acetonitrile were employed as mobile phases A and B, respectively. The elution gradient for UPLC analysis was as follows: 0–15 min, 80% B; 15–40 min, 95% B; 40–45 min, 40% B; 45–50 min, 40% B. All the spiked, blank, and real sample extracts and standards were analyzed using the above UPLC method.

2.7. Statistical Analysis

To evaluate reliability between sample sets, three parallel optimization experiments and practical sample analyses were conducted, and sample data were analyzed using IBM SPSS Statistics. Under the optimization process, one-way analysis of variance (ANOVA) at p < 0.05 was performed for the individual sample to ensure the reliability of the triplicates.

3. Results and Discussion

3.1. Characterizing of C18/MNPs

The FT-IR spectra of the Fe3O4 nanoparticles, Fe3O4-SiO2 nanoparticles, and C18-coated magnetic nanoparticles are shown in Figure 2a. In the spectrum of the C18/MNPs, the absorption band around 590 cm−1 was caused by the stretching vibration of the Fe–O–Fe group, which indicated the existence of ferrite nanocores [27]. The presence of the peaks at around 1095 cm−1 ascertained the existence of the aromatic Si–O–Si group, verifying that the Fe3O4 nanoparticles were covered by a layer of SiO2 [28]. The absorption band around 2800–2900 cm−1 was indicative of the presence of the C18 layer due to the CH2 group originating from the silane coupling agent [28]. Therefore, it indicated that C18-coated ferro ferric oxide had been successfully synthesized.
The adsorption capability of C18/MNPs was further characterized through nitrogen adsorption and desorption isotherms under 77 K. As given in Figure 2b, the N2 adsorption and desorption isotherms all displayed typical Type-IV, which was consistent with the 17.08 nm mesoporous structure of the C18/MNPs in Figure 2c. The calculated BET surface areas and the BJH cumulative pore volumes were 1.52 m2 g−1 and 0.004709 cm3 g−1, respectively [28].
The surface property of C18/MNPs was evaluated by static contact angles. The water contact angle of the as-prepared C18/MNPs shown in Figure 2d is estimated to be 106.5°, indicating that the C18/MNPs were hydrophobic [29].
The surface charge state of C18/MNPs were characterized by measuring the zeta potential of the particles in an aqueous solution. Figure 2e showed that the zeta potential of the C18/MNPs was −10.5 mV. The zeta potential value indicated that the physical stability was good [30].
The DLS analysis of the particle size distribution showed that the particle size of MNPs measured 104 nm, whereas the mean diameter of C18/MNPs was 143 nm. Such nano-level size distribution allows for good dispersal of the nanoparticles in the sample matrix and sufficient contact with the sample. Therefore, the nanoparticles are favorable to be used as adsorbents [31].
The magnetization curve obtained using the VSM in Figure 2g showed that the C18/MNPs were superparamagnetic since the magnetic curve displayed no hysteresis loop. The magnetization values were measured to be 53.2 emu g−1 for C18/MNPs. The result indicated that the magnetism of the C18/MNPs was high enough for the rapid magnetic separation from the sample matrix [32].

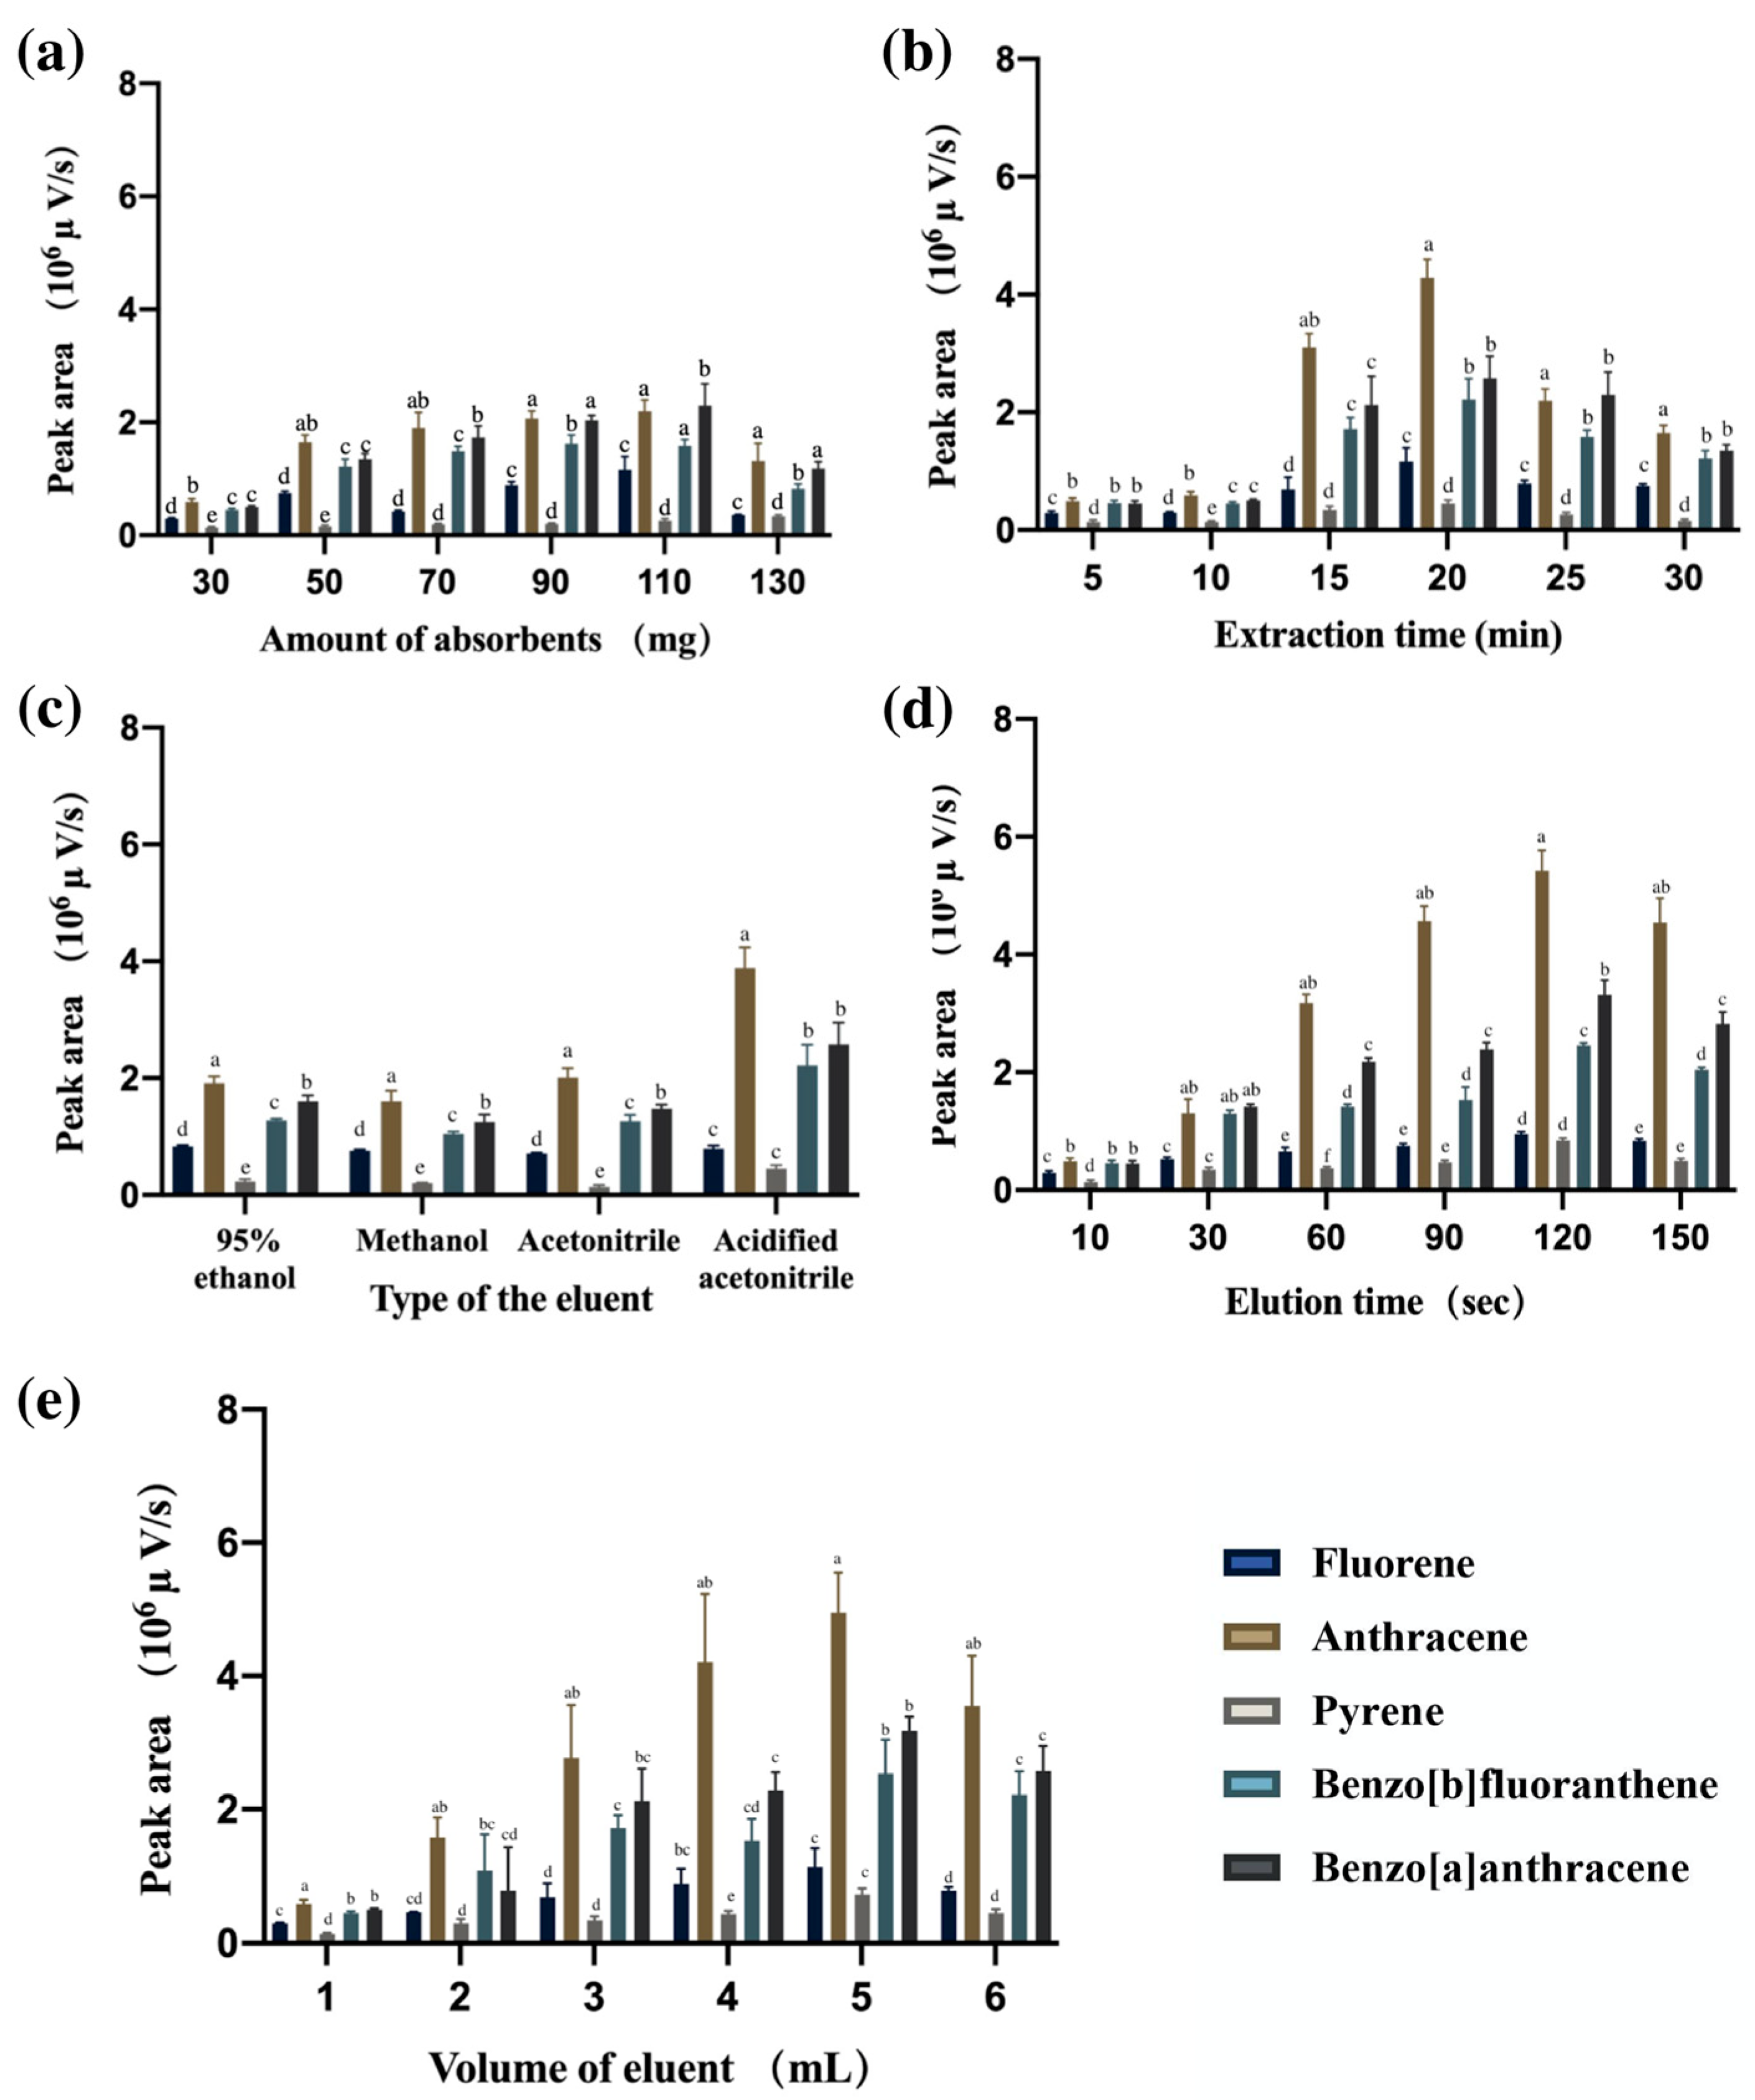
3.2. Optimizing MSPE Conditions

The effects of various parameters were investigated and optimized to improve the extraction efficiency of MSPE [33]. All the optimization experiments were conducted in triplicates, and the averages were used for the bar charts.

3.2.1. Amount of Absorbents

In Figure 3a, the extraction efficiency is positively correlated with the amount of adsorbent used. The increase in the adsorbent amount leads to an increase in the access sites of the adsorbent, thereby elevating the extraction efficiency [34]. According to the results of the statistical analysis, when the adsorbent content reached 90 mg, the peak height was not significantly different from that when the adsorbent content was 110 mg. However, an excessive increase in the adsorbent amount caused a decrease in the adsorption efficiency due to the limitation caused by specific sample volume and contact. Consequently, this can be accounted for in that 90 mg of C18/MNPs was chosen as the optimum use amount of adsorbents.

3.2.2. Extraction Time

Figure 3b shows that the stirring time had a significant influence on the extraction efficiency. In order to minimize the analysis time and maintain a high extraction efficiency within a shorter time frame, the extraction time was optimized within the range of 5–30 min. It was observed that after a stirring time of 20 min, no further increase could be achieved. This could be caused by the distribution equilibrium of the hydrophobic interaction between the PAHs and C18 groups on the magnetic nanoparticles [35]. Therefore, 20 min is set as the optimum extraction time.

3.2.3. Type of the Eluent

Another major influencing factor was the type of elution solvent used. Solvents with different polarities might exert different elution power for certain analytes. This is because the intermolecular force is impacted by the square of the dipole moment of the molecule, which means two pair of molecules with similar dipole moment shares similar interaction power. Based on this, commonly used solvents with different polarities, including methanol (6.6), 95% ethanol (4.3), acetonitrile (6.2), and acidified acetonitrile (3% acetic acid, v/v), were compared for their effectiveness in desorbing PAHs. According to the results displayed in Figure 3c, acidified acetonitrile showed the highest elution power [35]. Therefore, acidified acetonitrile was settled as the elution solvent for the analysis.

3.2.4. Elution Time

Figure 3d showed that 90 s was sufficient for the thorough elution of the PAHs. This can be attributed to the equilibrium time needed for the complete mass transfer of the analyte from the adsorbent to the organic solvent [34].

3.2.5. Volume of Eluent

Next, the volume of eluent had a certain effect. The desorption solvent volume effect was investigated by varying the solution volume from 1 mL to 6 mL. As can be seen from Figure 3e, the peak areas of PAHs increased with the increase in desorption solvent volume and reached a plateau at 5 mL. The optimal solvent volume should be able to eluate the analytes from the adsorbents within a relatively small consumption of the solvent. Therefore, 5 mL was set as the optimum volume [36].

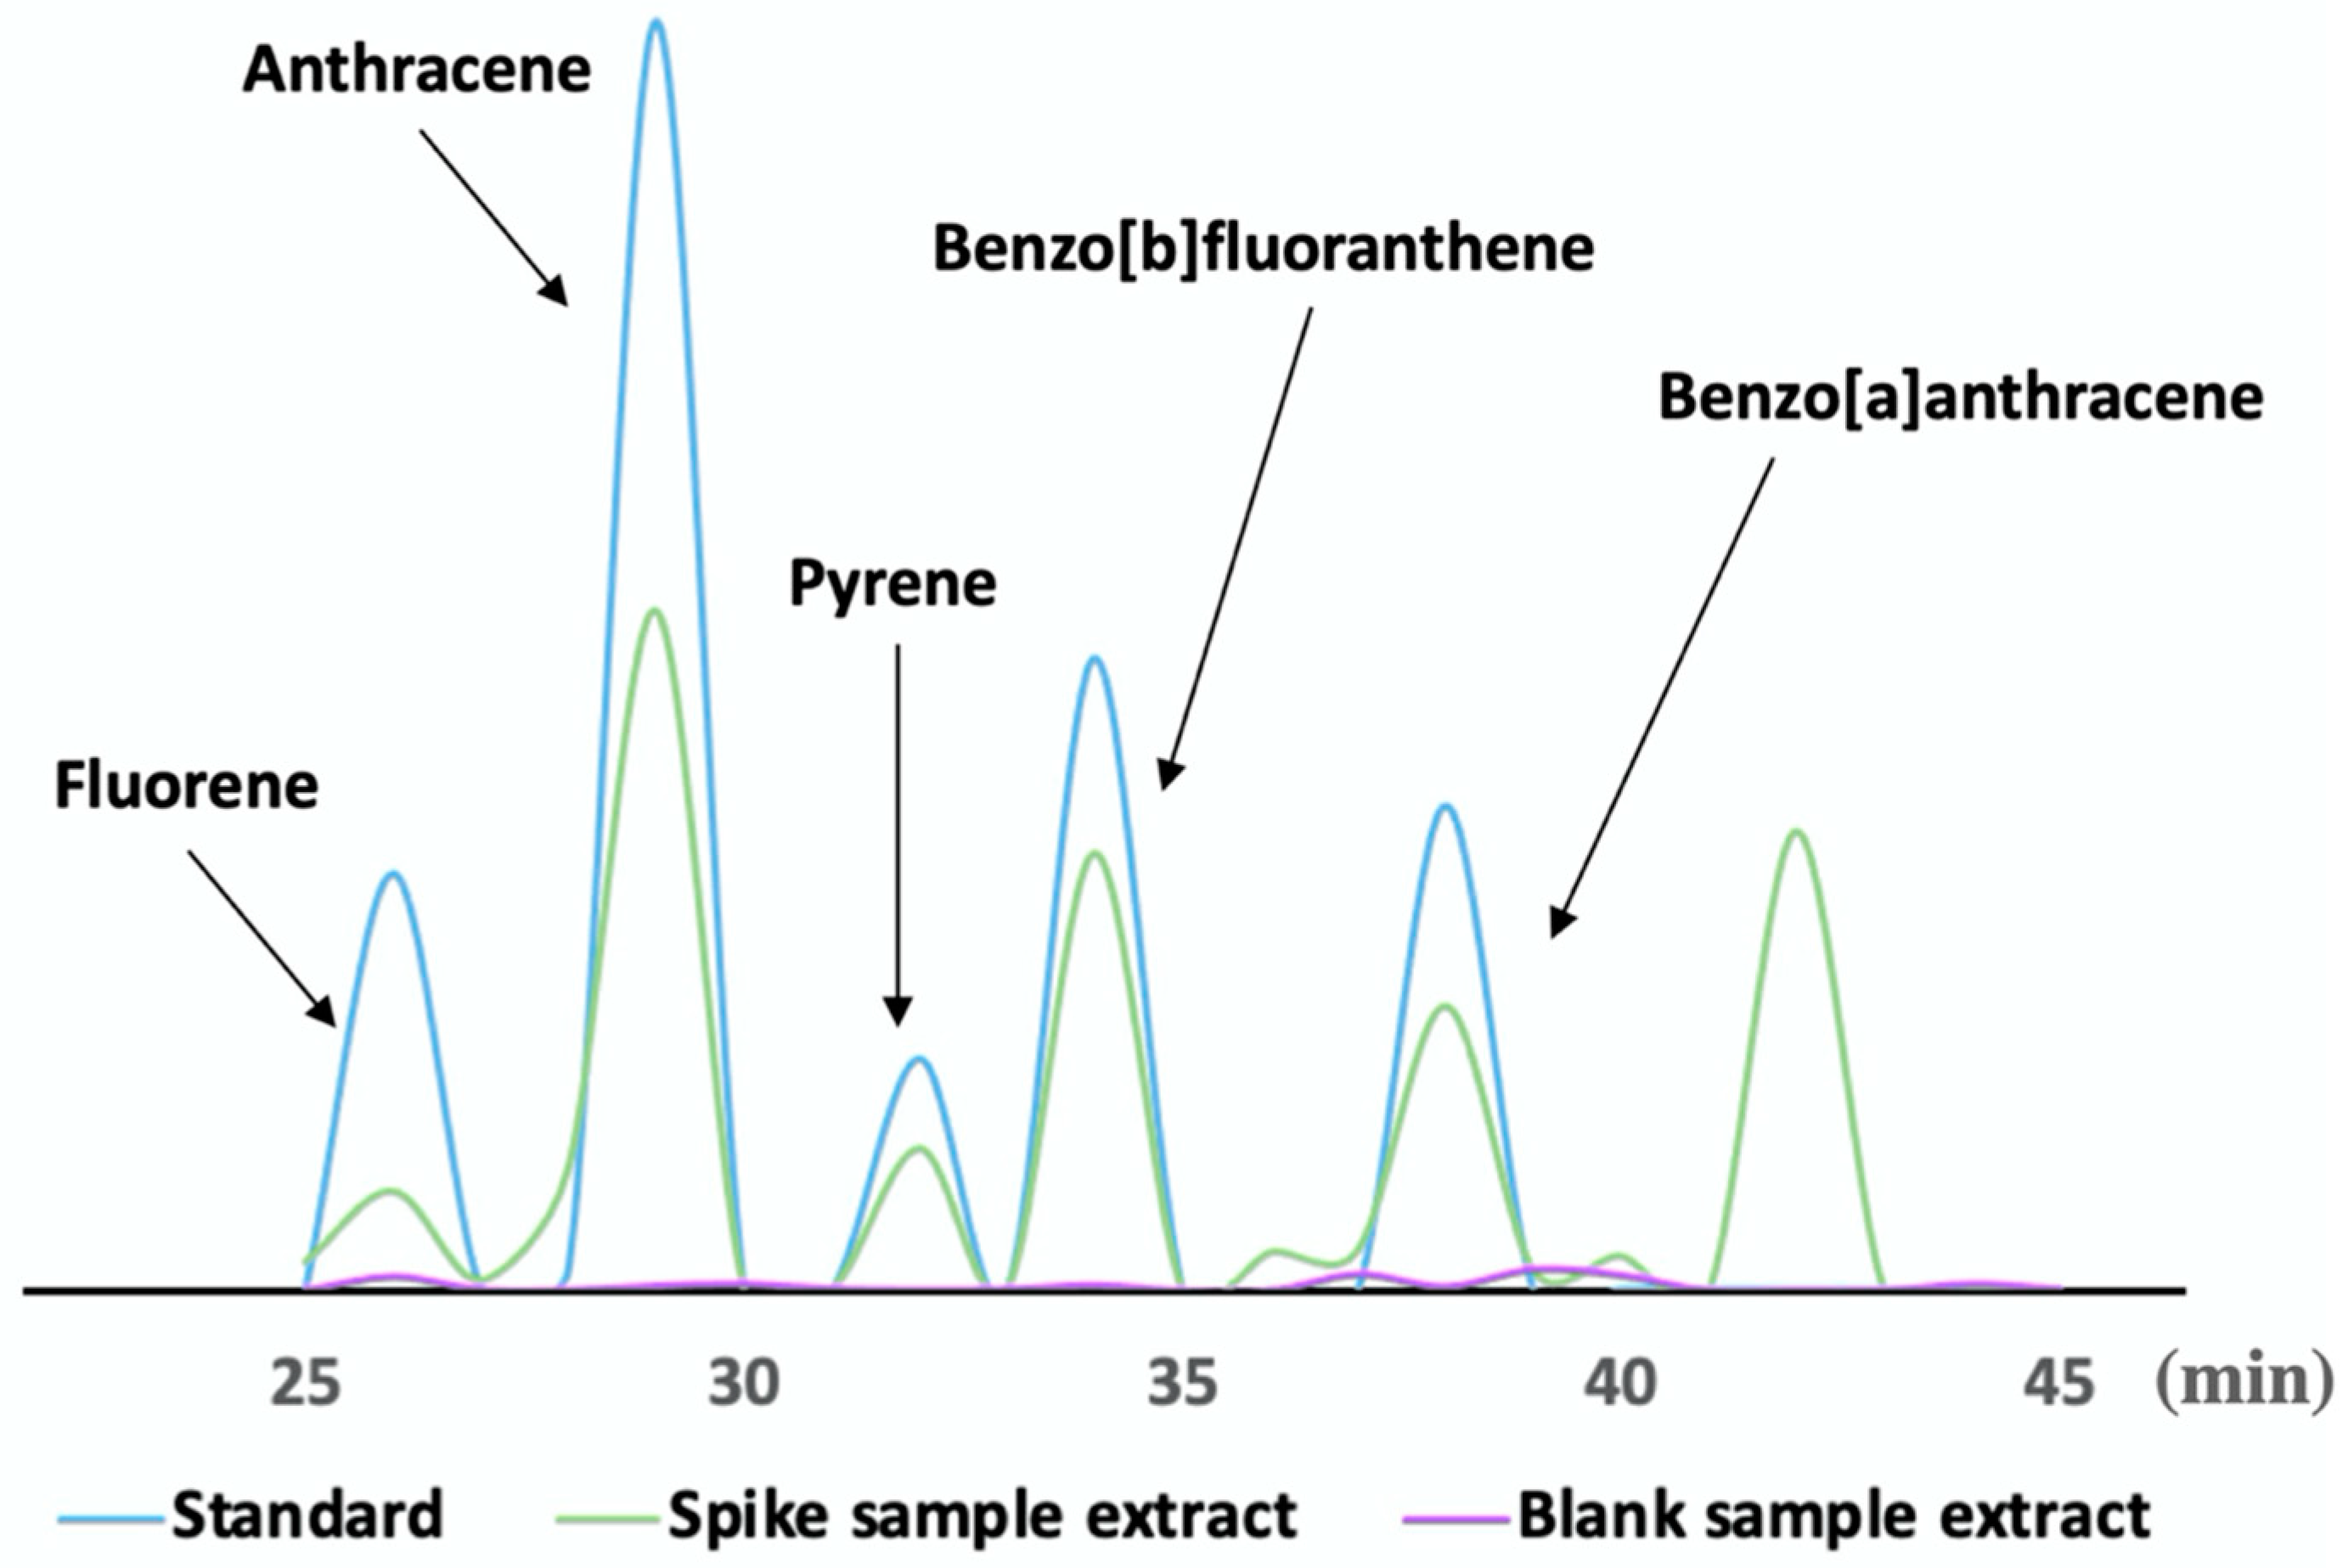
3.3. Evaluation of the Detection Method Performance

The proposed methodology helped the acquisition of PAH calibration curves for different concentrations of tea samples (0.5, 1, 5, 10, 20, 30, 50, 100, 200, and 300 ng g−1). Figure 4 shows PAHs mixed standard solution (300 ng mL−1), spiked sample extract (300 ng g−1), and blank sample extract of the chromatographic results. The calibration curves of five PAHs were obtained using the optimal extraction conditions. Table 2 summarized that the R2 of all calibration curves was greater than 0.997 within the linear range of the analytes, reflecting the result that the method was accurate enough to be suitable for quantitative purposes. The method was further proof of the feasibility of the magnetic nanoparticle enrichment of PAHs in tea samples, which had proven to be more sensitive than traditional methods. When the limits of detection (LODs) and limits of quantification (LOQs) were determined at their lowest concentrations is the point at which the five PAHs can be detected at signal-to-noise ratios above 3 and 10. To draw the proposed method’s accurate LOD and LOQ values, each analyte sample took ten times analysis.
The LOD and LOQ values for the five PAHs of interest were determined in the range of 1.69–9.97 and 5.12–30.21 ng g−1, indicating that the demonstrated method had good sensitivity, which is consistent with other studies that used magnetic nanoparticles [18,21].

3.4. Reproducibility and Reusability of the C18/MNPs

To validate the precision of the C18/MNPs as adsorbents for PAHs in tea, the optimized parameters were used to test the reproducibility of the method that was applied within intra-day and inter-day. To test the reproducibility of the proposed method, the same experiment was repeated three times in one day and on three separate days under the optimized conditions. The samples of tea powder were spiked at 50, 100, and 200 ng g−1, respectively. The result is shown in Table 3. It suggests that the intra-day recovery for PAHs falls within the 81.1–102.1% range, with RSD ranging from 1.3% to 11.9%. Similarly, the inter-day experiment showed recovery between 84.8% and 105.4%, with RSD ranging from 2.3% to 6.8%. The intra-day RSD values were compromised compared with that of inter-day.
After repeating the experiment, the relationship between the UPLC signal of the spiked tea powder extract and the reuse time was displayed in Figure 5. The results suggested that the extraction effectiveness of nanoparticles had no significant change during the repeating extraction procedure, indicating the nanoparticles had good stability and durability. Peak areas of PAHs had RSDs by 8.4% for Fluorene, 5.8% for Anthracene, 10.8% for Pyrene, 3.0% for Benzo[a]anthracene and 2.7% for Benzo[b]fluoranthene, respectively. Thus, it was proved that the recyclability of C18/MNPs was great. Compared to those traditional methods using disposable adsorbents, recyclable magnetic nanoparticles can reduce environmental pollution and costs [37].

3.5. Method Comparison

In Table 4, a comprehensive evaluation of the proposed methodology was carried out by comparing it with other methods. The main factors were listed, including linear range, LOD, and recovery, and the advantages and disadvantages of each method were also analyzed. While traditional methods enable the analysis and detection of PAHs, we found that we require a significant amount of time and a large volume of solvent and are likely to cause secondary pollution. The MSPE detection method has a wider linear range, relatively low RSD, and is capable of preserving the environment by utilizing fewer organic solvents and reusable adsorbents. We used UPLC-UV was utilized in lieu of high-precision instruments such as mass spectrometers, given its commonality, easy accessibility, and low budget. At the same time, the MSPE method can also adapt to different detection needs by changing the selective enrichment material, which has strong flexibility and applicability.

3.6. Real Sample Analysis

Thirteen different brands of tea samples were procured from the Macau supermarket chain between 2020 and 2022. For each brand, three packages were purchased from three different shops. The tea samples were stored at room temperature prior to analysis, and the analysis was conducted at least a month prior to their expiration date.
Commission Regulation (EU) No. 2015/1933 of 27 October 2015 listed already-dried herbs, for which the maximum allowed BaP content may not exceed 10 µg kg−1 and total 4PAHs (Benzo(a)pyrene, Benzo(a)anthracene, Benzo(b)fluoranthene, Chrysen) 50 µg kg−1. However, the MRLs for PAHs in tea were not specified. Here, we used the maximum allowable content for PAHs in herbs to assess the exposure risk of PAHs in tea. Only Benzo(a)anthracene (BaA) and Benzo[b]fluoranthene (BbF) are currently regulated among target PAHs of this experiment and are described with high toxic equivalent factors (TEF). The test results of real samples are shown in Table 5. The content of BaA and BbF was far below the limit or not detected in both black and green tea. A previous study using ultrasonic extraction to detect PAHs in dried black and green tea found high levels of Fluorene (Flu) (mean value 95.2 ng g−1 and 134.9 ng g−1, respectively) and relatively low levels of Benzo(a)anthracene (BaA) (mean value 20.9 ng g−1 and 28.4 ng g−1, respectively). In addition, a certain amount of BbF was also detected (mean value 9 ng g−1 in both dried black and green tea) [38]. This study is mostly consistent with previous results. We found a high content of Flu (mean value 132.3 ng g−1 in green tea, 109.8 ng g−1 in black tea) and BaA with a maximum content of 8.4 ng g−1 in green tea; such differences may be caused by the environmental pollution in the tea-growing region and tea processing techniques. Furthermore, we also found a relatively high amount of Anthracene (Ant) and Pyrene (Pyr), which has not been reported by other research; since there are no regulations about PAHs in dried tea, we strongly advise that the health risks of Pyr can be estimated and we hope that our study can provide theoretical support to the establishment of the standards.
In addition, many studies have reported the highest total amount of ∑16PAH in dry black tea. Black tea is made by fully fermenting tea leaves for several hours, followed by smoking or steaming. Combustion of firewood produces PAHs, so black tea is expected to absorb PAHs through the smoke [43]. Green tea, on the other hand, is made from fresh young leaves without fermentation. However, the essential oils in the tea can act as co-solvents for many lipophilic substances, thereby increasing the solubility of PAH in tea infusion [44]. The high temperature during black tea manufacturing may reduce the content of essential oils in the tea [45]. These studies, including this study, indicated the low health risk of PAH exposure associated with tea consumption [46].

4. Conclusions

In general, an MSPE platform was developed as a methodological innovation to the current pretreatment approaches for solid food matrices. Currently, the MSPE techniques are mainly confined to liquid matrices, which has hindered its expansion. The proposed methodology improved its application, enabling the pretreatment of a wider variety of samples. In this experiment, self-prepared C18-functionalized ultrafine magnetic silica nanoparticles were used for the detection of PAHs in tea with the extraction efficiency parameters optimized. Under the optimum conditions, the method was assayed and yielded satisfactory linearity, sensitivity, and reproducibility. The fine particle size of the nanoparticles contributed to their high specific surface area and adsorption sites. Additionally, C18/MNPs can be isolated by using permanent magnets after extraction, which means a simple and fast pre-processing method for instrumental analysis. The ability to reuse the nanoparticles considerably reduces costs and pollution, making this approach promising for solid food analysis, including barbecue, coffee, and similar samples. Overall, the developed method of MSPE with magnetic solid phase extraction is expected to serve as a promising platform for monitoring food safety.

Author Contributions

Conceptualization, X.Z., X.F., J.C., L.Z. (Lanxin Zhang), L.Z. (Lingzi Zhai) and Y.X.; Methodology, L.Z. (Lanxin Zhang); Formal analysis, J.C.; Investigation, L.Z. (Lingzi Zhai); Resources, Y.Y., Y.C., T.Z. and X.Y.; Data curation, X.Z., J.C., L.Z. (Lanxin Zhang) and L.Z. (Lingzi Zhai); Writing—original draft, X.Z.; Writing—review & editing, X.F., S.L., Y.Y., Y.C., X.Y. and Y.X.; Supervision, T.Z., X.Y. and Y.X.; Project administration, X.Y. All authors have read and agreed to the published version of the manuscript.

Funding

This research was funded by the Science and Technology Development Fund, Macau SAR (Grant 0024/2022/A), the Science and Technology Planning Project of Guangdong Province (2020B1212030008), Industry-academia-research projects of Zhuhai City (ZH22017002200002PWC), and the Sichuan International Science and Technology Innovation Cooperation Project from the Science and Technology Department of Sichuan Province (2022YFH0104). And the APC was funded by the Science and Technology Planning Project of Guangdong Province (2020B1212030008).

Data Availability Statement

The data used to support the findings of this study can be made available by the corresponding author upon request.

Conflicts of Interest

The authors declare no conflict of interest.

References

  1. Sagar, B.; Anupam, M.; Anusha, M.; Avishek, B. Tea and its phytochemicals: Hidden health benefits & modulation of signaling cascade by phytochemicals. Food Chem. 2022, 371, 131098. [Google Scholar] [CrossRef]
  2. Li, X.; Zhang, Z.; Li, P.; Zhang, Q.; Zhang, W.; Ding, X. Determination for major chemical contaminants in tea (Camellia sinensis) matrices: A review. Food Res. Int. 2013, 53, 649–658. [Google Scholar] [CrossRef]
  3. Tallei, T.E.; Niode, N.J.; Idroes, R.; Zidan, B.; Mitra, S.; Celik, I.; Nainu, F.; Ağagündüz, D.; Emran, T.B.; Capasso, R. A comprehensive review of the potential use of green tea polyphenols in the management of COVID-19. Evid.-Based Complement. Altern. Med. 2021, 2021, 7170736. [Google Scholar] [CrossRef] [PubMed]
  4. Tran-Lam, T.-T.; Hai Dao, Y.; Kim Thi Nguyen, L.; Kim Ma, H.; Nguyen Tran, H.; Truong Le, G. Simultaneous Determination of 18 Polycyclic Aromatic Hydrocarbons in Daily Foods (Hanoi Metropolitan Area) by Gas Chromatography–Tandem Mass Spectrometry. Foods 2018, 7, 201. [Google Scholar] [CrossRef] [Green Version]
  5. Bansal, V.; Kim, K.-H. Review of PAH contamination in food products and their health hazards. Environ. Int. 2015, 84, 26–38. [Google Scholar] [CrossRef]
  6. Roudbari, A.; Rafiei Nazari, R.; Shariatifar, N.; Moazzen, M.; Abdolshahi, A.; Mirzamohammadi, S.; Madani-Tonekaboni, M.; Delvarianzadeh, M.; Arabameri, M. Concentration and health risk assessment of polycyclic aromatic hydrocarbons in commercial tea and coffee samples marketed in Iran. Environ. Sci. Pollut. Res. 2021, 28, 4827–4839. [Google Scholar] [CrossRef]
  7. Plaza-Bolaños, P.; Frenich, A.G.; Vidal, J.L.M. Polycyclic aromatic hydrocarbons in food and beverages. Analytical methods and trends. J. Chromatogr. A 2010, 1217, 6303–6326. [Google Scholar] [CrossRef]
  8. Atirah Mohd Nazir, N.; Raoov, M.; Mohamad, S. Spent tea leaves as an adsorbent for micro-solid-phase extraction of polycyclic aromatic hydrocarbons (PAHs) from water and food samples prior to GC-FID analysis. Microchem. J. 2020, 159, 105581. [Google Scholar] [CrossRef]
  9. Zelinkova, Z.; Wenzl, T. The Occurrence of 16 EPA PAHs in Food—A Review. Polycycl. Aromat. Compd. 2015, 35, 248–284. [Google Scholar] [CrossRef] [Green Version]
  10. Ziegenhals, K.; Jira, W.; Speer, K. Polycyclic aromatic hydrocarbons (PAH) in various types of tea. Eur. Food Res. Technol. 2008, 228, 83–91. [Google Scholar] [CrossRef]
  11. Duedahl-Olesen, L.; Navaratnam, M.A.; Jewula, J.; Jensen, A.H. PAH in Some Brands of Tea and Coffee. Polycycl. Aromat. Compd. 2015, 35, 74–90. [Google Scholar] [CrossRef]
  12. Li, X.-Y.; Li, N.; Luo, H.-D.; Lin, L.-R.; Zou, Z.-X.; Jia, Y.-Z.; Li, Y.-Q. A Novel Synchronous Fluorescence Spectroscopic Approach for the Rapid Determination of Three Polycyclic Aromatic Hydrocarbons in Tea with Simple Microwave-Assisted Pretreatment of Sample. J. Agric. Food Chem. 2011, 59, 5899–5905. [Google Scholar] [CrossRef] [PubMed]
  13. Adisa, A.; Jimenez, A.; Woodham, C.; Anthony, K.; Nguyen, T.; Saleh, M.A. Determination of polycyclic aromatic hydrocarbons in dry tea. J. Environ. Sci. Health Part B 2015, 50, 552–559. [Google Scholar] [CrossRef] [Green Version]
  14. Khiadani, M.; Amin, M.; Beik, F.; Ebrahimi, A.; Farhadkhani, M.; Mohammadi-Moghadam, F. Determination of polycyclic aromatic hydrocarbons concentration in eight brands of black tea which are used more in Iran. Int. J. Environ. Health Eng. 2013, 2, 40. [Google Scholar] [CrossRef]
  15. Sadowska-Rociek, A.; Surma, M.; Cieślik, E. Comparison of different modifications on QuEChERS sample preparation method for PAHs determination in black, green, red and white tea. Environ. Sci. Pollut. Res. 2014, 21, 1326–1338. [Google Scholar] [CrossRef]
  16. Ren, Z.; Chen, Z.; Zhang, Y.; Lin, X.; Li, Z.; Weng, W.; Yang, H.; Li, B. Effect of heat-treated tea water-insoluble protein nanoparticles on the characteristics of Pickering emulsions. LWT 2021, 149, 111999. [Google Scholar] [CrossRef]
  17. Ren, Z.; Li, Z.; Chen, Z.; Zhang, Y.; Lin, X.; Weng, W.; Yang, H.; Li, B. Characteristics and application of fish oil-in-water pickering emulsions structured with tea water-insoluble proteins/κ-carrageenan complexes. Food Hydrocoll. 2021, 114, 106562. [Google Scholar] [CrossRef]
  18. Zhou, D.-B.; Sheng, X.; Han, F.; Hu, Y.-Y.; Ding, L.; Lv, Y.-L.; Song, W.; Zheng, P. Magnetic solid-phase extraction based on [60]fullerene functionalization of magnetic nanoparticles for the determination of sixteen polycyclic aromatic hydrocarbons in tea samples. J. Chromatogr. A 2018, 1578, 53–60. [Google Scholar] [CrossRef] [PubMed]
  19. Yu, X.; Zhong, T.; Zhang, Y.; Zhao, X.; Xiao, Y.; Wang, L.; Liu, X.; Zhang, X. Design, Preparation, and Application of Magnetic Nanoparticles for Food Safety Analysis: A Review of Recent Advances. J. Agric. Food Chem. 2022, 70, 46–62. [Google Scholar] [CrossRef] [PubMed]
  20. Baber, O.; Jang, M.; Barber, D.; Powers, K. Amorphous silica coatings on magnetic nanoparticles enhance stability and reduce toxicity to in vitro BEAS-2B cells. Inhal. Toxicol. 2011, 23, 532–543. [Google Scholar] [CrossRef]
  21. Shi, Y.; Wu, H.; Wang, C.; Guo, X.; Du, J.; Du, L. Determination of polycyclic aromatic hydrocarbons in coffee and tea samples by magnetic solid-phase extraction coupled with HPLC–FLD. Food Chem. 2016, 199, 75–80. [Google Scholar] [CrossRef] [PubMed]
  22. Bianchi, F.; Chiesi, V.; Casoli, F.; Luches, P.; Nasi, L.; Careri, M.; Mangia, A. Magnetic solid-phase extraction based on diphenyl functionalization of Fe3O4 magnetic nanoparticles for the determination of polycyclic aromatic hydrocarbons in urine samples. J. Chromatogr. A 2012, 1231, 8–15. [Google Scholar] [CrossRef] [PubMed]
  23. Ma, J.; Yan, F.; Chen, F.; Jiang, L.; Li, J.; Chen, L. C18-Functionalized Magnetic Silica Nanoparticles for Solid Phase Extraction of Microcystin-LR in Reservoir Water Samples Followed by HPLC-DAD Determination. J. Liq. Chromatogr. Relat. Technol. 2015, 38, 655–661. [Google Scholar] [CrossRef]
  24. Guo, B.; Ji, S.; Zhang, F.; Yang, B.; Gu, J.; Liang, X. Preparation of C18-functionalized Fe3O4@SiO2 core–shell magnetic nanoparticles for extraction and determination of phthalic acid esters in Chinese herb preparations. J. Pharm. Biomed. Anal. 2014, 100, 365–368. [Google Scholar] [CrossRef] [PubMed]
  25. Jiang, C.; Sun, Y.; Yu, X.; Zhang, L.; Sun, X.; Gao, Y.; Zhang, H.; Song, D. Removal of sudan dyes from water with C18-functional ultrafine magnetic silica nanoparticles. Talanta 2012, 89, 38–46. [Google Scholar] [CrossRef]
  26. Noël, L.; Authier-martin, M.; Patry, G.; Marcoux, A.; Jean, P. Quantitative Analysis of PAH in Pitch by HPLC with Fluorescence Detector. Polycycl. Aromat. Compd. 1996, 9, 373–380. [Google Scholar] [CrossRef]
  27. Yu, X.; Yang, H. Pyrethroid residue determination in organic and conventional vegetables using liquid-solid extraction coupled with magnetic solid phase extraction based on polystyrene-coated magnetic nanoparticles. Food Chem. 2017, 217, 303–310. [Google Scholar] [CrossRef]
  28. Xiong, X.; Li, D.; Du, Z.; Xiong, C.; Jiang, H. Magnetic solid-phase extraction modified Quick, Easy, Cheap, Effective, Rugged and Safe method combined with pre-column derivatization and ultra-high performance liquid chromatography-tandem mass spectrometry for determination of estrogens and estrogen mimics in pork and chicken samples. J. Chromatogr. A 2020, 1622, 461137. [Google Scholar] [CrossRef]
  29. Singh, A.; Singh, M.; Pandey, A.; Ullas, A.V.; Mishra, S. Hydrophobicity of cotton fabric treated with plant extract, TiO2 nanoparticles and beeswax. Mater. Today Proc. 2023, 80, 1530–1533. [Google Scholar] [CrossRef]
  30. Wang, M.; Yang, Q.; Li, M.; Zou, H.; Wang, Z.; Ran, H.; Zheng, Y.; Jian, J.; Zhou, Y.; Luo, Y.; et al. Multifunctional Nanoparticles for Multimodal Imaging-Guided Low-Intensity Focused Ultrasound/Immunosynergistic Retinoblastoma Therapy. ACS Appl. Mater. Interfaces 2020, 12, 5642–5657. [Google Scholar] [CrossRef]
  31. Wang, J.; Meng, G.; Tao, K.; Feng, M.; Zhao, X.; Li, Z.; Xu, H.; Xia, D.; Lu, J.R. Immobilization of Lipases on Alkyl Silane Modified Magnetic Nanoparticles: Effect of Alkyl Chain Length on Enzyme Activity. PLoS ONE 2012, 7, e43478. [Google Scholar] [CrossRef] [PubMed]
  32. Venkateswarlu, S.; Rao, Y.S.; Balaji, T.; Prathima, B.; Jyothi, N.V.V. Biogenic synthesis of Fe3O4 magnetic nanoparticles using plantain peel extract. Mater. Lett. 2013, 100, 241–244. [Google Scholar] [CrossRef]
  33. Yu, X.; Li, Z.; Zhao, M.; Lau, S.C.S.; Ru Tan, H.; Teh, W.J.; Yang, H.; Zheng, C.; Zhang, Y. Quantification of aflatoxin B1 in vegetable oils using low temperature clean-up followed by immuno-magnetic solid phase extraction. Food Chem. 2019, 275, 390–396. [Google Scholar] [CrossRef] [PubMed]
  34. Shahriman, M.S.; Ramachandran, M.R.; Zain, N.N.M.; Mohamad, S.; Manan, N.S.A.; Yaman, S.M. Polyaniline-dicationic ionic liquid coated with magnetic nanoparticles composite for magnetic solid phase extraction of polycyclic aromatic hydrocarbons in environmental samples. Talanta 2018, 178, 211–221. [Google Scholar] [CrossRef]
  35. Srivastava, N.; Kumari, S.; Nair, K.; Alam, S.; Raza, S.K. Determination of Organophosphorous Pesticides in Environmental Water Samples Using Surface-Engineered C18 Functionalized Silica-Coated Core-Shell Magnetic Nanoparticles-Based Extraction Coupled with GC-MS/MS Analysis. J. AOAC Int. 2017, 100, 804–809. [Google Scholar] [CrossRef]
  36. Pan, S.; Zhang, J.; He, Q.; Chen, X.; Jin, M. Fabrication of benzenesulfonic acid groups modified magnetic microspheres as an MSPE adsorbent for fast determination of paraquat and diquat in human urine combined with UPLC-HRMS. J. Chromatogr. B 2020, 1136, 121880. [Google Scholar] [CrossRef]
  37. Ma, L.; Nilghaz, A.; Choi, J.R.; Liu, X.; Lu, X. Rapid detection of clenbuterol in milk using microfluidic paper-based ELISA. Food Chem. 2018, 246, 437–441. [Google Scholar] [CrossRef]
  38. Ciemniak, A.; Kuźmicz, K.; Rajkowska-Myśliwiec, M.; Cadena, M.F. Assessing the contamination levels of dried teas and their infusions by polycyclic aromatic hydrocarbons (PAHs). J. Consum. Prot. Food Saf. 2019, 14, 263–274. [Google Scholar] [CrossRef] [Green Version]
  39. Stuppner, S.; Hussain, S.; Mark, B.; Gjerde, D.; Rainer, M.; Jakschitz, T.; Bonn, G.K. An automated preloaded pipet tip SPE method for the accurate quantification of carcinogenic polycyclic aromatic hydrocarbons from tea. Anal. Methods 2020, 12, 1827–1833. [Google Scholar] [CrossRef]
  40. Pissinatti, R.; Nunes, C.M.; de Souza, A.G.; Junqueira, R.G.; de Souza, S.V.C. Simultaneous analysis of 10 polycyclic aromatic hydrocarbons in roasted coffee by isotope dilution gas chromatography-mass spectrometry: Optimization, in-house method validation and application to an exploratory study. Food Control 2015, 51, 140–148. [Google Scholar] [CrossRef]
  41. Li, J.; Ma, J.; Zhang, Y.; Zheng, L. Determination of 19 polyphenolic compounds in tea by ultra-high performance liquid chromatography combined with quadrupole-time of flight mass spectrometry. Food Sci. Hum. Wellness 2022, 11, 719–726. [Google Scholar] [CrossRef]
  42. Benson, N.U.; Fred-Ahmadu, O.H.; Olugbuyiro, J.A.O.; Anake, W.U.; Adedapo, A.E.; Olajire, A.A. Concentrations, sources and risk characterisation of polycyclic aromatic hydrocarbons (PAHs) in green, herbal and black tea products in Nigeria. J. Food Compos. Anal. 2018, 66, 13–22. [Google Scholar] [CrossRef]
  43. da Silva Pinto, M. Tea: A new perspective on health benefits. Food Res. Int. 2013, 53, 558–567. [Google Scholar] [CrossRef]
  44. Pincemaille, J.; Schummer, C.; Heinen, E.; Moris, G. Determination of polycyclic aromatic hydrocarbons in smoked and non-smoked black teas and tea infusions. Food Chem. 2014, 145, 807–813. [Google Scholar] [CrossRef]
  45. Rowshan, V.; Bahmanzadegan, A.; Saharkhiz, M.J. Influence of storage conditions on the essential oil composition of Thymus daenensis Celak. Ind. Crop. Prod. 2013, 49, 97–101. [Google Scholar] [CrossRef] [Green Version]
  46. Roszko, M.; Kamińska, M.; Szymczyk, K.; Jędrzejczak, R. Dietary risk evaluation for 28 polycyclic aromatic hydrocarbons (PAHs) in tea preparations made of teas available on the Polish retail market. J. Environ. Sci. Health Part B 2018, 53, 25–34. [Google Scholar] [CrossRef]
Figure 1. (a) Synthesis of C18/MNPs; (b) Protocol for the analysis of the tea powder using the proposed method.
Foods 12 02270 g001
Figure 2. Characterizations of the magnetic C18/MNPs (a) Fourier transform infrared spectra; (b) Adsorption and desorption of nitrogen isotherms; (c) Pore distribution; (d) Static contact angle image; (e) Zeta-potential; (f) Particle size distribution; (g) Hysteresis loop.
Foods 12 02270 g002
Figure 3. Optimizing MSPE conditions: (a) Amount of adsorbents; (b) Extraction time; (c) Type of the eluent; (d) Elution time; (e) Volume of eluent. Note: ND: Identical letters indicate insignificant differences, while different letters indicate significant differences (p = 0.05).
Foods 12 02270 g003
Figure 4. UPLC chromatograms of the standard solution of 5 PAHs, the spiked sample extract, and the blank extract.
Foods 12 02270 g004
Figure 5. Effect of recycling times on the peak areas of PAHs.
Foods 12 02270 g005
Table 1. The chemical structures composed of five PAHs.
Chemical NameAbbreviationMolecular
Structure
Molecular
Formula
Molecular WeightRingType
FluoreneFLUFoods 12 02270 i001C13H10166.223Light PAHs
AnthraceneANTFoods 12 02270 i002C14H10178.233Light PAHs
PyrenePYRFoods 12 02270 i003C16H10202.254Light PAHs
Benzo[a]anthraceneBaAFoods 12 02270 i004C18H12228.34Light PAHs
Benzo[b]fluorantheneBbFFoods 12 02270 i005C20H12252.35Heavy PAHs
Table 2. Linearity, limits of detection (LODs), and limits of quantification (LOQs) of the proposed method for analyzing PAHs in tea.
AnalyteEquation of Calibration CurveR2LOD (ng g−1)LOQ (ng g−1)
Fluoreney = 48627x + 716420.9987.9324.03
Anthraceney = 106034x + 43188550.9995.3216.12
Pyreney = 22396x + 2168480.9979.9730.21
Benzo[a]anthraceney = 56517x + 3578480.9981.695.12
Benzo[b]fluorantheney = 51622x + 6613150.9985.4316.45
Table 3. Inter-day and intra-day reproducibility of 5 PAHs.
AnalyteConcentration (ng g−1)Intra-Day PrecisionInter-Day Precision
Recovery ± SD (%)RSD (%)Recovery ± SD (%)RSD (%)
Fluorene5094.8 ± 2.83.484.8 ± 2.96.8
10095.2 ± 0.71.391.6 ± 0.33.1
20088.9 ± 1.91.493.6 ± 6.16.6
Anthracene5091.7 ± 0.82.988.1 ± 0.95.9
100100.2 ± 1.61.394.6 ± 0.73.7
20093.0 ± 0.26.799.0 ± 2.32.3
Pyrene5089.9 ± 1.25.999.3 ± 0.72.8
10095.8 ± 1.42.3100.5 ± 1.74.7
200102.1 ± 0.711.9105.4 ± 3.02.9
Benzo[a]
anthracene
5099.1 ± 1.12.193.2 ± 1.85.1
10097.4 ± 0.92.496.7 ± 0.66.2
20081.1 ± 2.22.286.3 ± 3.64.2
Benzo[b]
fluoranthene
50102.1 ± 3.17.196.2 ± 2.14.9
10098.2 ± 1.72.998.5 ± 5.25.2
20093.4 ± 3.55.291.4 ± 3.64.0
Table 4. Comparison between the proposed and other methods for the analysis of PAHs in tea/coffee.
MethodDetection TechniqueSampleLinear Range (ng g−1)LOD
(ng g−1)
Recovery (%)RSD (%)References
SPEGC-MSDry tea-0.09–0.3237.00–96.10-Ciemniak et al.
(2019) [38]
SPEHPLC-FLDTea-16.0090.00–95.00<10.00Stuppner et al. (2020) [39]
LLEGC-MSRoasted coffee0.25–4.000.04–0.1887.08–111.283.26–23.75Pissinatti et al. (2015) [40]
GEUPLC-Q-TOF-MSTea-2.00–100.0078.40–109.201.33–9.72Li et al. (2022) [41]
UAEGC-FIDDry tea-0.3090.24–108.9277.02–100.60Benson et al.
(2018) [42]
MSPEUPLC-UVTea0.50–300.001.69–9.9784.80–105.402.30–6.80This work
Note: LLE, GE, and UAE stand for Liquid-liquid Extraction, Gradient Elution, and Ultrasonic Assisted Extraction, respectively. GC-MS, HPLC-FLD, UPLC-Q-TOF-MS, GC-FID, and UPLC-UV stand for Gas Chromatography-Mass Spectrometer, High-Performance Liquid Chromatography-Fluorescence Detector, Ultraperformance Liquid Chromatography–Quadrupole Time-Of-Flight Mass Spectrometry, Gas Chromatography-Flame Ionization Detector, and Ultra-Performance Liquid Chromatography-Ultraviolet, respectively.
Table 5. Real sample analysis of tea.
Tea Type Fluorene
(ng g−1)
Anthracene (ng g−1)Pyrene (ng g−1)Benzo[a]anthracene (ng g−1)Benzo[b]fluoranthene (ng g−1)
Green
(10 tea brands)
Mean132.341.9109.5N.D.N.D.
Min31.2N.D.N.D.N.D.N.D.
MaxN.D.196.5N.D.8.4N.D.
Black
(3 tea brands)
Mean109.821.794.6N.D.N.D.
Min81.9N.D.70.3N.D.N.D.
Max141.531.2113.45.3N.D.
Note: N.D.: not detected or beyond the linear range.
Disclaimer/Publisher’s Note: The statements, opinions and data contained in all publications are solely those of the individual author(s) and contributor(s) and not of MDPI and/or the editor(s). MDPI and/or the editor(s) disclaim responsibility for any injury to people or property resulting from any ideas, methods, instructions or products referred to in the content.

