
Three-Dimensional Appearance and Physicochemical Properties of Pleurotus eryngii under Different Drying Methods
 , , and
Abstract
:1. Introduction
2. Materials and Methods
2.1. Samples and Chemicals
2.2. Drying Experiments
2.3. Drying Characteristics
2.4. Point Cloud Data Acquisition
2.5. Three-Dimensional Appearance Evaluation Index
2.5.1. Shrinkage
2.5.2. Roughness
2.6. Color Measurement
2.7. Determination of Total Polysaccharide Content (TPC)
2.8. Determination of DPPH Radical Scavenging Activity
2.9. Microstructure Analysis
2.10. Statistical Analysis
3. Results and Discussions
3.1. Drying Curves
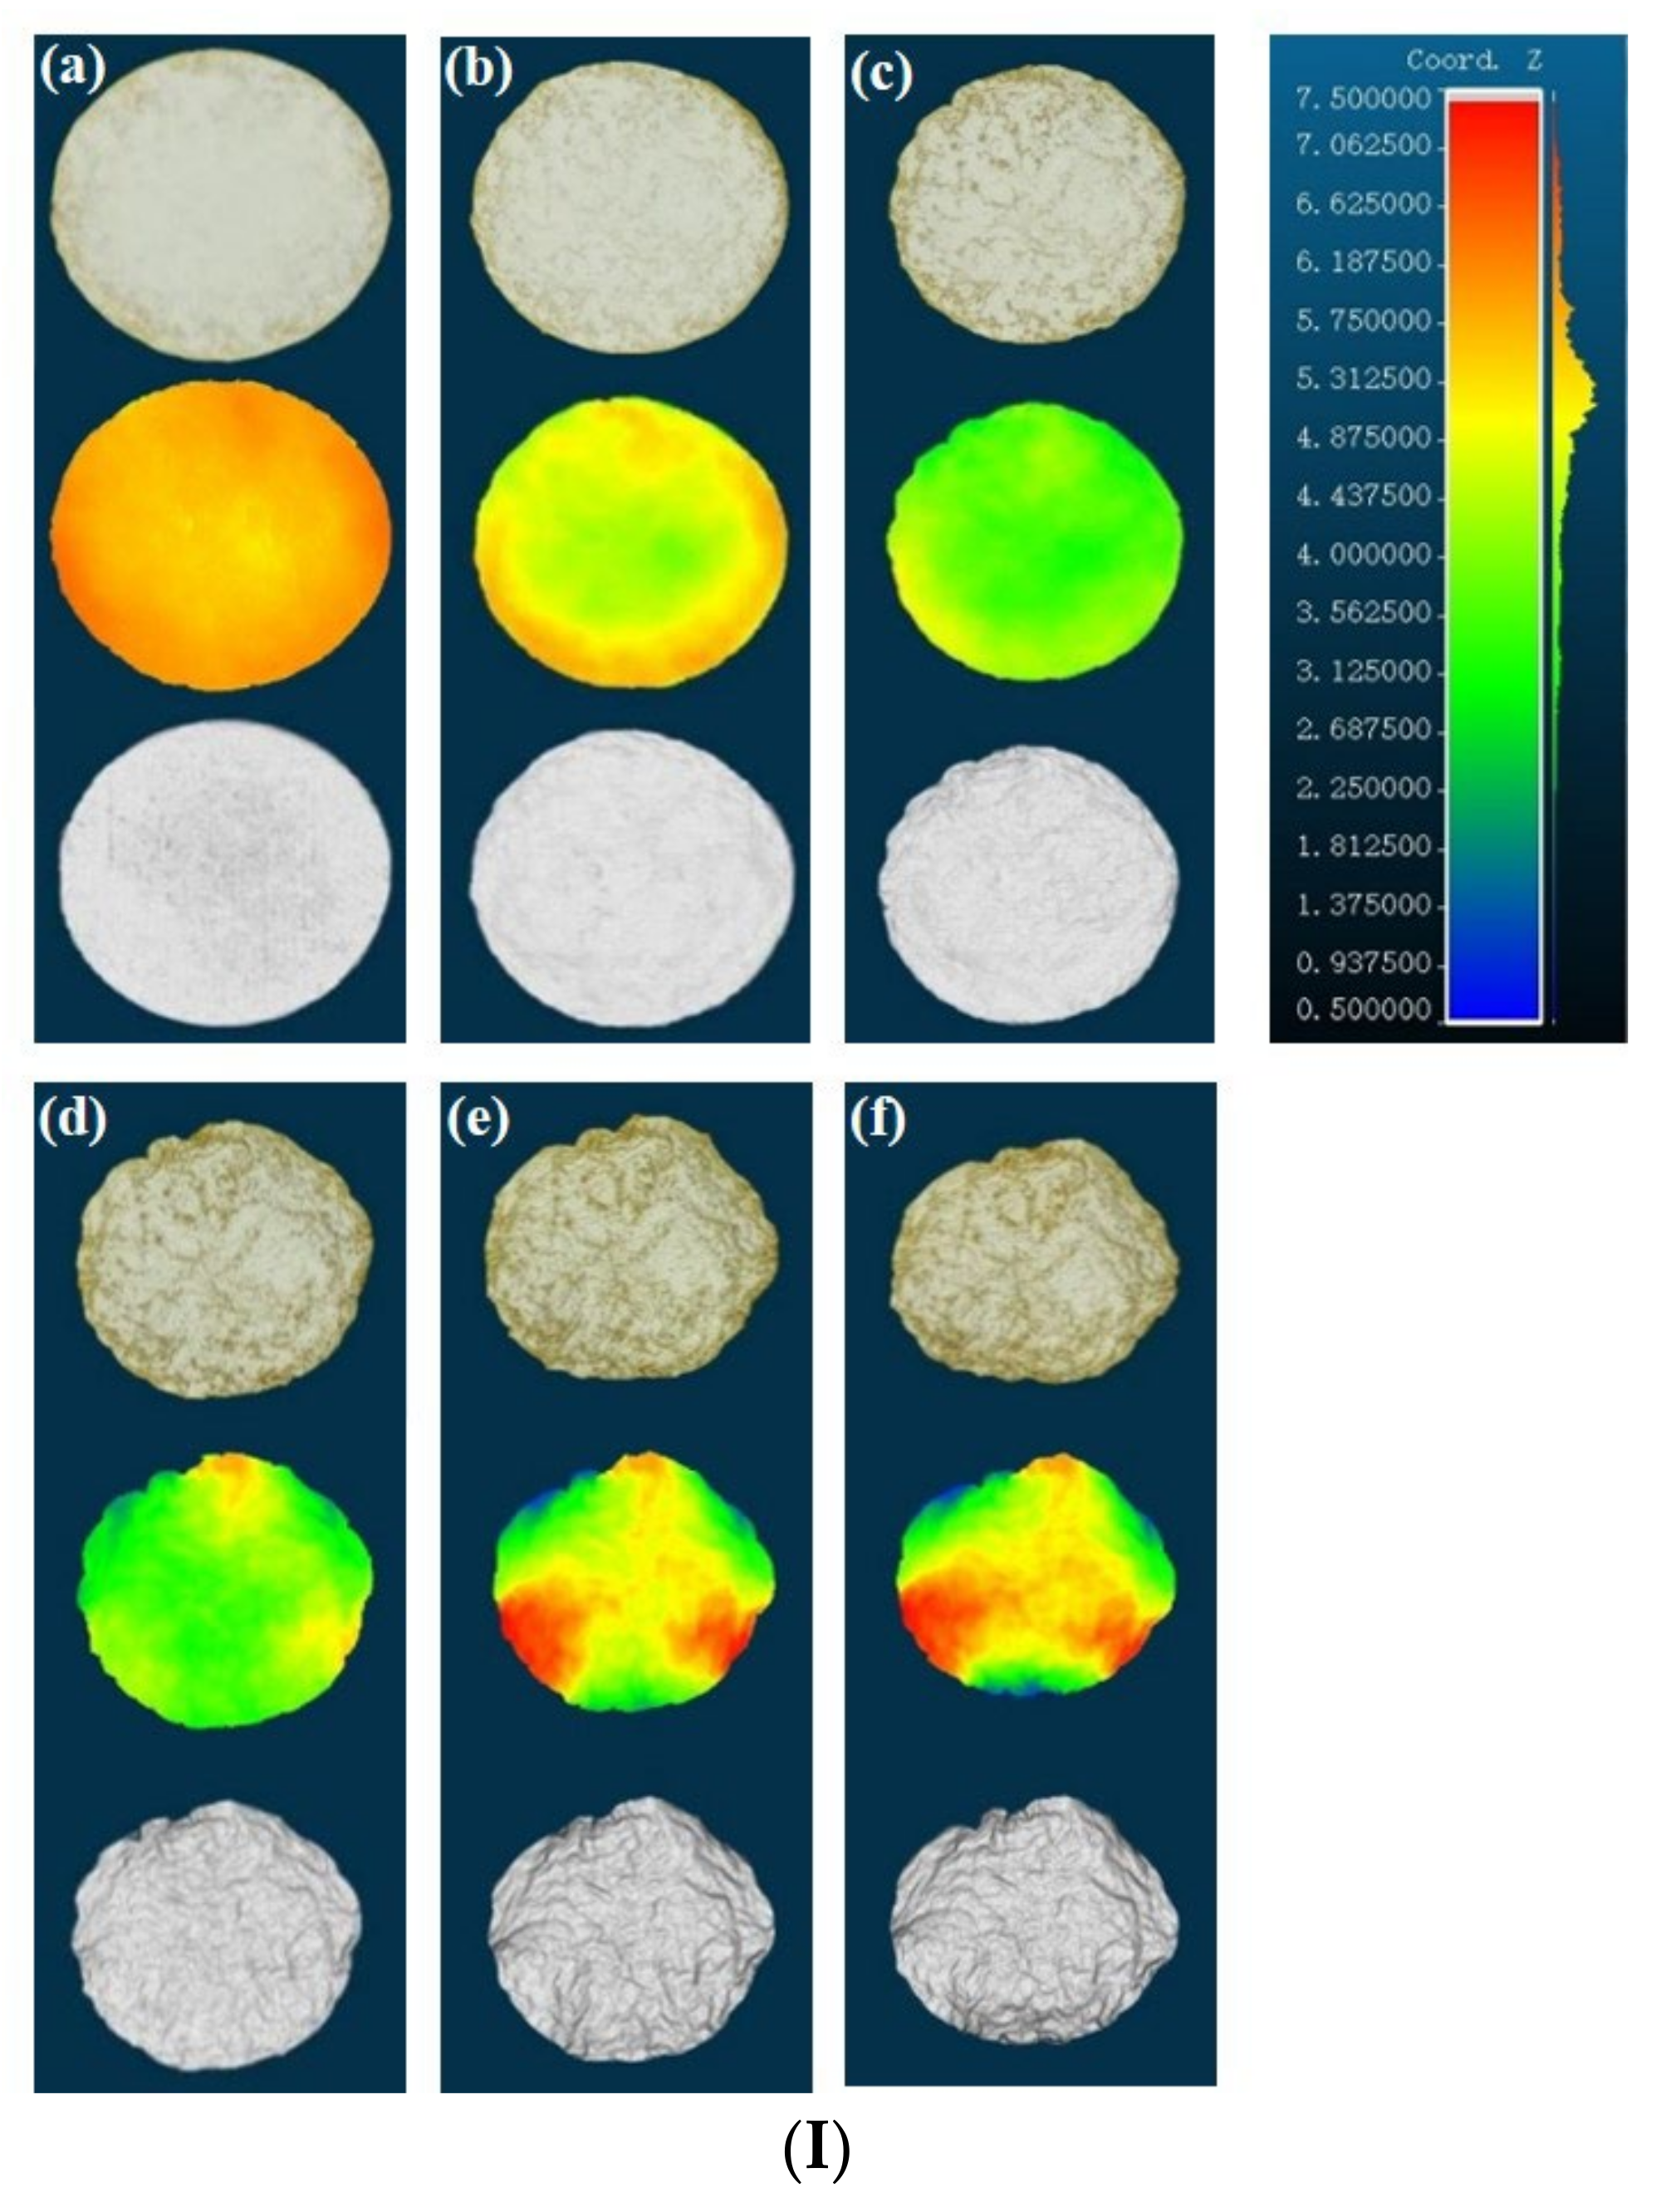
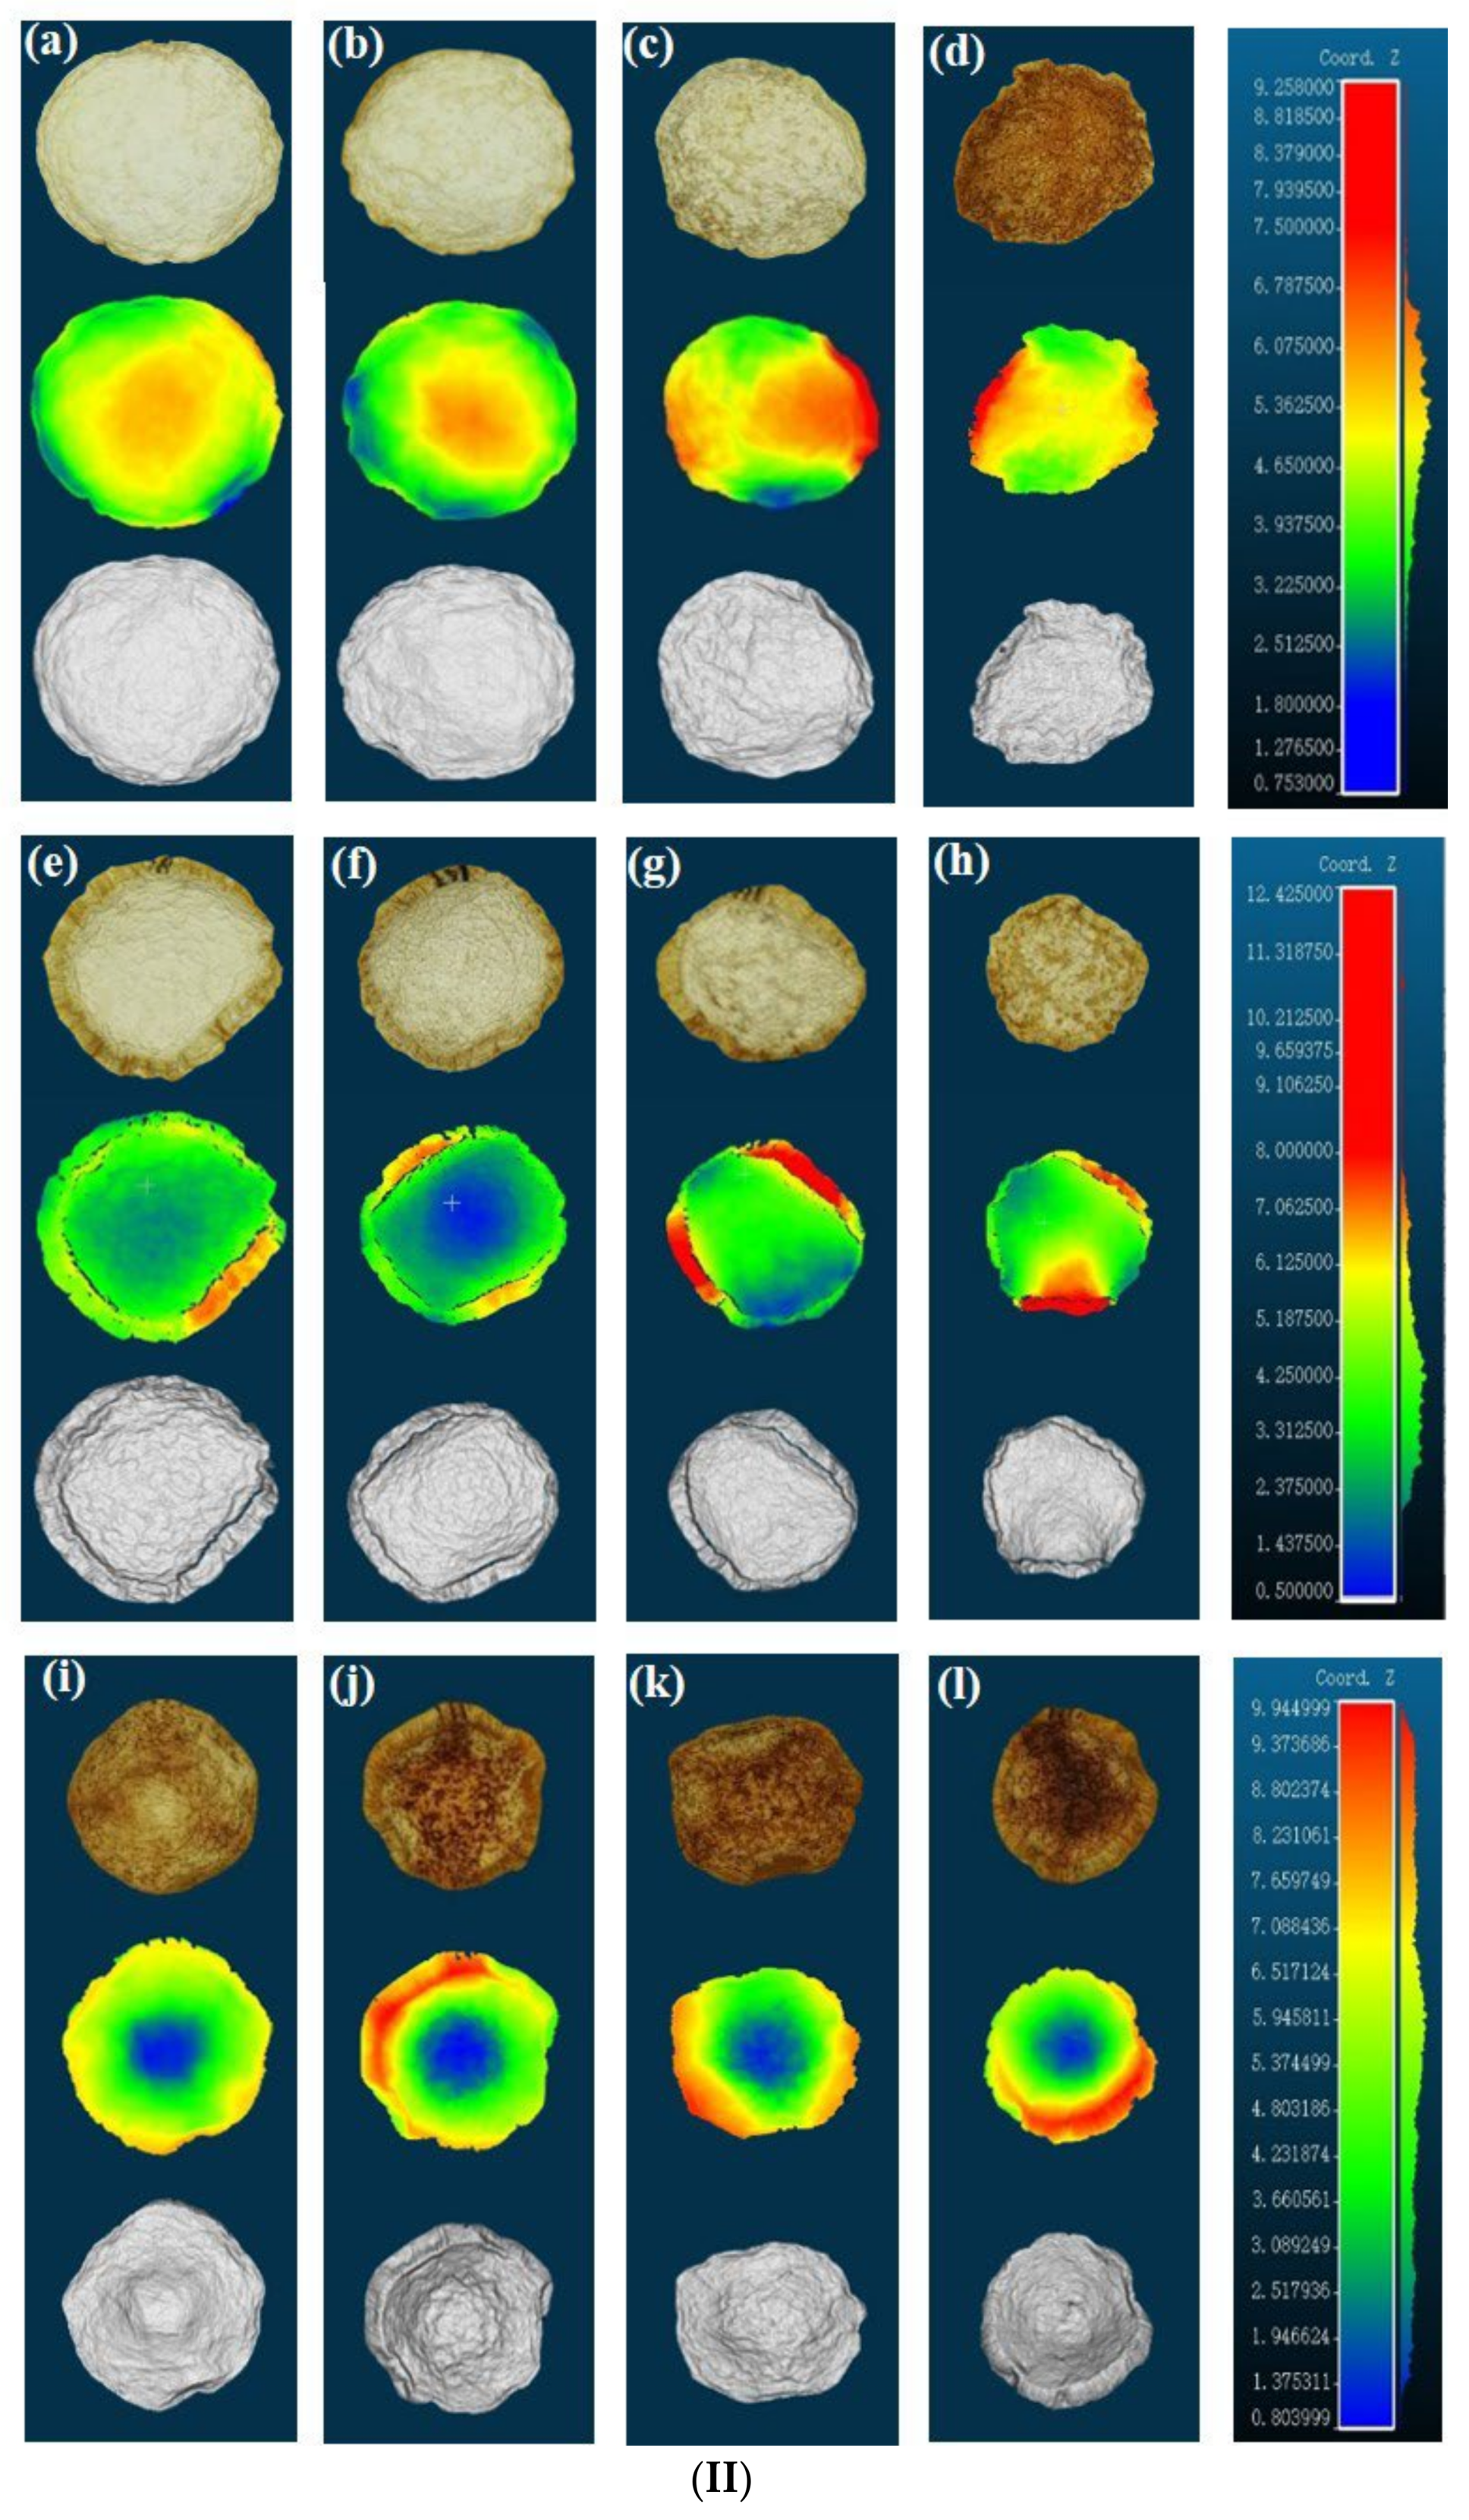
3.2. Three-Dimensional Appearance Characterization
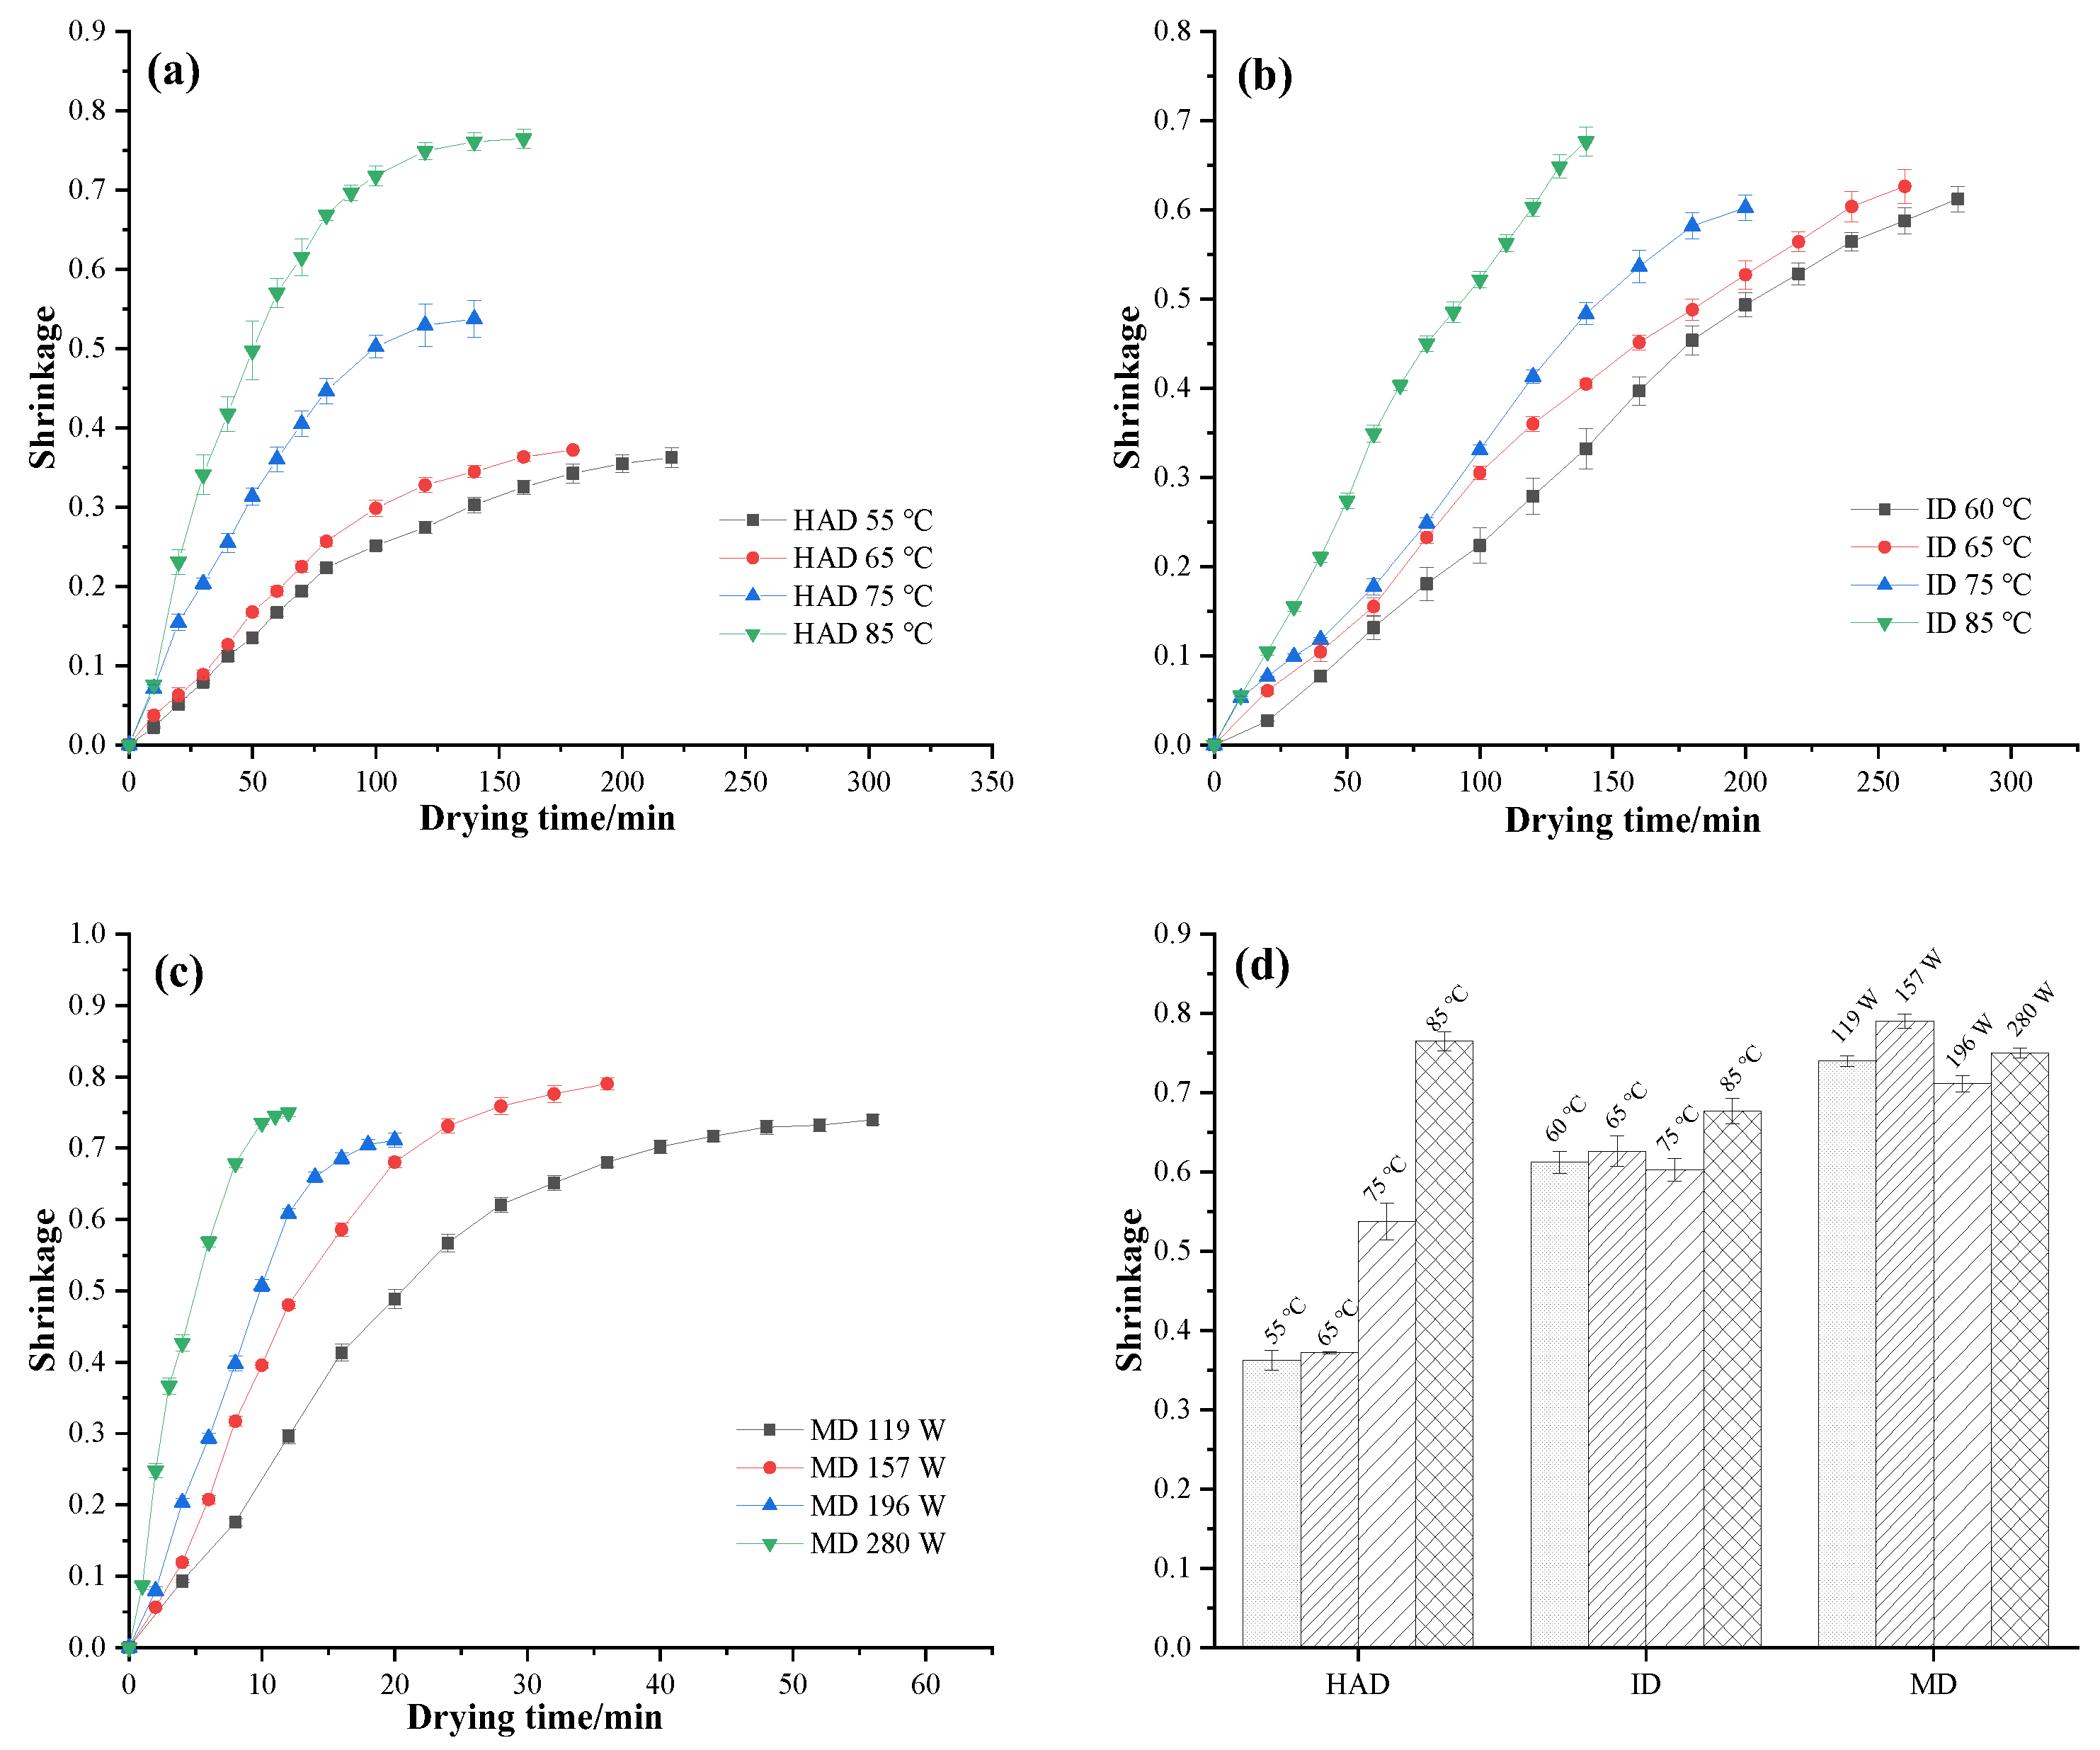
3.3. Shrinkage
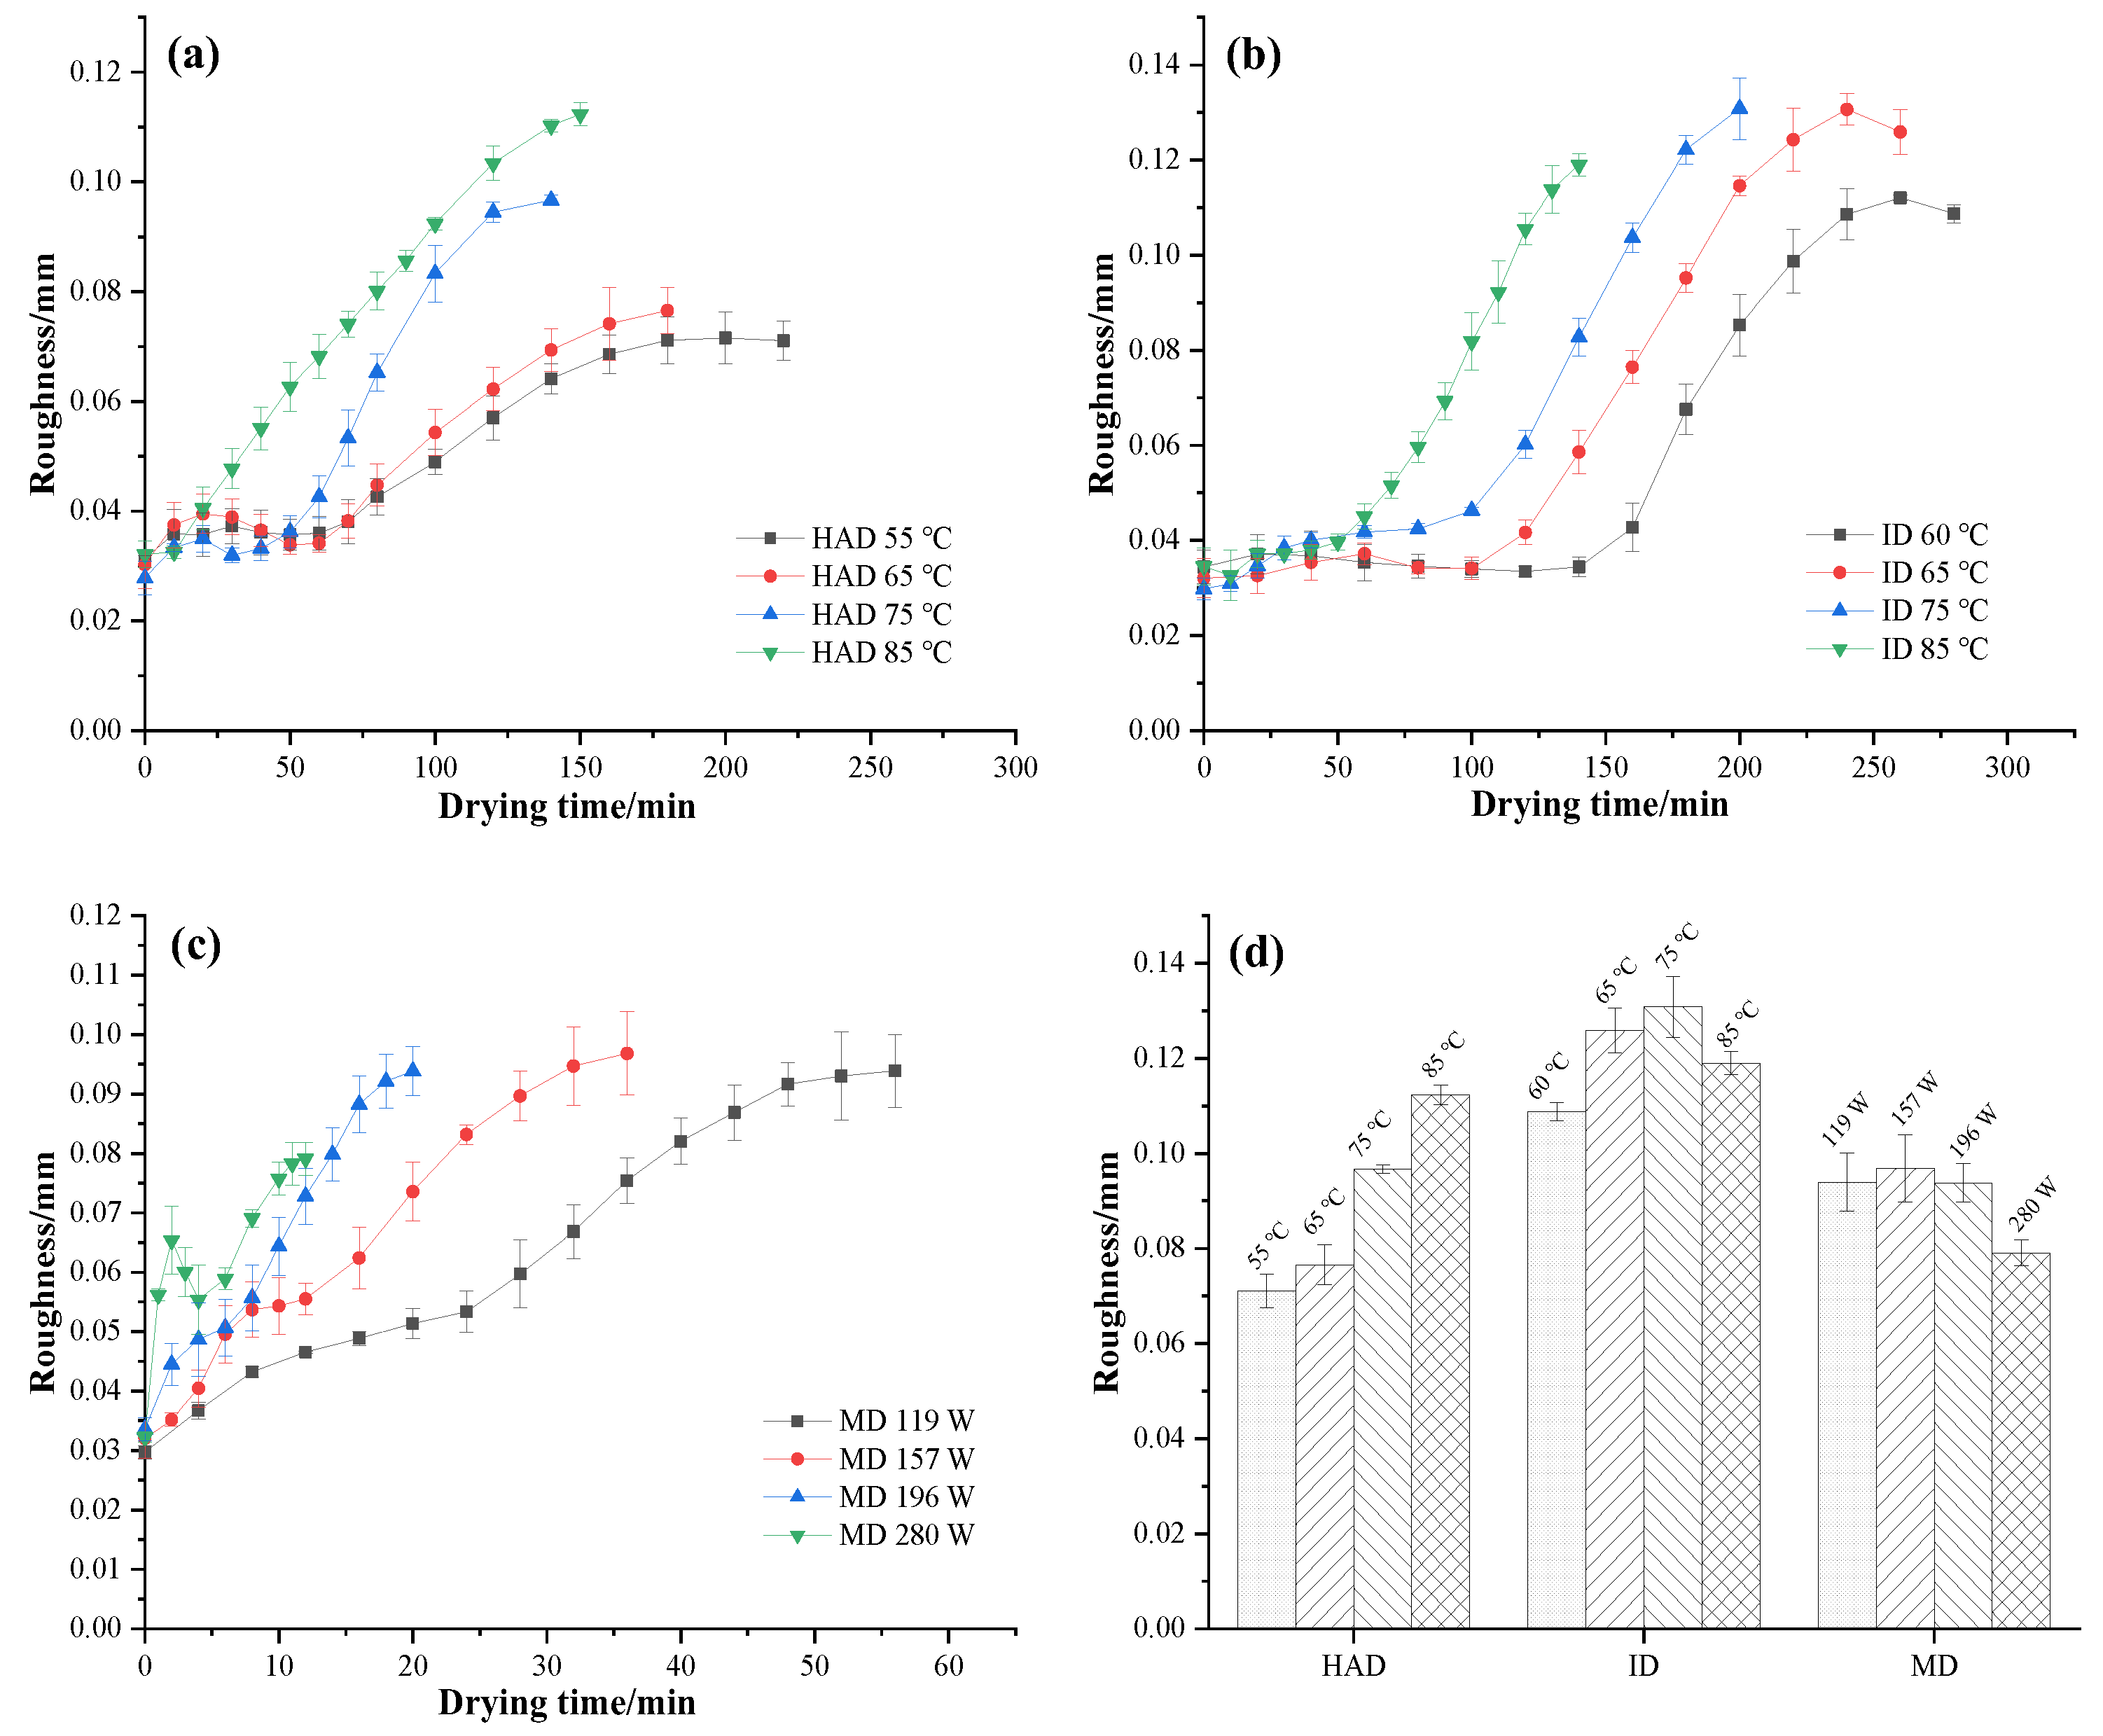
3.4. Roughness
3.5. Color
3.6. TPC
3.7. DPPH Radical Scavenging Activity
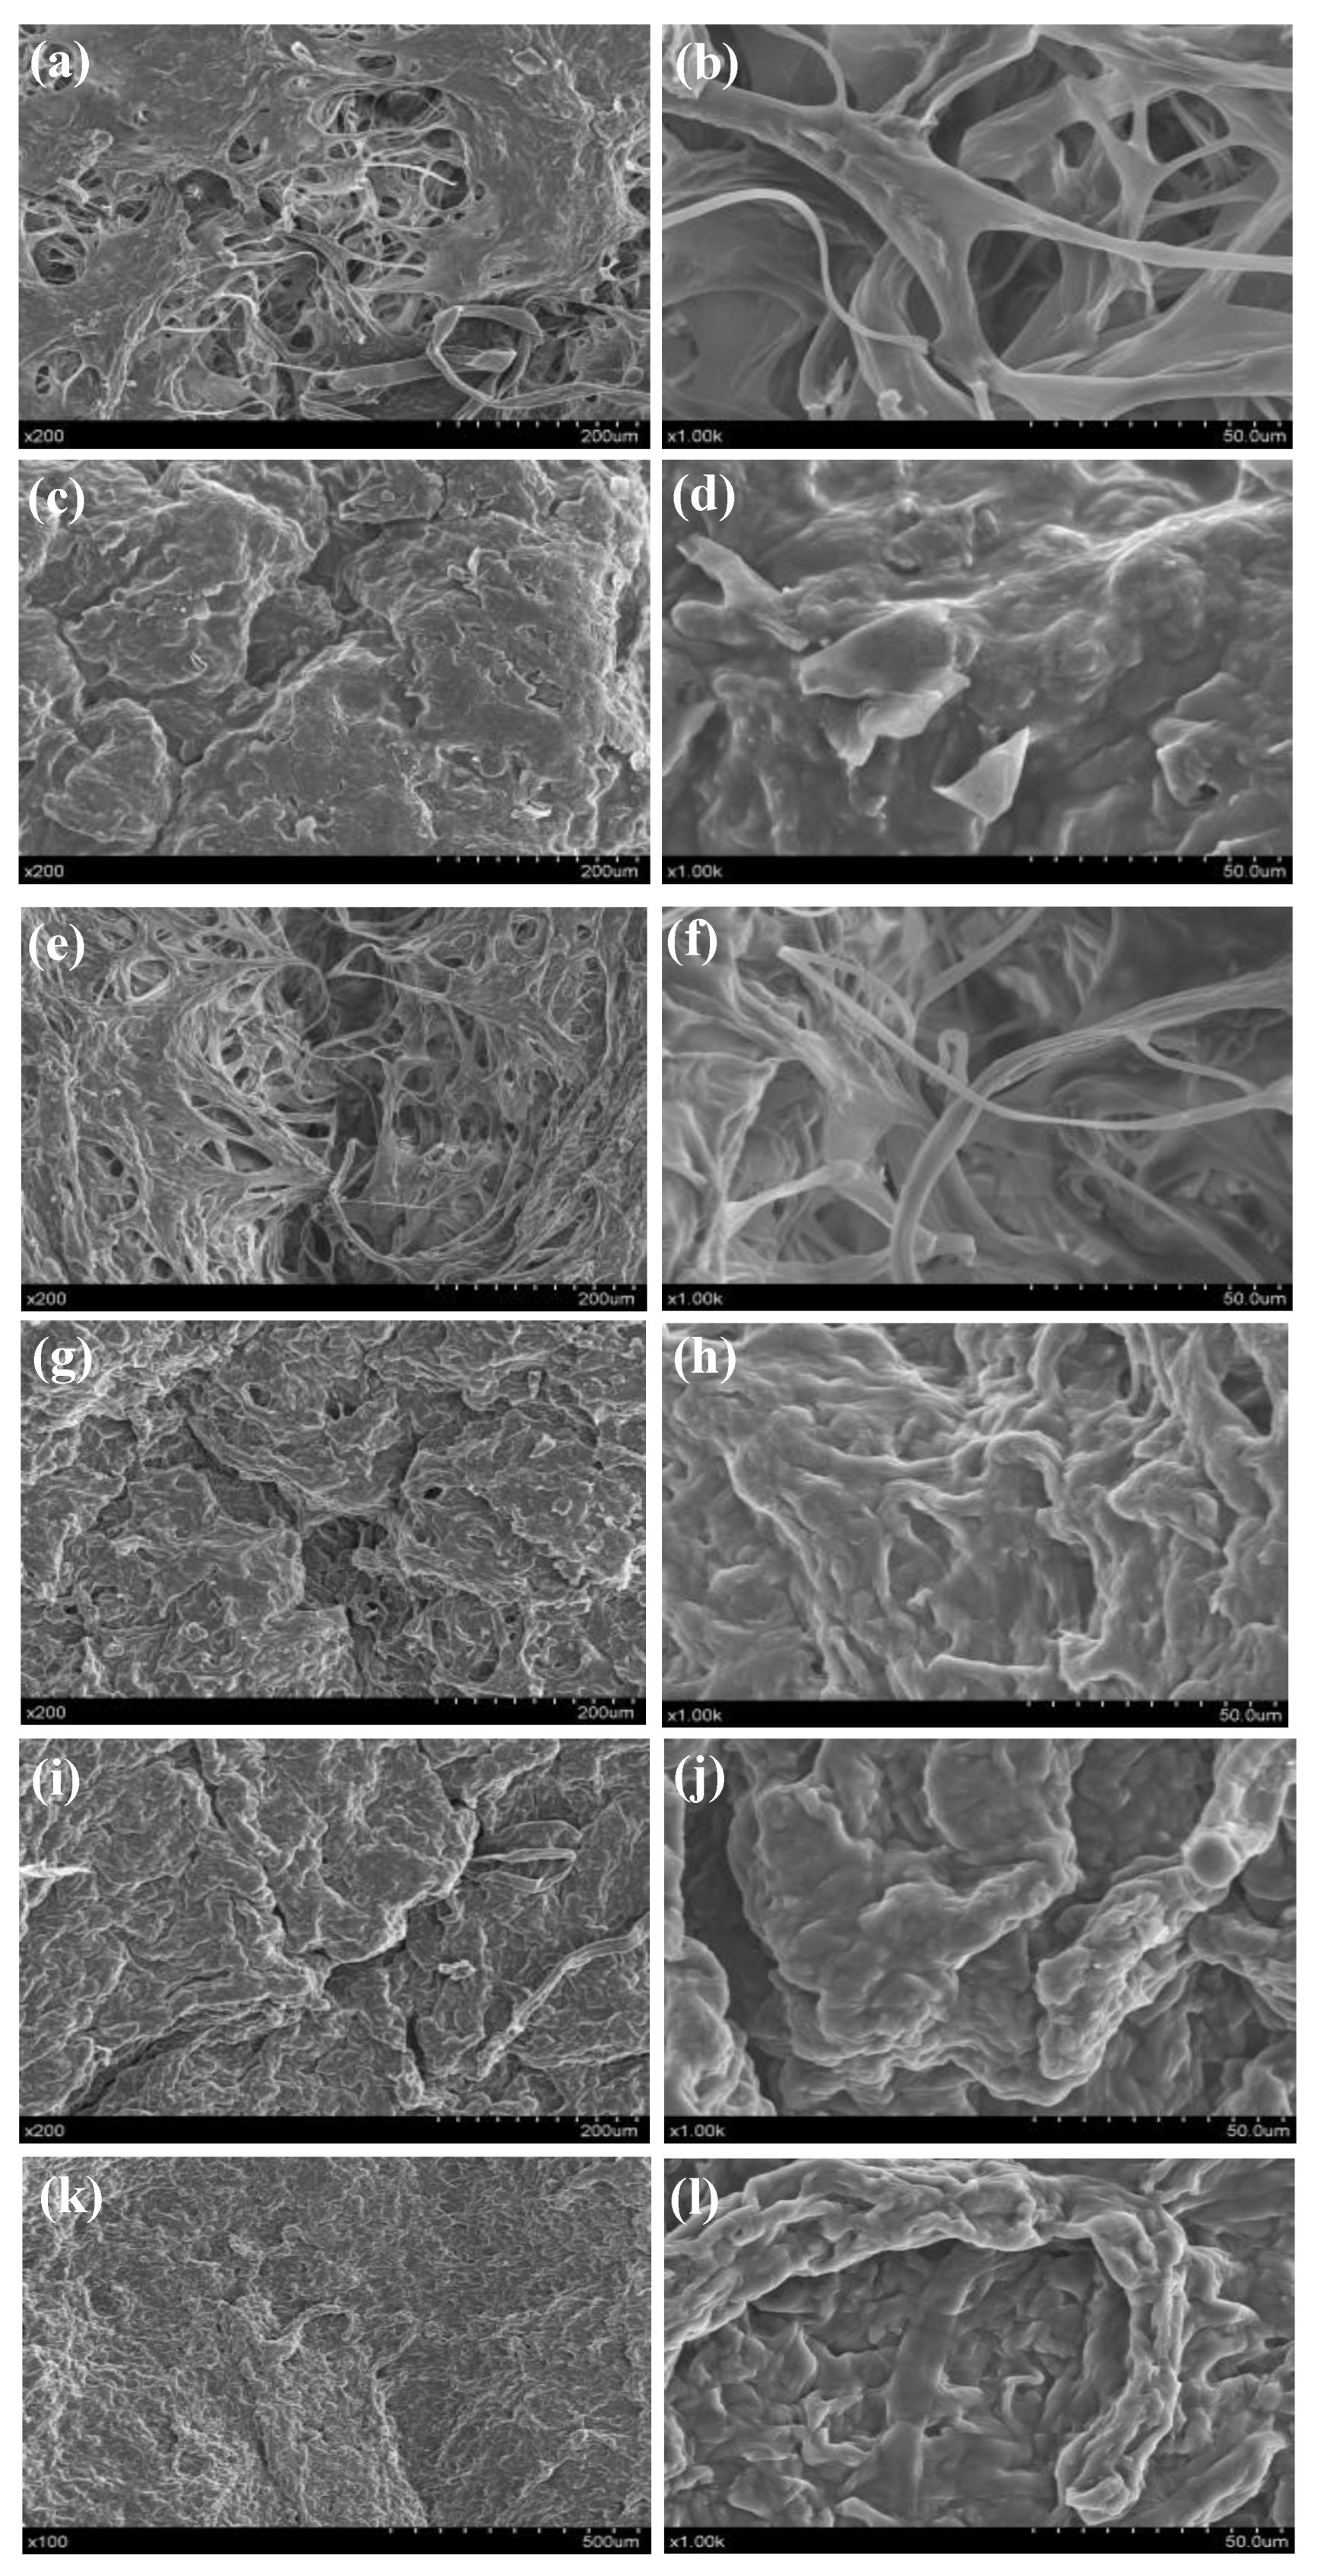
3.8. Microstructure
4. Conclusions
Author Contributions
Funding
Data Availability Statement
Conflicts of Interest
References
- Li, X.; Feng, T.; Zhou, F.; Zhou, S.; Liu, Y.; Li, W.; Ye, R.; Yang, Y. Effects of drying methods on the tasty compounds of Pleurotus eryngii. Food Chem. 2015, 166, 358–364. [Google Scholar] [CrossRef] [PubMed]
- Wang, Q.; Li, S.; Han, X.; Ni, Y.; Zhao, D.; Hao, J. Quality evaluation and drying kinetics of shitake mushrooms dried by hot air, infrared and intermittent microwave–assisted drying methods. LWT 2019, 107, 236–242. [Google Scholar] [CrossRef]
- Piskov, S.; Timchenko, L.; Grimm, W.; Rzhepakovsky, I.; Avanesyan, S.; Sizonenko, M.; Kurchenko, V. Effects of Various Drying Methods on Some Physico-Chemical Properties and the Antioxidant Profile and ACE Inhibition Activity of Oyster Mushrooms (Pleurotus Ostreatus). Foods 2020, 9, 160. [Google Scholar] [CrossRef] [PubMed]
- Chen, D.; Qin, L.; Geng, Y.; Kong, Q.; Wang, S.; Lin, S. The Aroma Fingerprints and Discrimination Analysis of Shiitake Mushrooms from Three Different Drying Conditions by GC-IMS, GC-MS and DSA. Foods 2021, 10, 2991. [Google Scholar] [CrossRef]
- Xiao, H.; Mujumdar, A.S. Importance of drying in support of human welfare. Dry. Technol. 2020, 38, 1542–1543. [Google Scholar] [CrossRef]
- Qin, L.; Gao, J.; Xue, J.; Chen, D.; Lin, S.; Dong, X.; Zhu, B. Changes in Aroma Profile of Shiitake Mushroom (Lentinus edodes) during Different Stages of Hot Air Drying. Foods 2020, 9, 444. [Google Scholar] [CrossRef]
- Motevali, A.; Minaei, S.; Khoshtaghaza, M.H.; Amirnejat, H. Comparison of energy consumption and specific energy requirements of different methods for drying mushroom slices. Energy 2011, 36, 6433–6441. [Google Scholar] [CrossRef]
- Bai, J.; Dai, Y.; Wang, Y.; Cai, J.; Zhang, L.; Tian, X. Potato Slices Drying: Pretreatment Affects the Three-Dimensional Appearance and Quality Attributes. Agriculture 2022, 12, 1841. [Google Scholar] [CrossRef]
- Pawar, S.B.; Pratape, V.M. Fundamentals of Infrared Heating and Its Application in Drying of Food Materials: A Review. J. Food Process Eng. 2017, 40, e123082017. [Google Scholar] [CrossRef]
- Zielinska, M.; Michalska, A. Microwave-assisted drying of blueberry (Vaccinium corymbosum L.) fruits: Drying kinetics, polyphenols, anthocyanins, antioxidant capacity, colour and texture. Food Chem. 2016, 212, 671–680. [Google Scholar] [CrossRef]
- Onwude, D.I.; Hashim, N.; Abdan, K.; Janius, R.; Chen, G. The potential of computer vision, optical backscattering parameters and artificial neural network modelling in monitoring the shrinkage of sweet potato (Ipomoea batatas L.) during drying. J. Sci. Food Agric. 2018, 98, 1310–1324. [Google Scholar] [CrossRef] [PubMed]
- Pei, Y.; Li, Z.; Ling, C.; Jiang, L.; Wu, X.; Song, C.; Li, J.; Song, F.; Xu, W. An improvement of far-infrared drying for ginger slices with computer vision and fuzzy logic control. J. Food Meas. Charact. 2022, 16, 3815–3831. [Google Scholar] [CrossRef]
- Li, X.; Liu, Y.; Gao, Z.; Xie, Y.; Wang, H. Computer vision online measurement of shiitake mushroom (Lentinus edodes) surface wrinkling and shrinkage during hot air drying with humidity control. J. Food Eng. 2021, 292, 110253. [Google Scholar] [CrossRef]
- Sampson, D.J.; Chang, Y.K.; Rupasinghe, H.P.V.; Zaman, Q.U. A dual-view computer-vision system for volume and image texture analysis in multiple apple slices drying. J. Food Eng. 2014, 127, 49–57. [Google Scholar] [CrossRef]
- Cai, J.R.; Lu, Y.; Bai, J.W.; Sun, L.; Xiao, H.W. Three-dimensional imaging of morphological changes of potato slices during drying. Trans. Chin. Soc. Agric. Eng. 2019, 35, 278–284. [Google Scholar]
- Wasenmüller, O.; Stricker, D. Comparison of Kinect V1 and V2 Depth Images in Terms of Accuracy and Precision. Comput. Vis.-ACCV 2016 Workshops 2017, 10117, 34–45. [Google Scholar] [CrossRef]
- Bai, J.; Zhang, L.; Aheto, J.H.; Cai, J.; Wang, Y.; Sun, L.; Tian, X. Effects of different pretreatment methods on drying kinetics, three-dimensional deformation, quality characteristics and microstructure of dried apple slices. Innov. Food Sci. Emerg. Technol. 2023, 83, 103216. [Google Scholar] [CrossRef]
- Sun, L.; Zhang, P.; Zheng, X.; Cai, J.; Bai, J. Three-dimensional morphological changes of potato slices during the drying process. Curr. Res. Food Sci. 2021, 4, 910–916. [Google Scholar] [CrossRef] [PubMed]
- Xiao, A.; Ding, C. Effect of Electrohydrodynamic (EHD) on Drying Kinetics and Quality Characteristics of Shiitake Mushroom. Foods 2022, 11, 1303. [Google Scholar] [CrossRef] [PubMed]
- Liu, Z.; Zielinska, M.; Yang, X.; Yu, X.; Chen, C.; Wang, H.; Wang, J.; Pan, Z.; Xiao, H. Moisturizing strategy for enhanced convective drying of mushroom slices. Renew. Energy 2021, 172, 728–739. [Google Scholar] [CrossRef]
- Loureiro, A.D.C.; Souza, F.D.C.D.; Sanches, E.A.; Bezerra, J.D.A.; Lamarão, C.V.; Rodrigues, S.; Fernandes, F.A.N.; Campelo, P.H. Cold plasma technique as a pretreatment for drying fruits: Evaluation of the excitation frequency on drying process and bioactive compounds. Food Res. Int. 2021, 147, 110462. [Google Scholar] [CrossRef]
- Liu, Z.; Xie, L.; Zielinska, M.; Pan, Z.; Deng, L.; Zhang, J.; Gao, L.; Wang, S.; Zheng, Z.; Xiao, H. Improvement of drying efficiency and quality attributes of blueberries using innovative far-infrared radiation heating assisted pulsed vacuum drying (FIR-PVD). Innov. Food Sci. Emerg. Technol. 2022, 77, 102948. [Google Scholar] [CrossRef]
- Su, D.; Lv, W.; Wang, Y.; Wang, L.; Li, D. Influence of microwave hot-air flow rolling dry-blanching on microstructure, water migration and quality of pleurotus eryngii during hot-air drying. Food Control 2020, 114, 107228. [Google Scholar] [CrossRef]
- Zhu, L.; Lu, Y.; Sun, Z.; Han, J.; Tan, Z. The application of an aqueous two-phase system combined with ultrasonic cell disruption extraction and HPLC in the simultaneous separation and analysis of solanine and Solanum nigrum polysaccharide from Solanum nigrum unripe fruit. Food Chem. 2020, 304, 125383. [Google Scholar] [CrossRef] [PubMed]
- Liu, D.; Guo, Y.; Wu, P.; Wang, Y.; Kwaku Golly, M.; Ma, H. The necessity of walnut proteolysis based on evaluation after in vitro simulated digestion: ACE inhibition and DPPH radical-scavenging activities. Food Chem. 2020, 311, 125960. [Google Scholar] [CrossRef]
- Bechlin, T.R.; Granella, S.J.; Christ, D.; Coelho, S.R.M.; Paz, C.H.D.O. Effects of ozone application and hot-air drying on orange peel: Moisture diffusion, oil yield, and antioxidant activity. Food Bioprod. Process. 2020, 123, 80–89. [Google Scholar] [CrossRef]
- Moon, J.H.; Kim, M.J.; Chung, D.H.; Pan, C.; Yoon, W.B. Drying Characteristics of Sea Cucumber (Stichopus japonicas Selenka) Using Far Infrared Radiation Drying and Hot Air Drying. J. Food Process Preserv. 2014, 38, 1534–1546. [Google Scholar] [CrossRef]
- Demirel, D.; Turhan, M. Air-drying behavior of Dwarf Cavendish and Gros Michel banana slices. J. Food Eng. 2003, 59, 1–11. [Google Scholar] [CrossRef]
- Cao, Z.; Zhou, L.; Bi, J.; Yi, J.; Chen, Q.; Wu, X.; Zheng, J.; Li, S. Effect of different drying technologies on drying characteristics and quality of red pepper (Capsicum frutescens L.): A comparative study. J. Sci. Food Agric. 2016, 96, 3596–3603. [Google Scholar] [CrossRef]
- Nowak, D.; Lewicki, P.P. Infrared drying of apple slices. Innov. Food Sci. Emerg. Technol. 2004, 5, 353–360. [Google Scholar] [CrossRef]
- Nozad, M.; Khojastehpour, M.; Tabasizadeh, M.; Azizi, M.; Miraei Ashtiani, S.; Salarikia, A. Characterization of hot-air drying and infrared drying of spearmint (Mentha spicata L.) leaves. J. Food Meas. Charact. 2016, 10, 466–473. [Google Scholar] [CrossRef]
- Albanese, D.; Cinquanta, L.; Cuccurullo, G.; Di Matteo, M. Effects of microwave and hot-air drying methods on colour, β-carotene and radical scavenging activity of apricots. Int. J. Food Sci. Technol. 2013, 48, 1327–1333. [Google Scholar] [CrossRef]
- Thayyil, S.B.; Yadav, S.K.; Polthier, K.; Muthuganapathy, R. Local Delaunay-based high fidelity surface reconstruction from 3D point sets. Comput. Aided Geom. Des. 2021, 86, 101973. [Google Scholar] [CrossRef]
- Qin, J.; Wang, Z.; Wang, X.; Shi, W. Effects of microwave time on quality of grass carp fillets processed through microwave combined with hot-air drying. Food Sci. Nutr. 2020, 8, 4159–4171. [Google Scholar] [CrossRef] [PubMed]
- Wang, J.; Law, C.; Nema, P.K.; Zhao, J.; Liu, Z.; Deng, L.; Gao, Z.; Xiao, H. Pulsed vacuum drying enhances drying kinetics and quality of lemon slices. J. Food Eng. 2018, 224, 129–138. [Google Scholar] [CrossRef]
- Wang, X.; Gao, Y.; Zhao, Y.; Li, X.; Fan, J.; Wang, L. Effect of different drying methods on the quality and microstructure of fresh jujube crisp slices. J. Food Process Preserv. 2021, 45, e15162. [Google Scholar] [CrossRef]
- Udomkun, P.; Nagle, M.; Argyropoulos, D.; Mahayothee, B.; Müller, J. Multi-sensor approach to improve optical monitoring of papaya shrinkage during drying. J. Food Eng. 2016, 189, 82–89. [Google Scholar] [CrossRef]
- Kaveh, M.; Abbaspour Gilandeh, Y.; Fatemi, H.; Chen, G. Impact of different drying methods on the drying time, energy, and quality of green peas. J. Food Process Preserv. 2021, 45, e15503. [Google Scholar] [CrossRef]
- Chen, A.; Achkar, G.E.; Liu, B.; Bennacer, R. Experimental study on moisture kinetics and microstructure evolution in apples during high power microwave drying process. J. Food Eng. 2021, 292, 110362. [Google Scholar] [CrossRef]
- Rokhbin, A.; Azadbakht, M. The shrinkage of orange slices during microwave drying and ohmic pretreatment. J. Food Process Preserv. 2021, 45, e154002021. [Google Scholar] [CrossRef]
- Mahiuddin, M.; Khan, M.I.H.; Kumar, C.; Rahman, M.M.; Karim, M.A. Shrinkage of Food Materials During Drying: Current Status and Challenges. Compr. Rev. Food Sci. Food Saf. 2018, 17, 1113–1126. [Google Scholar] [CrossRef] [PubMed]
- Yang, R.; Li, Q.; Hu, Q. Physicochemical properties, microstructures, nutritional components, and free amino acids of Pleurotus eryngii as affected by different drying methods. Sci. Rep. 2020, 10, 121. [Google Scholar] [CrossRef] [PubMed]
- Tian, Y.; Zhao, Y.; Huang, J.; Zeng, H.; Zheng, B. Effects of different drying methods on the product quality and volatile compounds of whole shiitake mushrooms. Food Chem. 2016, 197, 714–722. [Google Scholar] [CrossRef] [PubMed]
- Xiao, H.; Law, C.; Sun, D.; Gao, Z. Color Change Kinetics of American Ginseng (Panax quinquefolium) Slices during Air Impingement Drying. Dry. Technol. 2014, 32, 418–427. [Google Scholar] [CrossRef]
- Gouzi, H.; Depagne, C.; Coradin, T. Kinetics and Thermodynamics of the Thermal Inactivation of Polyphenol Oxidase in an Aqueous Extract fromAgaricus bisporus. J. Agric. Food Chem. 2012, 60, 500–506. [Google Scholar] [CrossRef] [PubMed]
- Ju, H.; Zhang, Q.; Mujumdar, A.S.; Fang, X.; Xiao, H.; Gao, Z. Hot-air Drying Kinetics of Yam Slices under Step Change in Relative Humidity. Int. J. Food Eng. 2016, 12, 783–792. [Google Scholar] [CrossRef]
- Duan, X.; Liu, W.C.; Ren, G.Y.; Liu, L.L.; Liu, Y.H. Browning behavior of button mushrooms during microwave freeze-drying. Dry. Technol. 2015, 34, 1373–1379. [Google Scholar] [CrossRef]
- Xu, L.; Fang, X.; Wu, W.; Chen, H.; Mu, H.; Gao, H. Effects of high-temperature pre-drying on the quality of air-dried shiitake mushrooms (Lentinula edodes). Food Chem. 2019, 285, 406–413. [Google Scholar] [CrossRef]
- Zhang, M.; Tang, J.; Mujumdar, A.S.; Wang, S. Trends in microwave-related drying of fruits and vegetables. Trends Food Sci. Technol. 2006, 17, 524–534. [Google Scholar] [CrossRef]
- Gąsecka, M.; Siwulski, M.; Magdziak, Z.; Budzyńska, S.; Stuper-Szablewska, K.; Niedzielski, P.; Mleczek, M. The effect of drying temperature on bioactive compounds and antioxidant activity of Leccinum scabrum (Bull.) Gray and Hericium erinaceus (Bull.) Pers. J. Food Sci. Technol. 2020, 57, 513–525. [Google Scholar] [CrossRef]
- Ren, S.; Zheng, E.; Zhao, T.; Hu, S.; Yang, H. Evaluation of physicochemical properties, equivalent umami concentration and antioxidant activity of Coprinus comatus prepared by different drying methods. LWT 2022, 162, 113479. [Google Scholar] [CrossRef]
- Wu, B.; Guo, X.; Guo, Y.; Ma, H.; Zhou, C. Enhancing jackfruit infrared drying by combining ultrasound treatments: Effect on drying characteristics, quality properties and microstructure. Food Chem. 2021, 358, 129845. [Google Scholar] [CrossRef] [PubMed]
- Zivanovic, S.; Buescher, R.; Kim, S.K. Mushroom Texture, Cell Wall Composition, Color, and Ultrastructure as Affected by pH and Temperature. J. Food Sci. 2003, 68, 1860–1865. [Google Scholar] [CrossRef]


| Drying Condition | L* | a* | b* | ΔE | TPC (mg/g) | DPPH Radical Scavenging Activity (%) | |
|---|---|---|---|---|---|---|---|
| Fresh | —— | 85.62 ± 0.33 a | 3.95 ± 0.19 h | 12.85 ± 0.39 f | —— | 48.37 ± 0.75 a | 68.87 ± 1.03 a |
| HAD | 55 °C | 76.15 ± 4.87 b | 15.63 ± 0.72 f | 31.74 ± 2.27 c | 24.40 ± 1.15 g | 30.70 ± 0.32 b,c | 43.91 ± 2.04 b,c |
| 65 °C | 71.46 ± 5.86 c,d | 14.68 ± 0.66 g | 28.54 ± 2.04 d | 24.71 ± 2.23 g | 30.88 ± 0.15 b | 40.30 ± 2.08 d | |
| 75 °C | 66.21 ± 4.53 e,f | 16.20 ± 0.59 f | 31.74 ± 1.52 c | 29.99 ± 2.76 f | 30.57 ± 0.08 b,c | 32.80 ± 0.15 e | |
| 85 °C | 50.19 ± 1.81 h | 21.83 ± 0.80 b,c | 38.34 ± 2.00 b | 47.25 ± 0.31 c | 30.50 ± 0.1 b,c | 32.69 ± 0.65 e | |
| ID | 60 °C | 68.89 ± 1.97 d,e | 16.18 ± 0.29 f | 32.01 ± 0.66 c | 28.29 ± 0.95 f | 30.55 ± 0.13 b,c | 42.24 ± 0.70 d |
| 65 °C | 66.08 ± 1.22 e,f | 16.06 ± 0.52 f | 31.16 ± 1.07 c | 29.40 ± 1.51 f | 30.63 ± 0.20 b,c | 43.87 ± 0.71 b,c | |
| 75 °C | 74.18 ± 3.09 b,c | 16.05 ± 0.22 f | 32..30 ± 0.63 c | 25.77 ± 1.21 g | 30.32 ± 0.3 b,c | 45.21 ± 0.75 b | |
| 85 °C | 63.92 ± 1.09 f | 19.97 ± 0.53 e | 38.46 ± 1.41 b | 37.20 ± 1.68 e | 30.00 ± 0.94 b,c,d | 46.55 ± 0.24 b | |
| MD | 119 W | 57.26 ± 2.90 g | 22.73 ± 0.52 a,b | 42.42 ± 0.95 a | 45.13 ± 1.93 d | 29.90 ± 0.92 b,c,d | 40.25 ± 3.11 c |
| 157 W | 37.87 ± 2.65 i | 20.61 ± 2.15 d,e | 25.69 ± 3.65 e | 52.41 ± 1.04 a | 29.95 ± 0.90 b,c,d | 39.20 ± 2.30 d | |
| 196 W | 47.09 ± 4.23 h | 23.22 ± 1.37 a | 36.58 ± 4.27 b | 49.56 ± 1.14 b | 29.32 ± 0.07 c,d | 32.29 ± 1.95 e | |
| 280 W | 40.77 ± 3.63 i | 21.39 ± 1.23 c,d | 28.97 ± 3.29 d | 50.94 ± 2.32 a,b | 28.82 ± 0.50 d | 25.89 ± 0.90 f | |
Disclaimer/Publisher’s Note: The statements, opinions and data contained in all publications are solely those of the individual author(s) and contributor(s) and not of MDPI and/or the editor(s). MDPI and/or the editor(s) disclaim responsibility for any injury to people or property resulting from any ideas, methods, instructions or products referred to in the content. |
© 2023 by the authors. Licensee MDPI, Basel, Switzerland. This article is an open access article distributed under the terms and conditions of the Creative Commons Attribution (CC BY) license (https://creativecommons.org/licenses/by/4.0/).
Share and Cite
Bai, J.-W.; Wang, Y.-C.; Cai, J.-R.; Zhang, L.; Dai, Y.; Tian, X.-Y.; Xiao, H.-W. Three-Dimensional Appearance and Physicochemical Properties of Pleurotus eryngii under Different Drying Methods. Foods 2023, 12, 1999. https://doi.org/10.3390/foods12101999
Bai J-W, Wang Y-C, Cai J-R, Zhang L, Dai Y, Tian X-Y, Xiao H-W. Three-Dimensional Appearance and Physicochemical Properties of Pleurotus eryngii under Different Drying Methods. Foods. 2023; 12(10):1999. https://doi.org/10.3390/foods12101999
Chicago/Turabian StyleBai, Jun-Wen, Yu-Chi Wang, Jian-Rong Cai, Lu Zhang, Yi Dai, Xiao-Yu Tian, and Hong-Wei Xiao. 2023. "Three-Dimensional Appearance and Physicochemical Properties of Pleurotus eryngii under Different Drying Methods" Foods 12, no. 10: 1999. https://doi.org/10.3390/foods12101999