Article

Determination of Cultivation Regions and Quality Parameters of Poria cocos by Near-Infrared Spectroscopy and Chemometrics

1
Hunan Academy of Chinese Medicine, Hunan University of Chinese Medicine, Changsha 410013, China
2
College of Chinese Pharmacy, Beijing University of Chinese Medicine, Beijing 102488, China
*
Author to whom correspondence should be addressed.
Foods 2022, 11(6), 892; https://doi.org/10.3390/foods11060892
Submission received: 21 February 2022 / Revised: 17 March 2022 / Accepted: 17 March 2022 / Published: 21 March 2022
(This article belongs to the Section Plant Foods)

Abstract

:
Poria cocos (PC) is an important fungus with high medicinal and nutritional values. However, the quality of PC is heavily dependent on multiple factors in the cultivation regions. Traditional methods are not able to perform quality evaluation for this fungus in a short time, and a new method is needed for rapid quality assessment. Here, we used near-infrared (NIR) spectroscopy combined with chemometric method to identify the cultivation regions and determine PC chemical compositions. In our study, 138 batches of samples were collected and their cultivation regions were distinguished by combining NIR spectroscopy and random forest method (RFM) with an accuracy as high as 92.59%. In the meantime, we used partial least square regression (PLSR) to build quantitative models and measure the content of water-soluble extract (WSE), ethanol-soluble extract (ASE), polysaccharides (PSC) and the sum of five triterpenoids (SFT). The performance of these models were verified with correlation coefficients (R2cal and R2pre) above 0.9 for the four quality parameters and the relative errors (RE) of PSC, WSE, ASE and SFT at 4.055%, 3.821%, 4.344% and 3.744%, respectively. Overall, a new approach was developed and validated which is able to distinguish PC production regions, quantify its chemical contents, and effectively evaluate PC quality.

Graphical Abstract

1. Introduction

Poria cocos (PC) is derived from dried sclerotium of the fungus P. cocos (Schw.) Wolf, and it provides important nutritional and medicinal values. In China, it is known as “Fuling” and used for the treatment of various diseases [1], such as diabetes [2], cancer [3,4] and depression [5]. PC usage for nutritional and medicinal purposes has a long history of over 2000 years. PC was first recorded in an ancient Chinese medical book, Wushi’er Bingfang or Recipes for Fifty-Two Ailments, which described its clinical efficacy in promoting urination, removing dampness, invigorating the spleen and calming nerves [6,7,8]. Recent reports demonstrated that recipes with PC have been developed as part of a daily diet to prevent various chronic diseases such as hyperlipidemia, hyperglycemia, hypertension and atherosclerosis [7,8]. In China, these recipes are often used to develop and produce popular functional foods for both nutritional and medical benefits.
Since PC offers remarkable medicinal values with little side effects, the commercial PC market has grown rapidly in recent years. Cultivated PC has grown strongly due to the high demand for it that cannot be met by very limited amount of wild-growing PC. PC is a Chinese medicinal material, and similar to most materials for Chinese medicine, its quality is dependent on multiple factors within the cultivation region, including planting ecological environments [9], harvesting time [10], processing technology [11], etc. These factors affect the generation of secondary metabolites, which are important indicators of the quality and nutritional value of medicinal materials, including PC.
PC is mainly distributed in East and Southeast Asia where the climate is humid and subtropical, including China, Vietnam, and the Philippines [12,13]. The Dabie Mountains region, Yunnan region and Xiangqian region are the three main cultivation regions of PC in China, and the products of these regions, which are across different climate zones, have their own features [10,11,14,15,16]. The diverse cultivation conditions in these remotely distanced regions have caused quality discrepancies in PC grown in China. Identification of PC’s cultivation region in China would greatly benefit its quality classification, which is part of product quality control. This can be accomplished by developing a quick and accurate method to measure the levels of some key constituents of PC that are dependent on the cultivation region.
According to the Chinese and European Pharmacopoeia, the contents of water-soluble extracts and ethanol-soluble extracts are important indexes for the quality evaluation of PC. These contents contain a variety of chemical constituents, including triterpenes, polysaccharides, sterols, essential oil, proteins, etc. [13]. Among them, the main bioactive constituents are polysaccharides and triterpenes, which have been reported for various pharmacological benefits such as anti-inflammatory, antibacterial, antitumor and antioxidant effects. These pharmacological benefits contribute to the clinical efficacy of PC [17,18,19,20]. PC polysaccharides are a mixture of different types of polysaccharide, and account for 70~89% of the total dried mass of dried sclerotium, but only 2% of it dissolves in water—these water-soluble polysaccharides are the foundation of treating diseases, so PC is generally taken in the form of a water decoction [3]. PC polysaccharides contains rich branched glucans with (1,3)-β,(1,4)-β and (1,6)-β linkages and has exhibited strong bioactivity [21,22,23,24,25]. Up to now, more than 91 bioactive triterpenes have been isolated [13] and identified from PC, including Dehydrotumulosic acid (DTUA), Poricoic acid A (PAA), Polyporenic acid C (PAC), Dehydropachymic acid (DPA), Dehydrotrametenolic acid (DTRA) and other active triterpenoids [26,27]. Among them, DTRA and PAC are lanostane-type triterpenes, DPA and DTUA are Eburicane-type triterpenes, PAA is seco-Eburicane-type triterpenes, and they all show promising bioactivity [28,29]. These chemical constituents have special absorption spectra that show a unique reflection of their composition and molecular structure. This feature can correlate with the spectral response of sample to its constituents [30].
A broad range of analytical methods are available to assess the content of these chemicals in PC. Among them, near-infrared (NIR) spectroscopy is an advancing analytical technique that is rapid, easy to use and nondestructive [31,32]. NIR has been widely used to evaluate the quality of edible fungi, such as Pleurotus ostreatus [33], Ganoderma lucidum [34] and some cultivated mushrooms [35,36], with the capability to classify and identify cultivation regions [37]. NIR provides a complex spectrum with comprehensive absorption peak of H–containing groups (i.e., N–H, O–H, and C–H) that can be found in many active substances, including polysaccharides, flavonoids, triterpenes and phenols, etc. However, the spectroscopy of these substances is very sensitive to external interferences introduced by variances in ambient temperature, light scattering of the spectrometer and the color and physical status of samples. The raw spectra of these substances are similar and broad, consisting of many overlapping narrow bands, and hence make it challenging for further data analysis. To overcome this challenge, some spectral processing methods, such as standard normal variate (SNV) [38], smoothing, multiplicative scanter correction (MSC) [39] and Savizaky–Golay method (SG) [40,41], have to be used to optimize the calibration model by coupling with chemometrics. As previously stated, it is difficult to thoroughly assess the quality of Chinese medicinal herbs, due to the complexity of their active ingredients. However, NIR technology, combined with chemometric techniques, provides new insights into quality assessment of Chinese medicine materials with improved accuracy, and can be used for comprehensive analysis of the chemical composition of PC.
The objective of this study is to establish new models to distinguish cultivation regions and quantify the chemical composition of PC using NIR and chemometrics. Firstly, 138 batches of PC samples were collected from the three main cultivation regions, and then their raw NIR spectra and the content of water-soluble extract, alcohol-soluble extract, polysaccharides and the five triterpene acids were measured. Secondly, we used random forest method (RFM) to distinguish cultivation regions by NIR spectroscopy, and then used partial least square regression (PLSR) method to develop calibration model to determine the concentration of water-soluble extract, alcohol-soluble extract, polysaccharides and the sum of the five triterpenoids.

2. Materials and Methods

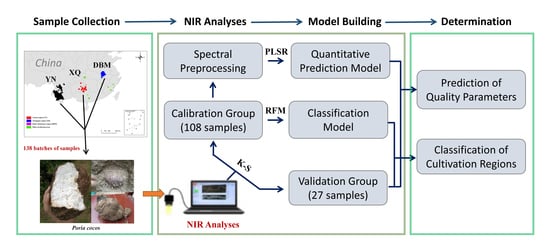
2.1. Sample Preparation

A total of 138 batches of PC samples were collected from the three major PC cultivation regions (Dabie Mountains region, Yunnan region and Xiangqian region). Detailed information of these samples is listed in Supplementary Materials (Supplementary Table S1). These samples were identified and authenticated by associate Prof. Hao Liu of Hunan Academy of Chinese Medicine. All the dry samples were further dried in an oven at 60 °C for 2 h, ground and sieved through a 60 mesh (0.3 mm). Well-prepared powder samples were labeled and stored in a dark and dry place.

2.2. Chemicals and Reagents

D-glucose (≥98.0% purity) was purchased from Sigma-Aldrich (Sigma, St. Louis, MA, USA). Dehydrotumulosic acid (DTUA, CAS No. 6754-16-1), poricoic acid A (PAA, CAS No. 137551-38-3), polyporenic acid C (PAC, CAS No. 465-18-9), dehydropachymic acid (DPA, CAS No. 77012-31-8), DehydrotraMetenolic acid (DTRA, CAS No. 29220-16-4), all above 98% purity, were purchased from Chroma Biotechnology Co., Ltd. (Chengdu, China). Distilled water was purified using a Milli-Q system (Millipore, Bedford, MA, USA). Acetonitrile (HPLC-grade) was purchased from Merck (Darmstadt, Germany). Ultrapure water was purchased from Hangzhou Wahaha Group Co., Ltd. (Changsha, China). All the reagents and chemicals were of analytical grade.

2.3. Extraction of Water-Soluble Content and Ethanol-Soluble Content of PC

The water-soluble and ethanol-soluble contents of the solutions were then extracted and analyzed by following the standard method documented in the Chinese Pharmacopoeia Volume IV: 2201 (2020 Edition).
To determine the content of water-soluble extract: 2.5 g sample powder was mixed in 50 mL water to make a water solution, which was weighed and allowed to stand for 1 h. The solution was then heated in a water bath to slightly boil for 1 h. After this, the solution was cooled and its weight was replenished by adding water. The well-mixed water solution was then filtered and 25 mL of the filtrate was transferred to an evaporating dish, which was heated in a water bath to obtain the extract by removing water through evaporation. The extract was dried at 105 °C for 3 h and allowed to cool for 30 min in a desiccator. Immediately after that, the extract was accurately weighted. The water-soluble extract content was determined using the following equation:
Cw = (W1W0) × 2/S × 100%
where Cw is the water-soluble extract content (%), S is the mass of the sample (g), W1 is the mass of the evaporating dish and residue after drying (g), and W0 is the mass of the evaporating dish (g).
The content of ethanol-soluble extract was determined in a similar way by using ethanol instead of water.

2.4. Polysaccharides Content and Absorbance Curve

The contents of PC samples were determined using the phenol-sulphuric acid method. The powder samples (0.5 g) were mixed with 100 mL of 80% (v/v) ethanol, and the solution was heated in a water bath to reflux for 1 h. The solution was then filtered through a hopper to obtain the residue that was then washed with 15 mL of 80% (v/v) hot ethanol for three times. The remaining residue was heated in 75 mL water and refluxed for 4 h. The residue solution was then filtered while it was hot and the filter was washed with a small amount of hot water. The filtrate was diluted with water in a 100 mL flask. In total, 1 mL of filtrate was precisely measured, placed in a 10 mL test tube, and further homogenized with 0.8 mL of 5% (v/v) phenol and 3.5 mL of concentrated sulphuric acid. The mixture was incubated in water bath at 40 °C for 15 min. After each sample was cooled in an ice bath, its absorbance was measured at a wavelength of 488 nm. A total of 0.098 mg/mL standard solution of glucose was prepared as reference solution. The sample was diluted for different concentrations of 0.0018, 0.0037, 0.0074, 0.0111, 0.0148 and 0.0185 mg/mL. The D-glucose standard was used to generate the standard absorbance curve, with the equation Y = 84.978X + 0.0571, R2 = 0.9924 (X—sample concentration; Y—absorbance).

2.5. Quantitative Analysis of Five Triterpene Acids Using High-Performance Liquid Chromatography (HPLC)

Chromatographic analysis was performed using a HPLC system (1200 series, Agilent Technologies, Santa Clara, CA, USA), comprising a quaternary solvent delivery pump, online degasser, autosampler, column thermostat and diode array detector. The column (ZORBAX SB-C18 column, 5 μm, 4.6 × 250 mm) was performed at 30 °C and at the flow rate of 1.0 mL/min. Acetonitrile and 0.2% (v/v) formic acid/water were used as mobile phase A and B, respectively. The solvent gradient was set as follows: 51% A during 0–5 min, 51–57% A during 5–20 min, 57–70% A during 20–45 min, 70–85% A during 45–55 min, and 85–100% A during 55–60 min. The injection volume was 10 μL and the detection wavelength was 245 nm.
Powdered samples (2.0 g) were accurately weighed, and then extracted with 20 mL methanol by ultrasonication (KM500DB, Kunshan Meimei Ultrasonic Instrument Co., Ltd., Kunshan, Jiangsu, China) at 40 kHz for 30 min. The extracts were then passed through 0.45 μm syringe filter for HPLC analysis. The concentrations of five triterpene acids, including DTUA, PAA, PAC, DPA and DTRA, were determined using standard calibration curves, and the detailed information of standard calibration curves was listed in Table 1.

2.6. NIR Spectroscopy Determination

The NIR spectra of the samples were measured by Antaris II FT-NIR spectrometer (Thermo Electron Co., Waltham, MA, USA), and the parameters of spectra were determined as 32 iterations of scans, resolution 8 cm−1, and scan range 600 to 2000 nm. The powder sample was added to the sample cup and compressed. Each sample was measured three times and the average of three spectra was calculated for further statistical analysis. The temperature was kept at around 25 °C in the laboratory.

2.7. Chemometric Methods

2.7.1. Geographical Discriminant Analysis of Random Forest Method (RFM)

RFM was an integration algorithm based on classification regression tree [42]. We used it to distinguish the producing areas of PC samples. During the training process, the RFM method constructed multiple independent tree classifiers based on Bagging algorithm, and the final results were voted by all constructed training classifiers. After model training, it can be used to classify the samples according to their producing areas. Previous studies [43] had reported in more detail how RFM performed better in distinguishing producing areas of Chinese medicinal materials.

2.7.2. Partial Least Squares Regression (PLSR) and Determination of Chemical Composition

PLSR is a classical regression method and has been widely used for quantitative determination through modeling. PLSR intends to project the high-dimensional predictor variables into a smart set of latent variables, which have a maximal covariance to the responses [43]. In this study, we used PLSR to establish the regression model for determination of chemical composition content, i.e., polysaccharides, ethanol-soluble extract, water-soluble extract and the five triterpenoids. The regression model was able to learn the relationship between independent variable X (NIR matrix) and dependent variable Y (chemical composition content), and the determination of chemical composition content was achieved by multiple linear regression of score matrix.

2.8. Software Requirements and Data Analysis

Statistical evaluation was performed using SPSS 21.0 (SPSS Inc., Chicago, IL, USA). All the algorithms were implemented in MATLAB 8.0.1 (MathWorks), and all the programing was done by the authors.
The indicators for evaluating the calibration set were the root mean square error of calibration (RMSEC), the root mean square error of prediction (RMSEP), the coefficient of determination for calibration (R2cal) and the coefficient of determination for prediction (R2pre). RMSEC and RMSEP were used to measure the model effectiveness and accuracy, while R2cal and R2pre were used to evaluate the fit of model. More specifically, a better model is indicated by smaller values of RMSEC and RMSEP and R2cal and R2pre being closer to 1. RMSEC, RMSEP and R2 were respectively defined using the following equation:
RMSEC = 1 n c i = 1 n c ŷ i y i 2
RMSEP = 1 n p i = 1 n p ŷ i y i 2
R 2 cal   = 1 i = 1 n c ŷ i y i 2 i = 1 n c y i   ȳ 2
R 2 pre   = 1 i = 1 n p ŷ i y i 2 i = 1 n p y i   ȳ 2  
where n c , n p   ŷ i , y i and ȳ are the number of observations in calibration, number of observations in prediction set, predicted value of the i-th observation, measured value of i-th observation and average of measured values, respectively.

3. Results and Discussion

3.1. Chemical Composition of PC Samples

3.1.1. Polysaccharides, Water-Soluble Extract and Ethanol-Soluble Extract in PC Samples

According to Chinese, Japanese, Korean and European pharmacopoeias, ethanol-soluble extract, water-soluble extract and polysaccharides are important indicators to evaluate the quality of PC. Our study had detected all these three indicators, and the detailed contents for these chemical compositions are listed in Table 2 and Figure 1A–C. Samples from the Yunnan region have the highest content of polysaccharide, water-soluble extract and ethanol-soluble extract at 6.81 mg g−1, 25.23 mg g−1 and 37.85 mg g−1, respectively. Samples from the Dabie Mountains region contain the lowest levels of polysaccharide (4.59 mg g−1), water-soluble extract (19.57 mg g−1) and ethanol-soluble extract (31.24 mg g−1). Figure 1A–C shows that the polysaccharides, ethanol-soluble extract, and water-soluble extract from the Yunnan region were significantly (p < 0.05) higher than those from the Dabie Mountains region. The contents of polysaccharides, water-soluble extract and ethanol-soluble extract in all the samples ranged from 1.24 mg g−1 to 31.16 mg g−1, 8.80 mg g−1 to 73.95 mg g−1, and 16.29 mg g−1 to 90.00 mg g−1, respectively. The wide range of these values demonstrates that the quality of PC varies greatly among different producing regions. With regard to the standard deviation, the Yunnan region is highest in all of the three chemical compositions, followed by the Xiangqian region and the Dabie Mountains region. Although samples from the Yunnan region have high quality, samples from the Dabie Mountains region show better consistency in quality. The high quality of PC products in the Yunnan region could be attributed to the local climate and natural environment, while the quality consistency in samples from the Dabie Mountains region could be related to higher standard of planting and processing.

3.1.2. HPLC Analysis of Five Triterpene Acids

Triterpenes is also an important indicator of the quality of PC. In this study, DTUA, PAA, PAC, DPA and DTRA were selected as the leading indicators and the contents of the five triterpene acids in these PC samples were determined via HPLC analysis. The detailed results were listed in Table 2 and plotted in Figure 1D–I. The results show that the contents of DTUA, PAC and DPA in samples from the Dabie Mountains region are significantly higher than those from the Yunnan region, while the contents of PAA and DTRA are slightly lower than those from the Yunnan region. However, the total contents of the five triterpenoids in the samples do not change significantly from one cultivation region to another. Similar to polysaccharides, ethanol-soluble extract and water-soluble extract, contents of triterpenoids vary greatly among the producing regions. The result also suggests that high contents of five triterpenoids in PC corresponds to low contents of polysaccharides, and vice versa.

3.2. NIR Spectra Characteristics

The samples were analyzed using NIR spectroscopy in the wavenumber range of 12,000 to 4000 cm−1. The results are presented in Figure 2, which illustrates five absorption peaks were mainly concentrated at about ~8256, ~6880, ~5610, ~5180 and ~4800 cm−1. The chemical structures of PC chemical components have abundant C–H and O–H bonds. It can be considered that the chemical components of PC were responsible for the NIR spectra. The strongest absorbance peak was observed at the wavenumber of ~5180–5200 cm−1, which is related to the combination of O–H stretching and bending, while the peak at ~4800 cm−1 is related to the combination of both C–O stretching and O–H deformation. The peak at ~6880 cm−1 may be related to the first overtone absorption of O–H stretching vibration and the weak peak at ~8256 cm−1 is related to the second overtone of symmetric stretching of the –CH bonds of –CH3 groups. Other less evident absorbance peaks are caused by overtones and combination modes of C–H, N–H, and O–H. The O–H and C–H vibrations are caused by compounds such as polysaccharides, triterpenoids and proteins [34,44]. As shown in Figure 2, the high overlap of NIR spectra makes it difficult to directly utilize the spectral information of target components. This problem can be solved by preprocessing the spectral information for better signal-to-noise ratio.

3.3. Elimination of Outliers

Outliers can have deleterious effects on model accuracy. We used Monte Carlo cross-validation method to identify potential outliers in NIR spectra. As shown in Figure 3, three samples were identified as outliers and thus excluded from model building.

3.4. Determination of PC Cultivation Regions

A classification model based on an RFM integration algorithm was used to identify PC cultivation regions. RFM integration algorithm could classify samples from different cultivation regions based on their similarities calculated in the model-training process.
To develop a more reliable model, samples were divided into calibration group (108 samples) and validation group (27 samples) at a ratio of 4:1 by classical Kennard–Stone (K-S) algorithm. The calibration group was used to optimize the model parameters and establish the optimal classification model. The validation group was used to verify the performance of the classification model. The separation plot of samples from different cultivation regions was shown in Figure 4.
Furthermore, the validation group was used to validate the reliability of the classification model we developed. The accuracy of classification prediction model was calculated as 92.59%, or 25 out of 27, with false results from only two samples (Table 3).

3.5. Development of Quantitative Prediction Model

3.5.1. Model Development and Optimization

By using Kennard–Stone (K-S) algorithm, 108 samples were selected to optimize the pretreatment processes and develop the prediction model, while the remaining 27 samples were used to validate the quantitative prediction model. Detailed information is provided in Table 4; the results show that the calibration group covers the range of the validation group, making the model more stable. In this section, a PLSR algorithm was used to build these quantitative prediction models, and the number of PLSR factors were optimized by 10-fold cross-validation method.
We further employed several signal pretreatment methods, including multiplicative scatter correction (MSC), Savizky–Golay method (SG), standard normal variate (SNV), and combined process methods, to improve the model performance, which was measured by RMSEC, R2cal, RMSEP and R2pre. The results obtained by different signal preprocess methods were showed in Table 5 and suggested that SG-1D was the most suitable for the water-soluble extracts and polysaccharides, while SNV worked best for the ethanol-soluble extracts and sum of five triterpenoids.
The results in Table 5 allow us to develop the prediction models using the optimized experimental conditions. The model for determination of water-soluble extract, alcohol-soluble extract, polysaccharides and the sum of five triterpenoids generated R2cal of 0.978, 0.972, 0.987 and 0.975, respectively, and exhibited RMSEC values of 1.083, 1.502, 0.056 and 0.165, respectively. In general, a good model would generate results with R2cal and R2pre close to 1, and RMSEC and RMSEP close to 0. A value of R greater than 0.9 indicates a strong correlation between the determined and actual values, and great accuracy of determination. The results in Table 5, with Rcal and Rpre values close to 1 and RMSEP and RMSEC values close to 0, demonstrate that the calibration models are capable of identifying the producing regions with good accuracy.

3.5.2. Validation of Quantitative Model

After the above processes were completed, the validation group of samples were used to validate the optimal prediction model. From Table 5, the values of R2pre and RMSEP are: 0.962 and 1.934, respectively, for water-soluble extract; 0.940 and 1.926, respectively, for alcohol-soluble extract; 0.965 and 0.0079, respectively, for polysaccharides; and 0.961 and 0.191, respectively, for the sum of five triterpenoids, as listed in Table 5. These results demonstrated the high accuracy of the models we developed.
To further evaluate the model, the relative error (RE) of the determined values was calculated. In general, the RE is less than 5% and indicates that the determined values are very close to the values in the reference. As can be seen from Figure 5, the RE of polysaccharides, water-soluble extract, alcohol-soluble extract and the sum of five triterpenoids is 4.055%, 3.821%, 4.344% and 3.744%, respectively. Therefore, it can be concluded that four models have high levels of accuracy and are capable of the fast quantitative analysis of PC chemical components.

4. Conclusions

The present study combined NIR spectroscopy with chemometrics, including RFM and PLSR, and developed models to determine PC cultivation regions and quality parameters represented by water-soluble extract, alcohol-soluble extract, polysaccharides and the sum of five triterpenoids. We selected optimal pretreatment method and chemometric method to optimize sample classification and generate quantitative models. Using the classification model, we achieved a classification accuracy of 92.59% for the validation group, with only two out of 27 samples incorrectly classified. In the meantime, we developed and optimized the PLSR model that was independent of the calibration or prediction set, with R2 greater than 0.9 and relative error smaller than 5% for most of the samples. The results verified the feasibility of this method in measuring the content of PC chemical components.
PC is a medicinal and nutritional material commonly used in functional food, healthy snacks and drinks. In recent years, demand for PC has increased continuously, leading to the increasing popularity of PC cultivation. Many factors of cultivation environment affect the quality of PC and cause discrepancies in the quality of products from different regions. NIR spectroscopy is an electromagnetic wave that is mainly the combination of overtone bands from hydrogen-containing function groups, such as C–H, N–H, O–H and their combination of both C–O stretching and O–H deformation. These absorptions contain rich composition information, making NIR spectroscopy very suitable for the measurement of hydrocarbon organic compounds in PC polysaccharides, water-soluble extract, alcohol-soluble extract and triterpene acids. In this study, we used the NIR method, which has multiple advantages over traditional methods, to rapidly and accurately evaluate the quality of PC. The method can be applied to general screening and rapid quality estimation, which, together with more samples in the future, will further improve the accuracy of the models we developed.

Supplementary Materials

The following supporting information can be downloaded at: https://www.mdpi.com/article/10.3390/foods11060892/s1, Table S1: Poria cocos samples information.

Author Contributions

Conceptualization, writing—original draft, data curation, J.X.; data curation, software, methodology, formal analysis, J.H.; investigation, resources, G.R.; research conceptualization, model validation, J.J.; investigation, resources, L.C.; resources, investigation, C.Z.; writing—original draft, Y.C.; resources, investigation, H.L.; model validation, formal analysis, R.Z.; writing—review, Y.Q.; funding acquisition, project administration, supervision, S.Z. All authors have read and agreed to the published version of the manuscript.

Funding

This research was funded by the program of Transformation and Industrialization of Scientific and Technological Achievements in Hunan Province (grant number: 2020SK2029), the Key R&D Program of Hunan Province (grant number: 2022NK2005, 2022ZYC024), Project of Changsha Technology Innovation Center (grant number: kh2004018), China Hunan Provincial Science & Technology Department (grant number: 2019XF5064), National Standardization Project for Traditional Chinese Medicines (grant number: ZYBZH-Y-HUN-22), Program of Survey and Monitoring of Chinese Medicines for National Drugs (grant number: [2017]66), and the Program of modern agricultural industrial technology system in Hunan (grant number: [2019]105).

Institutional Review Board Statement

Not applicable.

Informed Consent Statement

Not applicable.

Data Availability Statement

The data presented in this study are available in the article.

Acknowledgments

The authors acknowledge Hunan Bestcome Traditional Medicine Co., Ltd. for supplying the samples.

Conflicts of Interest

The authors declare no conflict of interest.

References

  1. Zhu, L.; Xu, J.; Zhang, S.; Wang, R.; Huang, Q.; Chen, H.; Dong, X.; Zhao, Z. Qualitatively and quantitatively comparing secondary metabolites in three medicinal parts derived from Poria cocos (Schw.) Wolf using UHPLC-QTOF-MS/MS-based chemical profiling. J. Pharm. Biomed. Anal. 2018, 150, 278–286. [Google Scholar] [CrossRef] [PubMed]
  2. Li, T.H.; Hou, C.C.; Chang, C.L.; Yang, W.C. Anti-Hyperglycemic Properties of Crude Extract and Triterpenes from Poria cocos. Evid. Based Complement. Altern. Med. 2011, 2011, 128402. [Google Scholar] [CrossRef] [PubMed] [Green Version]
  3. Li, X.; He, Y.; Zeng, P.; Liu, Y.; Zhang, M.; Hao, C.; Wang, H.; Lv, Z.; Zhang, L. Molecular basis for Poria cocos mushroom polysaccharide used as an antitumour drug in China. J. Cell. Mol. Med. 2019, 23, 4–20. [Google Scholar] [CrossRef] [PubMed] [Green Version]
  4. Jiang, Y.; Fan, L. The effect of Poria cocos ethanol extract on the intestinal barrier function and intestinal microbiota in mice with breast cancer. J. Ethnopharmacol. 2021, 266, 113456. [Google Scholar] [CrossRef]
  5. Zhang, W.; Chen, L.; Li, P.; Zhao, J.; Duan, J. Antidepressant and immunosuppressive activities of two polysaccharides from Poria cocos (Schw.) Wolf. Int. J. Biol. Macromol. 2018, 120 Pt B, 1696–1704. [Google Scholar] [CrossRef]
  6. Chen, X.; Tang, Q.; Chen, Y.; Wang, W.; Li, S. Simultaneous extraction of polysaccharides from Poria cocos by ultrasonic technique and its inhibitory activities against oxidative injury in rats with cervical cancer. Carbohydr. Polym. 2010, 79, 409–413. [Google Scholar] [CrossRef]
  7. Sun, S.S.; Wang, K.; Ma, K.; Bao, L.; Liu, H.W. An insoluble polysaccharide from the sclerotium of Poria cocos improves hyperglycemia, hyperlipidemia and hepatic steatosis in ob/ob mice via modulation of gut microbiota. Chin. J. Nat. Med. 2019, 17, 3–14. [Google Scholar] [CrossRef]
  8. Rigling, M.; Liu, Z.; Hofele, M.; Prozmann, J.; Zhang, C.; Ni, L.; Fan, R.; Zhang, Y. Aroma and catechin profile and in vitro antioxidant activity of green tea infusion as affected by submerged fermentation with Wolfiporia cocos (Fu Ling). Food Chem. 2021, 361, 130065. [Google Scholar] [CrossRef]
  9. Li, J.; Fan, G.; He, Y. Predicting the current and future distribution of three Coptis herbs in China under climate change conditions, using the MaxEnt model and chemical analysis. Sci. Total Environ. 2020, 698, 134141. [Google Scholar] [CrossRef]
  10. Dong, T.T.X.; Cui, X.M.; Song, Z.H.; Zhao, K.J.; Ji, Z.N.; Lo, A.C.K.; Tsim, K.W.K. Chemical assessment of roots of Panax notoginseng in China: Regional and seasonal variations in its active constituents. J. Agric. Food Chem. 2003, 51, 4617–4623. [Google Scholar] [CrossRef]
  11. Yu, L.; Sun, S.Q.; Fan, K.F.; Zhou, Q.; Noda, I. Research on processing medicinal herbs with multi-steps infrared macro-fingerprint method. Spectrochim. Acta A Mol. Biomol. Spectrosc. 2005, 62, 22–29. [Google Scholar] [CrossRef]
  12. Tian, S.-S.; Liu, X.-Q.; Feng, W.-H.; Zhang, Q.-W.; Yan, L.-H.; Wang, Z.-M.; Gao, L. Quality evaluation of Poria based on specific chromatogram and quantitative analysis of multicomponents. Zhongguo Zhong Yao Za Zhi 2019, 44, 1371–1380. [Google Scholar]
  13. Nie, A.; Chao, Y.; Zhang, X.; Jia, W.; Zhou, Z.; Zhu, C. Phytochemistry and Pharmacological Activities of Wolfiporia cocos (F.A. Wolf) Ryvarden & Gilb. Front. Pharmacol. 2020, 11, 505249. [Google Scholar]
  14. Zhu, L.-X.; Xu, J.; Wang, R.-J.; Li, H.-X.; Tan, Y.-Z.; Chen, H.-B.; Dong, X.-P.; Zhao, Z.-Z. Correlation between Quality and Geographical Origins of Poria cocos Revealed by Qualitative Fingerprint Profiling and Quantitative Determination of Triterpenoid Acids. Molecules 2018, 23, 2200. [Google Scholar] [CrossRef] [Green Version]
  15. Jin, J.; Zhou, R.; Xie, J.; Ye, H.; Liang, X.; Zhong, C.; Shen, B.; Qin, Y.; Zhang, S.; Huang, L. Insights into Triterpene Acids in Fermented Mycelia of Edible Fungus Poria cocos by a Comparative Study. Molecules 2019, 24, 1331. [Google Scholar] [CrossRef] [Green Version]
  16. Zhao, Q.L.; Zhang, L.; Bian, X.K.; Qian, D.W.; Guo, S.; Yan, H. Analysis of 8 triterpene acids in Poria from different habitats based on UPLC-QTRAP-MS. Chin. J. Pharm. Anal. 2020, 40, 1169–1177. [Google Scholar]
  17. Lee, S.R.; Lee, S.; Moon, E.; Park, H.J.; Park, H.B.; Kim, K.H. Bioactivity-guided isolation of anti-inflammatory triterpenoids from the sclerotia of Poria cocos using LPS-stimulated Raw264.7 cells. Bioorg. Chem. 2017, 70, 94–99. [Google Scholar] [CrossRef]
  18. Lee, S.; Choi, E.; Yang, S.-M.; Ryoo, R.; Moon, E.; Kim, S.-H.; Kim, K.H. Bioactive compounds from sclerotia extract of Poria cocos that control adipocyte and osteoblast differentiation. Bioorg. Chem. 2018, 81, 27–34. [Google Scholar] [CrossRef]
  19. Xu, H.; Wang, Y.; Jurutka, P.W.; Wu, S.; Chen, Y.; Cao, C.; Chen, G.; Tian, B.; Wang, S.; Cheng, S. 16α-Hydroxytrametenolic Acid from Poria cocos Improves Intestinal Barrier Function Through the Glucocorticoid Receptor-Mediated PI3K/Akt/NF-κB Pathway. J. Agric. Food Chem. 2019, 67, 10871–10879. [Google Scholar] [CrossRef]
  20. Zou, Y.-T.; Zhou, J.; Wu, C.-Y.; Zhang, W.; Shen, H.; Xu, J.-D.; Zhang, Y.-Q.; Long, F.; Li, S.-L. Protective effects of Poria cocos and its components against cisplatin-induced intestinal injury. J. Ethnopharmacol. 2021, 269, 113722. [Google Scholar] [CrossRef]
  21. Wang, J.; Zhang, W.; Tang, C.; Xiao, J.; Xie, B.; Sun, Z. Synergistic effect of B-type oligomeric procyanidins from lotus seedpod in combination with water-soluble Poria cocos polysaccharides against E. coli and mechanism. J. Funct. Foods 2018, 48, 134–143. [Google Scholar] [CrossRef]
  22. Khan, I.; Huang, G.; Li, X.; Leong, W.; Xia, W.; Hsiao, W.L.W. Mushroom polysaccharides from Ganoderma lucidum and Poria cocos reveal prebiotic functions. J. Funct. Foods 2018, 41, 191–201. [Google Scholar] [CrossRef]
  23. Hua, H.; Yi, Y.; Li, H.; Chen, C. Monitoring the extraction process of acidic polysaccharides in Poria cocos by near infrared spectroscopy combined with chemometrics. Infrared Phys. Technol. 2021, 113, 103613. [Google Scholar] [CrossRef]
  24. Huang, Y.-J.; Hsu, N.-Y.; Lu, K.-H.; Lin, Y.-E.; Lin, S.-H.; Lu, Y.-S.; Liu, W.-T.; Chen, M.-H.; Sheen, L.-Y. Poria cocos water extract ameliorates the behavioral deficits induced by unpredictable chronic mild stress in rats by down-regulating inflammation. J. Ethnopharmacol. 2020, 258, 112566. [Google Scholar] [CrossRef]
  25. Li, Y.; Li, X.; Lu, Y.; Chaurasiya, B.; Mi, G.; Shi, D.; Chen, D.; Webster, T.J.; Tu, J.; Shen, Y. Co-delivery of Poria cocos extract and doxorubicin as an ‘all-in-one’ nanocarrier to combat breast cancer multidrug resistance during chemotherapy. Nanomedicine 2020, 23, 102095. [Google Scholar] [CrossRef]
  26. Zhang, J.; Guo, H.; Yan, F.; Yuan, S.; Li, S.; Zhu, P.; Cheng, W.; Peng, C.; Peng, D. An UPLC-Q-Orbitrap method for pharmacokinetics and tissue distribution of four triterpenoids in rats after oral administration of Poria cocos ethanol extracts. J. Pharm. Biomed. Anal. 2021, 203, 114237. [Google Scholar] [CrossRef]
  27. Ríos, J.L. Chemical constituents and pharmacological properties of Poria cocos. Planta Med. 2011, 77, 681–691. [Google Scholar] [CrossRef] [Green Version]
  28. Qian, Q.; Zhou, N.; Qi, P.; Zhang, Y.; Mu, X.; Shi, X.; Wang, Q. A UHPLC-QTOF-MS/MS method for the simultaneous determination of eight triterpene compounds from Poria cocos (Schw.) Wolf extract in rat plasma: Application to a comparative pharmacokinetic study. J. Chromatogr. B 2018, 1102–1103, 34–44. [Google Scholar] [CrossRef] [PubMed]
  29. Zhou, L.; Zhang, Y.; Gapter, L.A.; Ling, H.; Agarwal, R.; Ng, K.Y. Cytotoxic and anti-oxidant activities of lanostane-type triterpenes isolated from Poria cocos. Chem. Pharm. Bull. 2008, 56, 1459–1462. [Google Scholar] [CrossRef] [PubMed] [Green Version]
  30. Musingarabwi, D.M.; Nieuwoudt, H.H.; Young, P.R.; Eyéghè-Bickong, H.A.; Vivier, M.A. A rapid qualitative and quantitative evaluation of grape berries at various stages of development using Fourier-transform infrared spectroscopy and multivariate data analysis. Food Chem. 2016, 190, 253–262. [Google Scholar] [CrossRef] [PubMed]
  31. Manley, M. Near-infrared spectroscopy and hyperspectral imaging: Non-destructive analysis of biological materials. Chem. Soc. Rev. 2014, 43, 8200–8214. [Google Scholar] [CrossRef] [Green Version]
  32. Benes, E.; Gere, A.; Fodor, M. Predicting macronutrients and energy content of snack products using FT-NIR analysis and chemometric techniques. J. Food Eng. 2020, 280, 109954. [Google Scholar] [CrossRef]
  33. Fodor, M.; Mikola, E.E.; Geösel, A.; Stefanovits-Bányai, É.; Mednyánszky, Z. Application of Near-Infrared Spectroscopy to Investigate Some Endogenic Properties of Pleurotus ostreatus Cultivars. Sensors 2020, 20, 6632. [Google Scholar] [CrossRef]
  34. Yi, C.; Xie, M.; Hui, Z.; Wang, Y.; Nie, S.; Chang, L. Quantification of total polysaccharides and triterpenoids in Ganoderma lucidum and Ganoderma atrum by near infrared spectroscopy and chemometrics. Food Chem. 2012, 135, 268–275. [Google Scholar]
  35. Mikola, E.; Gesel, A.; Stefanovits-Bányai, V.; Fodor, M. Quantitative determination of macro components and classification of some cultivated mushrooms using near-infrared spectroscopy. J. Food Process. Preserv. 2020, 44, e14540. [Google Scholar] [CrossRef]
  36. Meenu, M.; Xu, B. Application of vibrational spectroscopy for classification, authentication and quality analysis of mushroom: A concise review. Food Chem. 2019, 289, 545–557. [Google Scholar] [CrossRef]
  37. Benes, E.; Bajusz, D.; Gere, A.; Fodor, M.; Rácz, A. Comprehensive chemometric classification of snack products based on their near infrared spectra. LWT 2020, 133, 110130. [Google Scholar] [CrossRef]
  38. Wang, F.; Zhao, C.; Yang, G. Development of a Non-Destructive Method for Detection of the Juiciness of Pear via VIS/NIR Spectroscopy Combined with Chemometric Methods. Foods 2020, 9, 1778. [Google Scholar] [CrossRef]
  39. Pereira, A.C.; Reis, M.S.; Saraiva, P.M.; Marques, J.C. Madeira wine ageing prediction based on different analytical techniques: UV–vis, GC-MS, HPLC-DAD. Chemom. Intell. Lab. Syst. 2011, 105, 43–55. [Google Scholar] [CrossRef]
  40. Zhang, Z.; Ding, J.; Zhu, C.; Wang, J. Combination of efficient signal pre-processing and optimal band combination algorithm to predict soil organic matter through visible and near-infrared spectra. Spectrochim. Acta A Mol. Biomol. Spectrosc. 2020, 240, 118553. [Google Scholar] [CrossRef]
  41. Ren, G.; Ning, J.; Zhang, Z. Multi-variable selection strategy based on near-infrared spectra for the rapid description of dianhong black tea quality. Spectrochim. Acta A Mol. Biomol. Spectrosc. 2021, 245, 118918. [Google Scholar] [CrossRef]
  42. Zhou, R.-R.; Yu, Y.; Zeng, W.; Hu, M.-H.; Fan, L.-D.; Chen, L.; Qiu, Z.-D.; Song, C.; Zhang, S.-H.; Guo, L.-P.; et al. Rapid identification of geographical origins and determination of polysaccharides contents in Ganoderma lucidum based on near infrared spectroscopy and chemometrics. Zhongguo Zhong Yao Za Zhi 2018, 43, 3243–3248. [Google Scholar]
  43. Huang, J.-H.; Zhou, R.-R.; He, D.; Chen, L.; Yang, Y.-Y.; Xie, H.-L.; Zhang, S.-H.; Zhao, C.-X.; Huang, L.-Q. Rapid identification of Lilium species and polysaccharide contents based on near infrared spectroscopy and weighted partial least square method. Int. J. Biol. Macromol. 2020, 154, 182–187. [Google Scholar] [CrossRef]
  44. Masithoh, R.E.; Lohumi, S.; Yoon, W.; Amanah, H.Z.; Cho, B. Development of multi-product calibration models of various root and tuber powders by fourier transform near infra-red (FT-NIR) spectroscopy for the quantification of polysaccharide contents. Heliyon 2020, 6, e05099. [Google Scholar] [CrossRef]
Figure 1. Box and whisker plot of polysaccharides (PSC, A), water-soluble extract (WSE, B), alcohol-soluble extract (ASE, C), triterpene acids DTUA (D), PAA (E), PAC (F), DPA (G), DTRA (H) and sum of five triterpenoids (SFT, I) in cultivation regions of PC. Data are mean values ± SD (significant differences between the letters). The boxes are bounded by the 25% and 75% quartiles, with the median inside, whereas the extreme levels correspond to 5% and 95% percentiles, the rhombuses and stars represent the atypical values.
Foods 11 00892 g001
Figure 2. NIR spectra of the 138 PC samples without pretreatments.
Foods 11 00892 g002
Figure 3. Outlier identification by using Monte Carlo cross-validation method.
Foods 11 00892 g003
Figure 4. The NIR-based classification plot of PC for three main producing regions.
Foods 11 00892 g004
Figure 5. The relative error (RE) of polysaccharides (PSC), water-soluble extract (WSE), alcohol-soluble extract (ASE) and sum of five triterpenoids (SFT). (A) polysaccharides; (B) water-soluble extract; (C) alcohol-soluble extract; (D) sum of five triterpenoids.
Foods 11 00892 g005
Table 1. Linear regression of the five triterpene acids.
CompoundsRange (μg mL−1)Regression Equation aR2LOD b (μg mL−1)LOQ c (μg mL−1)
DTUA0.81~40.60y = 16,985,351.48000 x + 4404.857450.9960.2090.696
PAA0.40~20.00y = 14,178,282.95000 x − 1464.463740.9980.1860.619
PAC0.41~20.40y = 16,709,116.59000 x − 399.563290.9990.1660.554
DPA0.79~39.60y = 15,817,965.09000 x + 518.674830.9980.2360.788
DTRA1.21~60.40y = 18,347,795.59000 x + 9040.364030.9940.1570.525
a, x—concentration of the analyte (mg mL−1), y—peak value; b, LOD—limit of detection; c, LOQ—limit of quantification.
Table 2. Active contents of PC samples.
RegionsYunan RegionXiangqian RegionDabie Mountains Region
Number of Samples582852
PSC (mg g−1)Min1.241.201.40
Max31.1622.668.96
Mean6.815.674.59
SD5.624.591.89
WSE (mg g−1)Min8.8015.525.68
Max73.9573.7657.58
Mean25.2223.9519.57
SD12.8112.187.40
ASE (mg g−1)Min16.2924.2017.01
Max90.0053.8848.70
Mean37.8533.6031.24
SD14.317.535.83
DTUA (mg g−1)Min0.080.080.08
Max0.390.330.50
Mean0.150.160.24
SD0.050.050.10
PAA (mg g−1)Min0.010.010.01
Max0.300.200.34
Mean0.060.070.05
SD0.060.050.05
PAC (mg g−1)Min0.020.070.09
Max0.210.200.36
Mean0.130.130.14
SD0.030.030.04
DPA (mg g−1)Min0.110.130.15
Max0.270.350.33
Mean0.180.210.21
SD0.040.050.04
DTRA (mg g−1)Min0.130.150.07
Max4.654.042.12
Mean0.730.800.50
SD0.890.730.41
SFT (mg g−1)Min0.510.640.52
Max5.684.822.77
Mean1.261.361.13
SD1.000.800.47
PSC—polysaccharides; WSE—water-soluble extract; ASE—alcohol-soluble extract; DTUA—Dehydrotumulosic acid; PAA—poricoic acid A; PAC—polyporenic acid C; DPA—dehydropachymic acid; DTRA—Dehydrotrametenolic acid; SFT—sum of the five triterpenoids; SD—standard deviation.
Table 3. Comparison between reference values and the values determined by NIR spectroscopy and RFM in validation samples.
SampleReference ValuesNIR ValuesResults
S16YN aYNCorrect
S19YNYNCorrect
S22YNYNCorrect
S25YNYNCorrect
S35YNYNCorrect
S50YNYNCorrect
S57DBM bDBMCorrect
S64DBMDBMCorrect
S65DBMDBMCorrect
S67DBMDBMCorrect
S68DBMDBMCorrect
S69DBMDBMCorrect
S73DBMDBMCorrect
S76DBMDBMCorrect
S80DBMDBMCorrect
S83XQ cXQCorrect
S88XQXQCorrect
S92XQDBMFalse
S93DBMDBMCorrect
S101DBMDBMCorrect
S102DBMDBMCorrect
S109DBMDBMCorrect
S112DBMDBMCorrect
S121YNYNCorrect
S128DBMDBMCorrect
S133YNYNCorrect
S136XQDBMFalse
a, YN—Yunnan region; b, DBM—Dabie Mountains region; c, XQ—Xiangqian region.
Table 4. Range of values obtained by the reference methods for PC samples in the calibration and validation sample groups.
IndexesCalibrationValidation
NRangeMeanSDNRangeMeanSD
PSC1081.20–31.165.894.84271.95–8.904.972.02
WSE1085.68–73.9523.3111.082710.40–25.6918.283.10
ASE10816.29–90.0035.2711.732725.29–42.3830.774.51
SFT1080.51–5.681.250.87270.58–2.531.120.40
PSC—polysaccharide content; WSE—water-soluble extract content; ASE—alcohol-soluble extract content; SFT—sum of the five triterpenoids; SD—standard deviation.
Table 5. Results obtained by using different methods for signal pretreatment.
IndexesEvaluations aRawMSCSNVSmoothSmooth +
SNV
Smooth +
MSC
SG-1D
PSCRMSEC0.1220.1070.1140.1120.1010.0930.056
R2cal0.8550.8880.8720.8790.9010.9150.987
RMSEP0.1790.1650.1880.1080.1380.1240.079
R2pre0.7390.7900.7010.8630.8050.8590.965
WSERMSEC2.8022.9242.4552.3433.1162.4891.083
R2cal0.8240.8220.8640.8770.7820.8610.978
RMSEP3.3153.0903.1743.4673.6103.5161.934
R2pre0.7580.8080.7680.7250.6960.7100.962
ASERMSEC2.9962.7011.5022.0662.4893.7493.512
R2cal0.9100.9200.9720.9460.9110.8970.909
RMSEP2.7723.7631.9262.9684.2853.8943.763
R2pre0.9100.8620.9400.9180.8360.8730.862
SFTRMSEC0.2980.2280.1650.2250.2250.2290.197
R2cal0.8620.9190.9750.9210.9210.9190.940
RMSEP0.3150.2790.1910.2980.2830.2700.259
R2pre0.8460.8800.9610.8620.8760.8870.896
PSC—polysaccharide content; WSE—water-soluble extract content; ASE—alcohol-soluble extract content; SFT—the sum content of five triterpene acids; a—the smaller the RMSEC, RMSEP value and the closer the R2cal, R2pre value to 1, the better the model.
Publisher’s Note: MDPI stays neutral with regard to jurisdictional claims in published maps and institutional affiliations.

