
Tailoring the Textural Characteristics of Fat-Free Fermented Concentrated Milk-Protein Based Microgel Dispersions by Way of Upstream, Downstream and Post-Production Thermal Inputs


Abstract
:1. Introduction
2. Materials and Methods
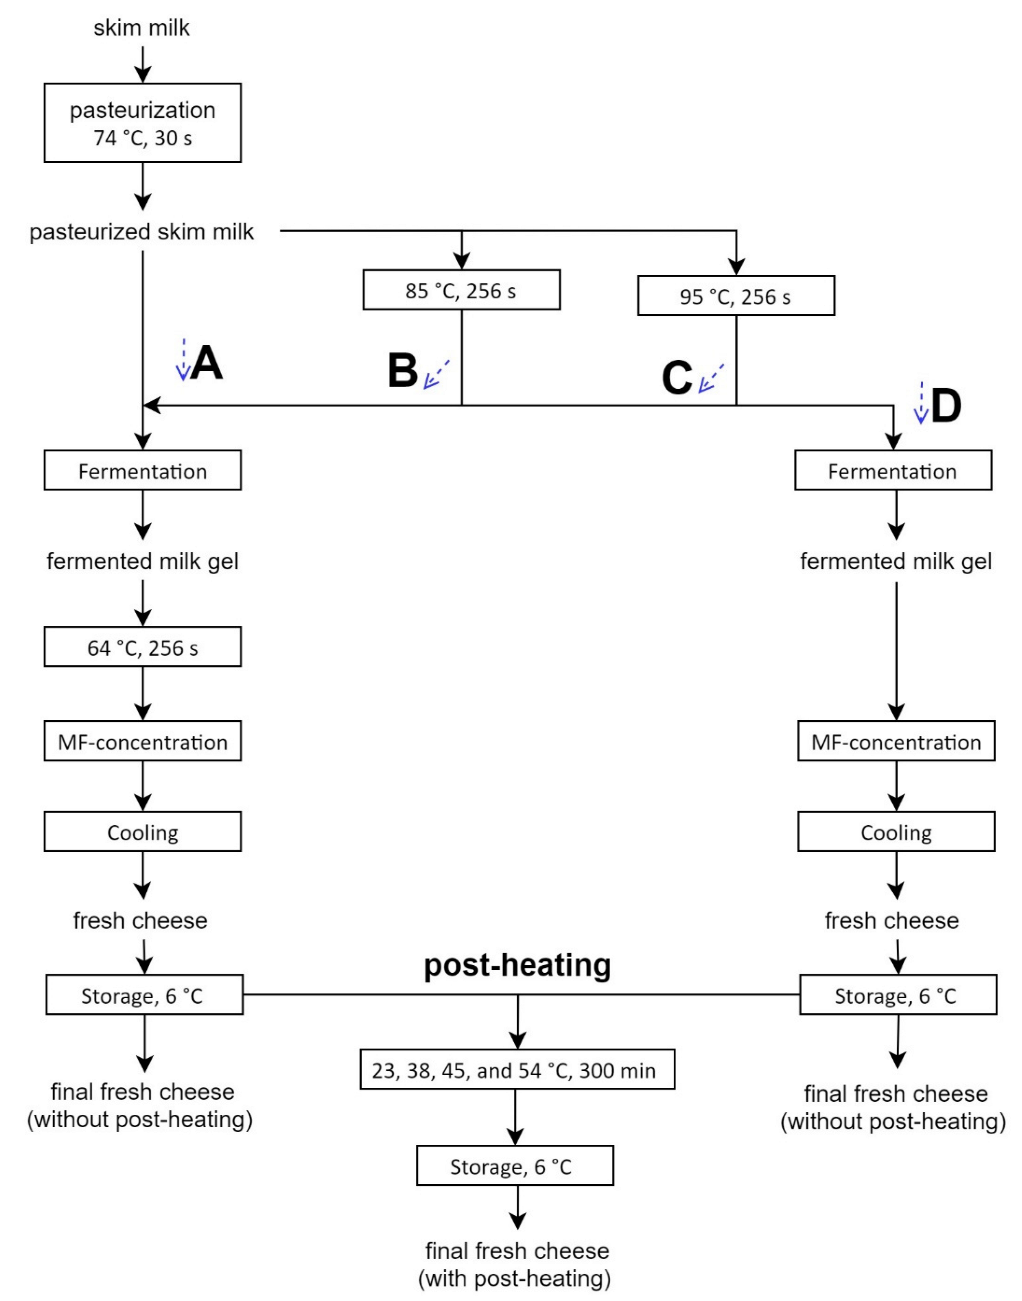
2.1. Fat-Free Fermented Concentrated Milk Protein-Based Microgel Dispersions
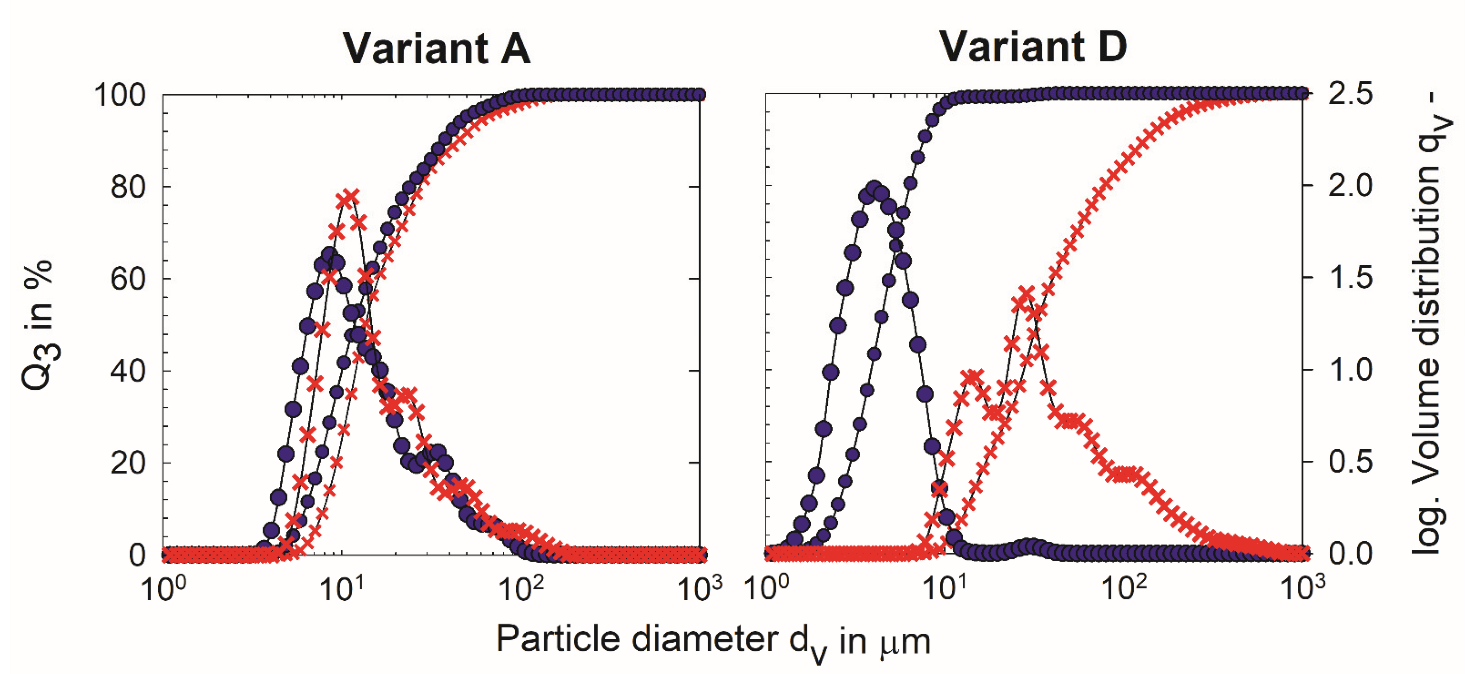
2.2. Particle Size
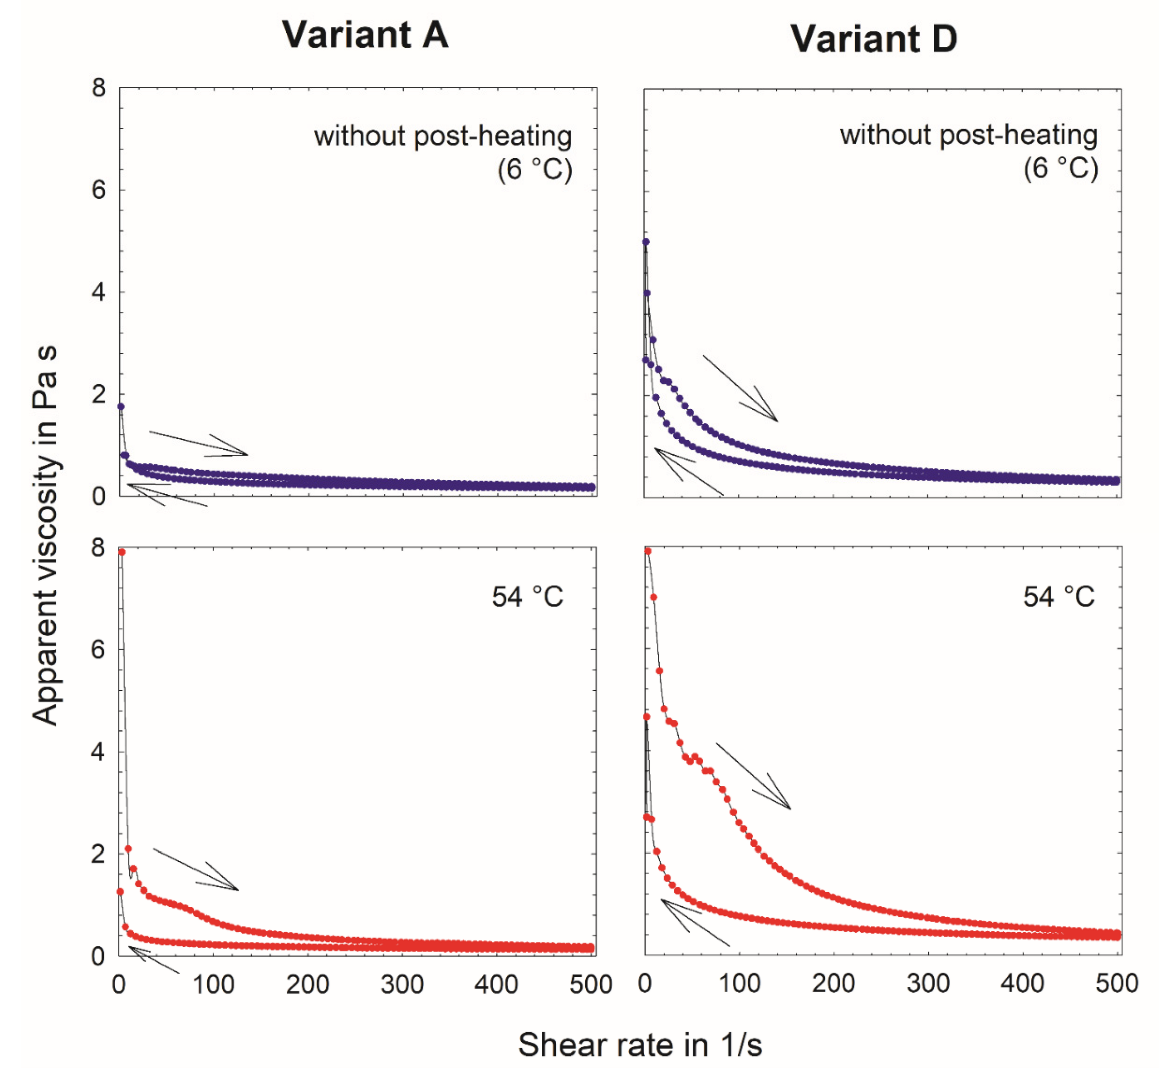
2.3. Rheology
2.4. Chemical Analysis
2.5. Statistical Analysis
3. Results and Discussion
3.1. Upstream Thermal Input
3.2. Pre-Concentration Heating
3.3. Post-Heating
3.4. Summary and Application
4. Conclusions
Author Contributions
Funding
Institutional Review Board Statement
Informed Consent Statement
Data Availability Statement
Acknowledgments
Conflicts of Interest
References
- Loewen, A.; Nöbel, S.; Hinrichs, J. Microgel particles and their effect on the textural properties of foods. In Reference Module in Food Science; Elsevier: Amsterdam, The Netherlands, 2017; pp. 1–9. ISBN 0-08-100596-2, 978-0-08-100596-5. [Google Scholar]
- Fernandez-Nieves, A.; Wyss, H.; Mattsson, J.; Weitz, D. (Eds.) Microgel Suspensions: Fundamentals and Applications; Wiley-VCH: Weinheim, Germany, 2011; ISBN 9783527321582. [Google Scholar]
- Heck, A.; Schäfer, J.; Nöbel, S.; Hinrichs, J. Fat-free fermented concentrated milk products as milk protein-based microgel dispersions: Particle characteristics as key drivers of textural properties. Compr. Rev. Food Sci. Food Saf. 2021, 20, 6057–6088. [Google Scholar] [CrossRef] [PubMed]
- Fox, P.F.; Guinee, T.P.; Cogan, T.M.; McSweeney, P.L.H. Fresh cheese products: Principals of manufacture and overview of different varieties. In Fundamentals of Cheese Science; Springer: Berlin/Heidelberg, Germany, 2017; pp. 543–588. ISBN 9781489976819. [Google Scholar]
- Farkye, N.Y. Quark, Quark-like Products, and Concentrated Yogurts; McSweeney, P.L.H., Fox, P.F., Cotter, P.D., Everett, D.W., Eds.; Elsevier: Amsterdam, The Netherlands, 2017; ISBN 9780124170124. [Google Scholar]
- Schulz-Collins, D.; Senge, B. Acid- and acid/rennet-curd cheeses part A: Quark, cream cheese and related varieties. In Cheese: Chemistry, Physics and Microbiology; Fox, P., McSweeney, P., Cogan, T., Timothy, G., Eds.; Elsevier: Amsterdam, The Netherlands, 2004; Volume 2, pp. 301–328. ISBN 9780122636530. [Google Scholar]
- Nöbel, S.; Protte, K.; Körzendörfer, A.; Hitzmann, B.; Hinrichs, J. Sonication induced particle formation in yogurt: Influence of the dry matter content on the physical properties. J. Food Eng. 2016, 191, 77–87. [Google Scholar] [CrossRef]
- Hahn, C.; Sramek, M.; Nöbel, S.; Hinrichs, J. Post-processing of concentrated fermented milk: Influence of temperature and holding time on the formation of particle clusters. Dairy Sci. Technol. 2012, 92, 91–107. [Google Scholar] [CrossRef] [Green Version]
- Hahn, C.; Müller, E.; Wille, S.; Weiss, J.; Atamer, Z.; Hinrichs, J. Control of microgel particle growth in fresh cheese (concentrated fermented milk) with an exopolysaccharide-producing starter culture. Int. Dairy J. 2014, 36, 46–54. [Google Scholar] [CrossRef]
- Hahn, C.; Wachter, T.; Weiss, J.; Hinrichs, J. Application of an inline particle size device to microgel particles during post-processing of fresh cheese. Int. Dairy J. 2013, 29, 75–81. [Google Scholar] [CrossRef]
- Hahn, C.; Sramek, M.; Nöbel, S.; Hinrichs, J. Reduction of the particle size in fresh cheese by mechanical post-processing. Dtsch. Molk. Ztg. 2010, 131, 16–18. [Google Scholar]
- Mende, S.; Rohm, H.; Jaros, D. Influence of exopolysaccharides on the structure, texture, stability and sensory properties of yoghurt and related products. Int. Dairy J. 2016, 52, 57–71. [Google Scholar] [CrossRef]
- Surber, G.; Schäper, C.; Wefers, D.; Rohm, H.; Jaros, D. Exopolysaccharides from Lactococcus lactis affect manufacture, texture and sensory properties of concentrated acid milk gel suspensions (fresh cheese). Int. Dairy J. 2021, 112, 104854. [Google Scholar] [CrossRef]
- Walenta, W.; Bäurle, H.W.; Kessler, H.G. Einfluß von Molkenproteinzusätzen auf die Strukturausbildung von Frischkäsezubereitungen. Dtsch. Molk. Ztg. 1988, 109, 538–543. [Google Scholar]
- Kelly, A.L.; O’Donnell, H.J. Composition, gel properties and microstructure of quarg as affected by processing parameters and milk quality. Int. Dairy J. 1998, 8, 295–301. [Google Scholar] [CrossRef]
- Vaziri, M.; Abbasu, H.; Mortazavi, A.; Abbasi, H.; Mortazavi, A. Microstructure and physical properties of quarg cheese as affected by different heat treatments. J. Food Process. Preserv. 2010, 34, 2–14. [Google Scholar] [CrossRef]
- Bäurle, H.W.; Walenta, W.; Kessler, H.G. Herstellung von Magerquark mithilfe der Ultrafiltration. Dtsch. Molk. Ztg. 1984, 12, 356–363. [Google Scholar]
- Dolle, E. Technik des Thermo-Speisequark-Verfahrens. Dtsch. Milchwirtsch. 1977, 22, 709–712. [Google Scholar]
- Ott, H. Erfahrungen und Betriebsergebnisse mit dem Westfailia Thermo-Speisequark-Herstellungsverfahren. Dtsch. Milchwirtsch. 1977, 22, 721–722. [Google Scholar]
- Zakrzewski, E.; Stepaniak, L.; Abrahamsen, R.K.; Sørhaug, T. Effect of thermization on the quality of Quarg. Int. Dairy J. 1991, 1, 199–208. [Google Scholar] [CrossRef]
- Hahn, C.; Nöbel, S.; Maisch, R.; Rösingh, W.; Weiss, J.; Hinrichs, J. Adjusting rheological properties of concentrated microgel suspensions by particle size distribution. Food Hydrocoll. 2015, 49, 183–191. [Google Scholar] [CrossRef]
- Hahn, C.; Wachter, T.; Nöbel, S.; Weiss, J.; Eibel, H.; Hinrichs, J. Graininess in fresh cheese as affected by post-processing: Influence of tempering and mechanical treatment. Int. Dairy J. 2012, 26, 73–77. [Google Scholar] [CrossRef]
- Heck, A.; Nöbel, S.; Hitzmann, B.; Hinrichs, J. Volume fraction measurement of soft (dairy) microgels by standard addition and static light scattering. Food Biophys. 2021, 16, 237–253. [Google Scholar] [CrossRef]
- Qian, F.; Sun, J.; Cao, D.; Tuo, Y.; Jiang, S. Experimental and Modelling Study of the Denatur- ation of Milk Protein by Heat Treatment. Korean J. Food Sci. Anim. Resour. 2017, 37, 44–51. [Google Scholar] [CrossRef] [Green Version]
- Heck, A.; Schäfer, J.; Hitzmann, B.; Hinrichs, J. Fat-free fermented concentrated milk protein-based microgel dispersions manufactured at technical scale: Production parameters as drivers of textural properties. Int. Dairy J. 2021, 127, 105195. [Google Scholar] [CrossRef]
- Beckman Coulter LS 13 320 Particle Size Analyzer Manual. 2011. Available online: https://www.beckmancoulter.com/wsrportal/techdocs?docname=B05577AB.pdf (accessed on 10 January 2022).
- Lyon, L.A.; Fernandez-Nieves, A. The Polymer/Colloid Duality of Microgel Suspensions. Annu. Rev. Phys. Chem. 2012, 63, 25–43. [Google Scholar] [CrossRef] [PubMed]
- Pelton, R. Temperature-sensitive aqueous microgels. Adv. Colloid Interface Sci. 2000, 85, 1–33. [Google Scholar] [CrossRef]
- Hayakawa, O.; Nakahira, K.; Tsubaki, J.I. Estimation of the optimum refractive index by the laser diffraction and scattering method: On the raw material of fine ceramics. Adv. Powder Technol. 1995, 6, 47–61. [Google Scholar] [CrossRef]
- Körzendörfer, A.; Nöbel, S.; Hinrichs, J. Particle formation induced by sonication during yogurt fermentation—Impact of exopolysaccharide-producing starter cultures on physical properties. Food Res. Int. 2017, 97, 170–177. [Google Scholar] [CrossRef]
- Krzeminski, A.; Tomaschunas, M.; Köhn, E.; Busch-Stockfisch, M.; Weiss, J.; Hinrichs, J. Relating creamy perception of whey protein enriched yogurt systems to instrumental data by means of multivariate data analysis. J. Food Sci. 2013, 78, S314–S319. [Google Scholar] [CrossRef]
- Fysun, O.; Nöbel, S.; Loewen, A.; Hinrichs, J. Tailoring yield stress and viscosity of concentrated microgel suspensions by means of adding immiscible liquids. LWT-Food Sci. Technol. 2018, 93, 51–57. [Google Scholar] [CrossRef]
- Lucey, J.A.; Tamehana, M.; Singh, H.; Munro, P.A. Rheological properties of milk gels formed by a combination of rennet and glucono-delta-lactone. J. Dairy Res. 2000, 67, 415–427. [Google Scholar] [CrossRef]
- Van Vliet, T.; Van Dijkl, H.J.M.; Zoon, P.; Walstra, P. Relation between syneresis and rheological properties of particle gels. Colloid Polym. Sci. 1991, 627, 620–627. [Google Scholar] [CrossRef]
- Hinrichs, J. Incorporation of whey proteins in cheese. Int. Dairy J. 2001, 11, 495–503. [Google Scholar] [CrossRef]
- Senge, B.; Sienkiewicz, T. Rheologische besonderheiten von Frischkäse—Konsequenzen zur optimieren der Prozesstechnik. Dtsch. Molk. Ztg. 2002, 123, 26–33. [Google Scholar]
- Chever, S.; Guyomarc’h, F.; Beaucher, E.; Famelart, M.H.H. High-protein fat-free acid milk gels: Control of protein composition and heat treatment. Int. Dairy J. 2014, 37, 95–103. [Google Scholar] [CrossRef]
- Tyle, P. Effect of size, shape and hardness of particles in suspension on oral texture and palatability. Acta Psychol. (Amst). 1993, 84, 111–118. [Google Scholar] [CrossRef]

| Process Variant | |||||
|---|---|---|---|---|---|
| A | B | C | D | ||
| i | 3 | 3 | 4 | 5 | |
| Milk | pH20 °C | 6.72 ± 0.02 a | 6.68 ± 0.04 a | 6.64 ± 0.02 a | 6.67 ± 0.04 a |
| Protein% w/w | 3.4 ± 0.2 a | 3.7 ± 0.2 a | 3.6 ± 0.2 a | 3.5 ± 0.2 a | |
| Fermented milk gel | pH20 °C | 4.52 ± 0.04 a | 4.49 ± 0.02 a | 4.49 ± 0.01 a | 4.49 ± 0.03 a |
| Permeate | pH20 °C | 4.52 ± 0.01 a | 4.47 ± 0.01 a | 4.48 ± 0.01 a | 4.48 ± 0.02 a |
| Protein% w/w | 1.0 ± 0.2 c | 0.9 ± 0.2 bc | 0.6 ± 0.2 ab | 0.6 ± 0.1 a | |
| Final fresh cheese | pH20 °C | 4.55 ± 0.01 a | 4.50 ± 0.01 a | 4.51 ± 0.02 a | 4.51 ± 0.02 a |
| Protein% w/w | 8.6 ± 0.4 a | 8.8 ± 0.5 a | 9.1 ± 0.8 a | 8.8 ± 0.3 a | |
| Dry matter% w/w | 14.0 ± 0.4 a | 14.0 ± 0.4 a | 14.4 ± 0.5 a | 14.2 ± 0.3 a | |
| Particle Size | Rheology | ||||||||
|---|---|---|---|---|---|---|---|---|---|
| Post-Heating Temperature | Oscillatory | Rotational | |||||||
| Span | Storage Modulus | Loss Tangent | Yield Stress | Apparent Viscosity | Energy Loss | ||||
| RIapp - | d50,3 µm | d75,3 µm | d90,3–d10,3 µm | Pa | - | Pa | Pa s | ΔE J/m3 | |
| Variant A | |||||||||
| Without post-heating | 1.40 b,A | 11.3 a,B | 19.2 a,B | 30.0 a,B | 26 a,A | 23.5 b,B | 0.6 a,A | 0.5 a,A | 63 a,A |
| 23 °C | 1.40 b | 11.5 a | 21.3 ab | 32.7 a | 16 a | 26.3 c | 0.2 a | 0.5 a | 61 a |
| 38 °C | 1.40 b | 11.3 a | 19.8 a | 29.3 a | 12 a | 28.3 c | 0.2 a | 0.6 a | 76 a |
| 45 °C | 1.39 a | 12.0 b | 20.8 a | 30.9 a | 75 a | 18.2 a | 1.7 a | 0.7 ab | 100 b |
| 54 °C | 1.39 a | 13.1 c | 23.2 b | 37.1 a | 522 b | 16.0 a | 8.7 b | 0.9 b | 143 c |
| Variant B | |||||||||
| Without post-heating | 1.45 b,B | 11.4 a,B | 20.0 a,B | 25.9 a,B | 60 a,A | 20.1 b.B | 1.1 a,A | 0.7 a,A | 101 a,A |
| 23 °C | 1.47 b | 11.2 a | 19.9 a | 26.7 a | 66 a | 20.2 b | 1.1 a | 0.8 ab | 120 a |
| 38 °C | 1.42 a | 10.9 a | 19.1 a | 25.4 a | 95 a | 19.1 b | 3.8 a | 0.8 ab | 128 b |
| 45 °C | 1.43 a | 11.3 a | 19.0 a | 24.2 a | 437 a | 15.7 a | 14.6 ab | 1.0 b | 184 c |
| 54 °C | 1.40 a | 13.0 a | 20.6 a | 25.8 a | 1227 b | 15.5 a | 28.5 b | 1.2 c | 252 d |
| Variant C | |||||||||
| Without post-heating | 1.46 b,B | 11.9 a,B | 19.6 a,B | 26.5 a,B | 562 a,B | 15.5 a,A | 7.1 a,C | 1.3 a,B | 185 a,B |
| 23 °C | 1.47 b | 11.5 a | 19.5 a | 26.3 a | 531 a | 15.9 a | 10.4 a | 1.1 a | 159 a |
| 38 °C | 1.40 a | 12.1 a | 18.6 a | 24.6 a | 1816 b | 14.6 a | 35.4 b | 1.5 b | 261 b |
| 45 °C | 1.39 a | 12.9 b | 19.7 a | 23.9 a | 2183 b | 15.7 a | 49.6 c | 1.8 c | 295 c |
| 54 °C | 1.38 a | 17.9 c | 28.7 b | 35.7 b | 2931 c | 15.0 a | 71.1 d | 2.0 d | 368 d |
| Variant D | |||||||||
| Without post-heating | 1.76 c,C | 4.2 a,A | 5.7 a,A | 4.9 a,A | 513 a,B | 16.8 b,A | 3.9 a,B | 1.0 a,B | 107 a,A |
| 23 °C | 1.77 c | 4.3 a | 6.1 a | 6.3 a | 785 ab | 14.7 a | 7.7 a | 1.2 a | 174 ab |
| 38 °C | 1.60 b | 10.0 b | 17.3 b | 26.2 b | 1444 bc | 14.5 a | 27.2 b | 1.5 a | 257 b |
| 45 °C | 1.43 a | 17.0 c | 28.9 c | 43.7 c | 2306 cd | 14.3 a | 55.9 c | 2.2 b | 371 c |
| 54 °C | 1.38 a | 32.4 d | 66.9 d | 116.0 d | 2501 d | 14.8 a | 72.7 c | 2.3 b | 396 c |
| Upstream Milk Heating | Downstream Pre-Concentration Heating | ||||
|---|---|---|---|---|---|
| (With → Without) | (Without) | ||||
| Parameter | Without Post-Heating | With Post-Heating | Without Post-Heating | With Post-Heating | |
Process Variants C → B → A | Process Variants A, B, and C 6 → 54 °C | Process Variants C → D | Process Variant D 6 → 54 °C | ||
| Apparent refractive index | RIapp |  | |  | |
| Particle size | d50,3 |  |  | | |
| d75,3 | | | | | |
| Span | d90,3–d10,3 | | | | |
| Storage modulus |  |  | | | |
| Loss tangent |  |  | | | |
| Yield stress | | | | | |
| Apparent viscosity | | | | | |
| Energy loss | ΔE | | | | |
Publisher’s Note: MDPI stays neutral with regard to jurisdictional claims in published maps and institutional affiliations. |
© 2022 by the authors. Licensee MDPI, Basel, Switzerland. This article is an open access article distributed under the terms and conditions of the Creative Commons Attribution (CC BY) license (https://creativecommons.org/licenses/by/4.0/).
Share and Cite
Heck, A.; Nöbel, S.; Hitzmann, B.; Hinrichs, J. Tailoring the Textural Characteristics of Fat-Free Fermented Concentrated Milk-Protein Based Microgel Dispersions by Way of Upstream, Downstream and Post-Production Thermal Inputs. Foods 2022, 11, 635. https://doi.org/10.3390/foods11050635
Heck A, Nöbel S, Hitzmann B, Hinrichs J. Tailoring the Textural Characteristics of Fat-Free Fermented Concentrated Milk-Protein Based Microgel Dispersions by Way of Upstream, Downstream and Post-Production Thermal Inputs. Foods. 2022; 11(5):635. https://doi.org/10.3390/foods11050635
Chicago/Turabian StyleHeck, Anisa, Stefan Nöbel, Bernd Hitzmann, and Jörg Hinrichs. 2022. "Tailoring the Textural Characteristics of Fat-Free Fermented Concentrated Milk-Protein Based Microgel Dispersions by Way of Upstream, Downstream and Post-Production Thermal Inputs" Foods 11, no. 5: 635. https://doi.org/10.3390/foods11050635