Article

A Novel Metabolite as a Hapten to Prepare Monoclonal Antibodies for Rapid Screening of Quinoxaline Drug Residues

1
National Reference Laboratory of Veterinary Drug Residues (HZAU), MOA Key Laboratory for the Detection of Veterinary Drug Residues in Foods, Huazhong Agricultural University, Wuhan 430070, China
2
Shenzhen Institute of Nutrition and Health, Huazhong Agricultural University, Shenzhen 518000, China
3
Shenzhen Branch, Guangdong Laboratory for Lingnan Modern Agriculture, Agricultural Genomics Institute at Shenzhen, Chinese Academy of Agricultural Sciences, Shenzhen 518000, China
4
Genome Analysis Laboratory of the Ministry of Agriculture, Agricultural Genomics Institute at Shenzhen, Chinese Academy of Agricultural Sciences, Shenzhen 518000, China
*
Author to whom correspondence should be addressed.
These authors contributed equally to this work.
Foods 2022, 11(20), 3305; https://doi.org/10.3390/foods11203305
Submission received: 20 August 2022 / Revised: 7 October 2022 / Accepted: 19 October 2022 / Published: 21 October 2022
(This article belongs to the Special Issue Food Contaminant Components: Source, Detection, Toxicity and Removal)

Abstract

:
Quinoxalines (Qx) are chemically synthesized antibacterial drugs with strong antibacterial and growth-promoting effects. Qx is heavily abused by farmers, resulting in large residues in animal-derived foods, which pose a serious threat to human health. Desoxyquinoxalines (DQx), which have the highest residue levels, have been identified as the major toxicant and have become a new generation of residue markers. In this study, we prepared monoclonal antibodies (mAb) based on a new generation metabolite (desoxymequindox, DMEQ) and establish an indirect competitive enzyme-linked immunosorbent assay (ic-ELISA) for the rapid determination of Qx residues in food. The mAb exhibited high sensitivity with half maximal inhibitory concentration (IC50) and a linear range of 2.84 µg/L and 0.8–12.8 µg/L, respectively. Additionally, the cross-reactivity (CR) of the mAb showed that it recognized multiple DQx to varying levels. The limits of detection (LOD), limits of quantification (LOQ), and recoveries for the ic-ELISA assay of pork, swine liver, swine kidney, chicken, and chicken liver were 0.48–0.58 µg/kg, 0.61–0.90 µg/kg, and 73.7–107.8%, respectively, and the coefficients of variation (CV) were less than 11%. The results of the ic-ELISA showed a good correlation with LC–MS/MS in animal-derived foods. This suggests that this analytical method can be used for the rapid screening of QX residues.

1. Introduction

Quinoxalines (Qx) are chemically synthesized antibacterial drugs that have a strong inhibitory effect on both gram-positive and gram-negative bacteria [1,2]. Due to the broad antimicrobial spectrum and obvious growth-promoting effects, Qx are used in excessive amounts by farmers as feed additives to obtain more economic benefits [3]. However, several studies have shown that Qx can cause toxic side effects such as trichothecation, photosensitivity, and adrenal cortical damage in livestock and poultry. More seriously, drug residues in animal-derived foods can pose a significant threat to the population directly consuming them [4,5,6]. According to the latest reports, the quinoxalines desoxymetabolites (desoxyquinoxalines, DQx) have the highest residues and have been identified as major toxicants. They will soon replace 3-methyl-quinoxaline-2-carboxylic acid (MQCA) and quinoxaline-2-carboxylic acid (QCA) as the new residue markers for Qx [1,7,8]. The chemical structures of Qx and the major DQx are shown in Figure 1. The Ministry of Agriculture and Rural Affairs of the People’s Republic of China has stated that olaquindox (OLA), carbadox (CBX), and mequindox (MEQ) have been banned for use in food animals, and the requirements for residue detection of quinoxalines have been increasing. In order to accurately monitor the residual hazards of Qx in animals and reduce the risk to human health, there is a need to develop a residue-monitoring method for DQx.
Currently, many detection assays have been reported but mainly for Qx prototypes or MQCA and QCA, which were previously identified as residue markers. Additionally, the detection of QX is mainly focused on instrumental detection assays, such as high-performance liquid chromatography (HPLC) [9,10] and liquid-chromatography tandem mass spectrometry (LC–MS/MS) [11,12]. Though the instrument-detection method has high sensitivity and precision, it requires rather expensive instruments, complicated technology, a long operation time, and low detection efficiency. In contrast, immunoassay methods, such as enzyme-linked immunosorbent assay (ELISA), are simple, convenient, sensitive, specific and inexpensive. ELISA has become an alternative analytical method or a meaningful complement, especially in the detection of large numbers of samples [13,14]. Current indirect competitive ELISAs (ic-ELISA) are all for Qx prototypes, MQCA, or QCA [15,16]. To the best of our knowledge, immunoassay assays for the residue detection of DQx have not been previously reported. The maximum residue limits (MRLs) for DQx are not legally standardized, leading to potential gaps in food safety. Therefore, it is important to develop a rapid and accurate detection method for DQx.
In this study, we propose to synthesize novel haptens against desoxymequindox (DMEQ) to fully expose the main part of DQx. The aim is to prepare monoclonal antibodies (mAb) against DQx and establish an ic-ELISA method to provide strong technical support for ensuring the food safety of animal origin and reducing the risk to human health.

2. Materials and Methods

2.1. Chemicals and Apparatus

Quinocetone (QCT), OLA, MEQ, CBX, cyadox (CYX), DMEQ, desoxyolaquindox (DOLA), desoxyquinocatone (DQCT), desoxycarbadox (DCBX), desoxycyadox (DCYX), N1-desoxycyadox (N1-DCYX), N4-desoxycyadox (N4-DCYX), MQCA, and QCA were purchased from Sigma (USA). N-acetylsulfanilyl chloride, p-aminobenzoic acid (PABA), carboxymethyl hydroxylamine (AOAA), N-hydroxysuccinimide, pyridine, bovine serumalbumin (BSA), human serum albumin (HSA), dimethyl sulfoxide (DMSO), ovalbumin (OVA), polyethylene glycol (PEG), hypoxanthine–aminopterin–thymidine (HAT) medium, hypoxanthine–thymidine (HT) medium, and peroxidase-labelled goat anti-mouse immunoglobulins (HRP-IgG) were purchased from Sigma-Aldrich (USA). Australian fetal bovine serum was purchased from Thermo Fisher Bioengineering Materials (Beijing, China). The SP2/0 mouse-tumor cell line was obtained from our laboratory. All other chemicals and organic solvents were of analytical grade or better. Female Balb/c mice (6–8 weeks old, NO. 42000600000485) were bought from Three Gorges University (Yichang, China) and quality-tested by the Hubei Provincial Center for Disease Control and Prevention (Wuhan, China).
A full-wavelength microplate reader (BioTek, Winooski, VT, USA) and a UV spectrophotometer (Model 8453) were purchased from Agilent Technologies, Inc. (Santa Clara, CA, USA).

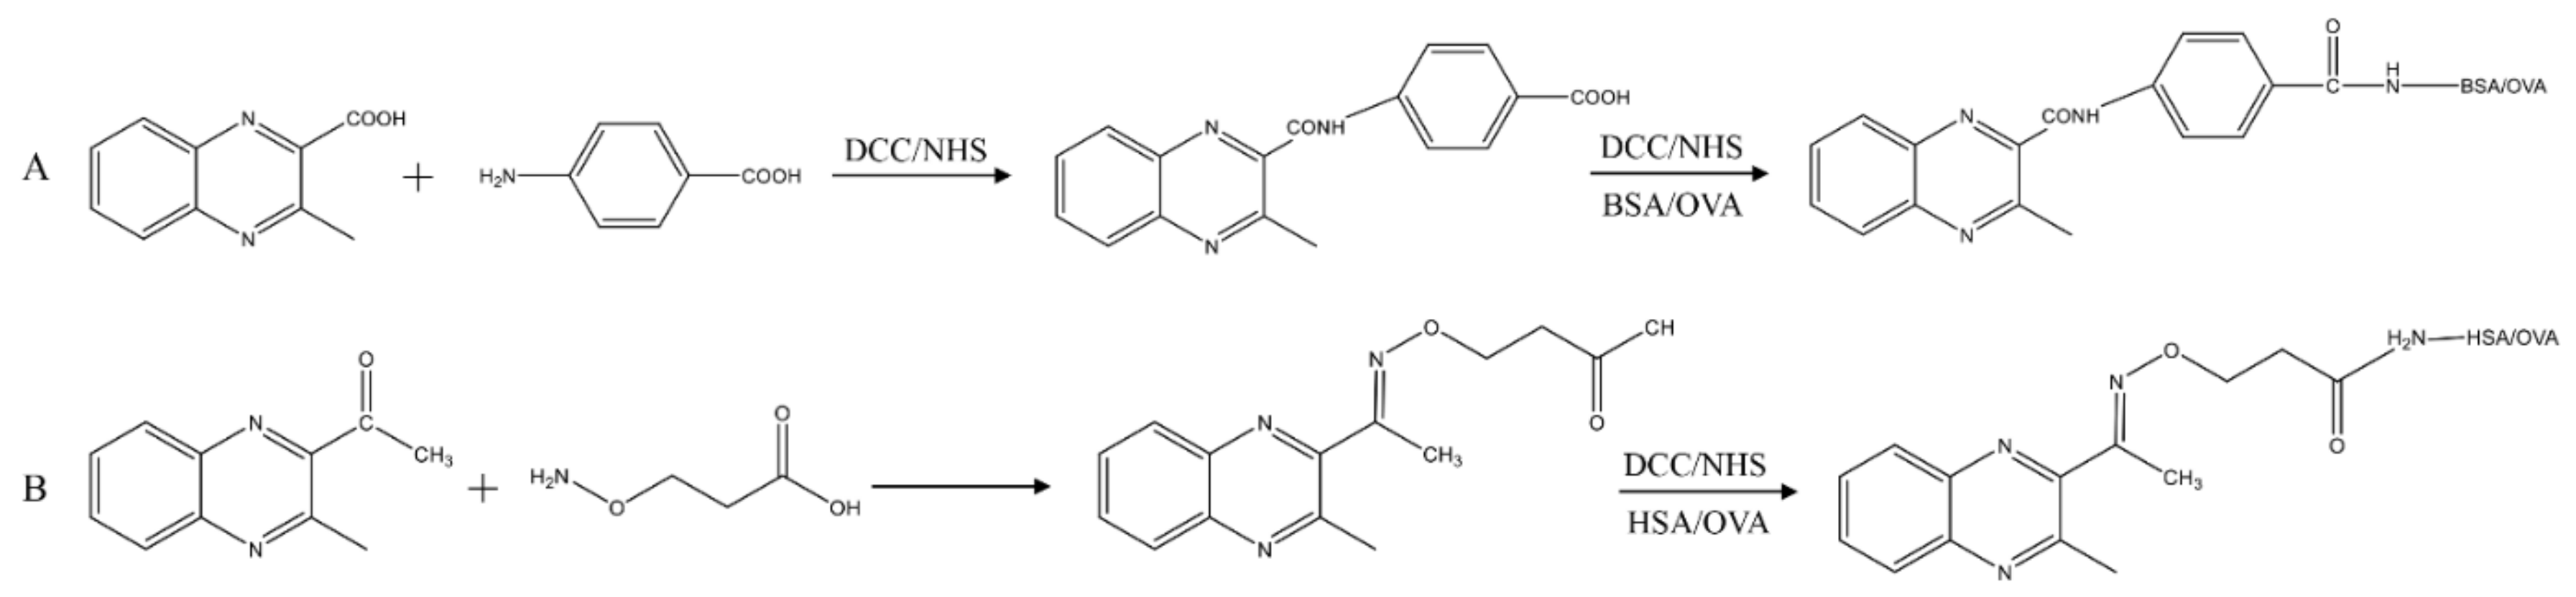
2.2. Antigen Design and Preparation

2.2.1. Synthesis of Antigens MQCA–PABA–BSA/OVA

The synthesis protocol of MQCA–PABA–BSA/OVA is shown in Figure 2A. Briefly, MQCA (90.0 mg), dicyclohexylcarbodiimide (DCC, 110.0 mg), and N-hydroxysuccinimide (NHS, 55.0 mg) were dissolved with 1.2 mL of N, N-dimethylformamide (DMF), and the mixture was stirred at 4 °C overnight. After removing the precipitate by centrifugation at 6000× g, the supernatant was obtained, PABA (68.0 mg) was added, and the reaction was continued for 24 h with stirring. After centrifugation, the supernatant was collected and the solution became turbid after adding distilled water (10 mL). The precipitate obtained by filtering through filter paper is MQCA–PABA.
Then, MQCA–PABA (30.0 mg), NHS (15.0 mg), and DCC (20.2 mg) were dissolved with 1.0 mL of DMF, and the mixture was stirred at 4 °C overnight. After centrifugation, the supernatant was added slowly with precipitate to the solution of 15 mL phosphate-buffered saline (PBS, 0.01 mol/L, pH 7.4) containing 66.0 mg BSA. The mixture was stirred for 24 h at 4 °C and then dialyzed in PBS for 5 d, and the dialysate was changed every 8 h. The dialyzed sample (MQCA–PABA–BSA) was collected and stored at −20 °C until use. The same principle can be followed to obtain MQCA–PABA–OVA.

2.2.2. Synthesis of Antigens DMEQ–AOAA–HSA/OVA

As shown in Figure 2B, AOAA (130.0 mg) was added to 6 mL of pyridine containing DMEQ (200.0 mg) and reacted at 60 °C for 6–8 h. Then, the pyridine was removed with a rotary evaporator, and 20 mL of saturated sodium bicarbonate solution and 50 mL of ethyl acetate were added. After shaking well, the aqueous layer was adjusted to pH 3 with hydrochloric acid and extracted twice with ethyl acetate. Finally, it was dried with anhydrous magnesium sulfate, and the filtrate was evaporated after filtration to obtain the solid: DMEQ–AOAA. The hapten was conjugated to the carrier protein in the same way as above, except that BSA was replaced with HSA. The haptens, carrier proteins, and conjugates were scanned under a UV spectrophotometer (200–400 nm) to determine the state of conjugation and to record the corresponding maximum absorption wavelength and absorption values. The relevant absorbance coefficient (K) was calculated from K = A/CL, and the conjugation ratio was calculated from [K(conjugation) − K(carrier protein)]/K(hapten).

2.3. Preparation of mAb

The preparation of mAb was performed according to that described in our laboratory by Peng et al. [17]. Briefly, sixteen female Balb/C mice were randomly divided into four groups for culture. Two immunogens (MQCA–PABA–BSA and DMEQ–AOAA–HSA) were immunized at a dose of 50 and 100 µg each. Then, serum titers and specificity were monitored by conventional ELISA procedures using MQCA–PABA–OVA and DMEQ–AOAA–OVA as homologous and heterologous coating antigens, respectively [18]. The mice with the best titer and specificity were selected to obtain splenocytes in vitro and fused with mouse myeloma cells. Under screening by the ELISA method, positive monoclonal cell lines were obtained after subcloning the fused cells using the limited dilution method 3–5 times. Finally, mAb was prepared by ascites induction, purified using protein A affinity chromatography, and stored at −20 °C until use.

2.4. Development of ic-ELISA Analysis

First, the purified antibody was titrated with different coating antigens in a square matrix to find the best concentration so that the sensitivity of the ic-ELISA assay would be the highest [19]. Then, the gradient standard solutions of DMEQ (0.8, 1.6, 3.2, 6.4, and 12.8 μg/L) were analyzed by ic-ELISA using the optimal concentrations optimized as above. The absorbance values obtained (OD450nm) were plotted against the corresponding concentrations in a standard calibration curve, and the concentration of DMEQ that produced half inhibition (IC50 value) was obtained from the results.
The extent of cross-reactivity (CR) of this mAb to different drugs was calculated by measuring the IC50 values of different structural analogs. Five DQx (DMEQ, DOLA, DQCT, DCYX, and DCBX) and six structural analogs (N1-DCYX, N4-DCYX, MQCA, MQCA–PABA, MEQ, and QCA) were used to determine the CR of the mAb. The IC50 values of all compounds were determined from the measured OD450nm with the standard curve, and based on the IC50 values, the CR was calculated as follows:
CR (%) = [IC50 (standard drug)/IC50 (analogues)] × 100%

2.5. Validation of ic-ELISA Analysis

Tissue samples of pork, swine liver, swine kidney, chicken, and chicken liver were purchased from local supermarkets. The homogenized samples (1 ± 0.05 g) were weighed, and 12 mL of extractant (ethyl acetate: acetonitrile = 1:1) was added to them. The mixture was mixed thoroughly for 3 min and then centrifuged at 4000× g for 10 min at room temperature. The organic phase was pipetted, and 2 mL of the aqueous NaOH solution (0.5 mol/L) was added. After shaking for 5 min, all organic phases were blown dry under nitrogen at 40 °C in a water bath. Then, the residue was resuspended with 1 mL of the compound solution (PBS: methanol = 9:1) and diluted 16 times with PBS to be ready for ic-ELISA analysis.
The sensitivity of the ic-ELISA analysis for practical applications is determined by the detection of the actual samples. Twenty different blank samples (pork, swine liver, swine kidney, chicken, and chicken liver) that were confirmed to be free of drug residues by LC–MS/MS were performed to ic-ELISA analysis. The mean (C) of the concentrations and the standard deviation (SD) were calculated for all blank samples. The limit of detection (LOD) and limit of quantification (LOQ) of this ic-ELISA method were calculated according to LOD = C + 3 × SD and LOQ = C + 10 × SD.
To demonstrate the accuracy and precision of the ic-ELISA analysis, the recovery rate and coefficient of variation (CV) were evaluated as indicators. DMEQ standard solutions were added to different types of homogenized samples at final concentrations of 1 × LOQ, 2 × LOQ, and 4 × LOQ, with 5 replicates of each concentration. The samples were mixed well by vortexing and left to stand for 1 h to allow full absorption of the drug, followed by sample pretreatment and ic-ELSIA analysis. The calculating equation is as follows:
recovery = (actual concentration/spiked concentration) × 100%. CV = (SD/C) × 100%
To confirm the reliability of the developed ic-ELISA method, four spiked chicken samples were selected for comparison using ic-ELISA analysis and LC–MS/MS. The detailed procedures for LC–MS/MS analysis and sample preparation were performed according to the previous description [20]. Briefly, 10 mL of methanol-water (v/v, 5:95) and 20 mg of N-propyl ethylenediamine were added to the homogenized samples. They were vortexed for 1 min and then centrifuged at 15,000× g for 10 min, and the supernatant was collected and filtered through a 0.22 μm membrane. A Thermo Hypersil Gold column (150 × 2.1 mm i.d., 5.0 μm) was used for LC–MS/MS analysis, and water-formic acid (v/v, 100:0.1) and acetonitrile were used for the mobile phases. For the analysis of spiked chicken samples by ic-ELISA and LC–MS/MS, correlation fitting curves were drawn to assess the correlation between the two methods.

3. Results and Discussion

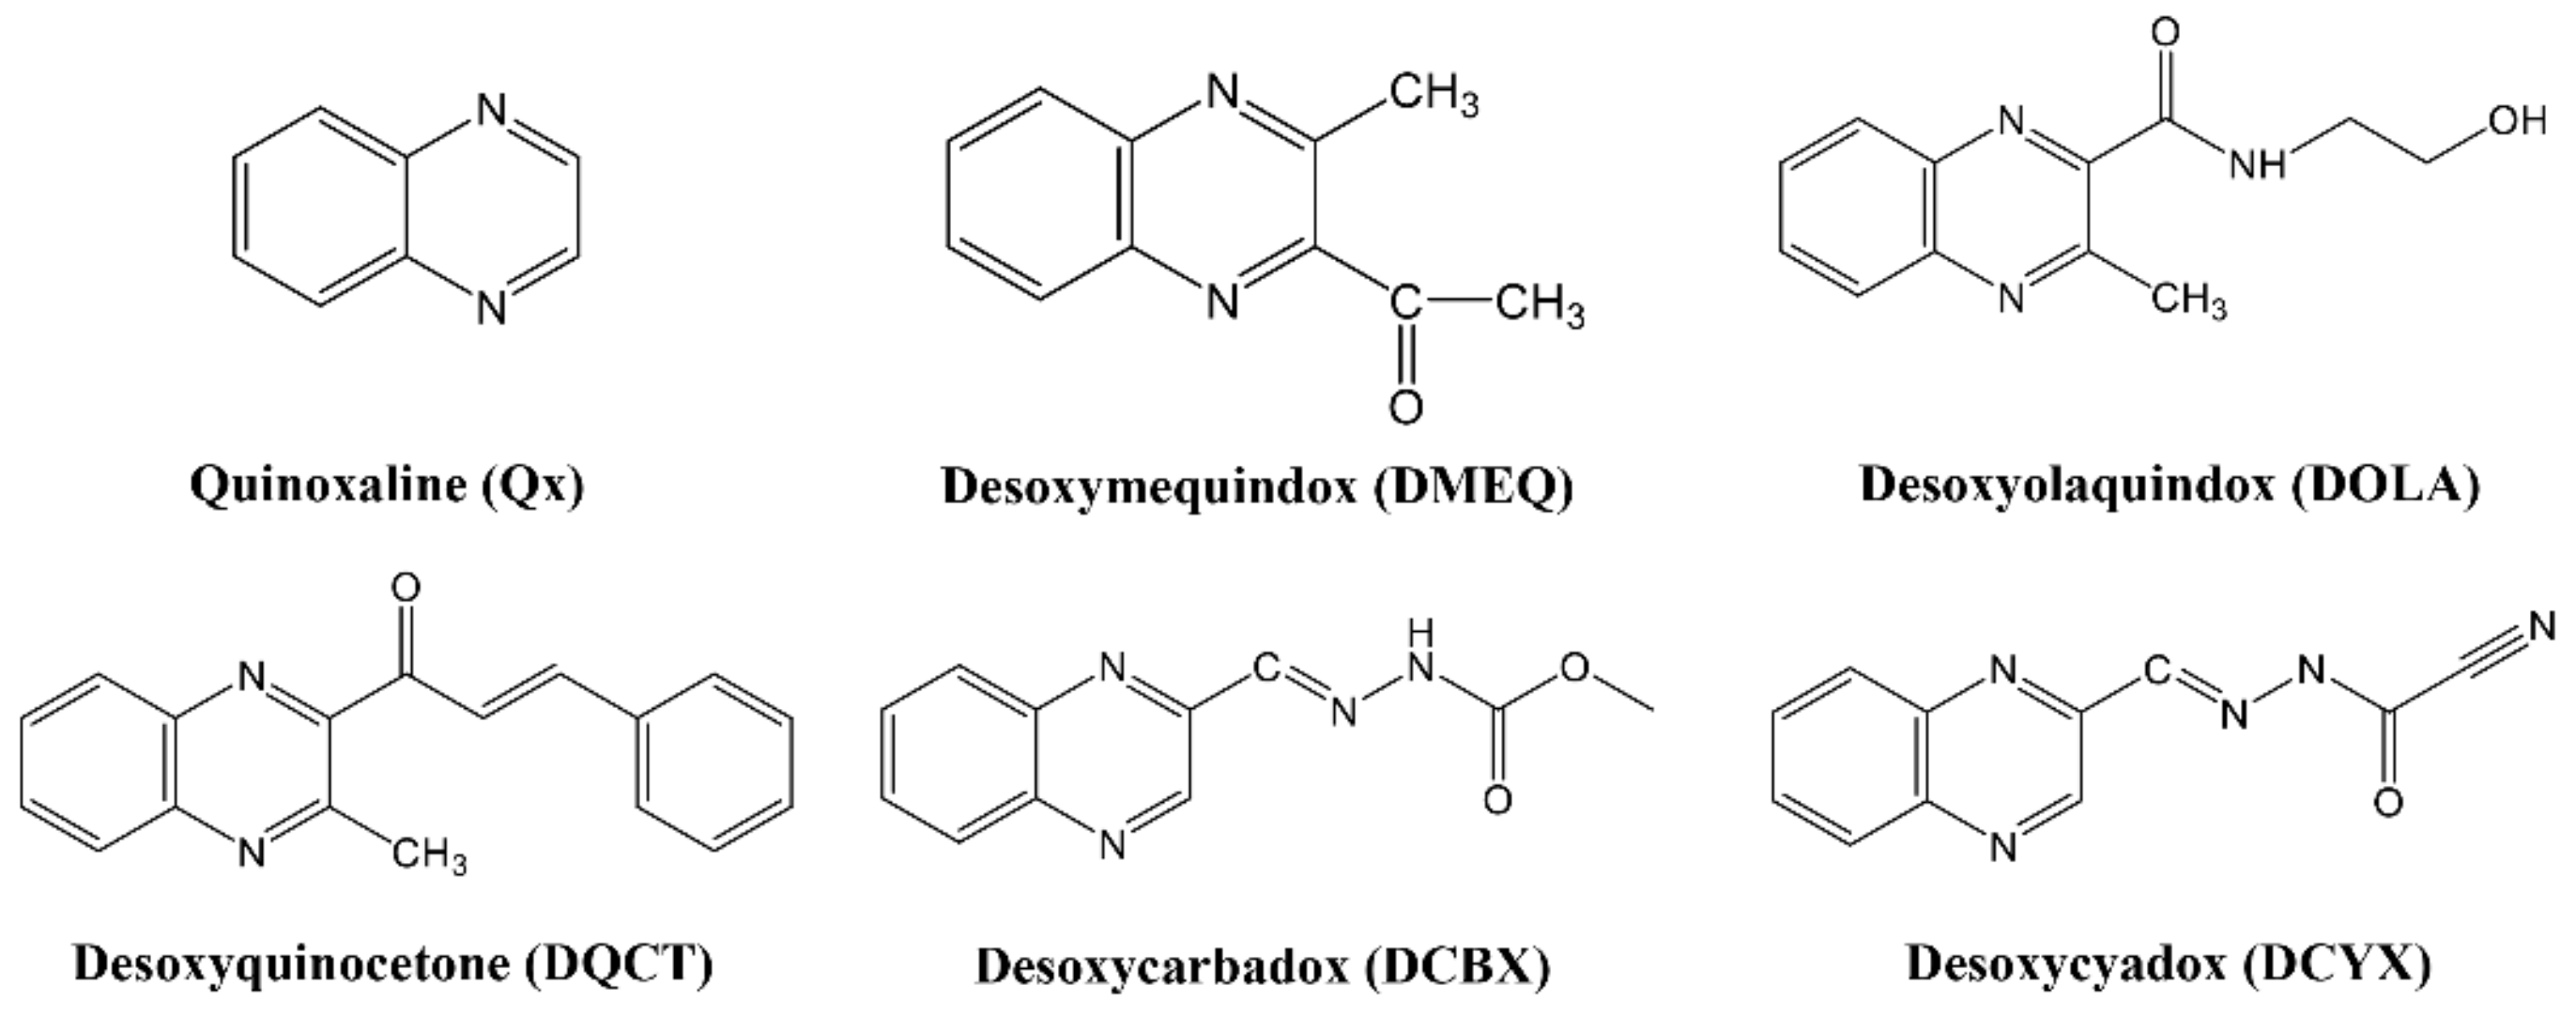
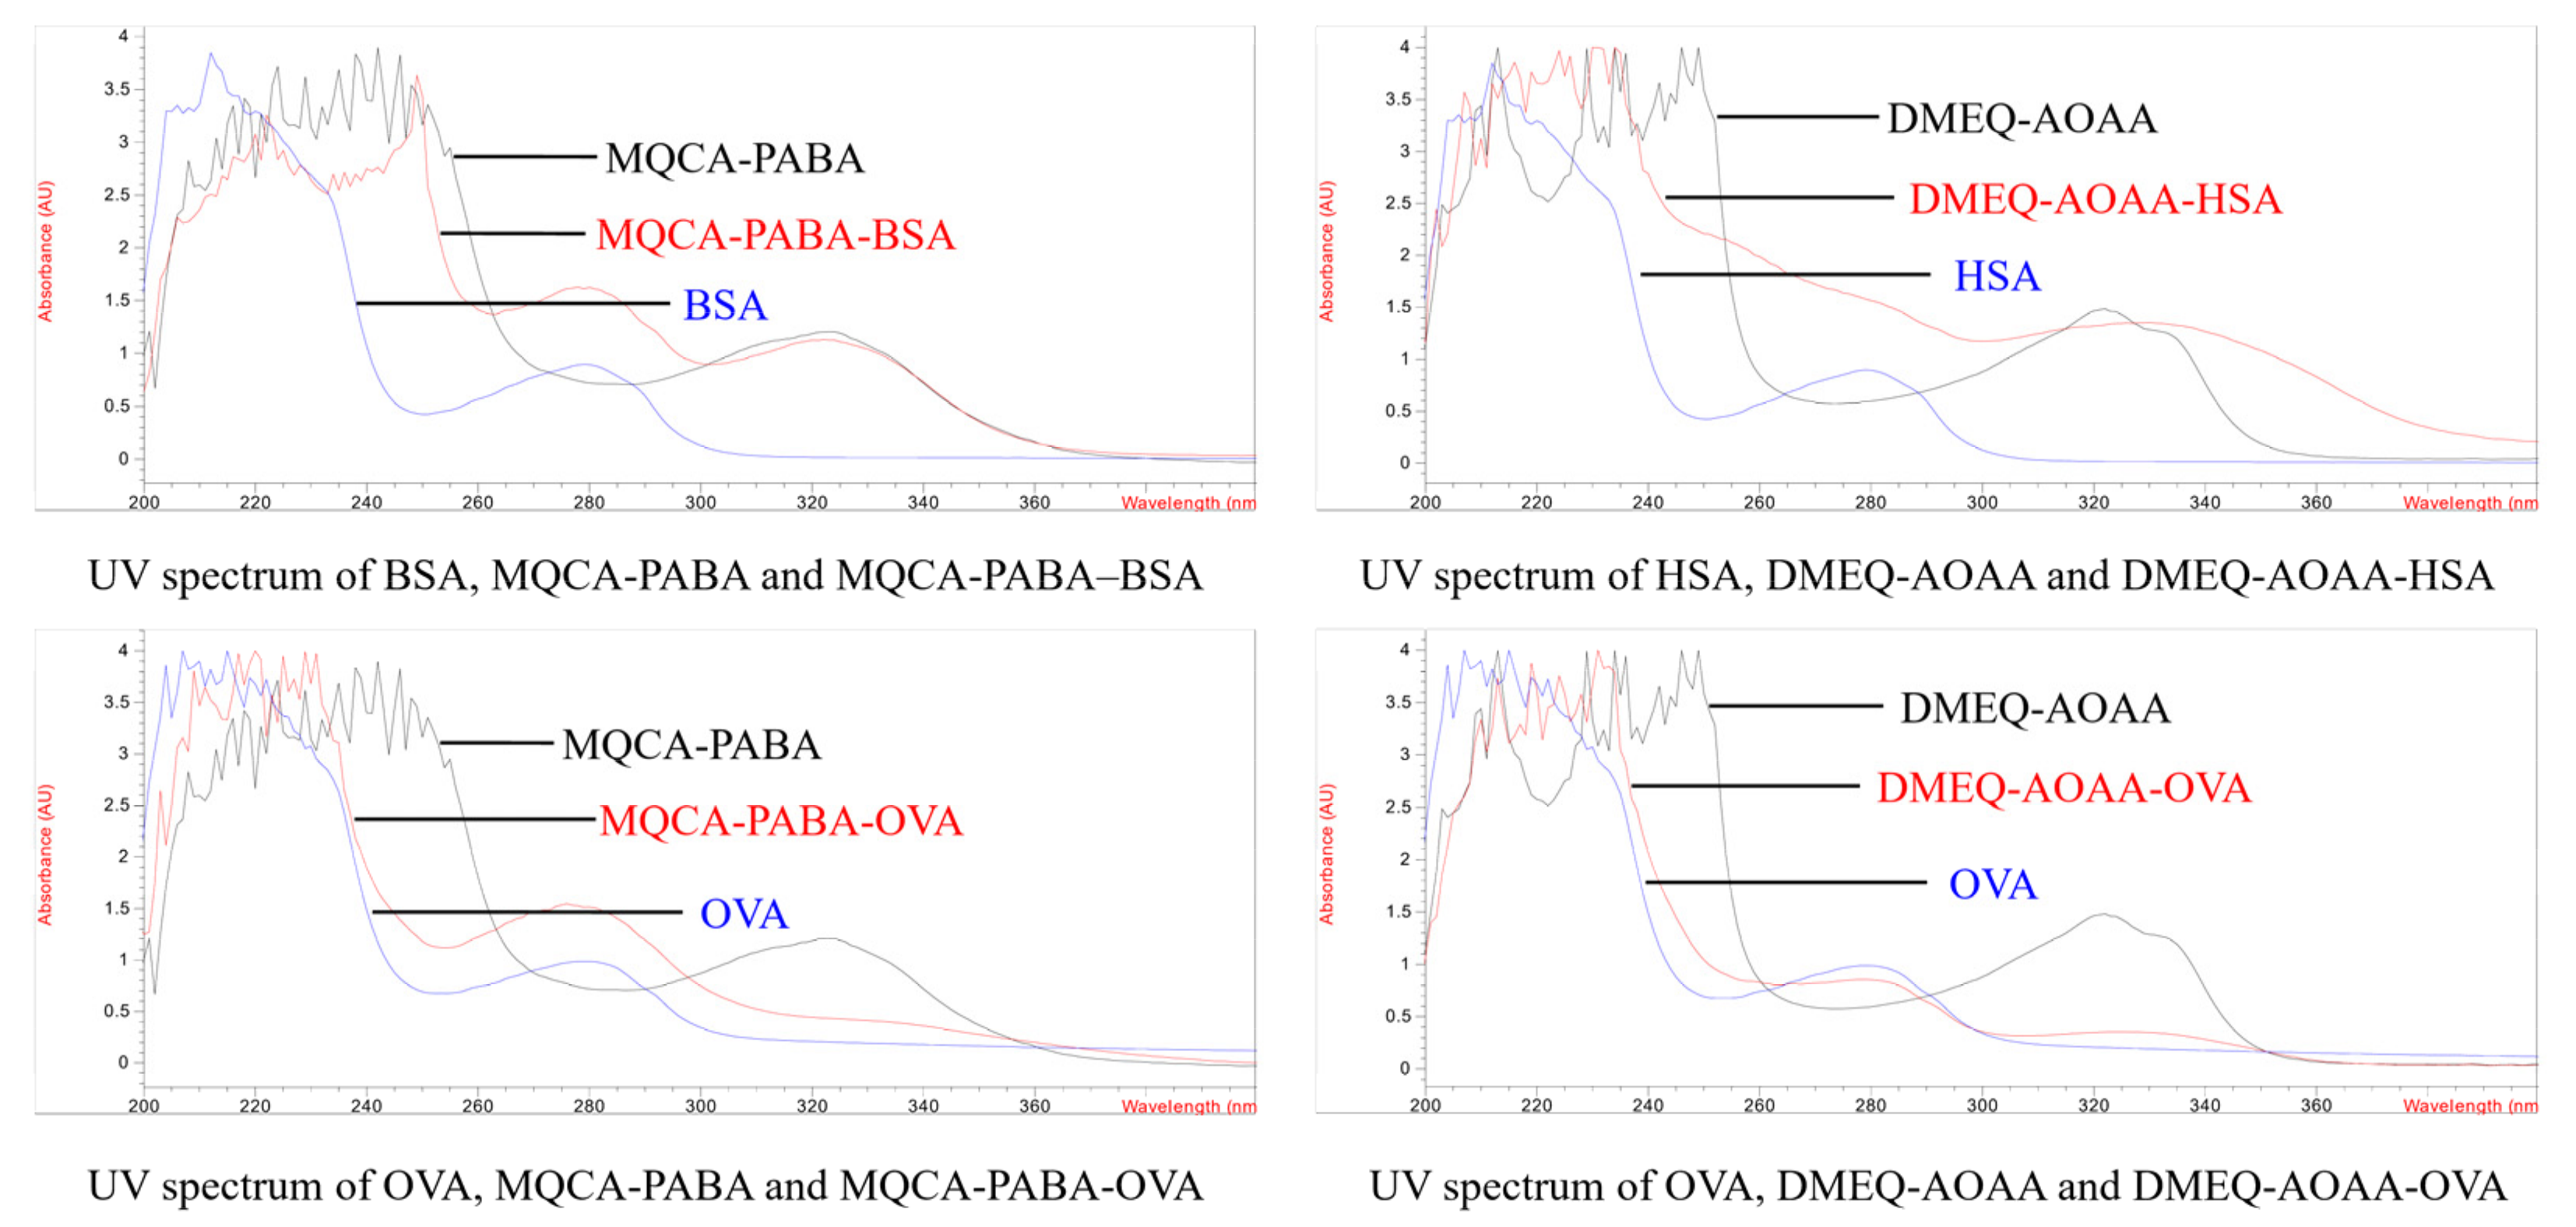
3.1. Antigen Design and Characterization

In this study, quinoxaline haptens were designed with MQCA and DMEQ as the precursor substances and PABA and AOAA as the arms, respectively. The chemical structure of the precursor substances fully exposes the common structure of DQx and also carries reactive groups to facilitate the synthesis of hapten. Thus, the mAb prepared from such an immunogen could maximize the simultaneous recognition of multiple DQx. The haptens of MQCA–PABA and DMEQ–AOAA are small molecules that do not induce an immune response in the body and need to be conjugated with large proteins to be immunogenic. The prepared hapten was used as the basis for the synthesis of the conjugated product by the NHS active ester method. With the free carboxylic group, MQCA–PABA and DMEQ–AOAA were individually linked to proteins [21,22]. BSA and OVA, which served as the most common candidates of carrier protein, were adopted for the assay.
The spectra of the hapten, carrier protein, and conjugates were scanned using a UV–Vis spectrophotometer. The ultraviolet absorbance spectra of MQCA–PABA–BSA (λmax, 279 nm, 324 nm), MQCA–PABA–OVA (λmax, 280 nm, 322 nm), DMEQ–AOAA–HSA (λmax, 321 nm), and DMEQ–AOAA–OVA (λmax, 281 nm) were different from the carrier protein of the BSA (λmax, 279 nm) and OVA (λmax, 279 nm), and from the haptens of MQCA–PABA (λmax, 322 nm) and DMEQ–AOAA (λmax, 321 nm), which confirmed that the antigens were successfully synthesized (Figure 3). The estimated conjugation ratios of MQCA–PABA–BSA, MQCA–PABA–OVA, DMEQ–AOAA–HSA, and DMEQ–AOAA–OVA were 16.9, 10.7,17.8, and 11.3, respectively, obtained from the absorbance calculation analysis.

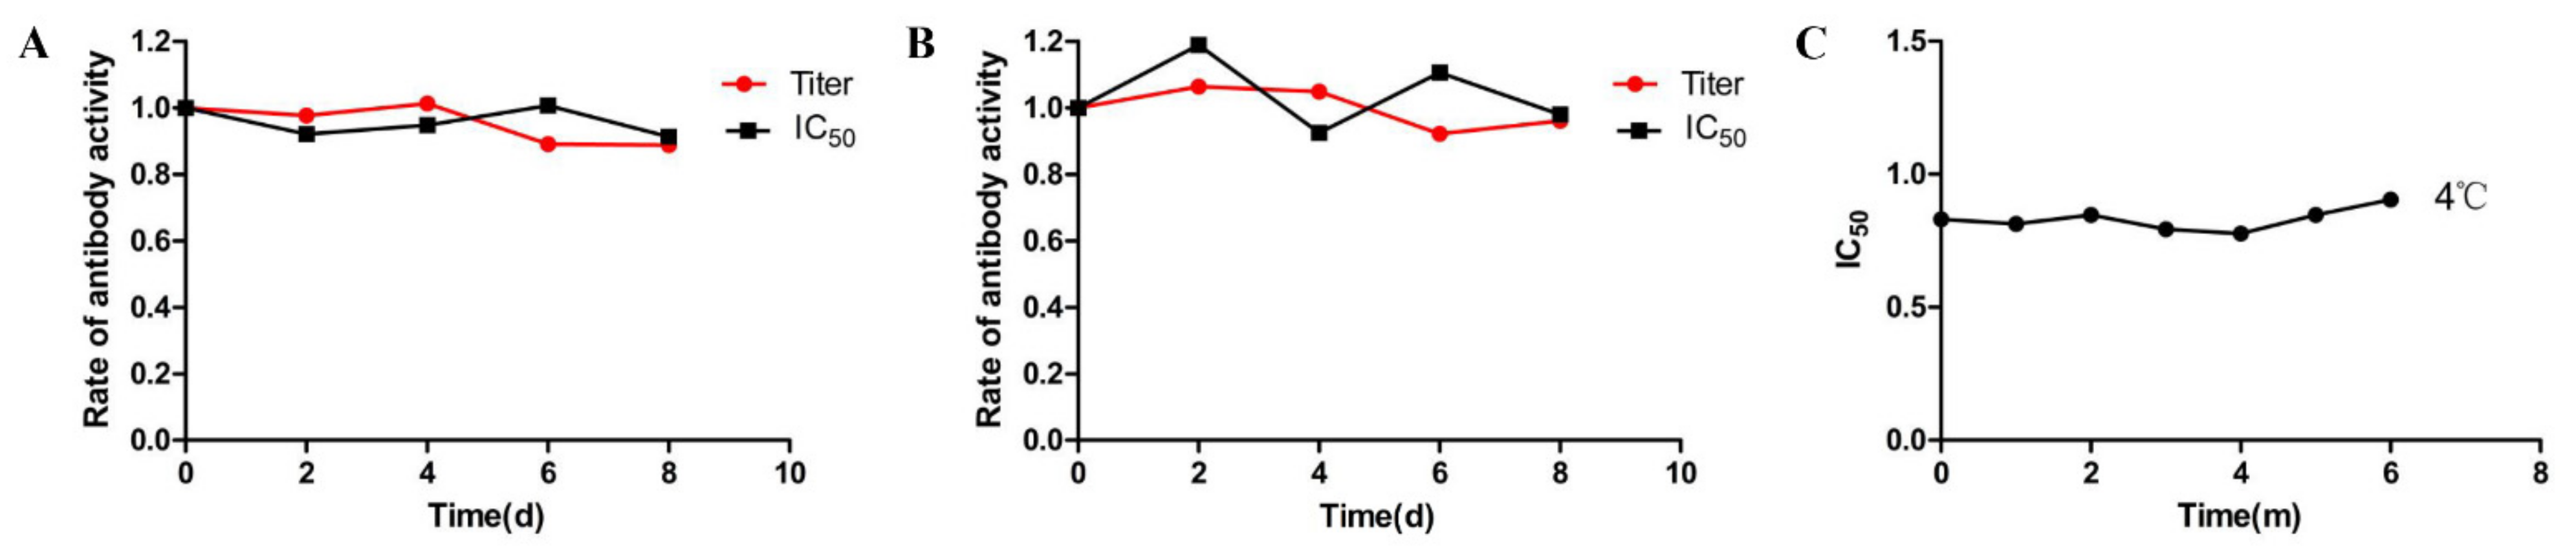
3.2. Characterization of mAb

The immunogens MQCA–PABA–BSA and DMEQ–AOAA–HSA were inoculated into mice to produce mAb. After the third injection, the specificity and titer of the immunized mouse antisera were determined using homologous and heterologous coatings, respectively (Table 1). The analysis in the table shows that DMEQ–AOAA–HSA showed poor specificity as an immunogen, both in homologous and heterologous coating. The immunogen MQCA–PABA–BSA with the coating antigen MQCA–PABA–OVA showed high titers but poor specificity against DMEQ. However, DMEQ–AOAA–OVA showed a better inhibition rate as a coating antigen for heterologous analysis. Therefore, splenocytes from mice immunized with MQCA–PABA–BSA were fused with myeloma cells. In the process of preparing an antibody, we similarly found that the heterologous coating antigen DMEQ–AOAA–OVA was more suitable for ic-ELISA than the homologous coating antigen MQCA–PABA–OVA. After multiple cell subcloning, a single strain of hybridoma cells 1A3 showed better recognition of DMEQ. Therefore, this cell line was selected for the production of monoclonal antibodies.
First, the obtained antibodies were optimized for the ic-ELISA conditions. The results showed that the ratio of 1:2000 mAb and 6.0 µg/mL of the coating antigen (DMEQ–AOAA–OVA) worked best, and the rest of the experiments were performed under this condition. As shown in Figure 4, the standard curve was fitted with the logarithmic value of DMEQ concentration as the X-axis and B/B0 as the Y-axis. The standard curve ranged from 0.8–12.8 µg/L, and the IC50 value was 2.84 µg/L based on the DMEQ standard solution. In Table 2, it can be seen that the CR of mAb showed varying levels of cross-reactivity to MQCA–PABA (44%), DOLA (27%), MQCA (2%), DQCT (1.3%), and QCA (1%) but showed no measurable CR (CR < 0.1%) with DCBX, DCYX, N1-DCYX, N4-DCYX, and MEQ.

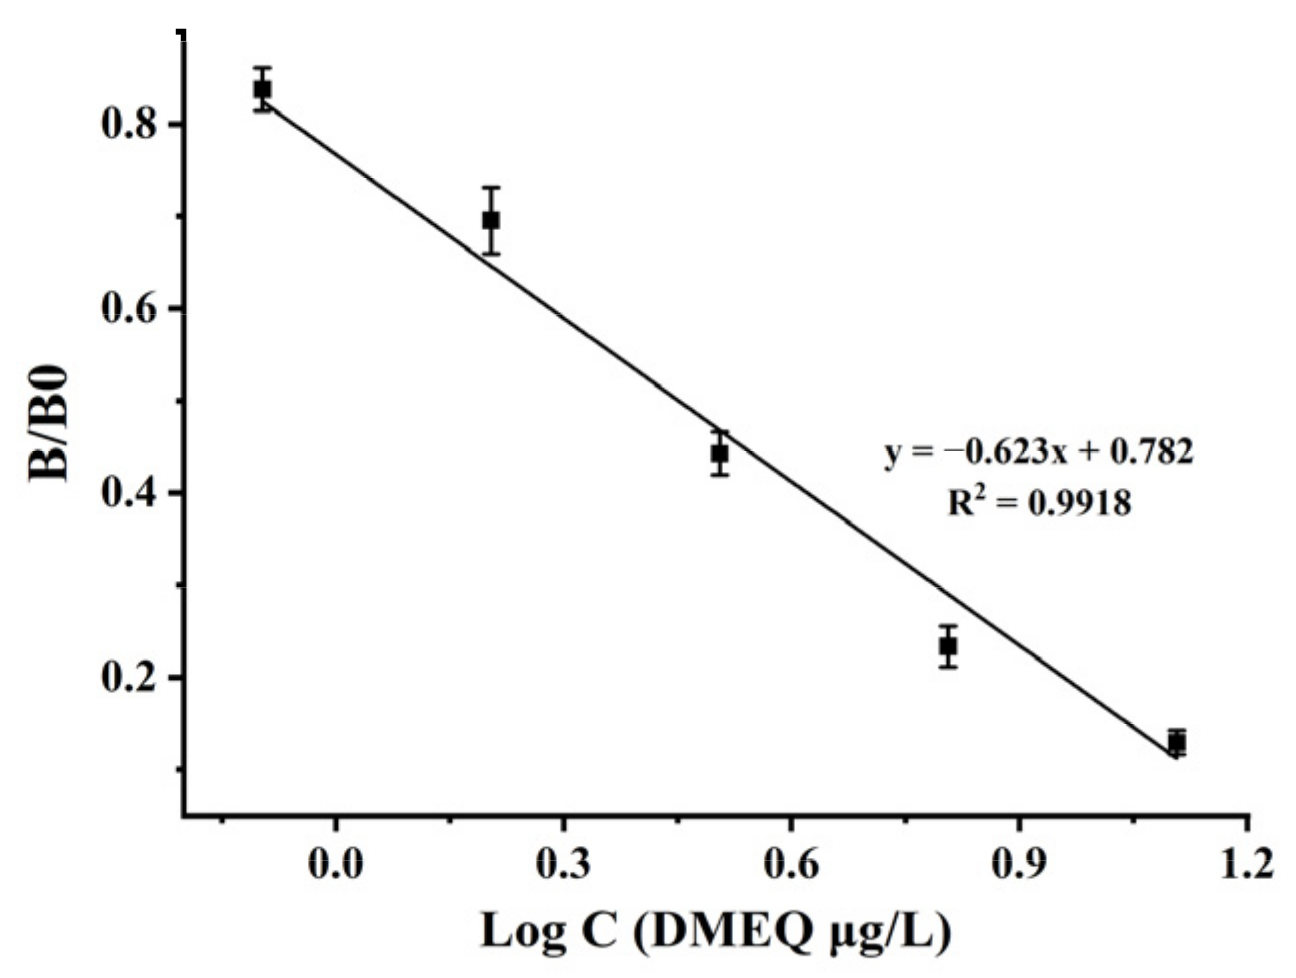
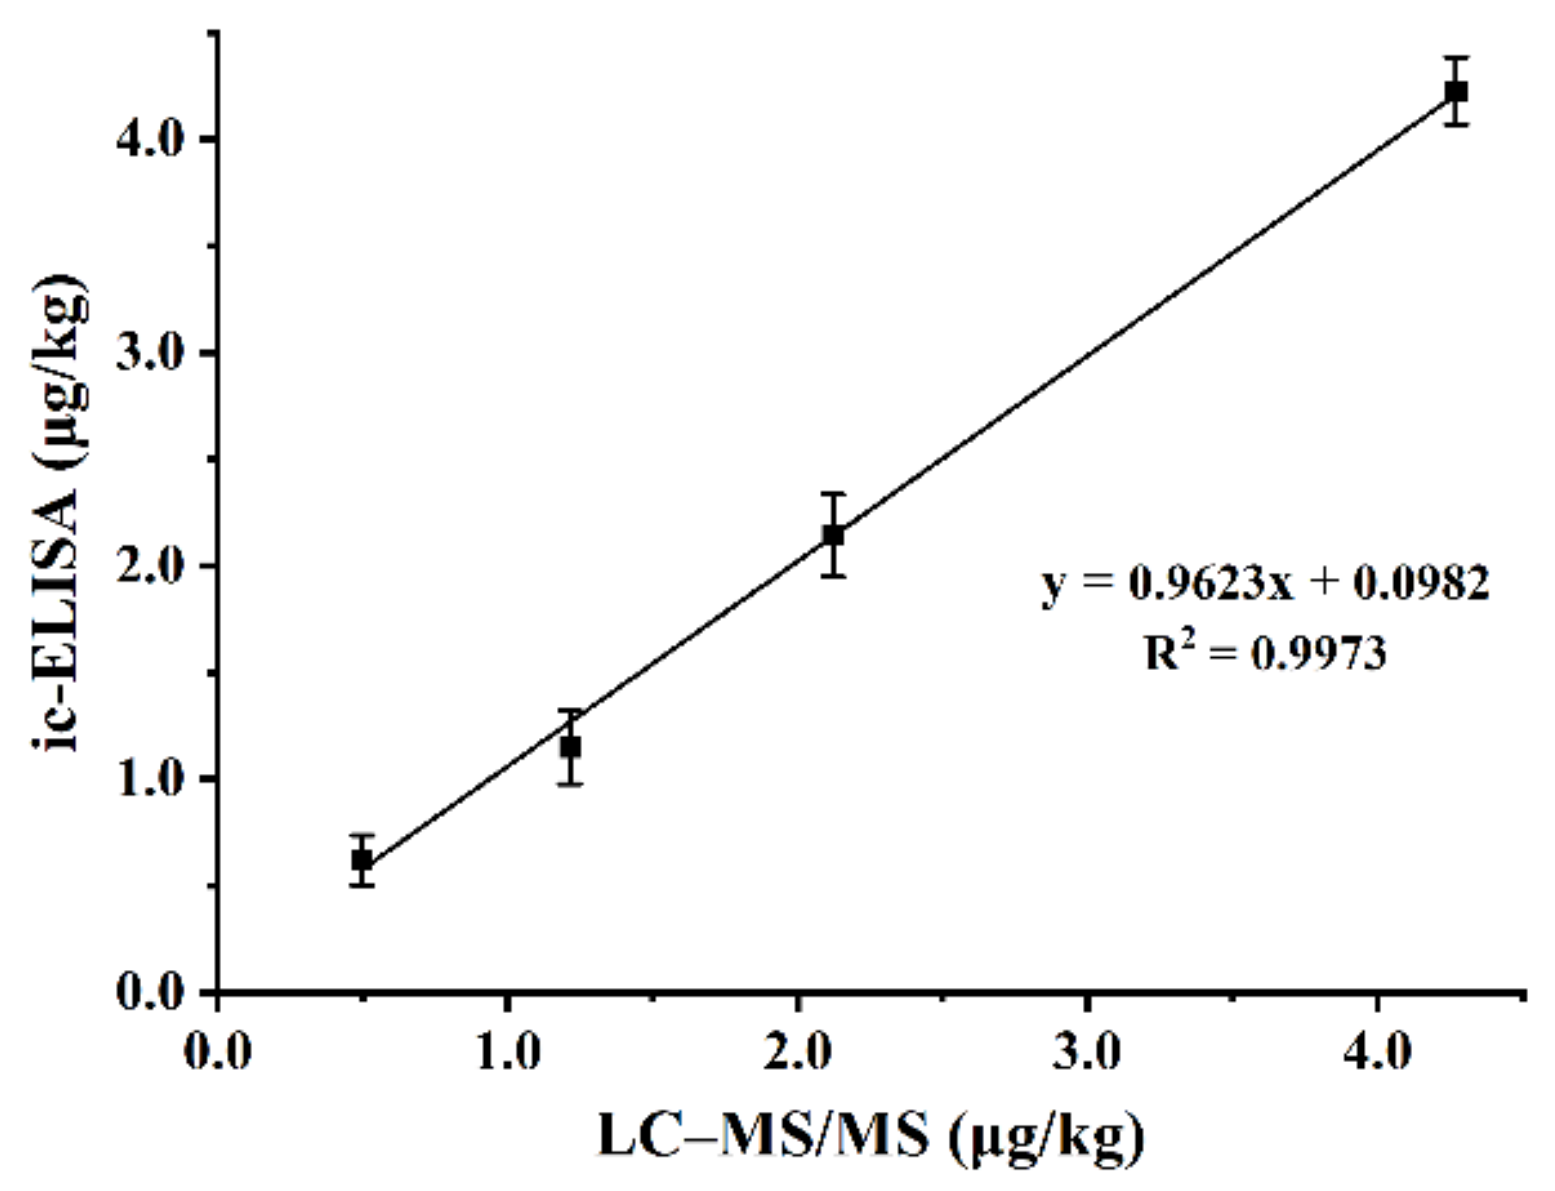
3.3. Performance of the ic-ELISA Analysis

Simple sample pretreatment will directly affect the analytical results of the ELISA. A large number of compounds in the sample matrix often have a strong interfering effect on the assay [19]. In previous studies, ethyl acetate was added to animal tissues for extraction and needed to be incubated for 2 h. After nitrogen blowing, it was degreased with hexane and diluted with PBS. Other studies showed that samples can be extracted by sodium hydroxide and acetonitrile, and diluted with diluent (methanol: PBS = 5:95) [23,24]. In this study, sodium hydroxide, ethyl acetate and acetonitrile were selected for the rapid extraction of DMEQ from the actual samples. This extraction method is faster and more efficient than previous methods.
To characterize the detection performance of the assay, we measured the LODs, LOQs, accuracy, and precision of the assay. Table 3 shows the results of 20 different blank samples, with the LODs and LOQs of samples ranging from 0.47–0.58 µg/kg and 0.61–0.90 µg/kg, respectively. The recoveries of the above samples spiked with DMEQ at the levels of 1 × LOQ, 2 × LOQ, and 4 × LOQ are listed in Table 3, which were in the range of 73.7% to 107.8%. The CVs were less than 10.8%, and we can find that the swine and chicken livers have the highest CVs. This is due to the different metabolic pathways of MEQ in different species and the differences in the enzymes involved [25,26]. All of the above results indicate that the analytical method developed in this study is highly sensitive, with good sample pretreatment and a low coefficient of variation.
In order to determine the stability of this method, a study was investigated to correlate the stability of the coating antigen, the antibodies, and the DMEQ standard used in the assay system. The coated enzyme plates and the prepared antibodies were placed in a 37 °C thermostat and taken out for ELISA validation on days 0, 2, 4, 6, and 8, respectively. The stability of the method was evaluated using the titer and the IC50 value of the analysis as evaluation criteria. The results in Figure 5A,B show that the titer of the enzyme plate and the antibody remained above 80%, and the IC50 fluctuated within 20% after 8 d of storage at 37 °C. According to the empirical Arrhenius equation, this implies that the enzyme plates and antibodies can be stored for at least 12 months at 4 °C. We also measured the IC50 of the standard concentration of DMEQ at 4 °C every month. The results showed that the standard solution of DMEQ can still be stored at 4 °C for at least 6 months and keep the IC50 stable (Figure 5C).
In addition, the reliability of the method was verified by analyzing the four spiked chicken samples (0.5, 1.0, 2.0, and 4.0 µg/kg) by ic-ELISA and LC–MS/MS, respectively. Figure 6 shows the fitted correlation coefficient (R2) of 0.9973 between this analytical method and the instrumental analysis results in chicken. This demonstrates the reliability of the established ic-ELISA method for DMEQ, which provides strong technical support for the monitoring of Qx drug residues in food.

4. Conclusions

In this study, we creatively synthesized a novel hapten to generate mAb against DQx. Based on the mAb, we firstly developed an ic-ELISA method to detect the residues of Qx in animal-derived foods, which was rapid, accurate, and sensitive. The simple analytical method reduces the sample pretreatment time, ensures higher efficiency, and meets the requirements for Qx residue analysis. The prepared mAb and the developed ic-ELISA method can monitor the residues of Qx in animal-derived foods to ensure food safety and human health.

Author Contributions

Conceptualization, J.X., W.S. and M.L.; methodology, H.L., W.S. and M.L.; software, J.X.; validation, J.X., W.S., M.L., J.L. and X.H.; formal analysis, W.S. and M.L.; investigation, W.S. and M.L.; data curation, W.S. and M.L.; writing—original draft preparation, W.S., J.X. and M.L.; writing—review and editing, J.X. and D.P.; visualization, W.S. and M.L.; supervision, D.P.; and funding acquisition, D.P. All authors have read and agreed to the published version of the manuscript.

Funding

The authors are grateful to the Hubei University Student Innovation and Entrepreneurship Training Program (S202110504022), the Fundamental Research Funds for the Central Universities (2662022DKPY007), and the HZAU-AGIS Cooperation Fund (SZYJY2022024).

Data Availability Statement

Data is contained within the article.

Conflicts of Interest

The authors declare no conflict of interest.

References

  1. Liu, Z.Y.; Huang, L.L.; Chen, D.M.; Yuan, Z.H. Metabolism of mequindox in liver microsomes of rats, chicken and pigs. Rapid Commun. Mass Spectrom. 2010, 24, 909–918. [Google Scholar] [CrossRef] [PubMed]
  2. Liu, Q.Y.; Lei, Z.X.; Gu, C.Q.; Guo, J.C.; Yu, H.R.; Fatima, Z.N.; Zhou, K.X.; Shabbir, M.A.B.; Maan, M.K.; Wu, Q.H.; et al. Mequindox induces apoptosis, DNA damage, and carcinogenicity in Wistar rats. Food Chem. Toxicol. 2019, 127, 270–279. [Google Scholar] [CrossRef]
  3. Liu, Q.Y.; Lei, Z.X.; Wu, Q.; Awais, I.; Shabbir, M.A.B.; Ahmed, S.; Fatima, Z.; Wang, X.; Pan, Y.H.; Xie, S.Y.; et al. The Reproductive Toxicity of Mequindox in a Two-Generation Study in Wistar Rats. Front. Pharmacol. 2018, 9, 870. [Google Scholar] [CrossRef] [PubMed]
  4. Ihsan, A.; Wang, X.; Liu, Z.Y.; Wang, Y.L.; Huang, X.J.; Liu, Y.; Yu, H.; Zhang, H.F.; Li, T.T.; Yang, C.H.; et al. Long-term mequindox treatment induced endocrine and reproductive toxicity via oxidative stress in male Wistar rats. Toxicol. Appl. Pharm. 2011, 252, 281–288. [Google Scholar] [CrossRef] [PubMed]
  5. Ihsan, A.; Wang, X.; Tu, H.G.; Zhang, W.; Dai, M.H.; Peng, D.P.; Wang, Y.L.; Huang, L.L.; Chen, D.M.; Mannan, S.; et al. Genotoxicity evaluation of Mequindox in different short-term tests. Food Chem. Toxicol. 2013, 51, 330–336. [Google Scholar] [CrossRef] [PubMed]
  6. Liu, Q.Y.; Lei, Z.X.; Wu, Q.; Huang, D.Y.; Xie, S.Y.; Wang, X.; Pan, Y.H.; Yuan, Z.H. Mequindox Induced Genotoxicity and Carcinogenicity in Mice. Front. Pharmacol. 2018, 9, 361. [Google Scholar] [CrossRef] [PubMed] [Green Version]
  7. Huang, L.L.; Yin, F.J.; Pan, Y.H.; Chen, D.M.; Li, J.; Wan, D.; Liu, Z.L.; Yuan, Z.H. Metabolism, Distribution, and Elimination of Mequindox in Pigs, Chickens, and Rats. J. Agric. Food Chem. 2015, 63, 9839–9849. [Google Scholar] [CrossRef]
  8. Tan, H.L.; Pan, Y.H.; Chen, D.M.; Tao, Y.F.; Zhou, K.X.; Liu, Z.L.; Yuan, Z.H.; Huang, L.L. Discovery of the Marker Residue of Olaquindox in Pigs, Broilers, and Carp. J. Agric. Food Chem. 2019, 67, 6603–6613. [Google Scholar] [CrossRef] [PubMed]
  9. Wu, Y.J.; Wang, Y.L.; Huang, L.; Tao, Y.F.; Yuan, Z.H.; Chen, D.M. Simultaneous determination of five quinoxaline-1,4-dioxides in animal feeds using ultrasonic solvent extraction and high-performance liquid chromatography. Anal. Chim. Acta 2006, 569, 97–102. [Google Scholar] [CrossRef]
  10. He, Q.Q.; Fang, B.H.; Su, Y.J.; Zeng, Z.L.; Yang, J.W.; He, L.M.; Zeng, D.P. Simultaneous determination of quinoxaline-1,4-dioxides in feeds using molecularly imprinted solid-phase extraction coupled with HPLC. J. Sep. Sci. 2013, 36, 301–310. [Google Scholar] [CrossRef]
  11. You, Y.L.; Song, L.T.; Li, Y.S.; Wu, Y.T.; Xin, M. Simple and Fast Extraction-Coupled UPLC-MS/MS Method for the Determination of Mequindox and Its Major Metabolites in Food Animal Tissues. J. Agric. Food Chem. 2016, 64, 2394–2404. [Google Scholar] [CrossRef]
  12. Li, Y.S.; Liu, K.L.; Beier, R.C.; Cao, X.Y.; Shen, J.Z.; Zhang, S.X. Simultaneous determination of mequindox, quinocetone, and their major metabolites in chicken and pork by UPLC-MS/MS. Food Chem. 2014, 160, 171–179. [Google Scholar] [CrossRef]
  13. Le, T.; Xu, J.; He, H.Q.; Niu, X.D.; Chen, Y.; Jia, Y.Y. Development and validation of an enzyme-linked immunosorbent assay for rapid detection of multi-residues of five quinoxaline-1,4-dioxides in animal feeds. Food Agric. Immunol. 2013, 24, 457–466. [Google Scholar] [CrossRef]
  14. Le, T.; Zhu, L.Q.; Shu, L.H.; Zhang, L. Simultaneous determination of five quinoxaline-1,4-dioxides in animal feeds using an immunochromatographic strip. Food Addit. Contam. A 2016, 33, 244–251. [Google Scholar] [CrossRef] [PubMed]
  15. Cheng, L.L.; Shen, J.Z.; Wang, Z.H.; Jiang, W.X.; Zhang, S.X. A sensitive and specific ELISA for determining a residue marker of three quinoxaline antibiotics in swine liver. Anal. Bioanal. Chem. 2013, 405, 2653–2659. [Google Scholar] [CrossRef] [PubMed]
  16. Cheng, L.L.; Shen, J.Z.; Wang, Z.H.; Zhang, Q.D.; Dong, X.Y.; Wu, C.; Zhang, S.X. Rapid Screening of Quinoxaline Antimicrobial Growth Promoters and Their Metabolites in Swine Liver by Indirect Competitive Enzyme-Linked Immunosorbent Assay. Food Anal. Method 2013, 6, 1583–1591. [Google Scholar] [CrossRef]
  17. Peng, D.P.; Wang, Y.L.; Feng, L.; Cao, G.C.; Tao, Y.F.; Liu, Z.L.; Yuan, Z.H. Preparation of Broadly Specific Monoclonal Antibodies for Simultaneous Determination of Fluoroquinolone Residues in Eggs. Food Anal. Method 2016, 9, 3520–3531. [Google Scholar] [CrossRef]
  18. Chen, X.J.; Li, Z.Z.; Guo, J.Y.; Li, D.M.; Gao, H.L.; Wang, Y.; Xu, C.L. Simultaneous screening for marbofloxacin and ofloxacin residues in animal-derived foods using an indirect competitive immunoassay. Food Agric. Immunol. 2017, 28, 489–499. [Google Scholar] [CrossRef] [Green Version]
  19. Peng, D.P.; Ye, S.Q.; Wang, Y.L.; Chen, D.M.; Tao, Y.F.; Huang, L.L.; Liu, Z.L.; Dai, M.H.; Wang, X.Q.; Yuan, Z.H. Development and Validation of an Indirect Competitive Enzyme-Linked Immunosorbent Assay for the Screening of Tylosin and Tilmicosin in Muscle, Liver, Milk, Honey and Eggs. J. Agric. Food Chem. 2012, 60, 44–51. [Google Scholar] [CrossRef]
  20. Yang, H.C.; He, L.M.; Liu, Y.H.; Bian, K.; Hu, F.Y.; Fang, B.H. Determination of Quinoxalines and Their Two Main Metabolites in Environmental Water Samples by Liquid Chromatography-Tandem Mass Spectrometry. Anal. Lett. 2014, 47, 1421–1433. [Google Scholar] [CrossRef]
  21. Lowry, O.H.; Rosebrough, N.J.; Farr, A.L.; Randall, R.J. Protein Measurement with the Folin Phenol Reagent. J. Biol. Chem. 1951, 193, 265–275. [Google Scholar] [CrossRef]
  22. Bradford, M.M. A rapid and sensitive method for the quantitation of microgram quantities of protein utilizing the principle of protein-dye binding. Anal. Biochem. 1976, 72, 248–254. [Google Scholar] [CrossRef]
  23. Han, X.Y.; Sheng, F.; Kong, D.X.; Wang, Y.L.; Pan, Y.H.; Chen, M.; Tao, Y.F.; Liu, Z.L.; Ahmed, S.; Yuan, Z.H.; et al. Broad-spectrum monoclonal antibody and a sensitive multi-residue indirect competitive enzyme-linked immunosorbent assay for the antibacterial synergists in samples of animal origin. Food Chem. 2019, 280, 20–26. [Google Scholar] [CrossRef] [PubMed]
  24. Sheng, W.; Zhang, B.; Zhao, Q.X.; Wang, S.; Zhang, Y. Preparation of a Broad-Spectrum Heterocyclic Aromatic Amines (HAAs) Antibody and Its Application in Detection of Eight HAAs in Heat Processed Meat. J. Agric. Food Chem. 2020, 68, 15501–15508. [Google Scholar] [CrossRef]
  25. Li, Y.; Li, L.X.; Shen, J.Z.; Zhang, S.X.; Feng, P.S.; Wu, H.X.; Wu, C.M. Comparative Metabolism of Mequindox in Liver Microsomes, Hepatocytes, and Intestinal Microflora of Chicken. Anal. Lett. 2012, 45, 1749–1763. [Google Scholar] [CrossRef]
  26. Liu, Q.Y.; Lei, Z.X.; Dai, M.H.; Wang, X.; Yuan, Z.H. Toxic metabolites, Sertoli cells and Y chromosome related genes are potentially linked to the reproductive toxicity induced by mequindox. Oncotarget 2017, 8, 87512–87528. [Google Scholar] [CrossRef] [PubMed]
Figure 1. The chemical structures of Qx and the major DQx.
Foods 11 03305 g001
Figure 2. The synthesis protocol of MQCA–PABA–BSA/OVA (A) and DMEQ–AOAA–HSA/OVA (B).
Foods 11 03305 g002
Figure 3. UV absorption peak spectra of 4 different antigens at 200–400 nm.
Foods 11 03305 g003
Figure 4. The standard curve of ic-ELISA.
Foods 11 03305 g004
Figure 5. Stability testing of DMEQ–AOAA–OVA coating antigen (A), antibody (B), and DMEQ standard solution (C).
Foods 11 03305 g005
Figure 6. Correlation of LC–MS/MS and ic-ELISA for the analysis of spiked chicken samples.
Foods 11 03305 g006
Table 1. The titer and specificity of the antiserum.
ImmunogenCoating
Antigen
Titre (1:X × 103)B/B0 1 Values (DMEQ, 100 μg/L)
Mouse 1Mouse 2Mouse 3Mouse 4Mouse 1Mouse 2Mouse 3Mouse 4
MQCA–PABA–BSAMQCA–PABA–OVA21.5123.50.8460.9650.8150.902
DMEQ–AOAA–OVA10.821.50.5160.4690.5680.766
DMEQ–AOAA–HSAMQCA–PABA–OVA231.81.50.8510.9210.9560.827
DMEQ–AOAA–OVA3.55430.7900.8730.8840.919
1 B is the absorbance value of DMEQ addition, and B0 is the absorbance value of PBS addition of equal amount.
Table 2. The cross-reactivity of mAb to different analytes.
CompetitorIC50 (µg/L)CR (%)
DMEQ2.84100
MQCA–PABA6.4544
DOLA10.5227
MQCA1422
DQCT2181.3
QCA2841
DCBX>1000<0.1
DCYX>1000<0.1
N1-DCYX>1000<0.1
N4-DCYX>1000<0.1
MEQ>1000<0.1
Table 3. LOD, LOQ, and CVs of the samples spiked with DMEQ.
SampleLOD (µg/kg)LOQ (µg/kg)Spiked Level
(μg/kg)
Recovery (%)CVintra-assay (%, n 1 = 3)Mean Recovery ± SD (%)CVinter-assay
(%, n 1 = 9)
Pork0.470.610.693.3–95.7<10.894.7 ± 1.21.3
1.287.5–101.8<9.794.3 ± 7.27.6
2.486.3–89.8<9.388.6 ± 2.02.3
Swine liver0.580.900.989.6–104.0<7.699.0 ± 8.28.2
1.889.0–97.9<10.194.4 ± 4.75.0
3.695.9–107.8<4.5100.6 ± 6.36.2
Swine kidney0.550.770.7580.8–86.1<8.982.9 ± 5.76.9
1.579.3–94.8<8.885.6 ± 8.810.3
3.073.7–80.8<6.078.2 ± 4.55.8
Chicken0.520.740.7582.4–99.5<8.389.2 ± 9.110.2
1.593.7–99.2<6.696.0 ± 2.93.0
3.081.3–89.5<7.885.1 ± 4.14.8
Chicken liver0.540.770.7593.9–99.7<5.197.2 ± 4.64.7
1.576.4–82.9<2.779.3 ± 3.24.0
3.091.2–101.1<8.297.0 ± 7.57.7
1n” means the number of parallel detection.
Publisher’s Note: MDPI stays neutral with regard to jurisdictional claims in published maps and institutional affiliations.

