Failure to Replicate: A Sign of Scientific Misconduct?

1
Rutgers New Jersey Medical School, Newark, NJ 07101-1709, USA
2
Renaissance Associates, Princeton, NJ 08540, USA
*
Author to whom correspondence should be addressed.
Publications 2014, 2(3), 71-82; https://doi.org/10.3390/publications2030071
Submission received: 28 February 2014
/
Revised: 12 August 2014
/
Accepted: 18 August 2014
/
Published: 1 September 2014
(This article belongs to the Special Issue Misconduct in Scientific Publishing)
Abstract
:Repeated failures to replicate reported experimental results could indicate scientific misconduct or simply result from unintended error. Experiments performed by one individual involving tritiated thymidine, published in two papers in Radiation Research, showed exponential killing of V79 Chinese hamster cells. Two other members of the same laboratory were unable to replicate the published results in 15 subsequent attempts to do so, finding, instead, at least 100-fold less killing and biphasic survival curves. These replication failures (which could have been anticipated based on earlier radiobiological literature) raise questions regarding the reliability of the two reports. Two unusual numerical patterns appear in the questioned individual’s data, but do not appear in control data sets from the two other laboratory members, even though the two key protocols followed by all three were identical or nearly so. This report emphasizes the importance of: (1) access to raw data that form the background of reports and grant applications; (2) knowledge of the literature in the field; and (3) the application of statistical methods to detect anomalous numerical behaviors in raw data. Furthermore, journals and granting agencies should require that authors report failures to reproduce their published results.
1. Introduction
Failure to replicate reported experimental results does not necessarily imply that scientific misconduct has occurred. It can be the result of investigator error, sampling variation, lack of statistical power or differences in experimental conditions. In any case, however, we believe that scientists have an obligation to inform readers of their reports that such failure has transpired.
As a co-author of one of two papers published in Radiation Research [1,2] that deal with the survival kinetics of Chinese hamster cells exposed to tritiated thymidine, as a member of the research group here involved and as co-investigator on the NIH grant that supported the research, one of us (Helene Z. Hill) became concerned that certain experiments carried out in the laboratory failed to confirm key experiments reported in those two papers. In reviewing the contents of notebooks in the laboratory, we discovered that there were 21 attempts (10 attempts for one type of the experiments, which were called 100% experiments, 11 for the other, which were called 50% experiments) that failed to replicate the key experiments.
The two published reports involved the killing of cultured V79 Chinese hamster cells that had incorporated the radionuclide, tritiated thymidine. In the published reports, when all of the cells incorporated the radionuclide, the killing was exponential (100% experiments). When cells that had incorporated the radionuclide were incubated for three days with naive cells that had not incorporated the radionuclide, the naive cells were also killed, even though they had never been directly exposed to the radionuclide (50% experiments), and the survival kinetics were also exponential. This latter phenomenon has come to be known as “the bystander effect”. In nuclear medicine, the specialty that involves radionuclides, understanding the bystander effect is important both therapeutically and diagnostically. Setting dose levels too high could be carcinogenic or otherwise damaging to normal tissue, and setting them too low could be therapeutically ineffective or be the cause of missed diagnoses. The two articles have been cited a total of 189 times according to the Thomson Reuters Web of Science, an indication of their interest and importance.
Earlier studies of tritiated thymidine killing of cells in culture indicate that monotonic exponential killing is only expected under certain specific circumstances, which we believe were not present in the experiments in the two publications in Radiation Research. Furthermore, because we had access to the experimental protocols and the raw data that formed the background of the graphs in the two publications, we were able to perform statistical analyses of those data, as well as of the data in the 15 experiments performed by two other individuals in the laboratory that showed very different, biphasic, survival kinetics when compared with the published graphs.
The experiments reported in the two papers that we question were all performed, to the best of our knowledge, by a single individual in the laboratory, whom we will designate as A. The attempts to replicate the key experiments were performed by two other members of the same laboratory, whom we will designate as B and C. B performed 5 × 100% experiments and 5 × 50% experiments. C performed 2 × 100% experiments and 3 × 50% experiments. We identified 7 × 50% and 14 × 100% experiments that we believe provided the data for figures 3, 6 and 7 in the earlier paper [1] and figures 1 and 2A in the second paper [2]. All of these experiments were performed by A. Each of the 100% and the 50% protocols, respectively, for all the experiments performed by A, B and C were identical or nearly so. In fact, the protocols appeared to have been electronically copied from at least two master protocols. While there were 21 experiments in all that failed to replicate A’s original experiments, only 15 studied the same cell line, V79 Chinese hamster cells, used by A. The replication attempts by B and C did not involve any additives (e.g., dimethylsulfoxide and lindane), thus we have compared those results by B and C, which we designate as controls only to A’s V79 results without such additives, in order to be sure that we were not inadvertently introducing any complicating or modifying factors.
In addition to the distinct differences in survival kinetics in the graphs in the two papers compared to the 15 unreported experiments, we identified two unusual numerical patterns underlying the data in figures 3, 6 and 7 of the first paper [1] and figures 1 and 2A of the second paper [2]. These unusual patterns did not appear in data sets produced in the experiments performed by B and C. We applied two different statistical challenges to test the null hypothesis that the unusual patterns in A’s data (without additives) may have been due to chance.
2. Analysis of Experiments
2.1. Biochemical and Radiobiological Considerations
Thymidine blocks the cell cycle at the entrance to and during the S (DNA synthesis) phase [3,4]. The block is reversed by deoxycytidine [5,6,7,8,9]. Nanomolar concentrations of radioactive tritiated thymidine (in the absence of deoxycytidine) both block the cell cycle and kill cells during the S phase [10,11,12,13]. Cells prevented from entering the S phase because of the tritiated thymidine block will not be killed. Therefore, the tritiated thymidine survival curves of asynchronous cells should be exponential in the presence of the antagonist, deoxycytidine (the block is abrogated, all cells can enter the S phase), and biphasic in its absence (the block prevents entry into the S phase, so only S-phase cells are killed). In an expanding population of V79 cells in tissue culture, about 40% are in the S phase; hence, they would be killed upon exposure to tritiated thymidine; 60% would not be killed. Hence, the survival kinetics would be biphasic, reflecting the change in slopes.
We found 12 reports in the early literature that pertain to the killing of tissue culture cells (including V79) by tritiated thymidine. In six reports, deoxycytidine was present in the medium, and the killing was exponential as a function of dose [14,15,16,17,18,19] . In six additional reports, deoxycytidine was absent, and the killing was biphasic as a function of dose [12,16,20,21,22,23]. In one additional case, the killing was exponential; however, the presence of deoxycytidine was not mentioned [24], and the specified medium does not contain it. In three of the papers, the protocols were very similar to the protocols in the two Radiation Research papers, i.e., no deoxycytidine was present, and the survival dose-response was biphasic [12,22,23]. These results were similar to those of B and C.
If the cell population has been synchronized, such that all of the cells were in the S phase at the time that the tritiated thymidine was added, this, too, would allow for exponential cell killing. Synchrony can be produced by mitotic selection, chemically blocking the cell cycle or releasing the cells from contact inhibition at confluence.
None of the protocols that we reviewed for this report called for the addition of deoxycytidine to the medium nor for synchronization of the cells before starting the experiments. The stated medium for the experiments was minimal essential medium (MEM) supplied by Life Technologies, Grand Island, NY, USA. The formulation listed on their website does not include deoxycytidine.
2.2. Replication Attempts: Is There a Bystander Effect?
2.2.1. B and C 100% Experiments
The seven experiments in Figure 1A performed by B and C show biphasic survival curves after following the same 100% protocols described in the two publications. The biphasic survival curves (symbols) indicate that about 40% of the population were rapidly killed, while 60% were killed much more slowly. A’s survival results of the experiments that followed the same protocols are exponential, without any change in slope, and killing is much more profound. Figure 1A reflects, for purposes of comparison, the 100% survival curves taken from the graphs in the two papers, as well as the survival calculated using the value for the parameter A1 found in Table 1 of the 2001 [2] paper (cf. also figures 3 and 7 in the 1999 paper [1] and figure 1 in the 2001 paper [2]). A’s survivals are markedly different from those of B and C.
Figure 1.
Graphs of unpublished experiments performed by B and C following the protocols for exposure of 100% (A) and 50% (B) of V79 cells to tritiated thymidine.
Figure 1.
Graphs of unpublished experiments performed by B and C following the protocols for exposure of 100% (A) and 50% (B) of V79 cells to tritiated thymidine.
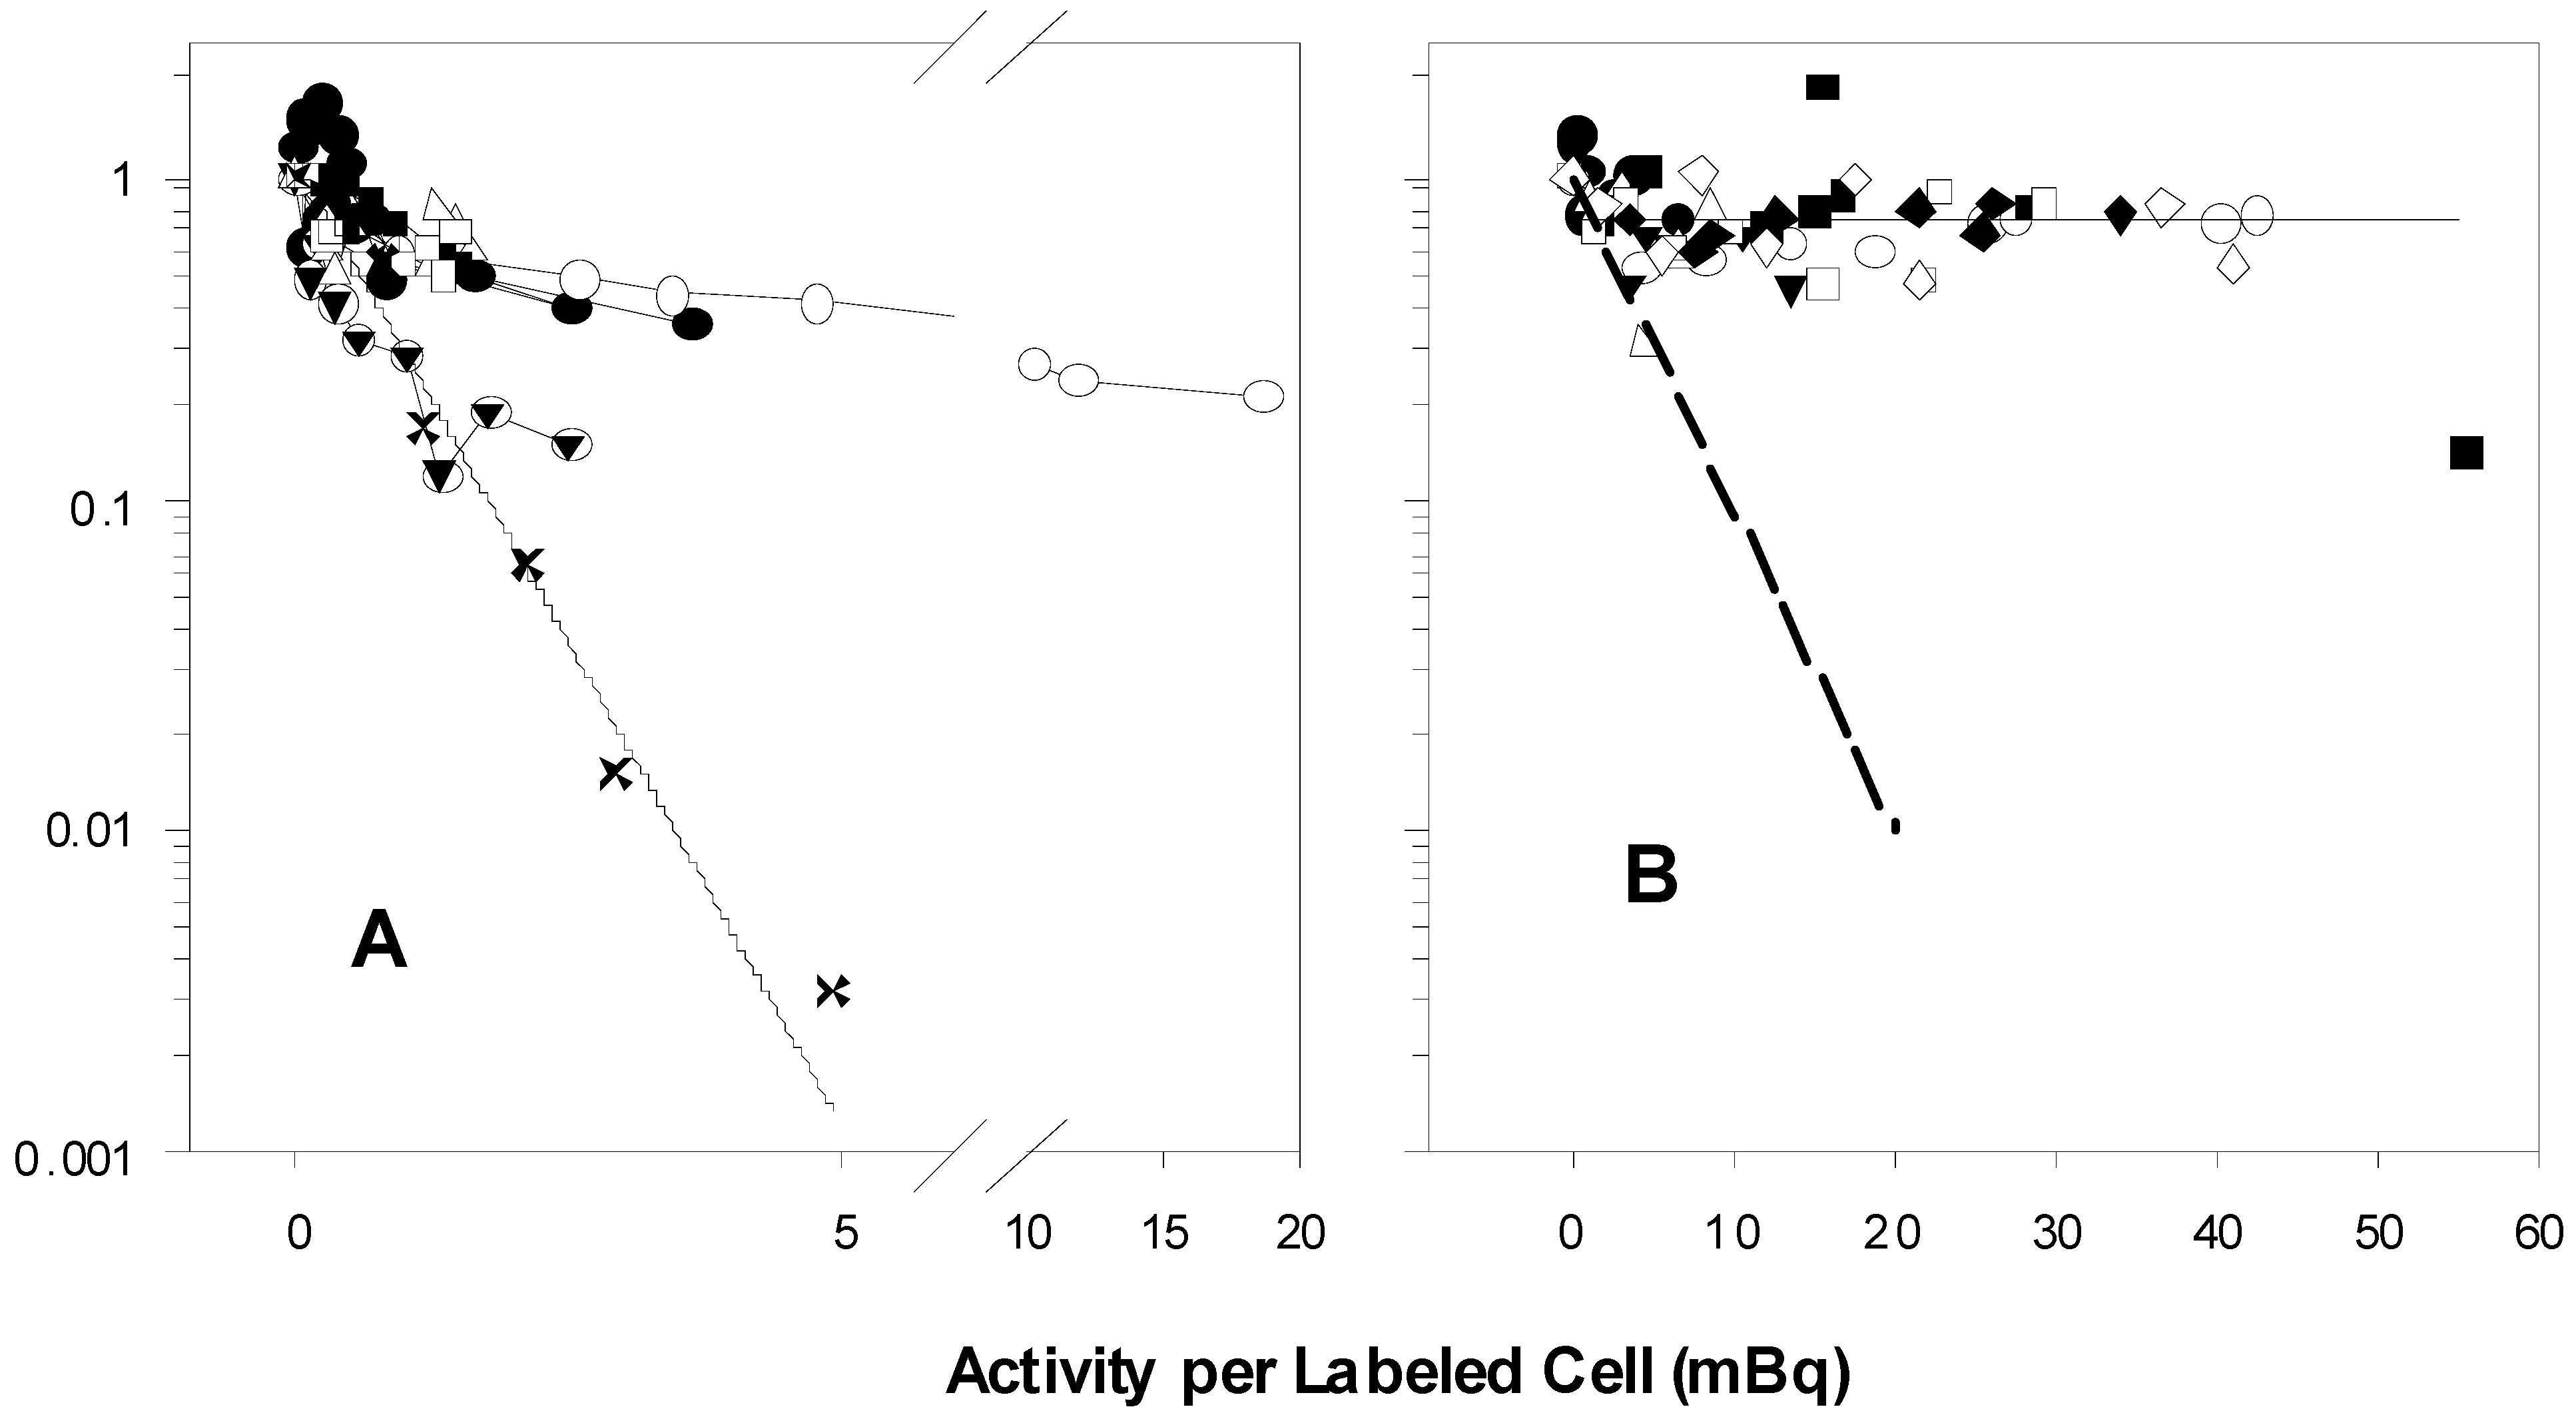
In 1A, the experimental points marked X are estimated survival points from the 100% curves in the two published reports. The solid line was calculated using the value for A1, the theoretical cross-section for survival in mBq/labeled cell, listed in Table 1 of the 2001 paper. The various symbols represent the results of seven experiments by B and C. There are more than 100-fold more survivors in the experiments by B and C than in A’s experiments at the level of 5 mBq/labeled cell. The symbols in 1B show the results of eight 50% V79 experiments of B and C. The dashed line approximates the 50% V79 survival curves depicted in the two papers. The horizontal line is at 0.70 survival, the approximate level at which the survival curves plateau. There are about 70-fold more survivors in B’s and C’s results than in those of A at the level of 20 mBq/labeled cell.
2.2.2. B and C 50% Experiments
There is little or no indication of a bystander effect in the experiments by B and C depicted in Figure 1B. About 70% of the cells are not killed. These survivors consist of the 50% naive cells that were never directly exposed to tritiated thymidine plus the survivors from the population that were so exposed, but were not killed (a crude estimate: 0.5 × 1.0 + 0.5 × 0.60 = 0.80 expected to survive; 0.70 do survive; ~ 0.10 killed as bystanders?). The dashed line in Figure 2B emulates the survival of V79 in the 50% experiments in the two papers (figures 3 and 6 in the 1999 paper [1], Figure 1 in the 2001 paper [2]).
The stated purpose of the two papers was to demonstrate that a bystander effect exists: Neighboring cells that were not directly exposed to tritiated thymidine are killed when in proximity to cells that have incorporated the radionuclide. Our crude calculations do not rule out any bystander effect, but they do indicate that under the conditions of B’s and C’s experiments, the effect is much less than that displayed in the two published papers.
2.3. Statistical Analysis of the Raw Data
The Office of Research Integrity (ORI) of the NIH describes a test that can be used on numerical data based on assumptions that: (1) in experimental count data in which terminal digits are insignificant, they are likely to be relatively uniform in their distribution; and (2) humans are not generally able to generate uniformly distributed digits. The chi-squared goodness-of-fit test can be applied to the null hypothesis that the terminal digits of a data set have been drawn from a uniform distribution, with significant results indicative of potential data manipulation or systematic or unconscious rounding error. We applied the ORI technique to analyze terminal digits, and we developed a new technique, which we describe below, to distinguish data sets that may be cause for concern.
In the notebooks we examined, we were able to identify the experiments on which the graphs in figures 3, 6 and 7 in the 1999 paper and figures 1 and 2A in the 2001 paper were based. We compared these experiments performed by A to the protocols and data generated in the 15 experiments performed by B and C. As we have noted, B’s and C’s experiments deal only with tritiated thymidine killing of V79 cells following the 100% and 50% protocols. Therefore, we limited our analyses of A’s experiments to only those experiments, or parts of the experiments, that were exactly comparable to those of B and C.
We screened two types of data: (1) integer counts copied from the digital LED display of a Coulter counter that records the pulses of individual cells in liquid suspension as a fixed volume passes through an orifice, thereby causing a change in electrical resistance; and (2) counts of colonies of cells that have arisen from single cells plated and adhering to the surfaces of 60-mm tissue culture dishes overlaid with growth medium. Most experimental points were assayed in triplicate. The terminal digit analysis does not require sample replication, and the mid-ratio analysis (see below) is based on triplicate sampling.
2.3.1. Terminal Digit Distributions of the Coulter Counts
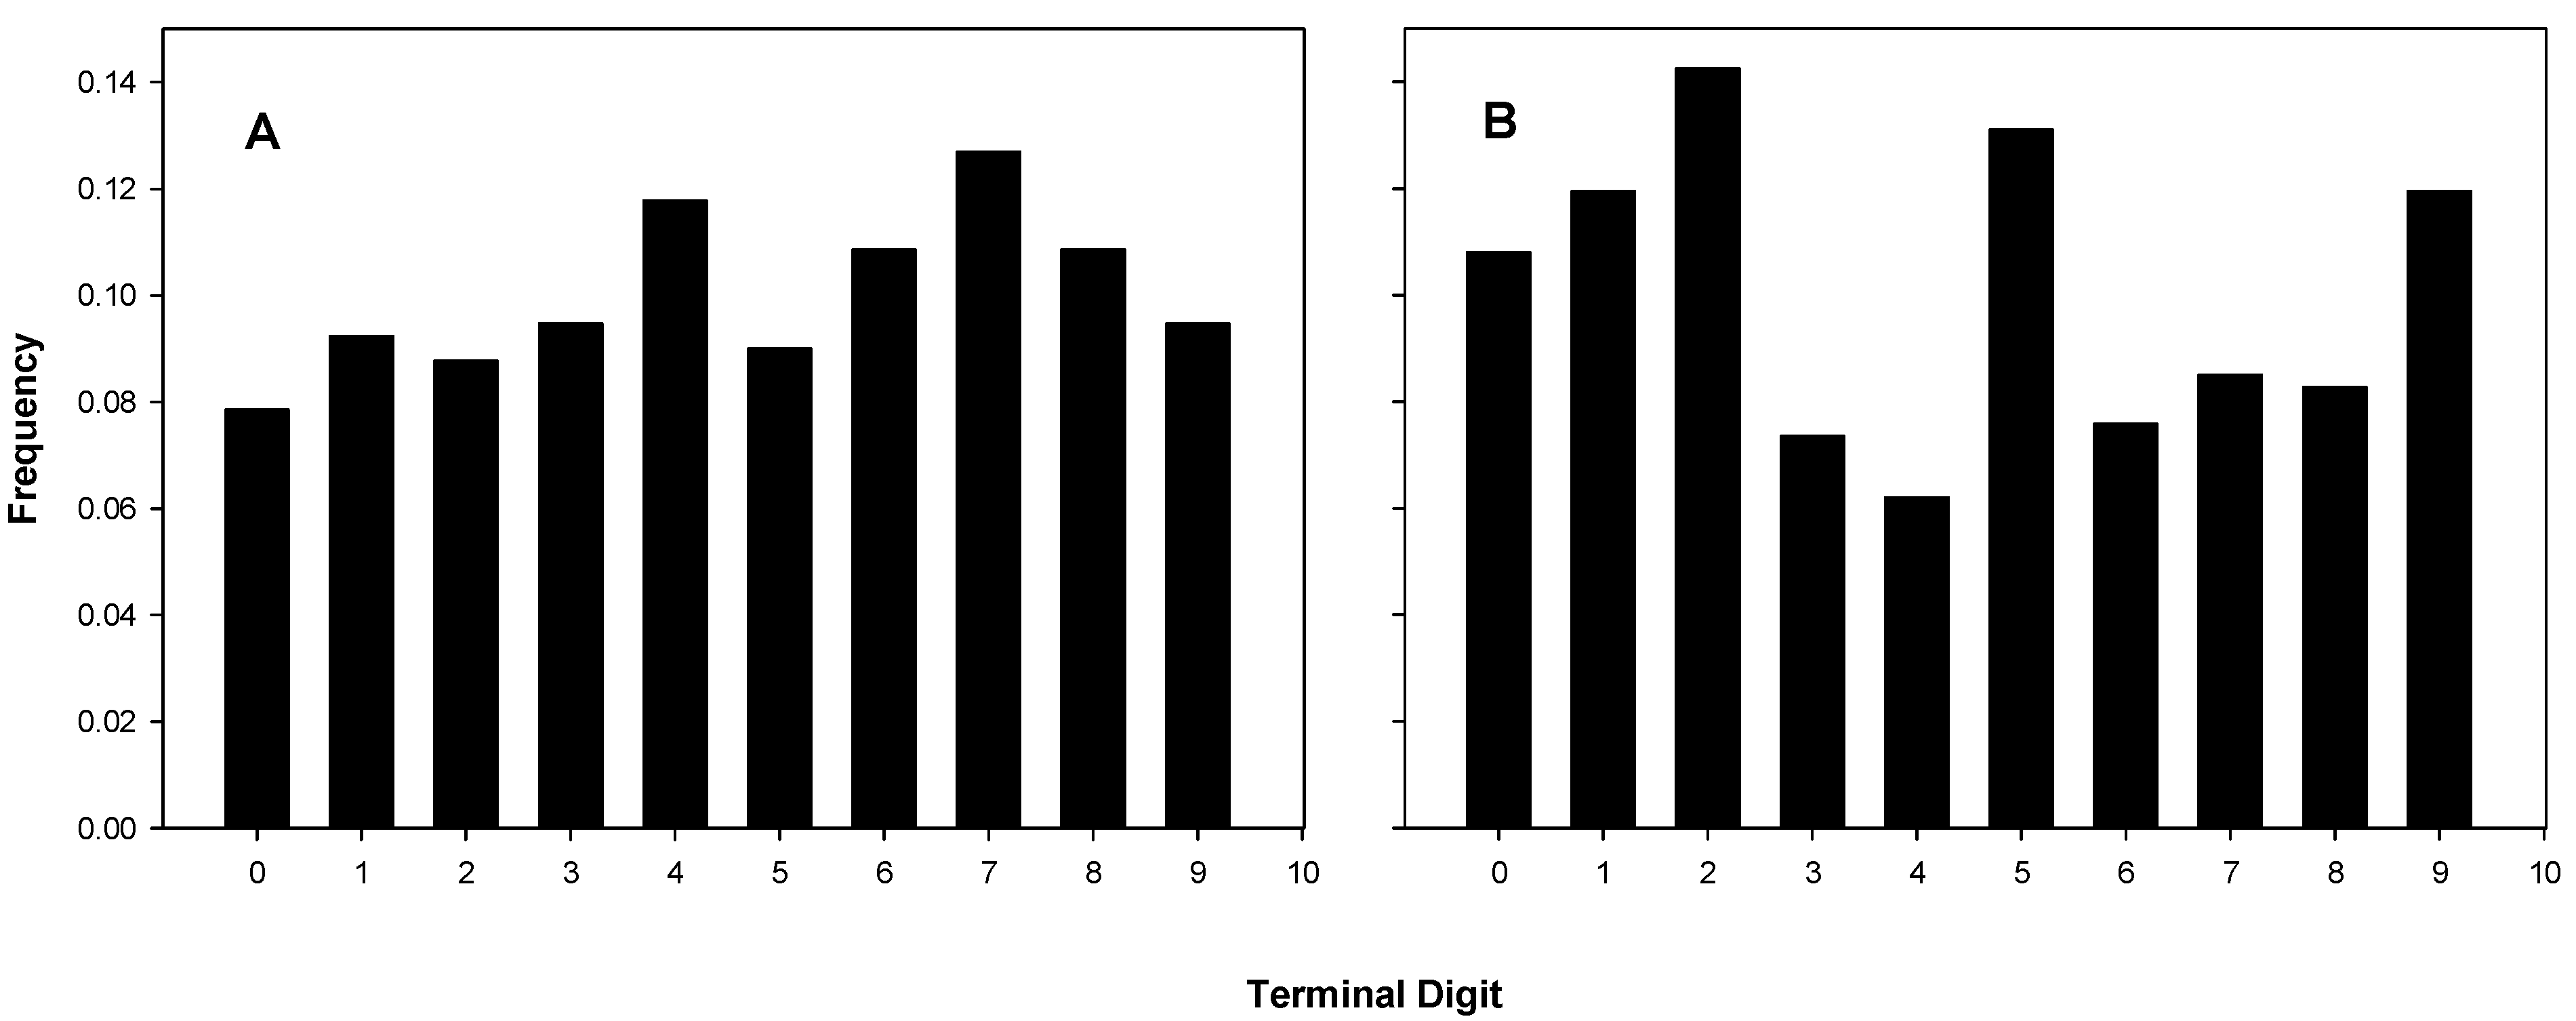
Terminal digit distributions from 15 experiments of B and C are shown in Figure 2A and those of the 17 experiments of A in Figure 2B. The actual distributions are listed in Table 1, which also shows the chi-squared statistics and corresponding p-values. Three of the five distributions attributed to A in Table 1 have p-values of less than 0.05 (significant), and one of those is less than 10−5 (highly significant).
Figure 2.
Terminal digit distributions for coulter counts. (A) B’s and C’s Coulter digit distributions, chi-square for fit to uniform, p = 0.462; (B) A’s Coulter digit distributions, chi-square for fit to uniform, p = 4.49 × 10⁻⁴.
Figure 2.
Terminal digit distributions for coulter counts. (A) B’s and C’s Coulter digit distributions, chi-square for fit to uniform, p = 0.462; (B) A’s Coulter digit distributions, chi-square for fit to uniform, p = 4.49 × 10⁻⁴.

Table 1.
Terminal digit analysis of coulter counts of experiments (Exps) represented in the published figures. The numbers of the various digit distributions were compared to the corresponding uniform distributions to calculate the chi-squared statistic and the corresponding probabilities for nine degrees of freedom.
| Figure | Type | # of Exps | Terminal Digit | Total | Chi-square | p | ||||||||||
|---|---|---|---|---|---|---|---|---|---|---|---|---|---|---|---|---|
| 0 | 1 | 2 | 3 | 4 | 5 | 6 | 7 | 8 | 9 | |||||||
| Controls | --- | 100% | 7 | 17 | 18 | 16 | 18 | 31 | 16 | 22 | 22 | 23 | 20 | 203 | 9.2 | 0.42 |
| --- | 50% | 8 | 17 | 22 | 22 | 23 | 20 | 23 | 25 | 33 | 24 | 21 | 230 | 6.8 | 0.66 | |
| 1999 | 3 and 6 | 50% | 2 | 5 | 4 | 12 | 5 | 2 | 6 | 3 | 7 | 13 | 3 | 60 | 21.0 | 1.3 × 10⁻² |
| 3 | 100% | 2 | 6 | 9 | 3 | 4 | 11 | 4 | 7 | 4 | 3 | 6 | 57 | 11.3 | 0.26 | |
| 7 | 100% | 3 | 10 | 3 | 4 | 1 | 3 | 7 | 4 | 4 | 4 | 2 | 42 | 14.2 | 0.12 | |
| 2001 | 1 | 100% | 7 | 16 | 22 | 27 | 17 | 8 | 24 | 14 | 12 | 11 | 23 | 174 | 20.7 | 1.4 × 10⁻² |
| 2A | 50% | 3 | 4 | 11 | 12 | 4 | 0 | 12 | 1 | 8 | 3 | 17 | 72 | 89.7 | 8.7 × 10⁻⁶ | |
2.3.2. Frequency of the Mean in Triplicate Counts
The second technique we applied was based on the observation that an unusual percentage of A’s colony count triplicates included a value that was close to the triplicate’s mean. Colony means are the data points used to construct the graphs in the papers. They provide the basis for conclusions regarding survival and bystander effects.
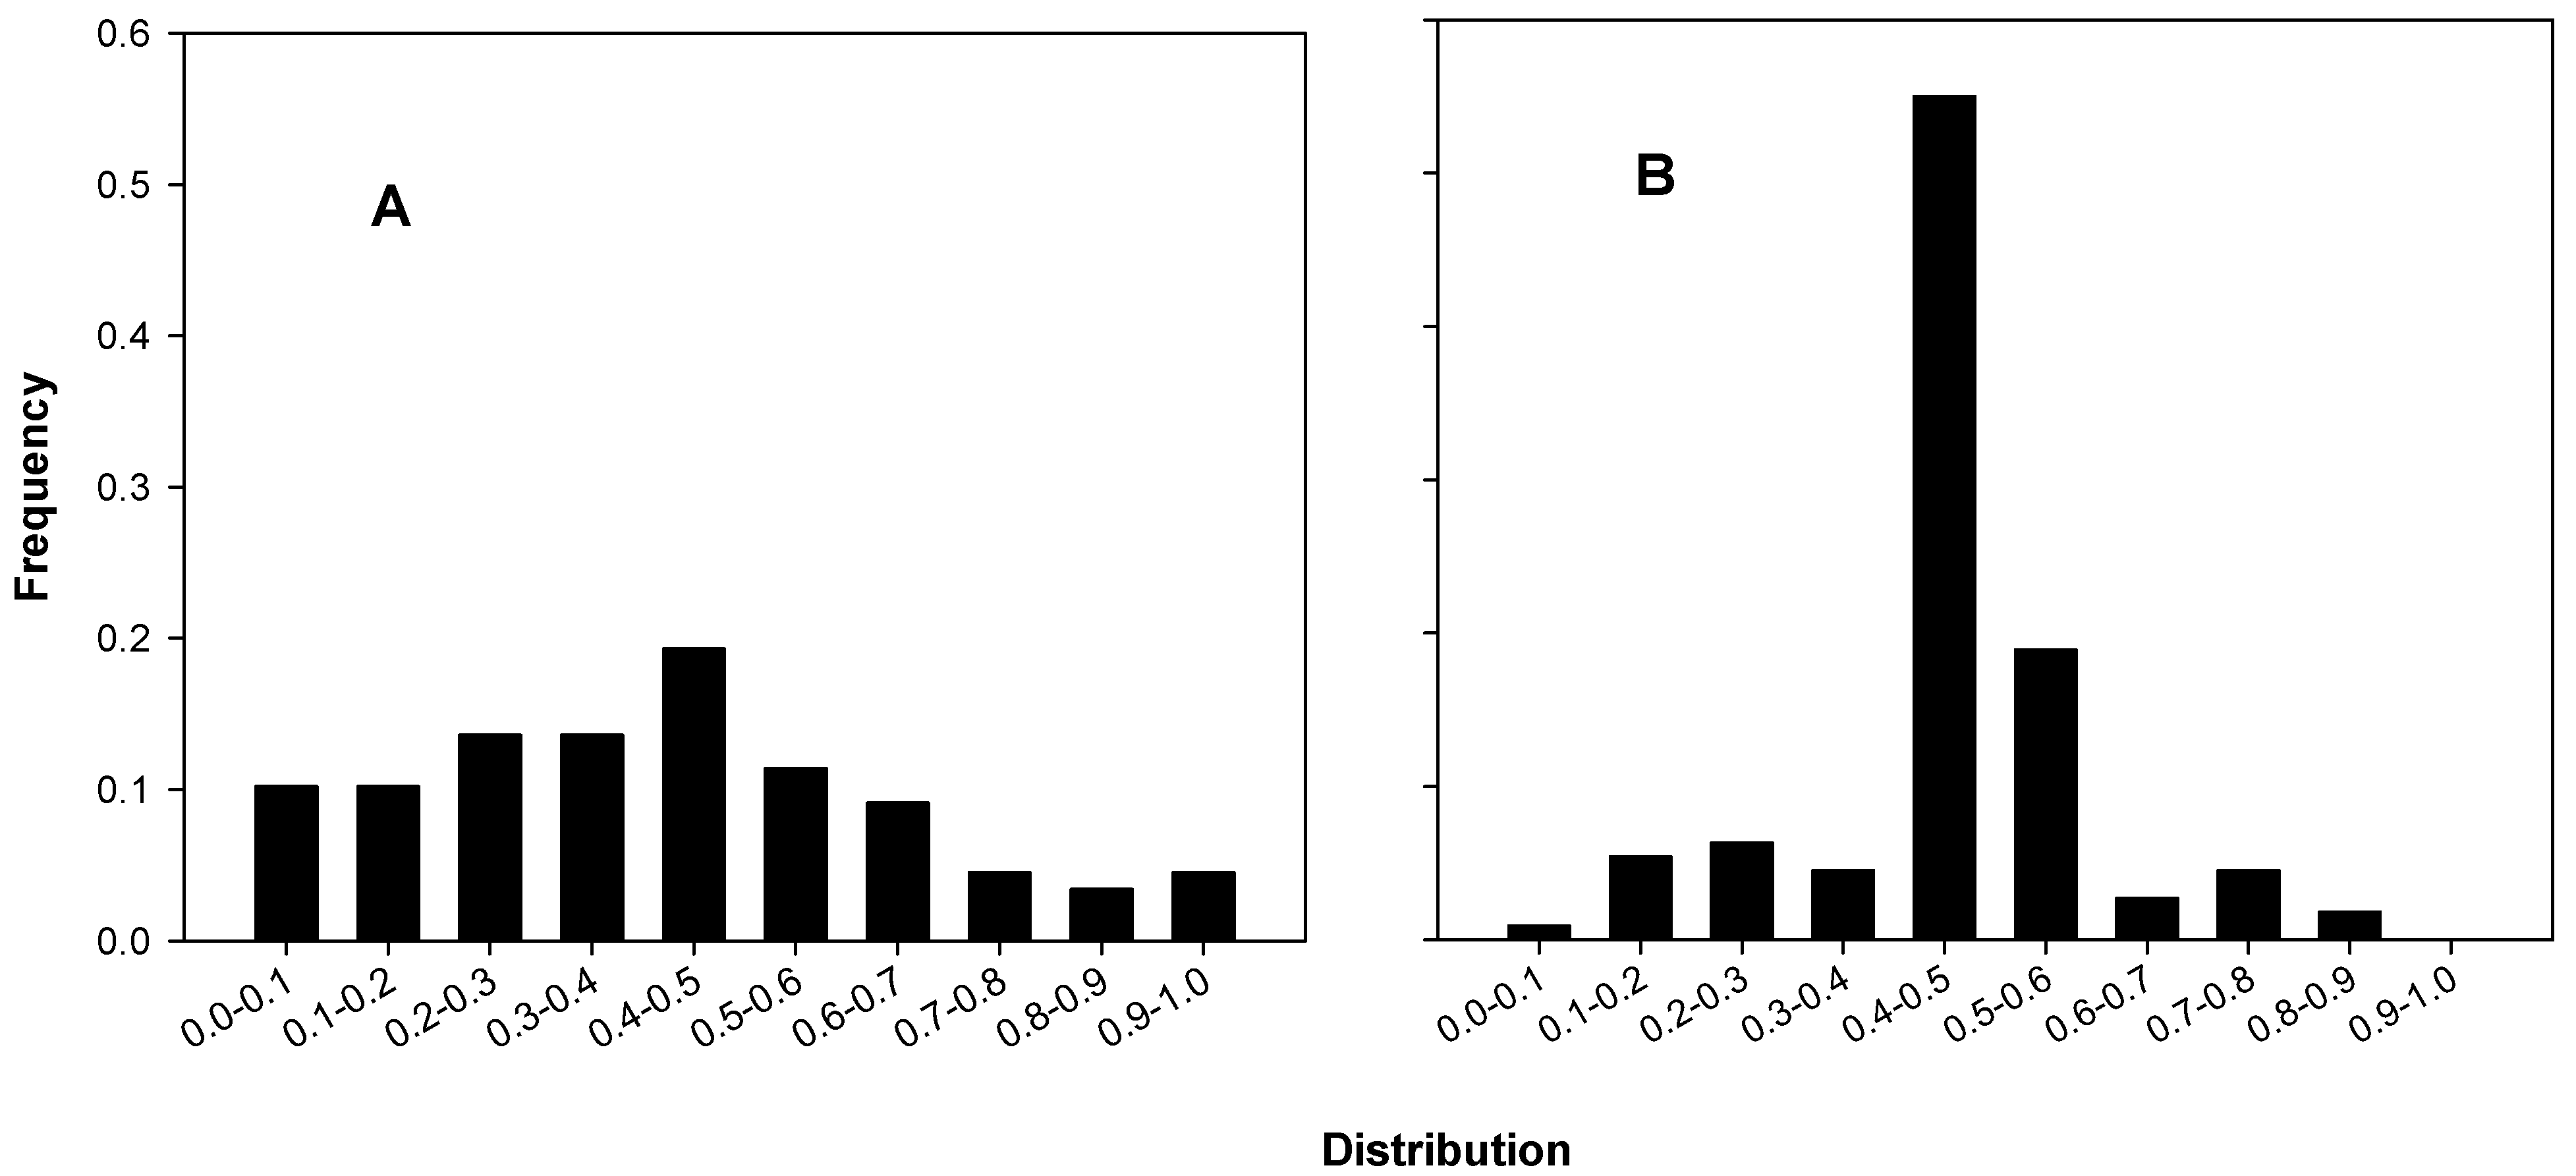
We first noticed the unusual frequency of near mean-containing triplicates in A’s data sets when we calculated and drew a histogram of a statistic associated with data triples, the mid-ratio, the number obtained by sorting the values of the triplicates in increasing order as a, b and c and dividing (b–a) by (c–a). In triplicates with a mid-ratio close to 0.5, the middle value (b) will be quite close to the mean. Figure 3 shows histograms of the colony mid-ratios of B and C (3A) and of A (3B). The differences in the relative numbers of mid-ratios near 0.5 is dramatic and highlights an exceptional discrepancy between A’s colony data mid-ratios and those of B and C.
Figure 3.
Mid-ratio distributions for colony counts. (A) B’s and C’s colonies, 29 of 88 in the 0.4–0.6 interval, 35.4 ± 5.19 expected (p ~ 0.91); (B) A’s colonies, 83 of 111 in the 0.4–0.6 interval, 34.2 ± 5.1 expected, p ~ 3.73 × 10⁻¹⁸).
Figure 3.
Mid-ratio distributions for colony counts. (A) B’s and C’s colonies, 29 of 88 in the 0.4–0.6 interval, 35.4 ± 5.19 expected (p ~ 0.91); (B) A’s colonies, 83 of 111 in the 0.4–0.6 interval, 34.2 ± 5.1 expected, p ~ 3.73 × 10⁻¹⁸).
Eighty-five of the 138 triplicates (61.6%) in the 17 of A’s experiments that we analyzed included their (rounded) means as one of the three members of the triplicate, whereas only 21 of the 136 triplicates (15.4%) in the 15 of B’s and C’s experiments that we analyzed did so. This disparity led us to ask whether the large number of mean-containing triplicates in A’s data might have occurred as a result of ordinary chance variation.
We developed a model, to be reported elsewhere, that allowed us to estimate the expectation and standard deviation of the number of mean-containing triplicates that could occur by chance in a given collection of triplicates. For collections of (moderately) large numbers of triplicates, the distribution of the number of mean-containing triplicates is approximately normal; thus, our estimates for expectation and standard deviation allow us to obtain reasonable estimates of the probability that a given collection might have included as many or more mean-containing triplicates than it actually did: we simply look up the tail probability corresponding to the z-score of that actual count corrected for continuity (i.e., ((actual-0.5) –expected)/standard deviation). The results of applying our model to the 136 control (data of B and C) triplicates and triplicates identified as being represented in the five figures in the two papers are shown in Table 2. The numbers of mean-containing triplicates in B’s and C’s experiments are well in line with expectation, while those for A’s experiments are all significantly larger than could reasonably be expected. The extremely significant normal tail probabilities highlight the unlikelihood that the unusually large numbers of mean-containing triplicates could have simply occurred by chance.
Table 2.
Analysis of the frequency of the occurrence of the rounded mean in the triplicate samples of colony counts. Column 6 is the number N of triplicate samples that contain the rounded mean of the three counts. Column 7 is the number K that is expected based on our model. The z-scores incorporate the correction for continuity.The numerator in Column 5 is the number of qualifying triplicates (triplicates for which the gap (c-a) is greater than two). The denominator in Column 5 is the total number of triplicates.
| Figure | Type | # of Exps | # of Triplicates | N = No. with Mean | K = No. Expected | SD | Z-Score | p (N ≥ K) | |
|---|---|---|---|---|---|---|---|---|---|
| Controls | --- | 100% | 7 | 65/67 | 14 | 12.1 | 3.2 | 0.44 | 0.32 |
| --- | 50% | 8 | 71/71 | 7 | 11.7 | 3.1 | −1.7 | 0.96 | |
| 1999 | 3&6 | 50% | 2 | 19/19 | 14 | 3.0 | 1.6 | 6.7 | 2.1 × 10⁻⁸ |
| 3 | 100% | 2 | 20/20 | 12 | 3.1 | 1.6 | 5.2 | 6.1 × 10⁻⁶ | |
| 7 | 100% | 3 | 13/15 | 9 | 3.2 | 1.5 | 3.4 | 9.1 × 10⁻⁴ | |
| 2001 | 1 | 100% | 7 | 63/66 | 37 | 11.2 | 3.0 | 8.4 | 2.6 × 10⁻¹³ |
| 2A | 50% | 3 | 23/24 | 13 | 3.9 | 1.8 | 4.8 | 1.9 × 10⁻⁵ |
3. Discussion
The bystander effect has had a large impact on the field of radiation biology. The Web of Science tallies 7159 related records in their core collection. The experiments that we analyzed that are the focus of the two reports [1,2] published in Radiation Research, purport to extend the bystander effect to nuclear medicine, potentially a significant contribution to the radiobiological literature.
The kinetics of all of the experiments in the reports are based on the kinetics of the 100% survival curves. If the 100% survival curves are exponential, then survival curves of mixtures of 50% and of 90% bystanders considered in the reports can also be exponential. If the 100% survival curves are biphasic, then it follows that survival curves of mixtures of 50% and of 90% bystanders should also be biphasic. If the kinetics of the 100% experiments are in error, then experiments involving bystander effects (50% and 90% bystanders), must also be in error. Any modifications of purported bystander effects by dimethylsulfoxide and/or lindane must also be in error (cf. figures 6 and 7 in the 1999 paper and figures 1, 2A and 2B in the 2001 paper).
3.1. Can the Discrepancies Be Related to the Times of the Experiments?
B’s and C’s 100% experiments have very different outcomes from those of A. Which are correct? Can they both be correct? Is it possible that conditions and circumstances could have changed so much that such different kinetics could have occurred?
The last experiment performed by A for the two papers was completed in February of 2000, while the first experiment performed by B was in mid-October of 2000, and the first performed by C was in mid-April of 2001. It is, therefore, possible that some major change in the experimental conditions occurred between February and October of 2000. There are no indications in any of the protocols as to what this change, if such one did occur, could have been. Cells do change in tissue culture, but the V79 cultures were frequently renewed from frozen stocks to avoid genetic drifting. We also found two 100% experiments in the laboratory notebooks with two other cell lines, WB mouse cells and AG1522 human cells that both showed biphasic survivals, reinforcing our notion that the cell cycle blocking effect of tritiated thymidine is a universal phenomenon.
3.2. Can the Discrepancies Be Related to Changes in the Two Protocols?
The 100% protocols and the 50% protocols respectively followed by A, B and C are essentially the same, except for differences in the tritiated thymidine concentrations, even though they span a period of more than 2.5 years. Protocol examples are available in the Supplementary Materials.
3.3. 100% Survival Results of B and C Are Compatible with the Experiments of Others
As noted in the Introduction, in six out of seven reports that we were able to find in the literature, tritiated thymidine survival curves were biphasic when no deoxycytidine was present, similar to the seven 100% experiments performed by B and C. Two of those reports were actually published after the two papers analyzed here. In six additional earlier reports, survival was exponential in the presence of deoxycytidine, while A’s survival curves were exponential in its absence. Only one earlier report [24] is compatible with A’s results: exponential survival in the apparent absence of deoxycytidine.
3.4. Statistics Can Be a Powerful Tool to Test Numerical Results
Use of statistics has been recommended as a useful tool for examining and verifying numerical results in clinical and preclinical trials [25], although it has not been put to use in either very often. The power of statistics was highlighted recently in a series of papers in the journal Anaesthesia that question the integrity of 168 randomized controlled trials reported by a single individual [26]. In another study, Hudes et al. questioned the unusual clustering of coefficients of variation in preclinical studies by three members of the same medical biochemistry department [27]. Al-Marzouki et al. raised questions about data obtained in a clinical dietary trial [28], and Baggerly and Coombes were able to uncover multiple errors in clinical studies purporting to predict the responses of certain cancers to chemotherapy [29]. Simonsohn used statistics alone to identify fraud by analyzing means and standard deviations derived from raw data [30]. Each statistical method employed by these various investigators was tailored to the specific situation, unlike image analysis used to detect manipulations for which one size fits all [31].
4. Conclusions
- (1)
- A review of the literature involving the killing of tissue culture cells that have incorporated tritiated thymidine into their DNA predicts exponential survival as reported in two papers published in the journal Radiation Research [1,2] under conditions that were likely not present in the survival experiments performed by A.
- (2)
- Likewise, the early and recent literature predicts biphasic survival curves that were not seen in the two papers under conditions that were likely to have been present in the experiments performed by A.
- (3)
- The expected biphasic survival was seen in the 15 experiments performed by B and C following the same or similar protocols listed by A. These results of B and C appear to be reliable and indicate that under the experimental conditions that prevailed in all of the studies, there is only a small bystander effect.
- (4)
- Statistical analyses of the numerical data that form the background of survival experiments performed by A and reported in the two papers are not consistent with the expectation of the random distributions of numbers.
- (5)
- Statistical analyses of the numerical data that form the background of survival experiments performed by B and C are consistent with the expectation of random distributions of numbers.
- (6)
- This report emphasizes the importance of familiarity with the published literature in the field in question and of access to the raw data on which scientific reports rely.
Acknowledgments
The authors are grateful to Michael E. Robbins (deceased), a highly respected Radiation Biologist, whose analysis of the radiation biology in the two papers in Radiation Research reinforced the concerns regarding the survival kinetics raised regarding this report.
Author Contributions
Helene Z. Hill is Professor of Radiology, a co-investigator on the NIH grant (R01 CA083838) that supported this research and a co-author of one of the papers [2]. As a Radiation Biologist, she is responsible for the literature search, summary and analysis of the radiation biology data. Joel H. Pitt is a statistician and is responsible for the numerical analysis of the data.
Conflicts of Interest
The authors declare no conflict of interest.
References
- Bishayee, A.; Rao, D.V.; Howell, R.W. Evidence for pronounced bystander effects caused by nonuniform distributions of radioactivity using a novel three-dimensional tissue culture model. Radiat. Res. 1999, 152, 88–97. [Google Scholar] [CrossRef]
- Bishayee, A.; Hill, H.Z.; Stein, D.; Rao, D.V.; Howell, R.W. Free radical-initiated and gap junction-mediated bystander effect due to nonuniform distribution of incorporated radioactivity in a three-dimensional tissue culture model. Radiat. Res. 2001, 155, 335–344. [Google Scholar] [CrossRef]
- Tobey, R.A.; Anderson, E.C.; Petersen, D.F. The effect of thymidine on the duration of G1 in Chinese hamster cells. J. Cell Biol. 1967, 35, 53–59. [Google Scholar] [CrossRef]
- Puck, T.T. Studies of the Life Cycle of Mammalian Cells. Cold Spring Harb. Symp. Quant. Biol. 1964, 29, 167–176. [Google Scholar] [CrossRef]
- Bjursell, G.; Reichard, P. Effects of thymidine on deoxyribonucleoside triphosphate pools and deoxyribonucleic acid synthesis in Chinese hamster ovary cells. J. Biol. Chem. 1973, 248, 3904–3909. [Google Scholar]
- Fox, R.M.; Tripp, E.H.; Tattersall, M.H. Mechanism of deoxycytidine rescue of thymidine toxicity in human T-leukemic lymphocytes. Cancer Res. 1980, 40, 1718–1721. [Google Scholar]
- Hiramoto, K.; Narahara, K.; Kimoto, H. Synchronization culture of amniotic fluid cells using excess thymidine block followed by deoxycytidine release and its application to high-resolution banding analysis of chromosomes. Jpn. J. Hum. Genet. 1990, 35, 195–206. [Google Scholar] [CrossRef]
- Morris, N.R.; Fischer, G.A. Studies concerning inhibition of the synthesis of deoxycytidine by phosphorylated derivatives of thymidine. Biochim. Biophys. Acta 1960, 42, 183–184. [Google Scholar] [CrossRef]
- Wheater, R.F.; Roberts, S.H. An improved lymphocyte culture technique: Deoxycytidine release of a thymidine block and use of a constant humidity chamber for slide making. J. Med. Genet. 1987, 24, 113–114. [Google Scholar] [CrossRef]
- Ehmann, U.K.; Williams, J.R.; Nagle, W.A.; Brown, J.A.; Belli, J.A.; Lett, J.T. Perturbations in cell cycle progression from radioactive DNA precursors. Nature 1975, 258, 633–636. [Google Scholar] [CrossRef]
- Hoy, C.A.; Lewis, E.D.; Schimke, R.T. Perturbation of DNA replication and cell cycle progression by commonly used [3H]thymidine labeling protocols. Mol. Cell Biol. 1990, 10, 1584–1592. [Google Scholar]
- Hu, V.W.; Black, G.E.; Torres-Duarte, A.; Abramson, F.P. 3H-thymidine is a defective tool with which to measure rates of DNA synthesis. FASEB J. 2002, 16, 1456–1457. [Google Scholar]
- Pollack, A.; Bagwell, C.B.; Irvin, G.L., 3rd. Radiation from tritiated thymidine perturbs the cell cycle progression of stimulated lymphocytes. Science 1979, 203, 1025–1027. [Google Scholar]
- Bedford, J.S.; Mitchell, J.B.; Griggs, H.G.; Bender, M.A. Cell killing by gamma rays and beta particles from tritiated water and incorporated tritiated thymidine. Radiat. Res. 1975, 63, 531–543. [Google Scholar] [CrossRef]
- Burki, H.J.; Koch, C.; Wolff, S. Molecular suicide studies of 125I and 3H disintegration in the DNA of Chinese hamster cells. Curr. Top. Radiat. Res. Q 1978, 12, 408–425. [Google Scholar]
- Burki, H.J.; Okada, S. Killing of cultured mammalian cells by radioactive decay of tritiated thymidine at −196 °C. Radiat. Res. 1970, 41, 409–424. [Google Scholar] [CrossRef]
- Burki, H.J.; Roots, R.; Feinendegen, L.E.; Bond, V.P. Inactivation of mammalian cells after disintegration of 3H or 125I in cell DNA at −196 °C. Int. J. Radiat. Biol. Relat. Stud. Phys. Chem. Med. 1973, 24, 363–375. [Google Scholar] [CrossRef]
- Chan, P.C.; Lisco, E.; Lisco, H.; Adelstein, S.J. The radiotoxicity of iodine-125 in mammalian cells II. A comparative study on cell survival and cytogenetic responses to 125IUdR, 131TUdR, and 3HTdR. Radiat. Res. 1976, 67, 332–343. [Google Scholar] [CrossRef]
- Marin, G.; Bender, M.A. Survival Kinetics of Hela S-3 Cells after Incorporation of 3h-Thymidine or 3h-Uridine. Int. J. Radiat. Biol. Relat. Stud. Phys. Chem. Med. 1963, 7, 221–233. [Google Scholar] [CrossRef]
- Drew, R.M.; Painter, R.B. Action of tritiated thymidine on the clonal growth of mammalian cells. Radiat. Res. 1959, 11, 535–544. [Google Scholar] [CrossRef]
- Drew, R.M.; Painter, R.B. Further studies on the clonal growth of HeLa S3 cells treated with tritiated thymidine. Radiat. Res. 1962, 16, 303–311. [Google Scholar] [CrossRef]
- Keprtova, J.; Minarova, E. The effect of 3H-thymidine on the proliferation of in vitro cultured mammalian cells. Gen. Physiol. Biophys. 1985, 4, 81–92. [Google Scholar]
- Persaud, R.; Zhou, H.; Baker, S.E.; Hei, T.K.; Hall, E.J. Assessment of low linear energy transfer radiation-induced bystander mutagenesis in a three-dimensional culture model. Cancer Res. 2005, 65, 9876–9882. [Google Scholar] [CrossRef]
- Panter, H.C. Cell inactivation by tritium decays at 37 and -196 degrees C: Some comparisons with X rays. Radiat. Res. 1981, 87, 79–89. [Google Scholar] [CrossRef]
- Buyse, M.; George, S.L.; Evans, S.; Geller, N.L.; Ranstam, J.; Scherrer, B.; Lesaffre, E.; Murray, G.; Edler, L.; Hutton, J.; et al. The role of biostatistics in the prevention, detection and treatment of fraud in clinical trials. Stat. Med. 1999, 18, 3435–3451. [Google Scholar] [CrossRef]
- Carlisle, J.B. The analysis of 168 randomised controlled trials to test data integrity. Anaesthesia 2012, 67, 521–537. [Google Scholar] [CrossRef]
- Hudes, M.L.; McCann, J.C.; Ames, B.N. Unusual clustering of coefficients of variation in published articles from a medical biochemistry department in India. FASEB J. 2009, 23, 689–703. [Google Scholar] [CrossRef]
- Al-Marzouki, S.; Evans, S.; Marshall, T.; Roberts, I. Are these data real? Statistical methods for the detection of data fabrication in clinical trials. BMJ 2005, 331, 267–270. [Google Scholar]
- Baggerly, K.A.; Coombes, K.R. Deriving chemosensitivity from cell lines: Forensic bioinformatics and reproducible research in high-throughput biology. Ann. Appl. Stat. 2009, 3, 1309–1334. [Google Scholar] [CrossRef]
- Simonsohn, U. The lesson from two cases of fabricated data detected by statistics alone. Available online: http://ssrn.com/abstract=2114571 or http://dx.doi.org/10.2139/ssrn.2114571 (accessed on 21 November 2012).
- Forensic Tools. Office of Research Integrity: Rockville MD, USA. Available online: http://ori.hhs.gov/forensic-tools (accessed on 26 August 2014).
© 2014 by the authors; licensee MDPI, Basel, Switzerland. This article is an open access article distributed under the terms and conditions of the Creative Commons Attribution license (http://creativecommons.org/licenses/by/3.0/).
Share and Cite
MDPI and ACS Style
Hill, H.Z.; Pitt, J.H. Failure to Replicate: A Sign of Scientific Misconduct? Publications 2014, 2, 71-82. https://doi.org/10.3390/publications2030071
AMA Style
Hill HZ, Pitt JH. Failure to Replicate: A Sign of Scientific Misconduct? Publications. 2014; 2(3):71-82. https://doi.org/10.3390/publications2030071
Chicago/Turabian StyleHill, Helene Z., and Joel H. Pitt. 2014. "Failure to Replicate: A Sign of Scientific Misconduct?" Publications 2, no. 3: 71-82. https://doi.org/10.3390/publications2030071