Dentin Erosion: Method Validation and Efficacy of Fluoride Protection

Abstract
1. Introduction
2. Materials and Methods
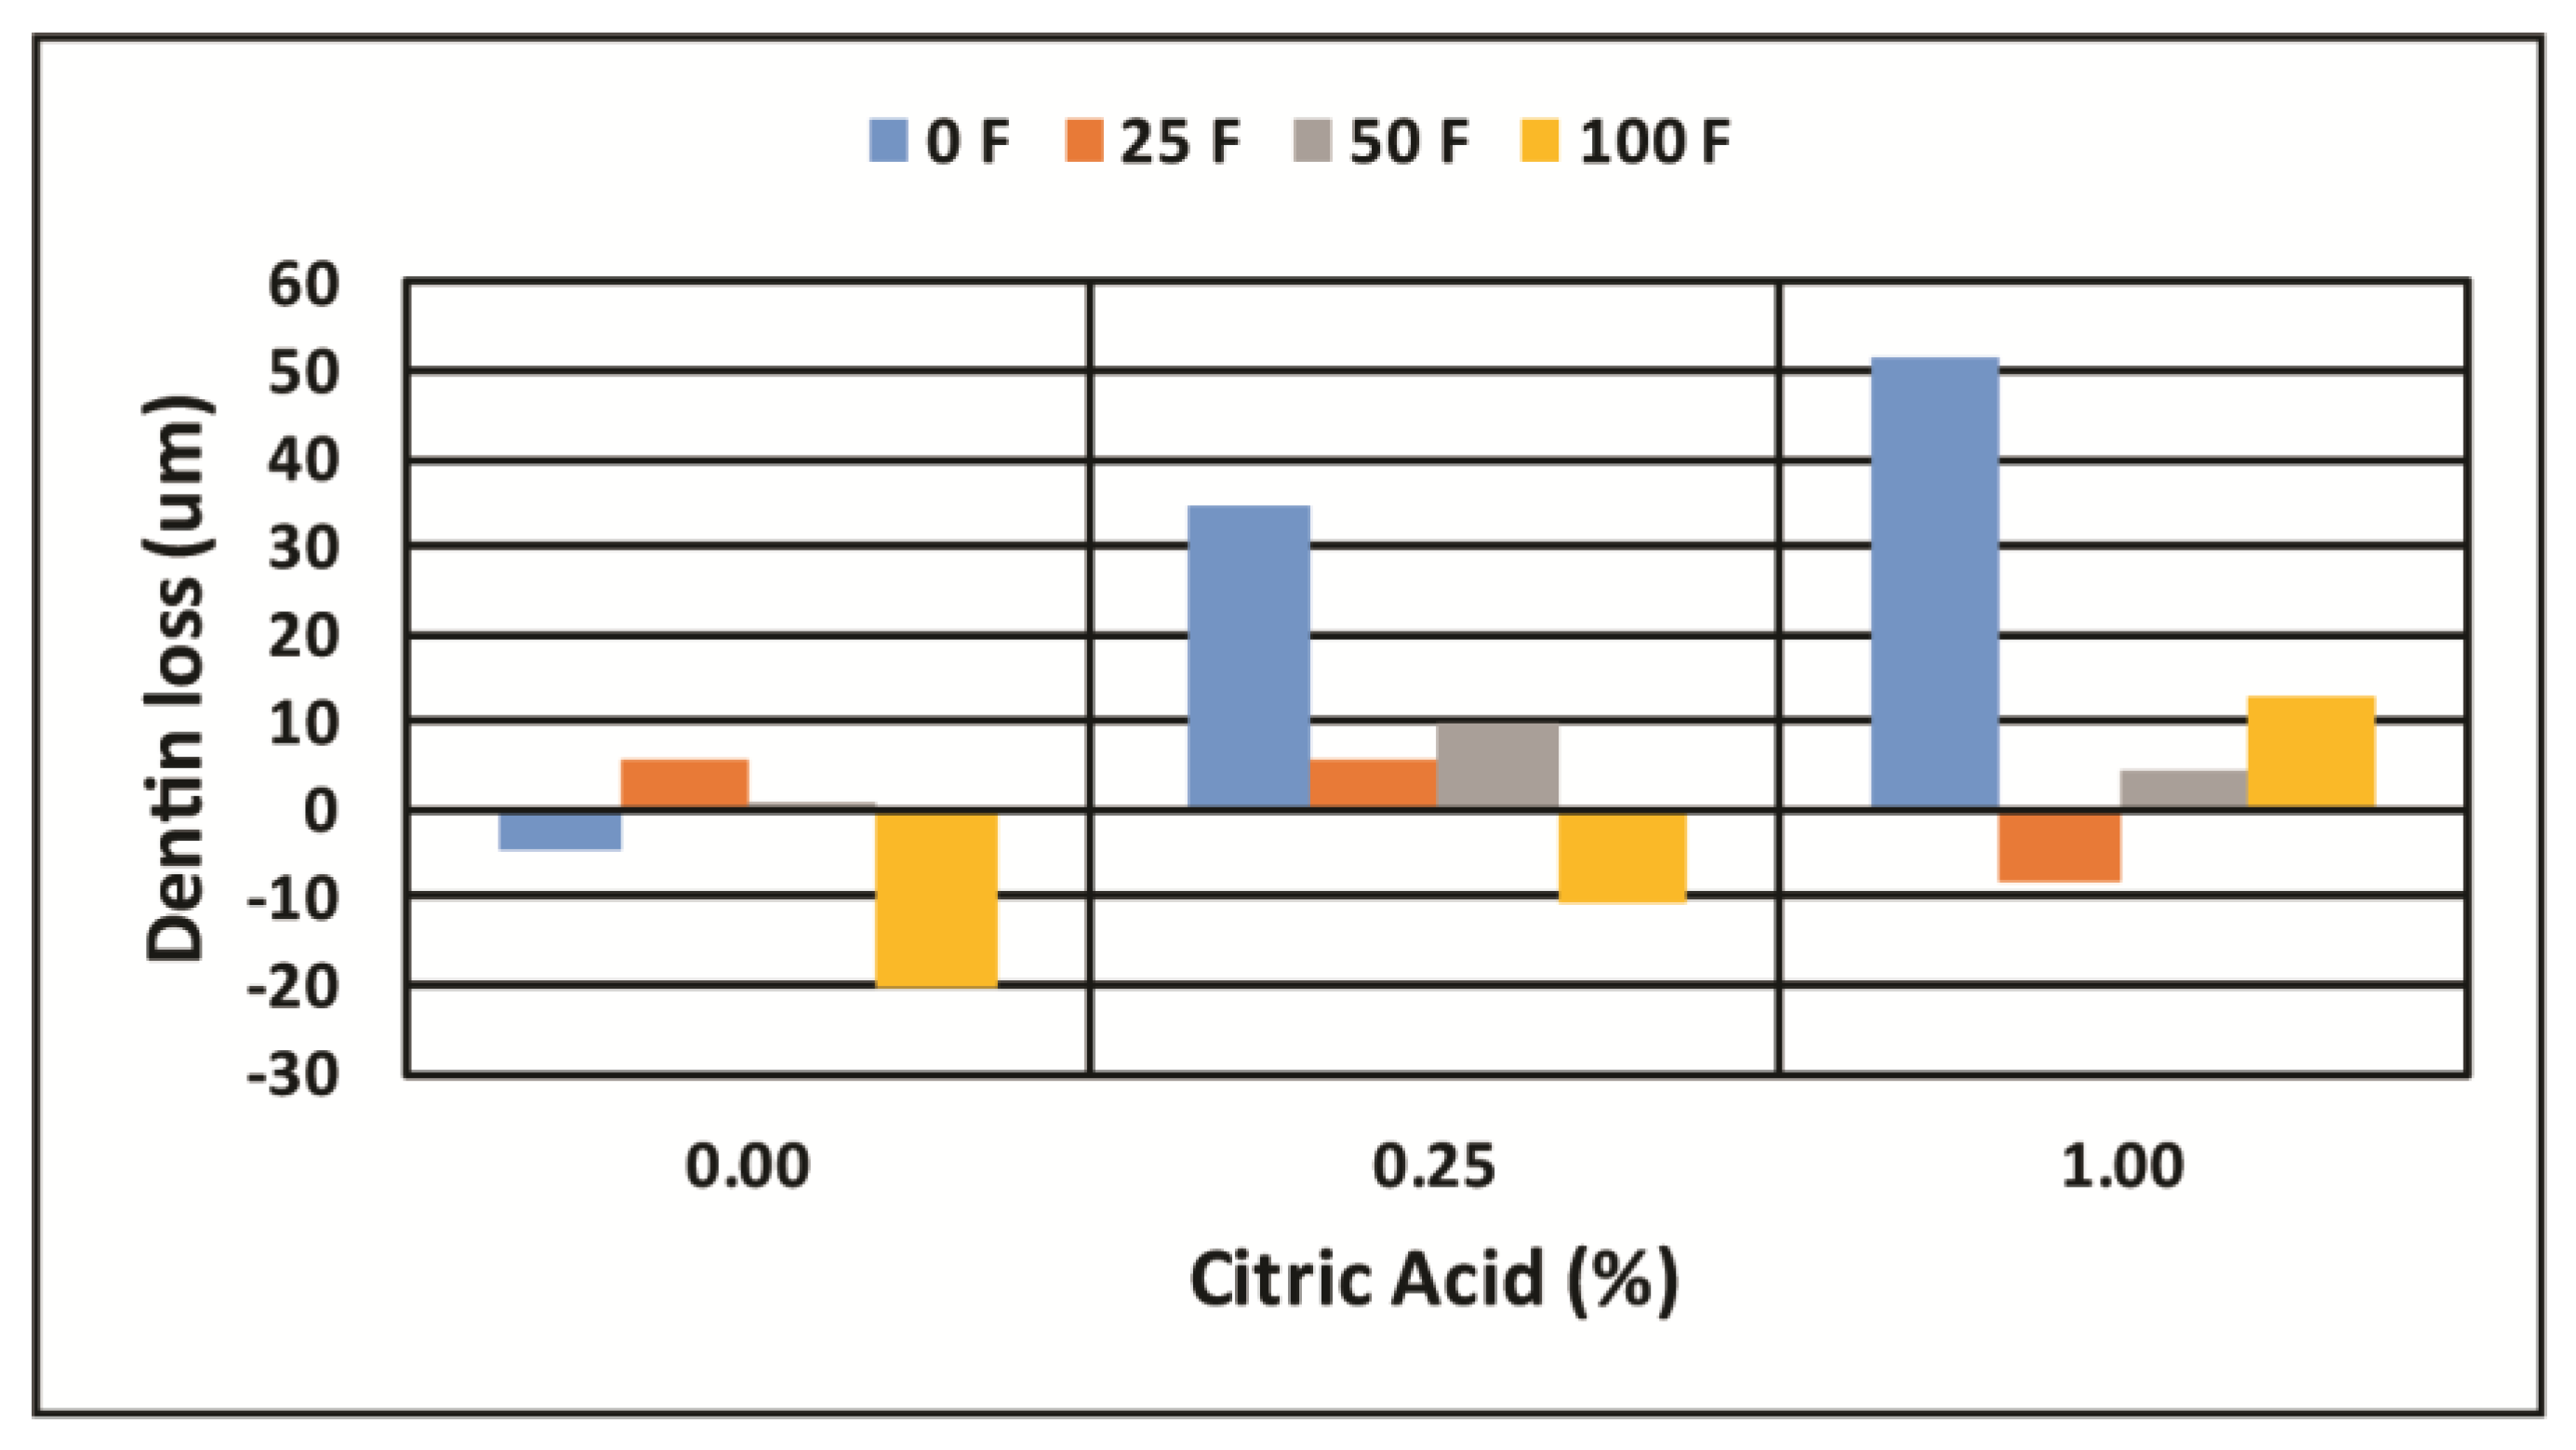
- Evaluate the effect of fluoride concentration on dentin erosion
- Evaluate the effect of citric acid concentrations on dentin erosion
- Determine if there is an interaction between fluoride and citric acid
2.1. Experimental Design
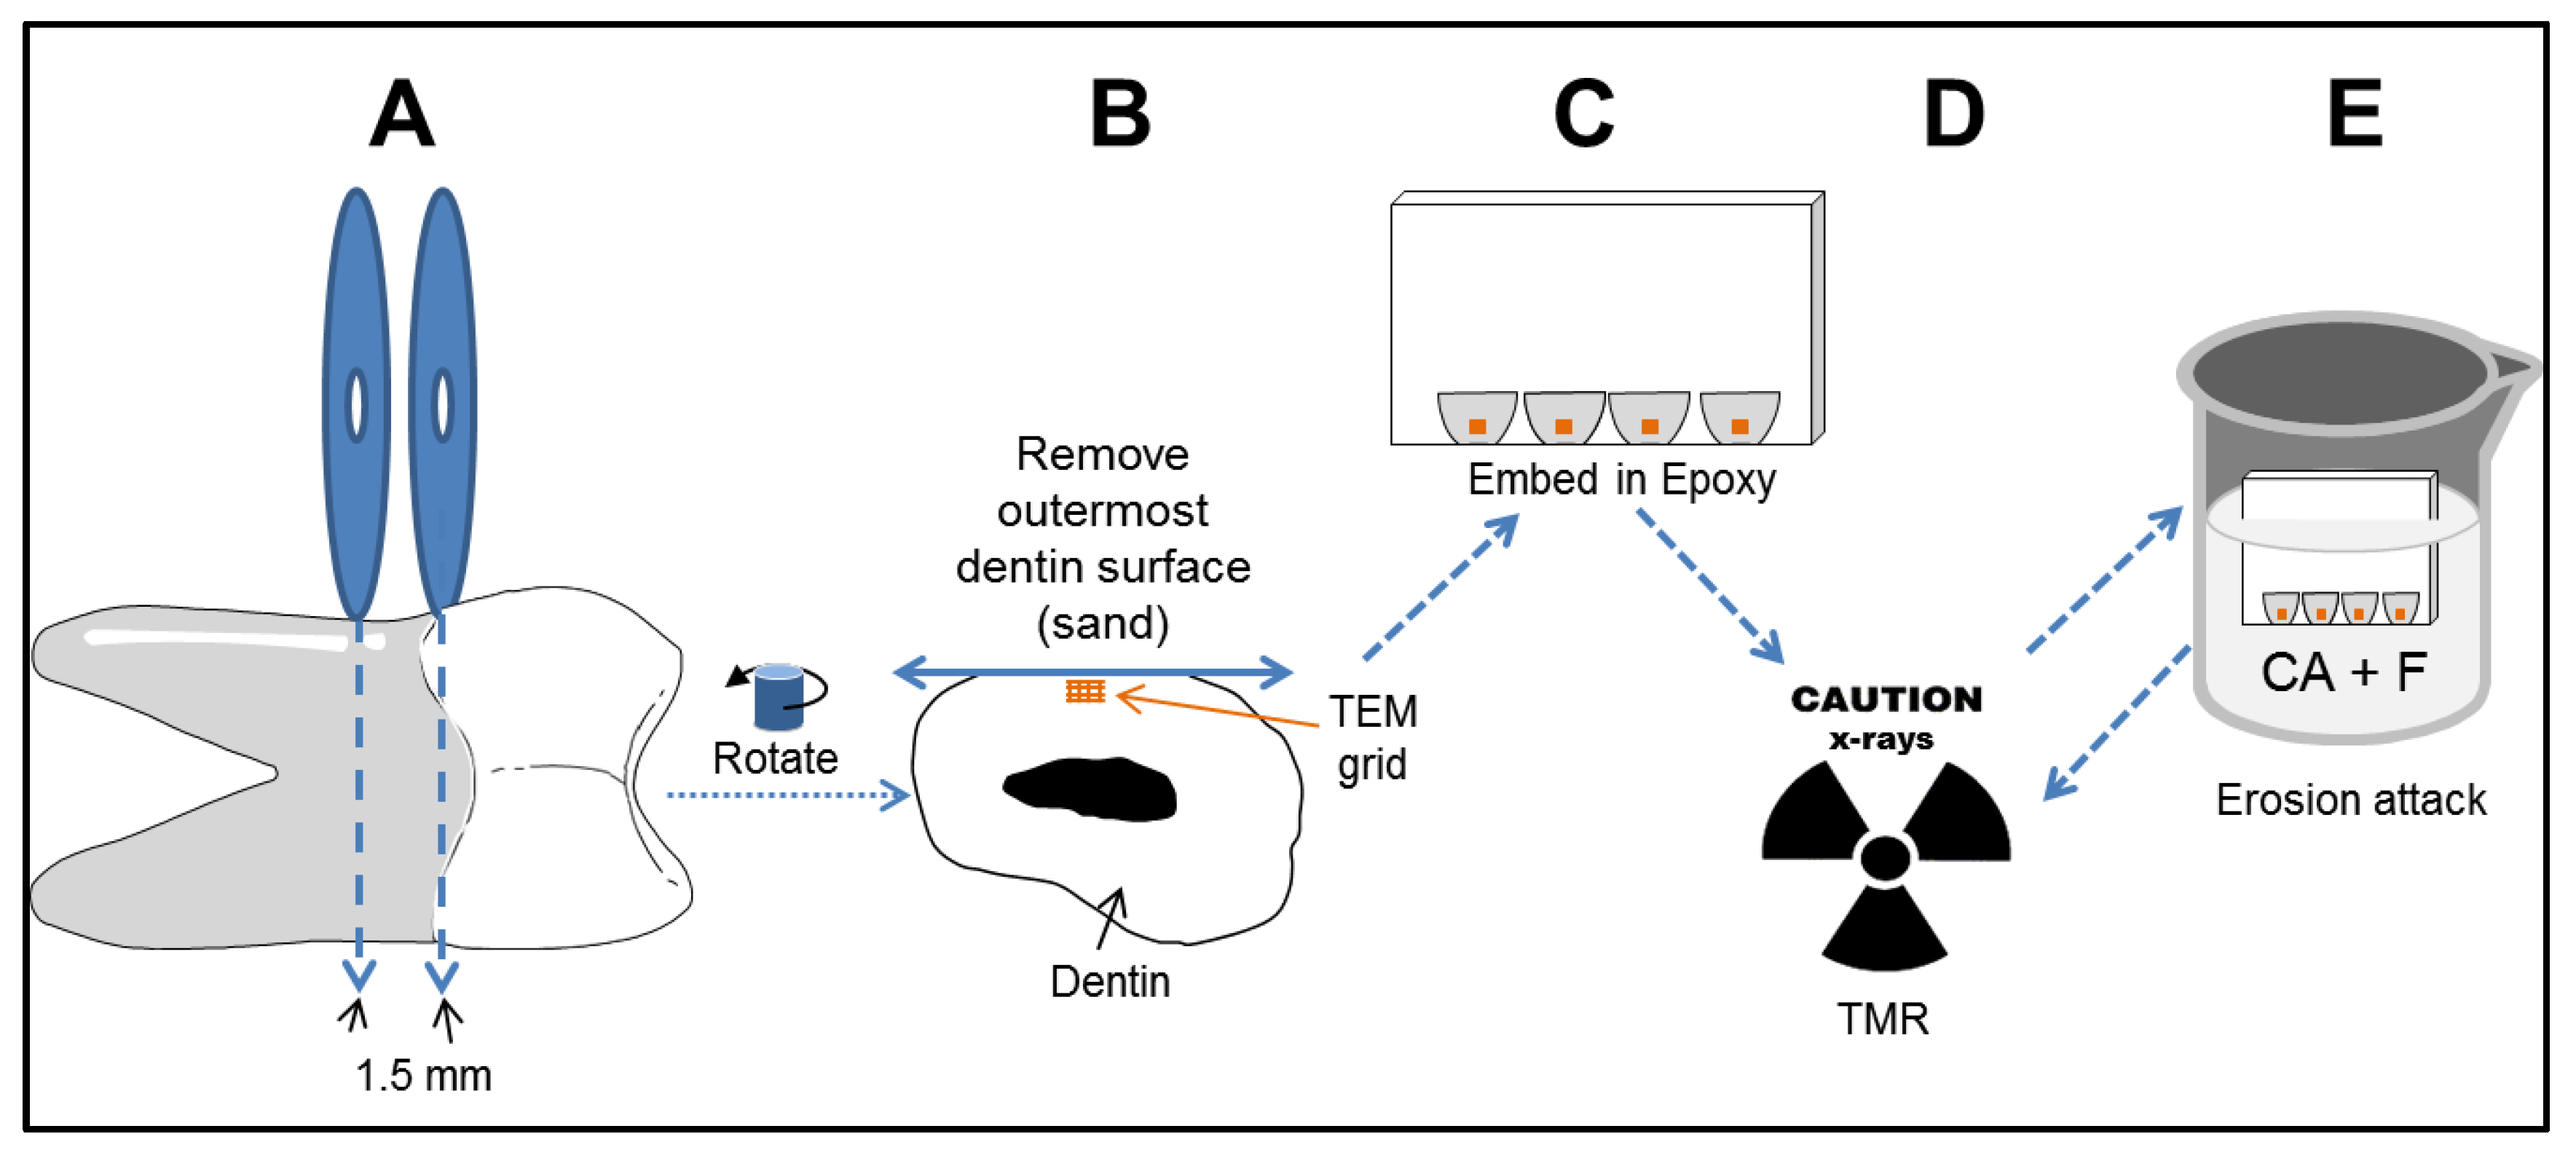
2.2. Sample Preparation
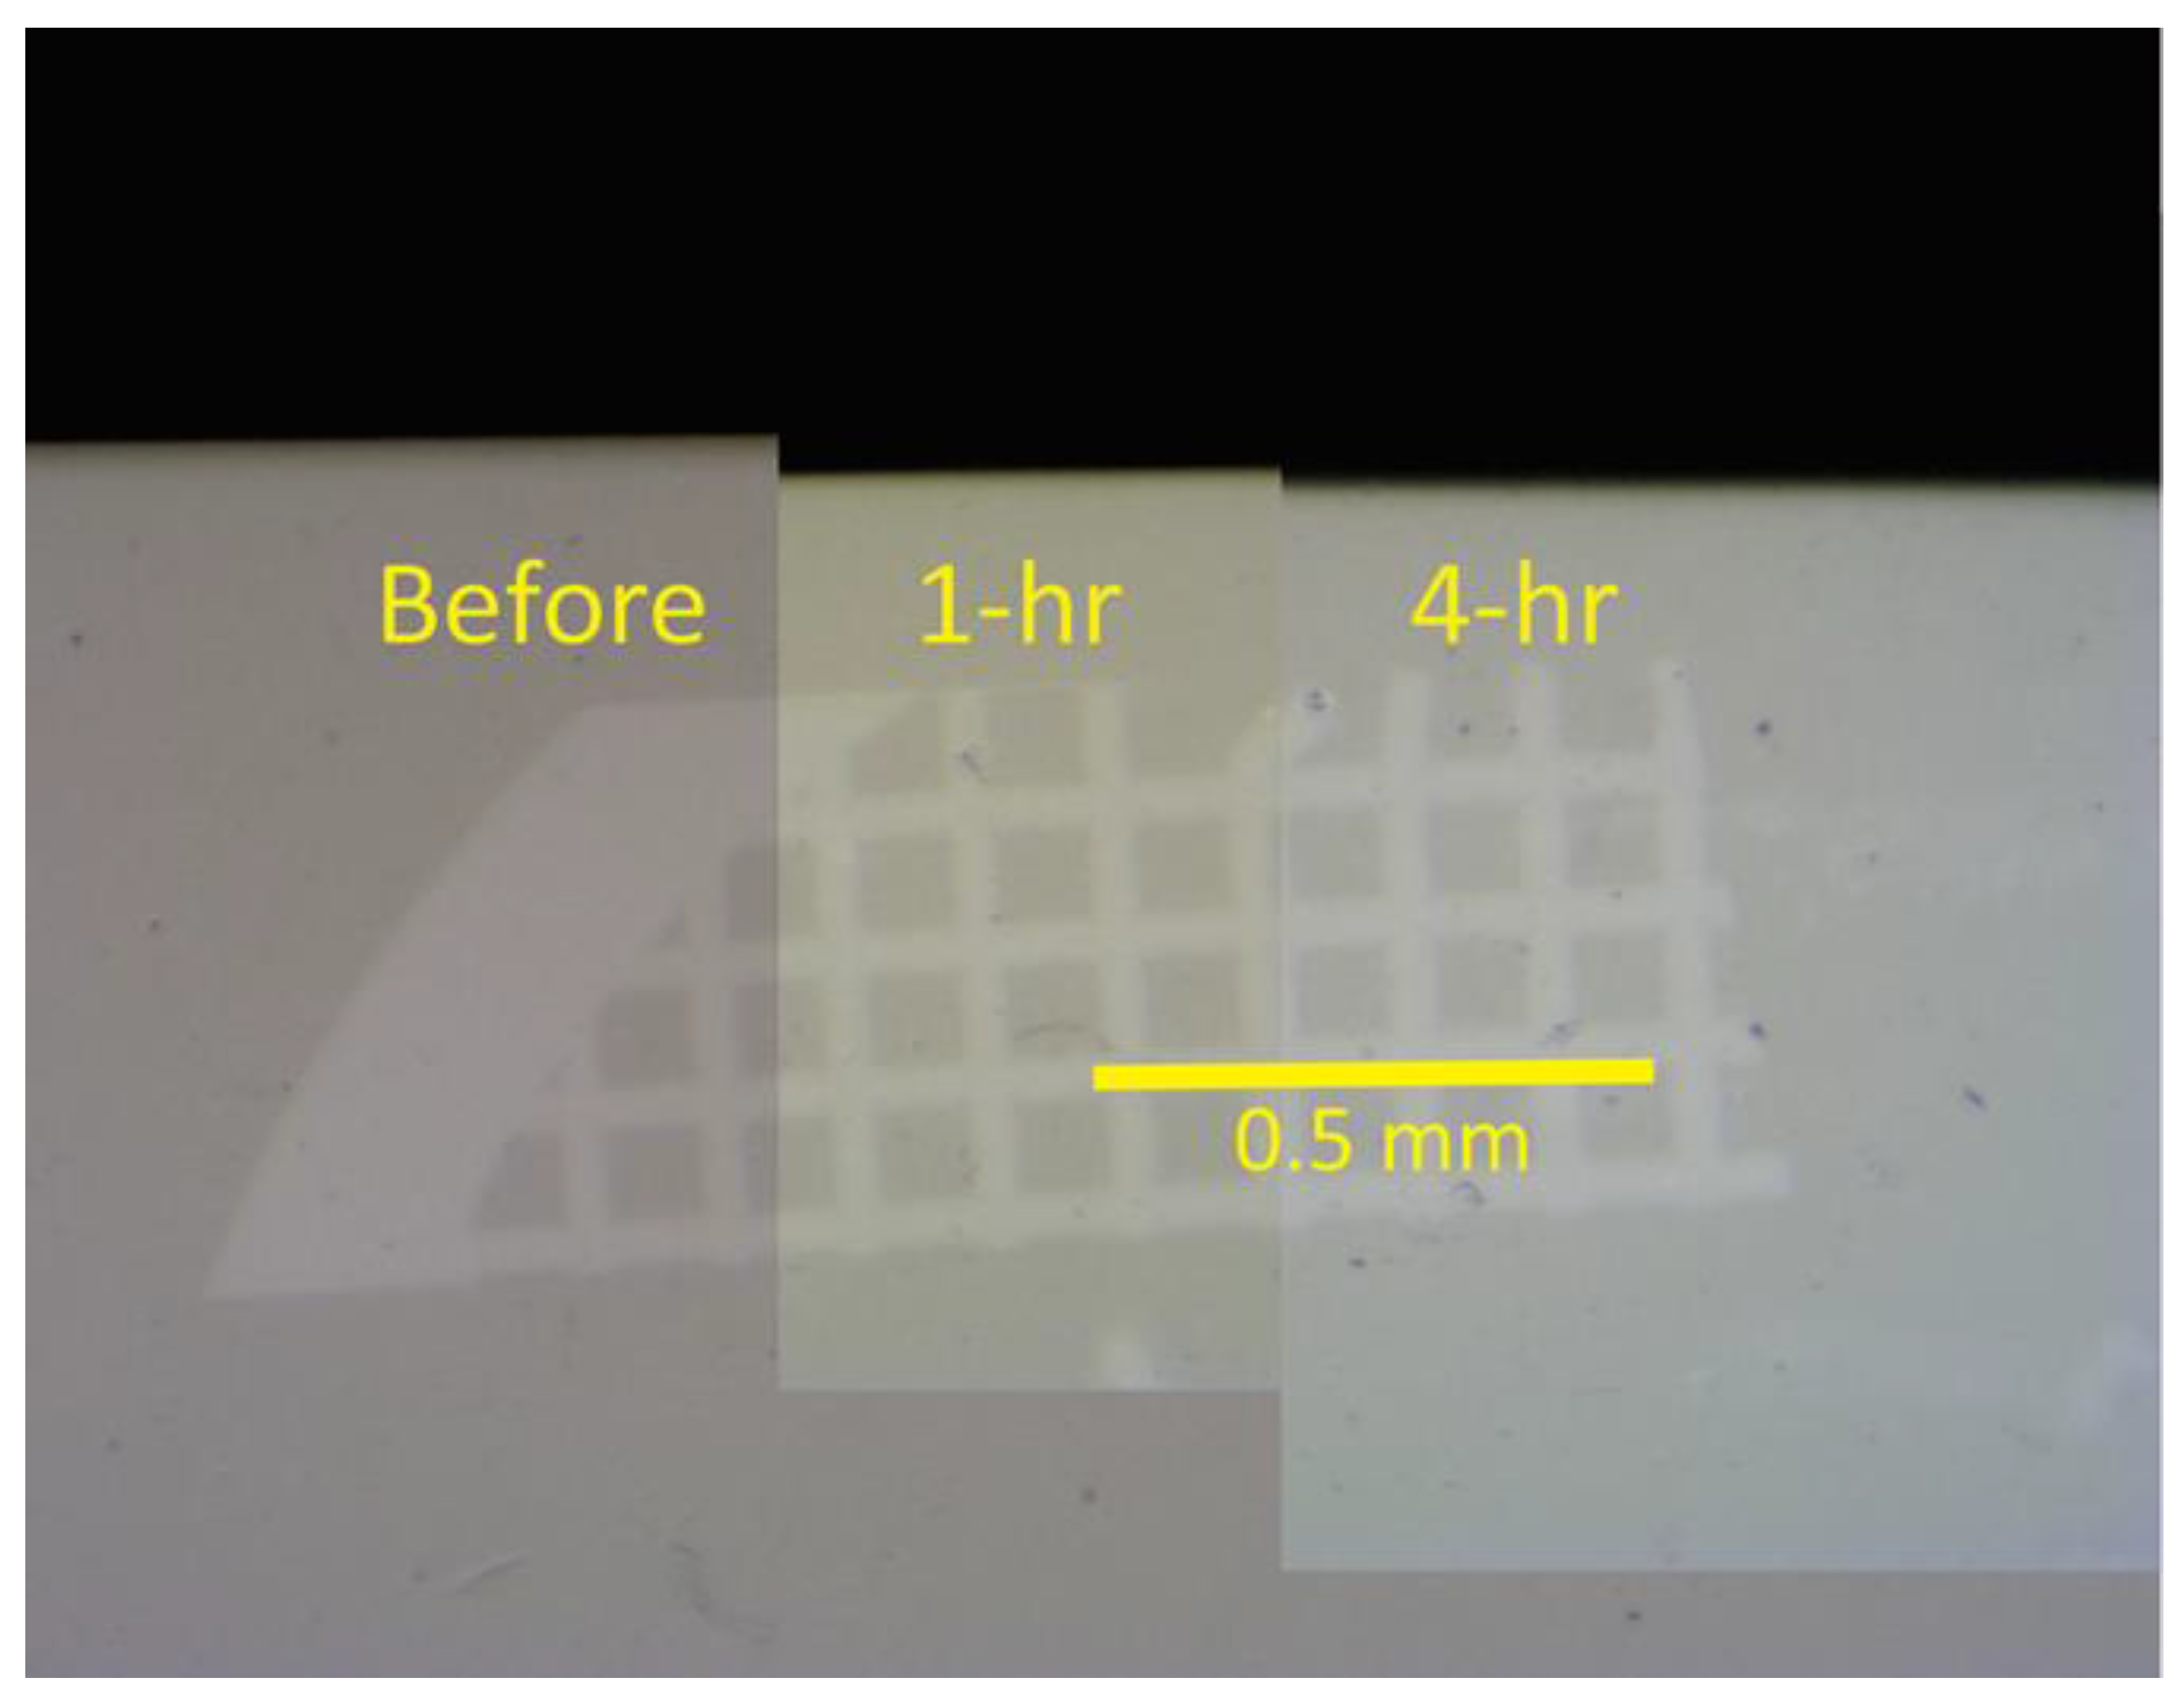
2.3. Sample Erosion and Digital Imaging
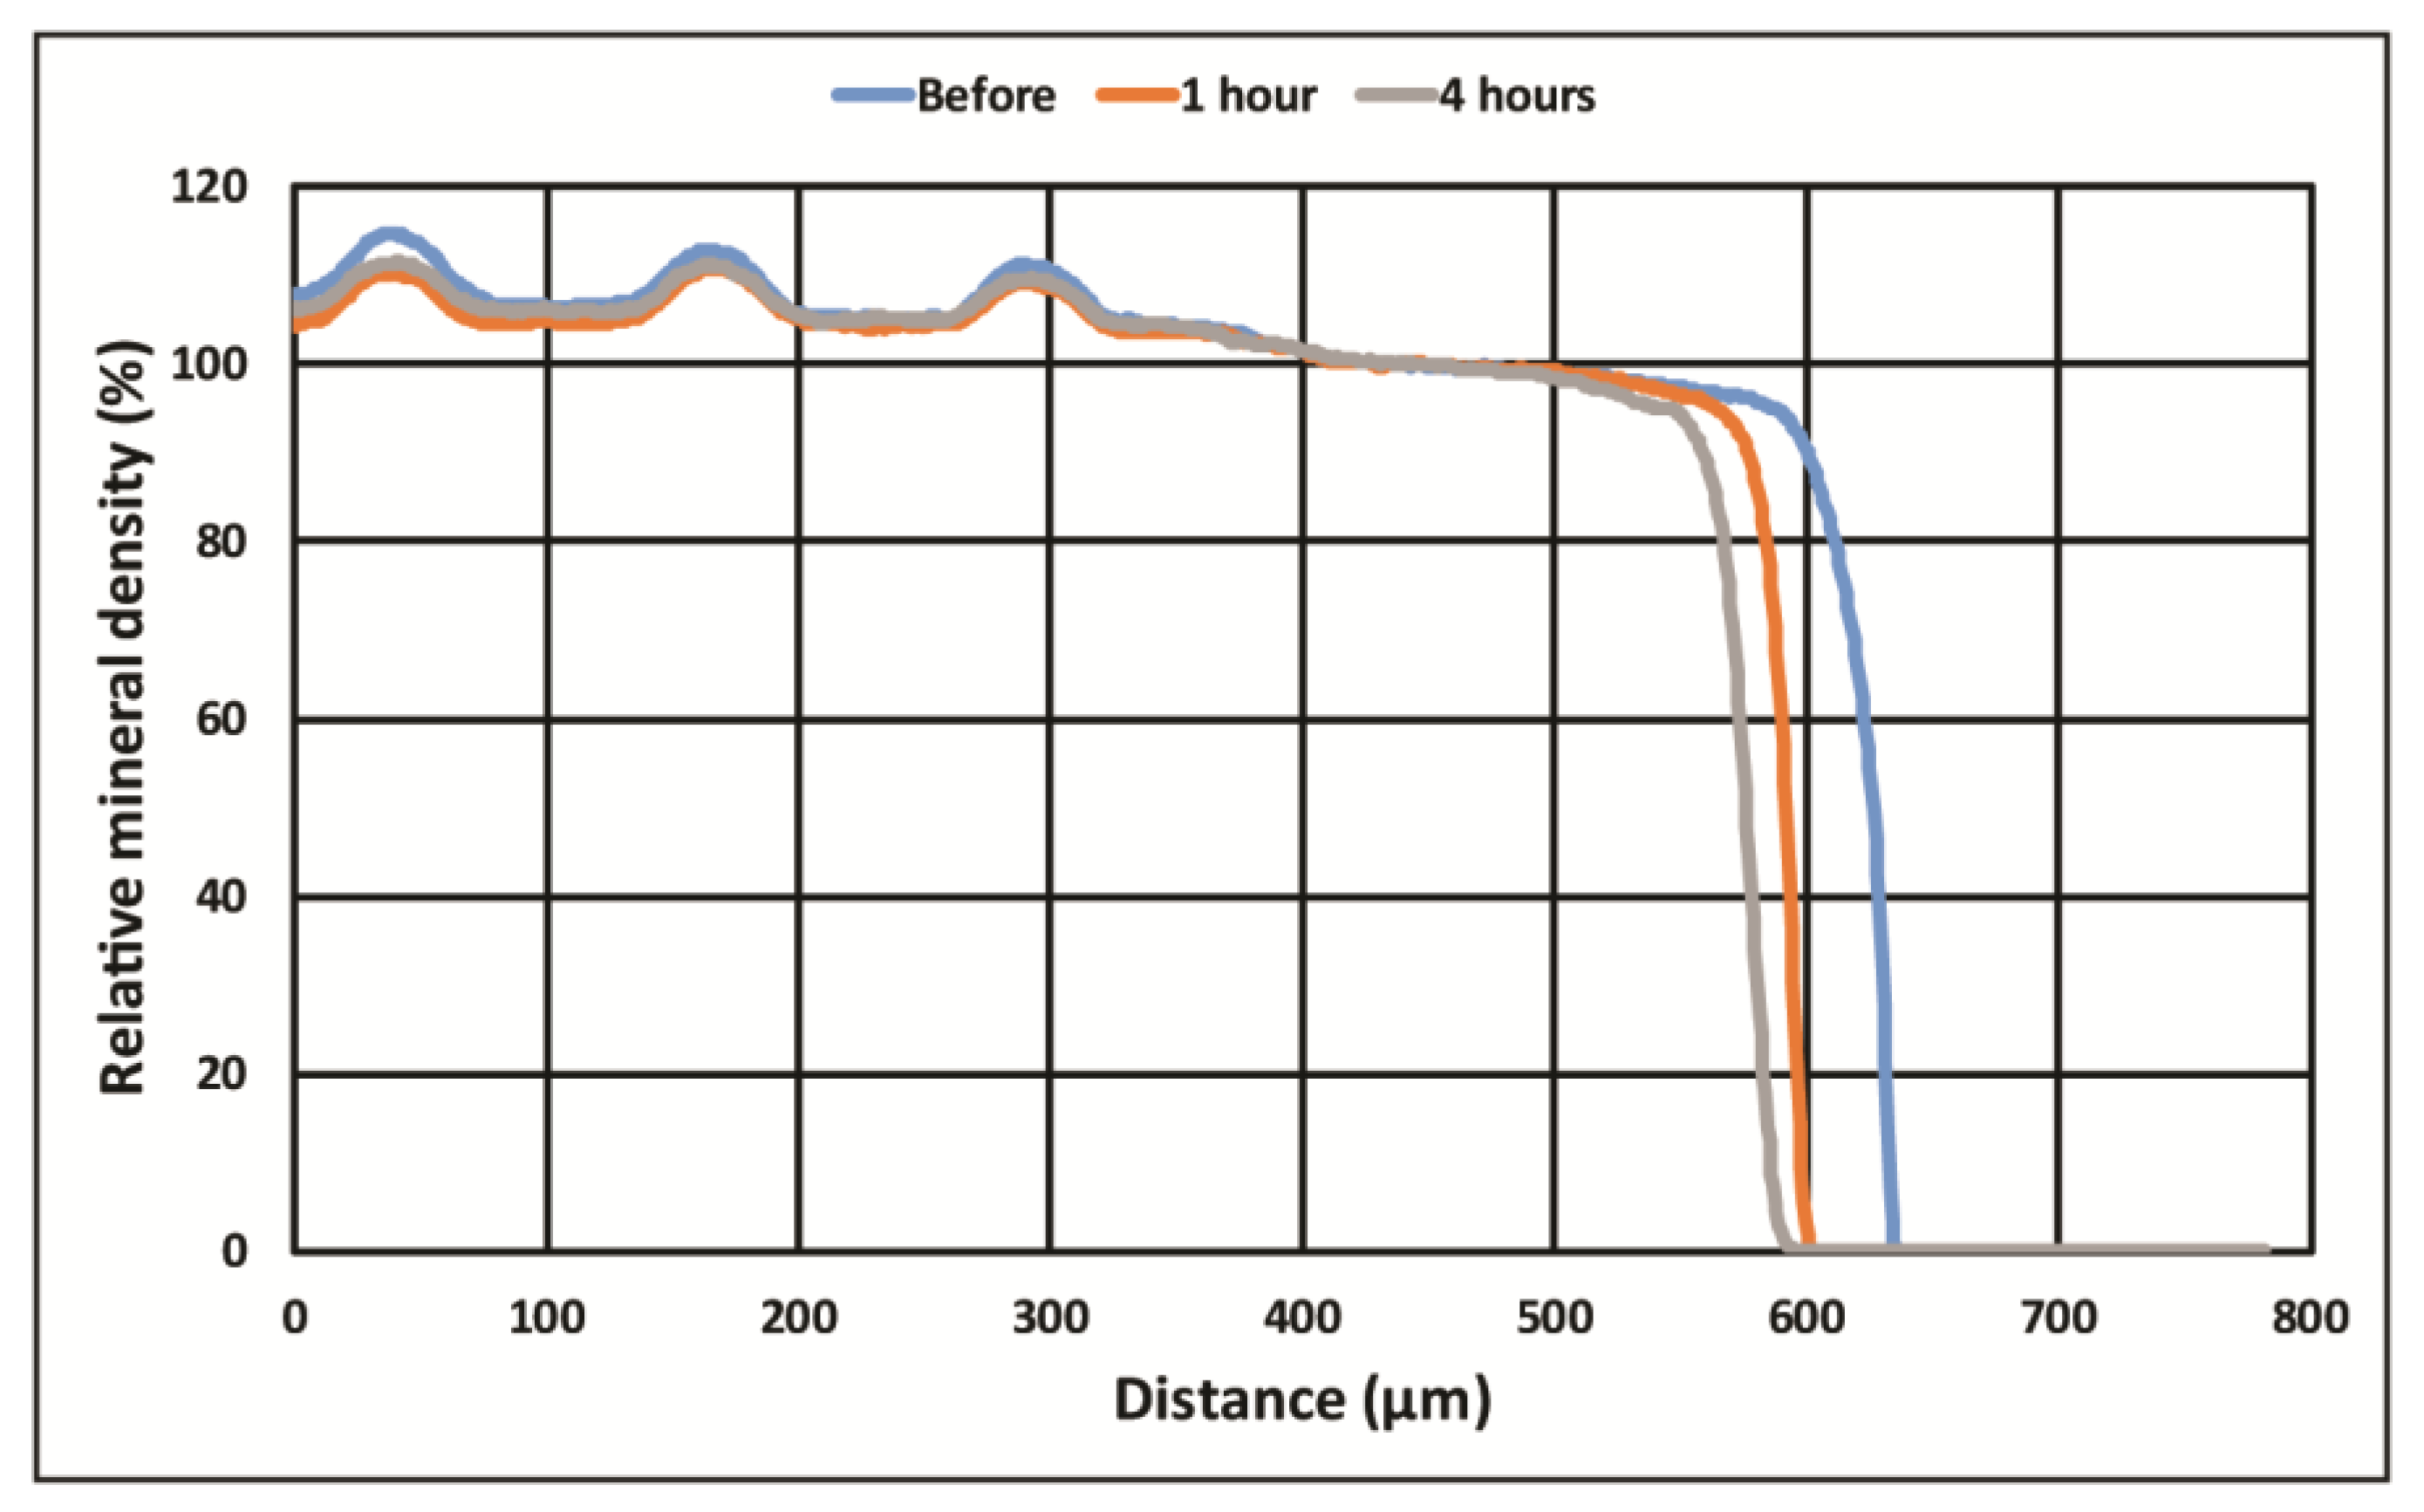
2.4. Digital Analysis
2.5. Statistical Evaluations
3. Results
4. Discussion
5. Conclusions
Acknowledgments
Author Contributions
Conflicts of Interest
References
- Ganss, C. Definition of erosion and links to tooth wear. In Dental Erosion; Lussi, A., Ed.; Karger: Basil, Switzerland, 2007; Volume 20, pp. 9–16. [Google Scholar]
- Kreulen, C.; Van’t Spijker, A.; Rodriguez, J.; Bronkhorst, E.; Creugers, N.; Bartlett, D.W. Systematic review of the prevalence of tooth wear in children and adolescents. Caries Res. 2010, 44, 151–159. [Google Scholar] [CrossRef] [PubMed]
- O’Sullivan, E.; Milosevic, A. UK National Clinical Guidelines in Paediatric Dentistry: Diagnosis, prevention and management of dental erosion. Int. J. Paediatr. Dent. 2008, 18, 29–38. [Google Scholar] [CrossRef] [PubMed]
- Wiegand, A.; Attin, T. Occupational dental erosion from exposure to acids: A review. Occup. Med. 2007, 57, 169–176. [Google Scholar] [CrossRef] [PubMed]
- Hamasha, A.A.; Zawaideh, F.I.; Al-Hadithy, R.T. Risk indicators associated with dental erosion among Jordanian school children aged 12–14 years of age. Int. J. Paediatr. Dent. 2013, 24, 56–68. [Google Scholar] [CrossRef] [PubMed]
- Piangprach, T.; Hengtrakool, C.; Kukiattrakoon, B.; Kedjarune-Leggat, U. The effect of salivary factors on dental erosion in various age groups and tooth surfaces. J. Am. Dent. Assoc. 2009, 140, 1137–1143. [Google Scholar] [CrossRef] [PubMed]
- Li, H.; Zou, Y.; Ding, G. Dietary factors associated with dental erosion: A meta-analysis. PLoS ONE 2012, 7, e42626. [Google Scholar] [CrossRef] [PubMed]
- Lussi, A.; Schaffner, M.; Hotz, P.; Suter, P. Dental erosion in a population of Swiss adults. Commun. Dent. Oral Epidemiol. 1991, 19, 286–290. [Google Scholar] [CrossRef]
- Salas, M.M.S.; Nascimento, G.G.; Huysmans, M.C.; Demarco, F.F. Estimated prevalence of erosive tooth wear in permanent teeth of children and adolescents: An epidemiological systematic review and meta-regression analysis. J. Dent. 2015, 43, 42–50. [Google Scholar] [CrossRef] [PubMed]
- Jaeggi, T.; Lussi, A. Prevalence, incidence and distribution of erosion. In Erosive Tooth Wear; Lussi, A., Ganss, C., Eds.; Karger: Basil, Switzerland, 2014; Volume 25, pp. 55–73. [Google Scholar]
- Bartlett, D.; Dugmore, C. Pathological or physiological erosion—Is there a relationship to age? Clin. Oral Investig. 2008, 12, S27–S31. [Google Scholar] [CrossRef] [PubMed]
- Ganss, C.; Klimek, J.; Brune, V.; Schurmann, A. Effects of two fluoridation measures on erosion progression in human enamel and dentine in situ. Caries Res. 2004, 38, 561–566. [Google Scholar] [CrossRef] [PubMed]
- Diamanti, I.; Koletsi-Kounari, H.; Mamai-Homata, E. Effect of toothpastes containing different NaF concentrations or a SnF2/NaF combination on root dentine erosive lesions, in vivo. J. Clin. Exp. Dent. 2016, 8, e577–e583. [Google Scholar] [CrossRef] [PubMed]
- Moron, B.M.; Miyazaki, S.S.H.; Ito, N.; Wiegand, A.; Vihena, F.; Buzalaf, M.A.R.; Magalhaes, A.C. Impact of different fluoride concentrations and pH of dentifrices on tooth erosion/abrasion in vitro. Aust. Dent. J. 2013, 58, 106–111. [Google Scholar] [CrossRef] [PubMed]
- Magalhaes, A.C.; Wiegand, A.; Rios, D.; Buzalaf, M.A.R.; Lussi, A. Fluoride in dental erosion. In Fluoride and the Oral Environment; Buzalaf, M.A.R., Ed.; Karger: Basil, Switzerland, 2011; Volume 22, pp. 158–170. [Google Scholar]
- Carey, C.M.; McCracken, J.M.; Schmuck, B.D. Fluoride concentration required to prevent citric acid erosion of enamel. Available online: https://www.researchgate.net/publication/266775448_Fluoride_Concentration_Required_to_Prevent_Citric_Acid_Erosion_of_Enamel (accessed on 23 July 2017).
- Zimmer, S.; Kirchner, G.; Bizhang, M.; Benedix, M. Influence of various acidic beverages on tooth erosion. Evaluation by a new method. PLoS ONE 2015, 10, e0129462. [Google Scholar] [CrossRef] [PubMed]
- Schwendicke, F.; Felstehausen, G.; Carey, C.M.; Dorfer, C. Comparison of four methods to assess erosive substance loss of dentin. PLoS ONE 2014, 9, e108064. [Google Scholar] [CrossRef] [PubMed]
- Schmuck, B.D.; Carey, C.M. Improved contact X-ray microradiographic method to measure mineral density of hard dental tissues. J. Res. Nat. Inst. Stand. Technol. 2010, 115, 75–83. [Google Scholar] [CrossRef]
- Weatherell, J.A.; Deutsch, D.; Robinson, C.; Hallsworth, A.S. Assimilation of fluoride by enamel throughout the life of the tooth. Caries Res. 1977, 11, 85–115. [Google Scholar] [CrossRef] [PubMed]
- Magnus, L.; Maltz, M.; Bavaresco, C.; Bastos, L.F.; Hashizume, L.N. Biochemical composition of carious dentin and different layers of sound dentin. J. Oral Sci. 2013, 55, 133–137. [Google Scholar] [CrossRef] [PubMed]
- International Organization for Standardization. ISO 28888:2013 Dentistry—Screening Method for Erosion Potential of Oral Rinses on Dental Hard Tissues; International Organization for Standardization: Geneva, Switzerland, 2013; pp. 1–5. [Google Scholar]


| 1 h | Fluoride (ug/g) | |||||||||||
|---|---|---|---|---|---|---|---|---|---|---|---|---|
| Citric Acid (%) | 0 | 25 | 50 | 100 | ||||||||
| 0.00 | −4.9 | ± | 3.3 BCD | 5.5 | ± | 3.8 B | 0.4 | ± | 3.6 BCDE | −20.5 | ± | 5.3 A |
| 0.25 | 34.7 | ± | 5.2 G | 5.6 | ± | 4.5 DEF | 9.8 | ± | 4.8 EF | −10.4 | ± | 5.8 B |
| 1.00 | 51.7 | ± | 15.2 G | −8.1 | ± | 7.3 BC | 4.4 | ± | 8.9 CDEF | 13.1 | ± | 4.1 F |
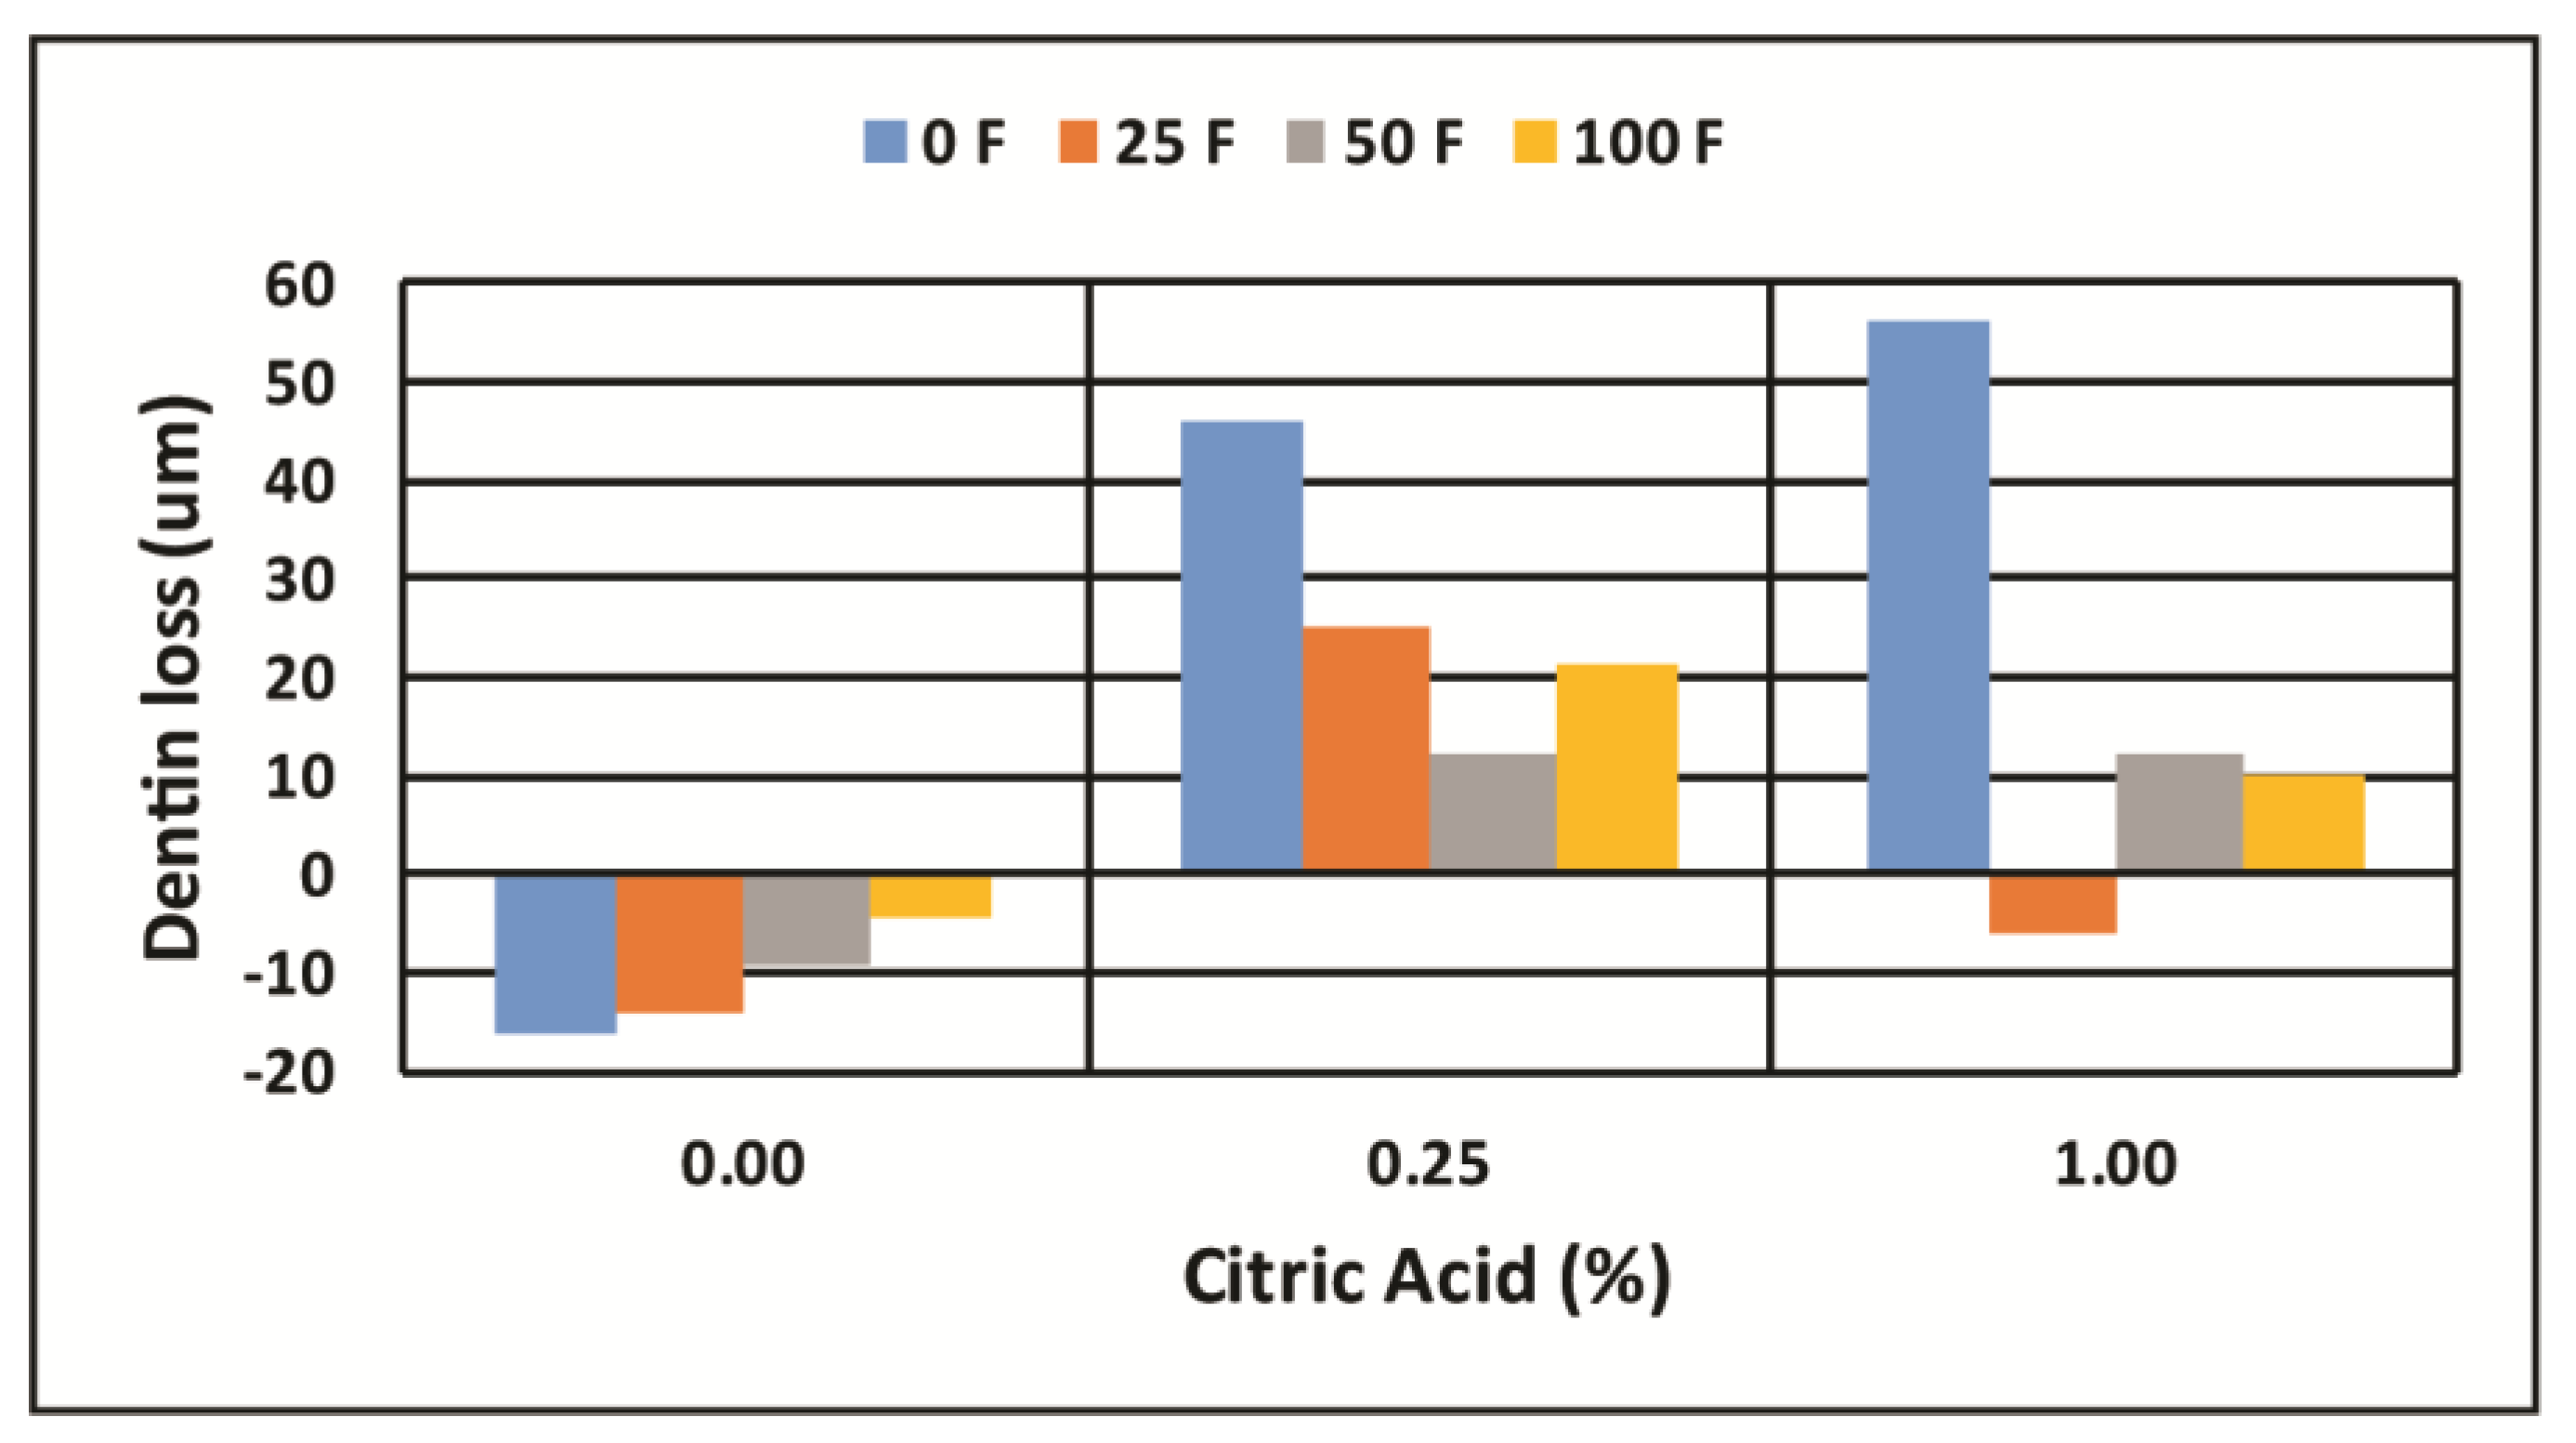
| 4 h | Fluoride (ug/g) | |||||||||||
|---|---|---|---|---|---|---|---|---|---|---|---|---|
| Citric Acid (%) | 0 | 25 | 50 | 100 | ||||||||
| 0.00 | −16.0 | ± | 5.7 A | −14.3 | ± | 10.0 A | −9.5 | ± | 5.1 A | −4.6 | ± | 3.1 A |
| 0.25 | 45.8 | ± | 7.5 C | 25.1 | ± | 8.8 B | 12.0 | ± | 8.2 B | 21.4 | ± | 7.2 B |
| 1.00 | 56.1 | ± | 14.3 C | −5.8 | ± | 8.3 A | 12.0 | ± | 12.3 B | 9.9 | ± | 4.7 B |
| A. ANOVA (Two-Factor with Replication) 1 h | |||||
|---|---|---|---|---|---|
| Source of Variation | SS | df | MS | F | p-Value |
| Fluoride | 7345.772 | 3 | 2448.591 | 53.25291 | 2.570 × 10⁻¹³ |
| CA | 3485.981 | 2 | 1742.991 | 37.90724 | 1.382 × 10⁻⁹ |
| F × CA | 6296.924 | 6 | 1049.487 | 22.82466 | 6.592 × 10⁻¹¹ |
| Within | 1655.295 | 36 | 45.98041 | ||
| Total | 18783.97 | 47 | |||
| B. ANOVA (Two-Factor with Replication) 4 h | |||||
| Source of Variation | SS | df | MS | F | p-Value |
| Fluoride | 5269.387 | 3 | 1756.462 | 24.34624 | 8.800 × 10⁻⁹ |
| CA | 12238 | 2 | 6118.999 | 84.81514 | 2.387 × 10⁻¹⁴ |
| F × CA | 5941.714 | 6 | 990.2856 | 13.7263 | 4.782 × 10⁻⁸ |
| Within | 2597.225 | 36 | 72.14513 | ||
| Total | 26046.32 | 47 | |||
© 2017 by the authors. Licensee MDPI, Basel, Switzerland. This article is an open access article distributed under the terms and conditions of the Creative Commons Attribution (CC BY) license (http://creativecommons.org/licenses/by/4.0/).
Share and Cite
Carey, C.M.; Brown, W. Dentin Erosion: Method Validation and Efficacy of Fluoride Protection. Dent. J. 2017, 5, 27. https://doi.org/10.3390/dj5040027
Carey CM, Brown W. Dentin Erosion: Method Validation and Efficacy of Fluoride Protection. Dentistry Journal. 2017; 5(4):27. https://doi.org/10.3390/dj5040027
Chicago/Turabian StyleCarey, Clifton M., and William Brown. 2017. "Dentin Erosion: Method Validation and Efficacy of Fluoride Protection" Dentistry Journal 5, no. 4: 27. https://doi.org/10.3390/dj5040027
APA StyleCarey, C. M., & Brown, W. (2017). Dentin Erosion: Method Validation and Efficacy of Fluoride Protection. Dentistry Journal, 5(4), 27. https://doi.org/10.3390/dj5040027