Article

Dose Response Effect of Photobiomodulation on Hemodynamic Responses and Glucose Levels in Men with Type 2 Diabetes: A Randomized, Crossover, Double-Blind, Sham-Controlled Trial

by
Stephanie N. Linares
1,
Thomas Beltrame
1,2,
Gabriela A. M. Galdino
1,
Maria Cecília M. Frade
1,
Juliana C. Milan-Mattos
1,
Mariana O. Gois
1,
Audrey Borghi-Silva
1,
Priscila F. de Biase
3,
Fúlvia B. Manchado-Gobatto
3,
Vanderlei S. Bagnato
4,
Nivaldo A. Parizotto
5,6,
Cleber Ferraresi
1 and
Aparecida M. Catai
1,*
1
Department of Physical Therapy, Center for Biological and Health Sciences, Federal University of São Carlos—UFSCar, São Carlos 13565-905, SP, Brazil
2
Samsung R&D Institute Brazil (SRBR), Campinas 13097-104, SP, Brazil
3
School of Applied Sciences, University of Campinas—UNICAMP, Limeira 13484-350, SP, Brazil
4
Institute of Physics of São Carlos, University of São Paulo—USP, São Carlos 05508-060, SP, Brazil
5
Department of Physical Therapy, University of Paraíba—UFPB, João Pessoa 58051-900, PB, Brazil
6
Department of Biomedical Engineering, University Brasil—UniBrasil, São Paulo 08230-030, SP, Brazil
*
Author to whom correspondence should be addressed.
Photonics 2022, 9(7), 481; https://doi.org/10.3390/photonics9070481
Submission received: 2 June 2022 / Accepted: 5 July 2022 / Published: 11 July 2022

Abstract

:
This study verifies the acute dose response effect of photobiomodulation (PBM) by light emitting diodes (LEDs) on hemodynamic and metabolic responses in individuals with type 2 diabetes mellitus (T2DM). Thirteen participants with T2DM (age 52 ± 7 years) received PBM by a light-emitting diode array (50 GaAIAs LEDs, 850 ± 20 nm, 75 mW per diode) on the rectus and oblique abdomen, quadriceps femoris, triceps surae, and hamstring muscle areas, bilaterally, using different energy treatments (sham, 75, 150, 300, 450, and 600 Joules) in random order with a washout of at least 15 days apart. The PBM by LEDs statistically decreased plasma glucose levels (primary outcome) in 15 min after application of the 75 and 450 J irradiation protocol, reduced blood lactate levels 15 min after application of the 75, 450, and 600 J irradiation protocol, increased cardiac output ( Q ˙ ) and cardiac index (CI) in the 1st minute after application of the 75 and 300 J irradiation protocol, and reduced Q ˙ and heart rate (HR) in the 15 min after application of the 300 J and 600 J irradiation protocol, respectively. For hemodynamic variables, including Q ˙ , total peripheral resistance (TPR), and HR, we observed that the ideal therapeutic window ranged between 75 and 300 J, while for metabolic variables, glucose and lactate, the variation was between 450 and 600 J.

1. Introduction

Type 2 diabetes mellitus (T2DM) is described as a metabolic disorder characterized by insulin resistance and failure of pancreatic β-cell function [1,2,3,4]. The persistence of the hyperglycemic state is the main triggering factor for micro and macrovascular damage and dysfunction, which occurs due to metabolic and structural disorders, that includes the pathological effects of advanced glycation end-product (AGE) accumulation, abnormal activation of signaling cascades (protein kinase C [PKC]), increased production of reactive oxygen species (ROS), oxygen-containing molecules that can interact with other biomolecules, resulting in tissue damage, and abnormal stimulation of hemodynamic regulation systems [3,5].
Diet and lifestyle interventions remain the cornerstones in the management of T2DM. However, in recent years, studies have investigated the possibility of new therapy methods and identified the photobiomodulation (PBM) as a new interesting possibility [6,7]. Therefore, the concept and clinical importance of PBM have obtained notoriety in the scientific community over the past few years for being a non-invasive therapeutic modality that consists of the application of low-intensity light source to stimulate biological activities at the target tissue [8,9,10,11,12].
A previous randomized clinical trial from our groups [7] observed the acute effects of PBM using light emitting diodes (LEDs) (with a wavelength of 850 ± 20 nm) on the muscle oxygenation dynamics during transition from rest to exercise, and on fasting plasma glucose and lactate levels in individuals with T2DM. They identified that the combination of 150 Joules (J) of total energy per muscle with physical exercise was able to promote a significant reduction in fasting plasma glucose levels in post-exercise recovery [7].
As also previously showed, the effects of PBM have been widely studied in cell culture [13,14], animal models [12,15,16,17], combining physical exercise [7,18] with muscle performance [19] and post-exercise recovery [19,20]. However, the effects of the different energies of PBM by LEDs on the cardiovascular and/or hemodynamic and metabolic systems in individuals with T2DM are still not clear, and the optimal doses have not yet been defined. It was hypothesized that the application of PBM is capable of decreasing total peripheral resistance (TPR) and fasting plasma glucose levels in individuals with T2DM.
Therefore, the main objective of this study is to analyze the acute effects of different PBM energies using LEDs in the hemodynamic and metabolic systems in individuals with T2DM and to establish a dose response curve.

2. Materials and Methods
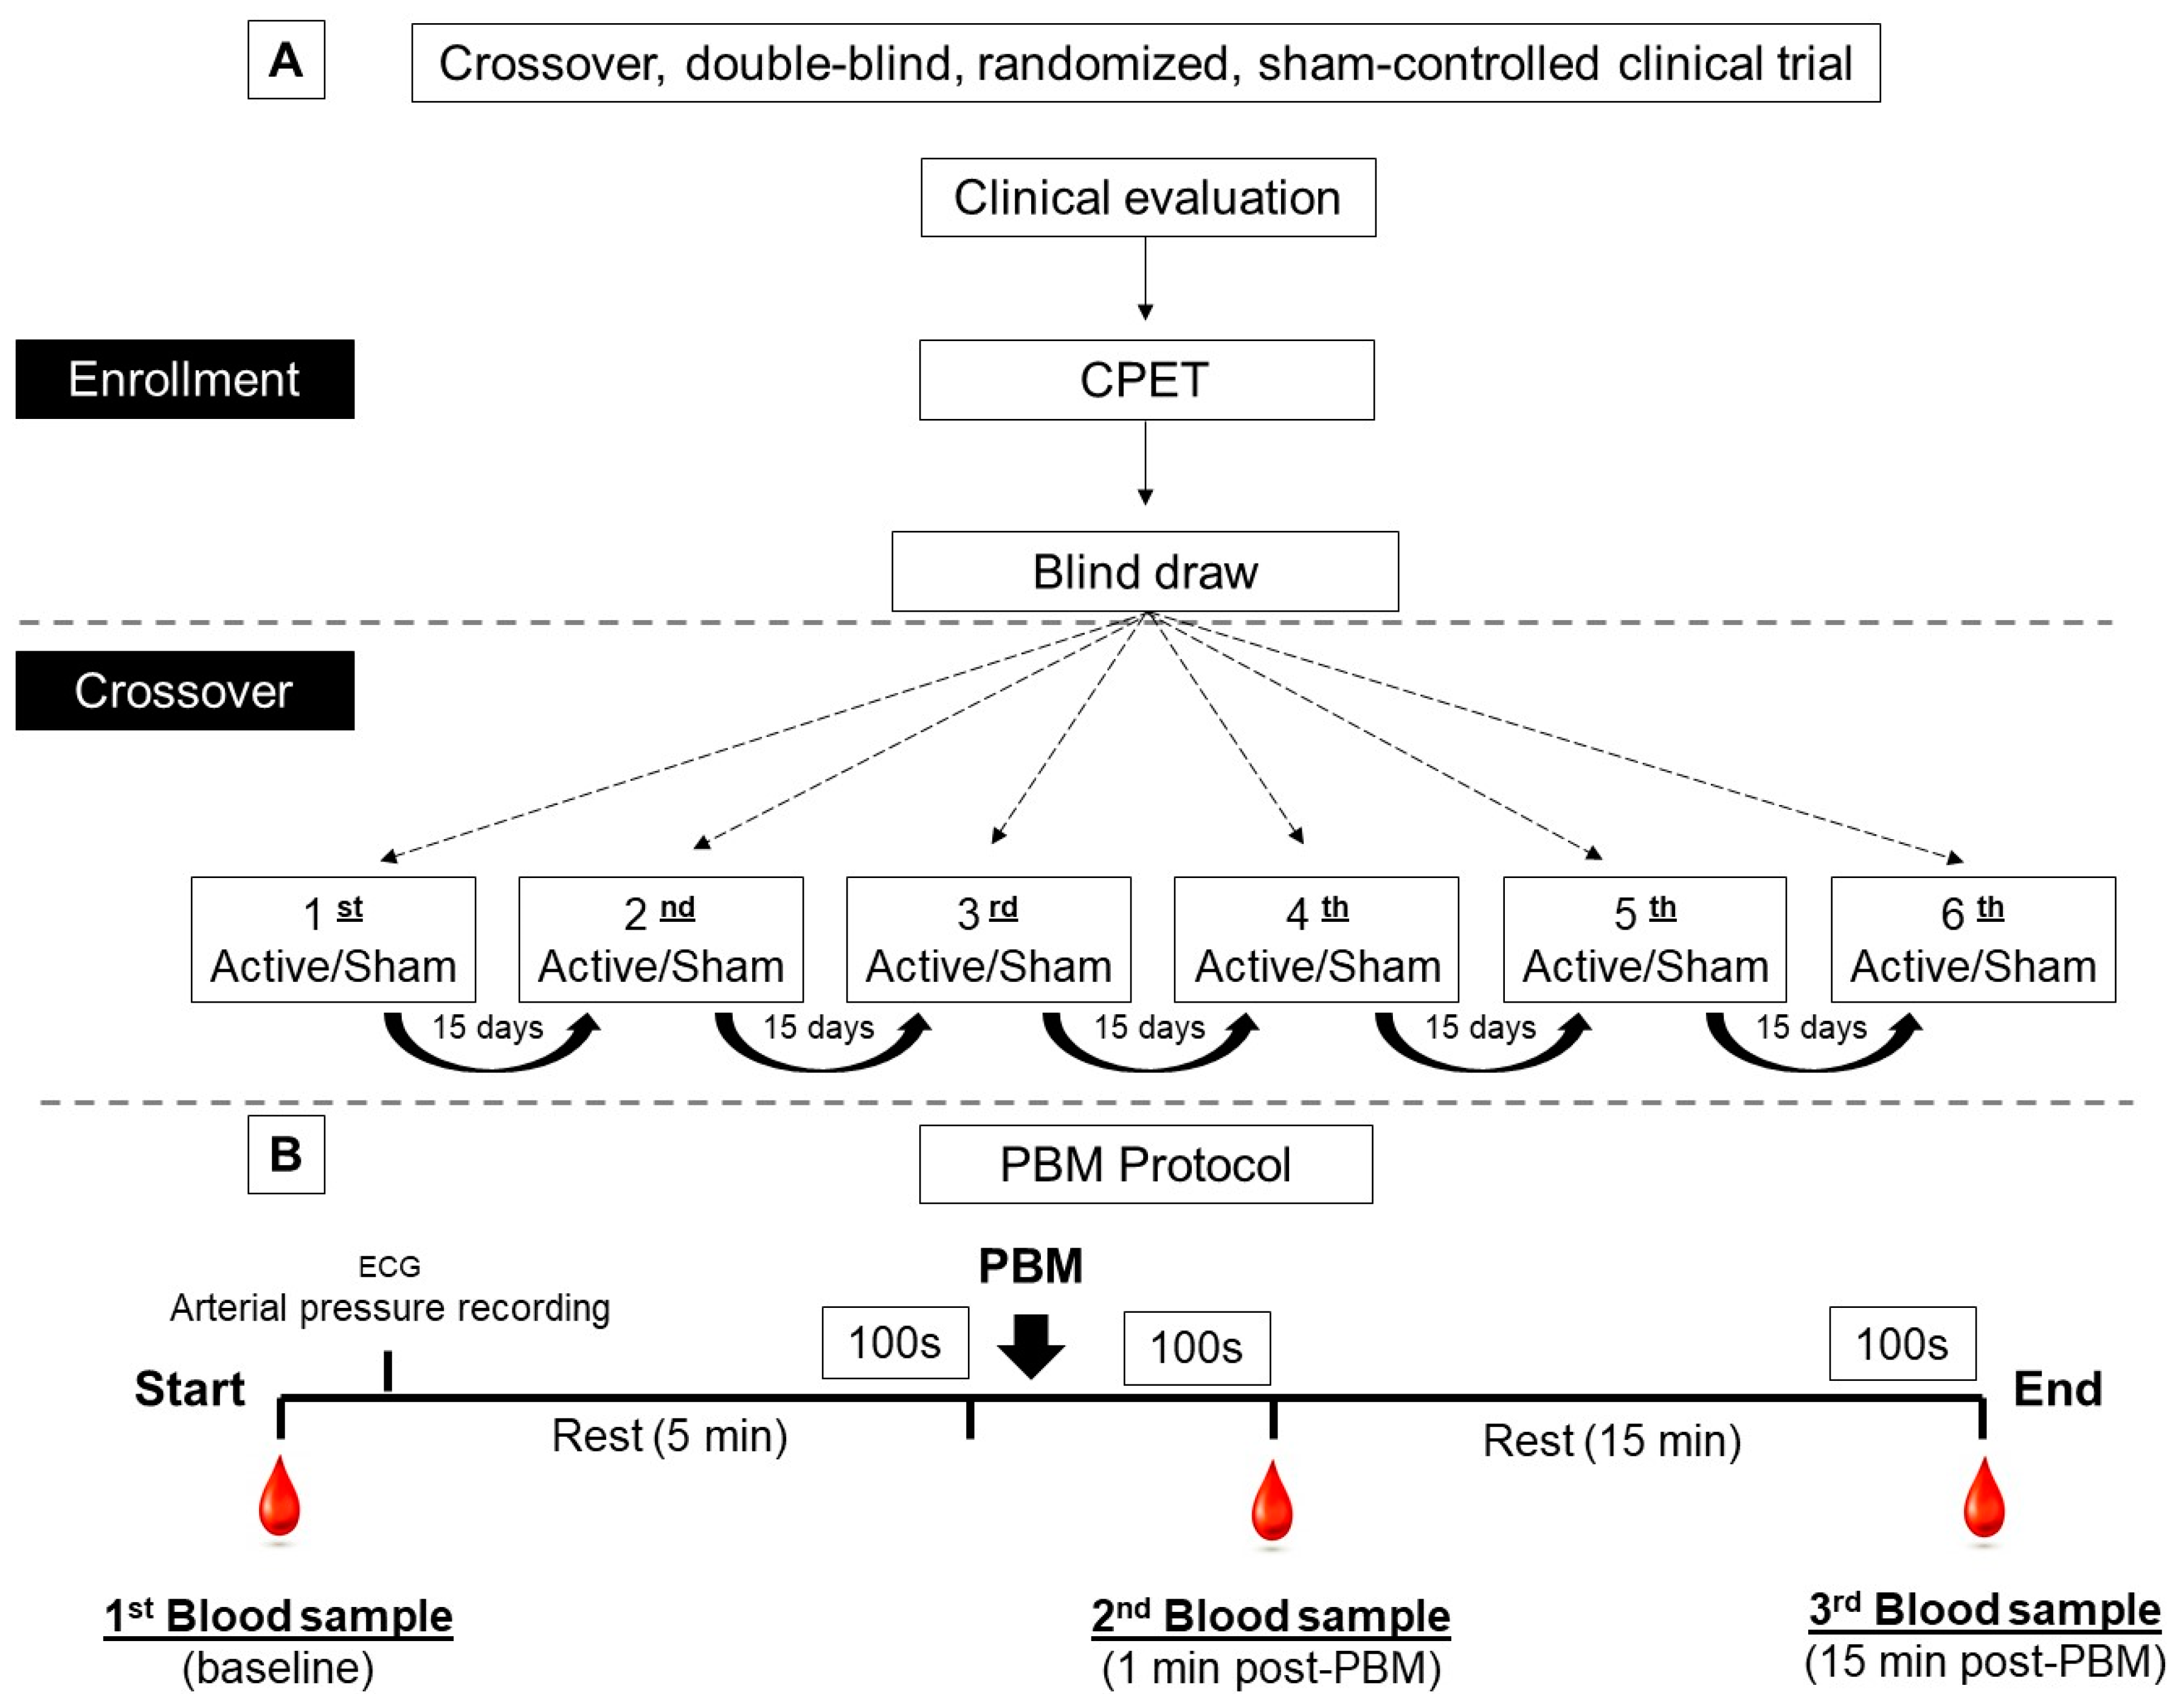
2.1. Study Design

The crossover, double-blind (therapists and participants), randomized, sham-controlled clinical trial study was performed according to the principles of the Declaration of Helsinki (1964) for medical research involving humans [21], approved by the Ethics Committee of the Federal University of São Carlos (UFSCar), São Carlos, SP, Brazil (CAAE: 80989017.6.0000.5504) and registered at Brazilian Clinical Trials Registry (ReBEC, ID RBR-6vgmtb in 08 October 2018). The study was conducted in the Cardiovascular Physiotherapy Laboratory of UFSCar and the data were collected from October 2018 through March 2020. All participants received clarifications regarding the objectives and procedures and signed a statement of informed consent of agreement.

2.2. Randomization and Blinding Procedures

Before the sessions, the participants were randomized into their respective intervention groups: sham or active PBM. The randomization was generated by a computer program (https://www.random.org/, accessed on 8 November 2018) and performed by a researcher not involved with recruiting or evaluating patients. This same researcher was responsible for programming the PBM device according to the randomization (active or sham mode) and was also instructed not to disclose the programmed intervention to other researchers or, any participants until the study completed.
Since PBM does not induce any sensitive stimulus for the energy applied (i.e., warm, cold, or skin irritation), subjects were also blinded for the order of the PBM irradiation (different total energies) or placebo (sham irradiation).

2.3. Study Population

We evaluated 13 men, aged 40–64 years diagnosed with type 2 diabetes mellitus according to the American Diabetes Association recommendations [21,22].
Subjects with the following alterations were excluded from the study: cardiovascular autonomic neuropathy (verified by at least three specific autonomic tests according to Boulton et al. [23]), body mass index (BMI) > 35 kg/m2 (II and III obesity level), electrocardiographic alterations such as ST segment abnormality (elevation or depression), ischemia, right or left heart bundle branch block or arrhythmias in resting electrocardiography (ECG) or induced by clinical exercise testing; anxious behavior, smokers, users of illicit drugs or medications that may affect the responses of the studied variables, subjects with good or excellent aerobic functional classification according to the American Heart Association [24], and subjects with respiratory, neurological, or osteomioarticular dysfunctions that preclude the execution of the study protocol [21].
For the participants characterization, they were submitted to the following clinical evaluation: glycated hemoglobin (HbA1c), fasting plasma insulin level and fasting plasma glucose (primary outcome), and, a clinical evaluation consisting of a clinical maximal cardiopulmonary exercise testing (CPET), in the presence of a cardiologist [21]. The blood tests were carried out in a specialized laboratory, after 10–12 h of fasting using the analyzer ADVIA 1800 Chemistry System (Siemens, Tarrytown, NY, USA). The degree of insulin resistance was determined at baseline by the homeostasis model assessment of insulin resistance (HOMA-IR) [21,25].

2.4. Experimental Protocol

The whole experimental protocol included nine assessments (Figure 1A), six of which were aimed at applying energy, with a 15-day washout period between sessions. Only one energy was applied in each session, which were active (75, 150, 300, 450, and 600 J) or sham. The physiological variables were measured at the moments: baseline, 1 min post-PBM/sham and 15 min post-PBM/sham (Figure 1B).
On the day before each protocol, the subjects were instructed to avoid vigorous exercise, alcohol and caffeine intake. In the visit called experimental protocol, before each session, the fasting plasma glucose of the participants was measured using a glucometer (Accu-Chek® Active brand, São Paulo, Brazil). Experimental procedures were always performed in the morning, which is when patients took the prescribed drugs.
Throughout the whole assessment, the surface ECG signal was acquired via a differential amplifier (BioAmp PowerLabADInstruments, Castle Hill, NSW, Australia) and the finger arterial pressure was measured by a photoplethysmography device Finometer PRO (Finapres Medical System, Amsterdam, The Netherlands). The signals were integrated and sampled at 1000 Hz using a commercial data acquisition device (PowerLab 8/35, AD Instruments, Castle Hill, NSW, Australia) [21]. After the data collection, data were analyzed and exported second-by-second by the software LabChart 7 (PowerLab®, ADInstruments, Sydney, Australia). The following variables were evaluated at the moments previously described: cardiac output ( Q ˙ ), stroke volume (SV), heart rate (HR), systolic blood pressure (SBP), diastolic blood pressure (DBP), and mean arterial pressure (MAP).
From these data, the following secondary variables were obtained: CI = Q ˙ /BSA, where CI = cardiac index, BSA = body surface area (in m2) calculated as height2 ∗ weight)/3600 [26]; stroke volume index (SVI), as the SV divided by BSA (mL/m2) [27]; TPR = MAP/ Q ˙ , where TPR = total peripheral resistance (in mmHg ∗ min/L) [28]; TPRI = TPR/BSA where TPRI = total peripheral resistance index [28].
For the analysis of the hemodynamic variables, 100 s of data before the end of each moment (baseline, 1 min post-PBM/sham, and 15 min post-PBM/sham) were selected. Afterwards, the final 40 s of the data were removed because this period matched with the period of the blood sample collection. Therefore, the mean value of the 60 s of data were considered for each moment.
Blood samples were collected via earlobe puncture with a heparinized capillary, and deposited into microtubes (Eppendorf, 1.5 mL) containing 50 μl of 1% sodium fluoride (NaF) [29] to evaluate lactate and glucose levels baseline and after 1 min and 15 min of the PBM (active or sham). The samples were frozen at −20 °C before being homogenized and determined by a glucose and lactate analyzer (YSI-2300-STAT-PlusTM, Yellow Springs Instruments, Yellow Springs, OH, USA) [7,29]. The analyzer was calibrated following the manufacturer’s recommended procedures.

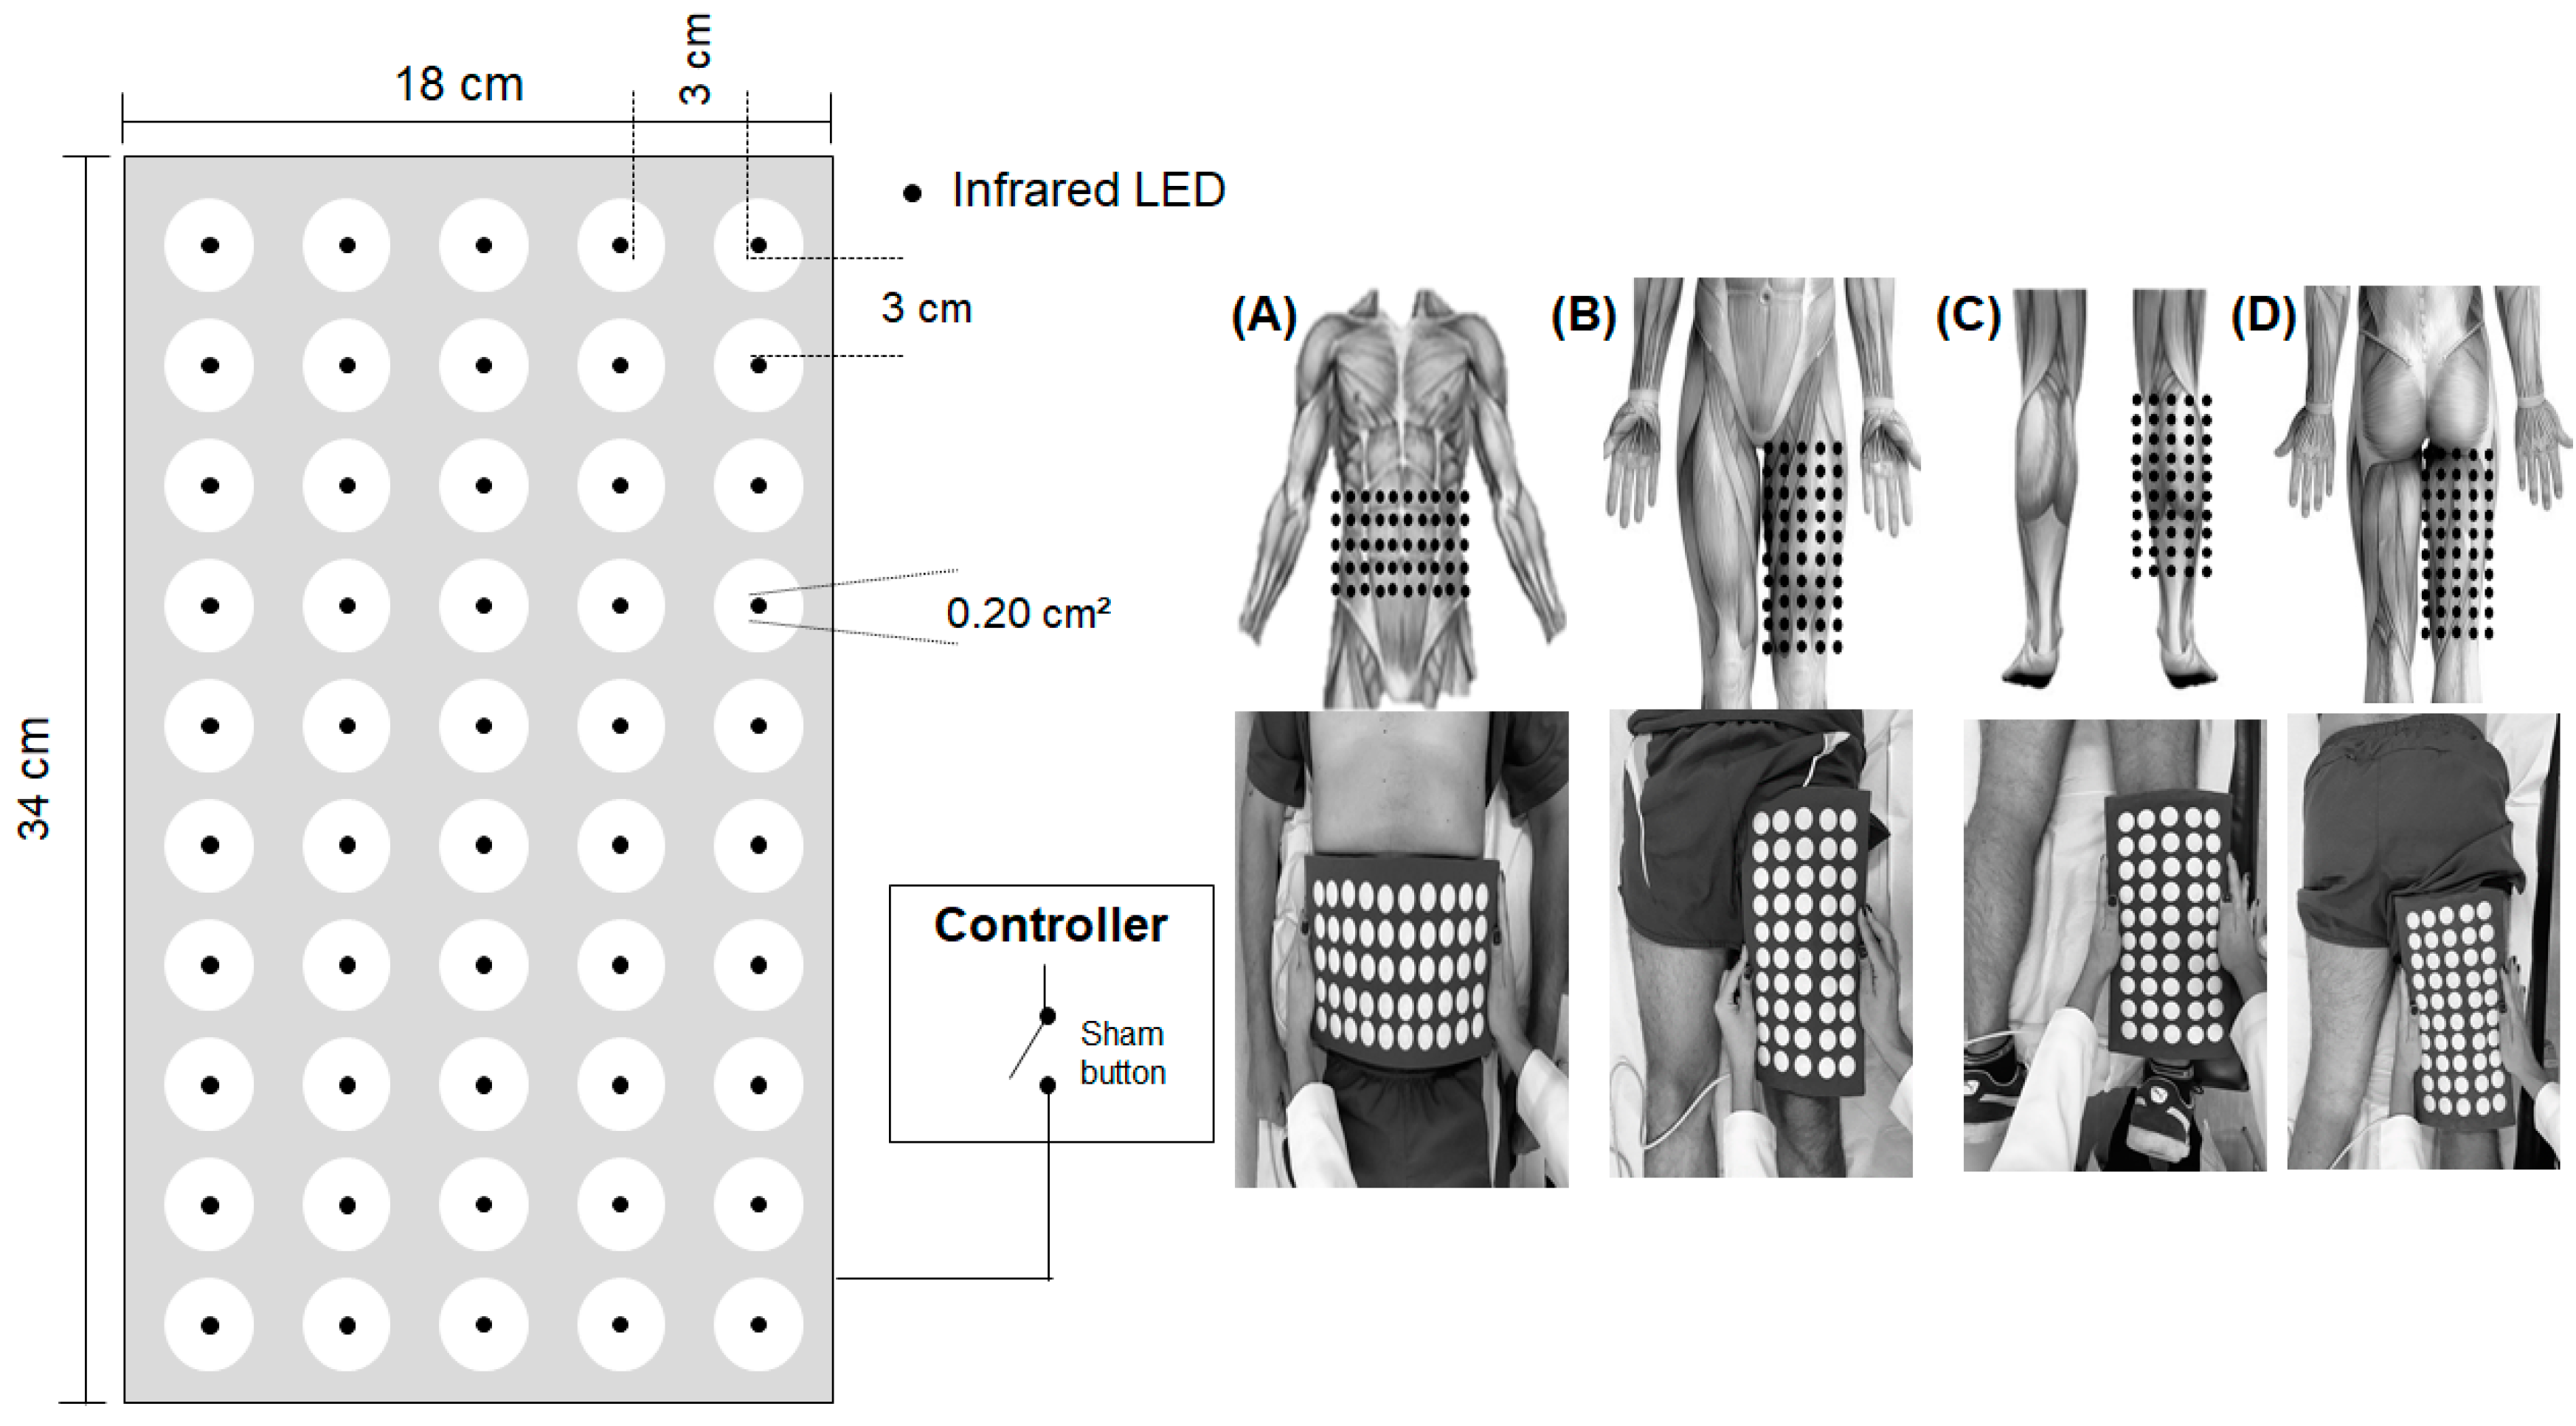
2.5. Photobiomodulation by Light-Emitting Diodes (LEDs)

The PBM was applied, with the participant seated, using a flexible light-emitting diode array (50 Ga-AI-As LEDs, 850 ± 20 nm, and 75 mW each diode) in direct contact over the skin on the rectus and oblique abdomen, quadriceps femoris, triceps surae, and hamstring muscle areas, bilaterally (Figure 2). The device is a non-commercial prototype developed by two Brazilian Universities: the Federal University of Sao Carlos and the University of Sao Paulo [7,21].
The device was constructed with a number of emitters and spacing such that the light field, after penetration in the tissue, starts to overlap. In that way we guarantee the overall almost uniform illumination on the tissue covered by the device. As a result, the overall delivered energy is equally distributed on the tissue.
The parameters used for the five tested energies (75, 150, 300, 450, and 600 J) are described in Table 1. The sham followed the same procedure, but with the device turned off by a hidden button. The device was calibrated prior to data collection by an optical energy meter (PM100D Thorlabs®, Newton, NJ, USA) connected to a light sensor S130C (area of 0.7 cm2) to ensure that the correct power of light and energy were delivered [21].
During the data collection, subjects were advised to not talk unnecessarily, and breathe spontaneously.

2.6. Statistical Analysis
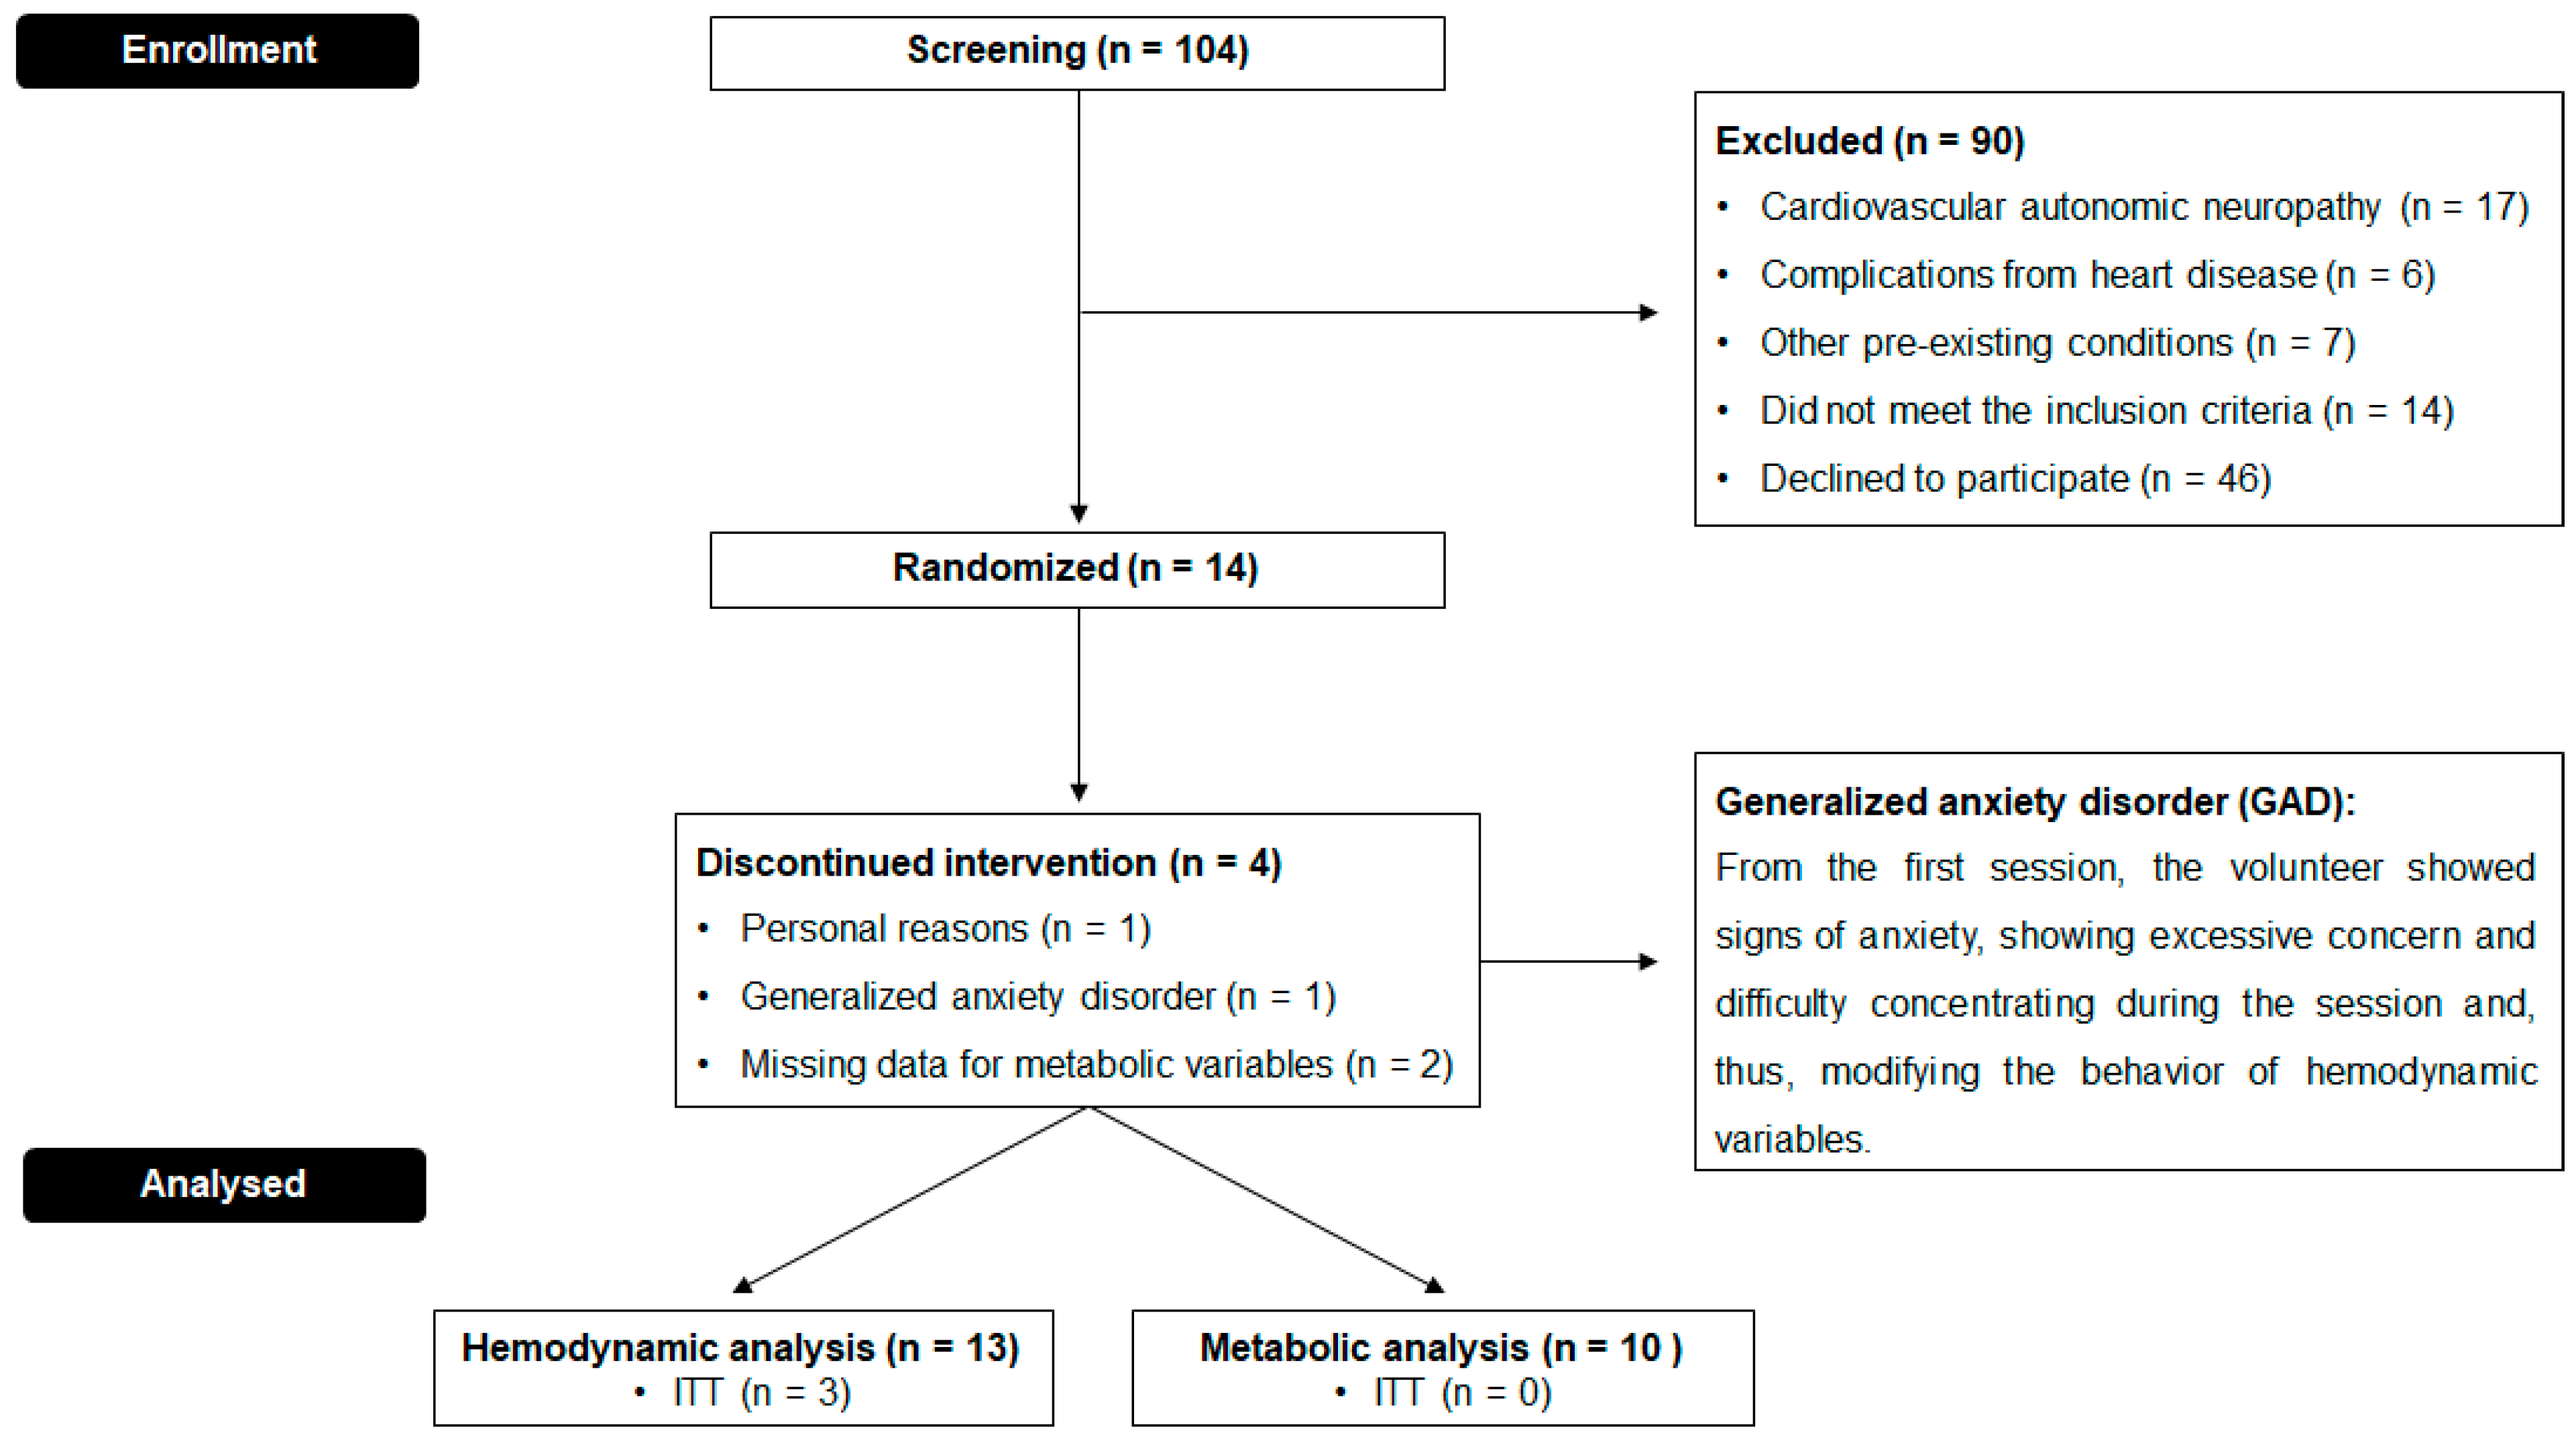
The intention-to-treat analysis was performed using the multiple imputation method to impute values for all missing data.
The data normality was verified by the Shapiro–Wilk test and homogeneity of variances was tested using the Levene test. Data are presented as mean ± standard deviation (SD). Intragroup comparisons (at times: baseline, 1 min post-PBM and 15 min post-PBM) and between energies (PBM-active and PBM-sham) (Joules) were performed by two-way analysis of variance (ANOVA) of measurements repeated tests for parametric data. The Kruskal–Wallis and Friedman test followed by the Holm Sidak post hoc test for non-parametric data. The comparisons of deltas (∆) between groups, PBM-effective and PBM-sham (∆ response 1 min-baseline and ∆ response 15 min-baseline) were performed using the ANOVA one-way repeated measures for parametric data and ANOVA on ranks (Tukey Test) for non-parametric data.
The level of significance was set at p < 0.05. Data were analyzed with the SigmaPlot version 14 (Systat Software, Inc., San Jose, CA, USA).

3. Results

A total of 104 subjects were considered eligible, of which 90 were excluded due to the exclusion criteria (detailed in Figure 3).
The characteristics of the included subjects are summarized in Table 2. All subjects received medication treatment for hyperglycemia management. There were no changes in the subject medications and lifestyle during the experimental protocols.
Table 3 shows the analysis of metabolic responses. Regarding fasting plasma glucose levels, a significant reduction was observed for the energy of 75 J (−10.3%) and 450 J (−13.7%) after 15 min of PBM irradiation (p = 0.013 and p = 0.002, respectively), as seen in Figure 4A. No differences were observed between energies, even after the comparison between the deltas (∆) of the 1 min post-PBM and 15 min post-PBM moments (Figure 5A).
For the analysis of blood lactate levels, a significant reduction was observed for the energy of 75 (−12.9%), 450 (−11.8%) and 600 J (−12.4%) after 15 min of irradiation of PBM (p = 0.013, p = 0.025 and p = 0.014, respectively). Figure 4B illustrates these responses individually and Figure 5B presents the deltas (∆), which did not show statistically significant differences.
Table 4 shows the changes in Q ˙   compared to different energies and moments. For the energy of 75 J, a significant increase was observed after 1 min (p = 0.002) of PBM irradiation, with maintenance after 15 min (p = 0.015). For the energy of 300 J, we observed a significant increase after 1 min (p < 0.001). However, there was a reduction in Q ˙ after 15 min (p = 0.007). The same behavior is seen in CI. Furthermore, when comparing the ∆ of the effective and sham energies at moment 1 min post-PBM, we observed a difference between the energies 75 J vs. 600 J (p = 0.010) and 300 J vs. 600 J (p = 0.005). The same differences were observed at the ∆ Q ˙ and in the ∆CI at the moment 15 min post PBM (p = 0.007, and p = 0.029, respectively), as seen in Figure 5C,D.
For the analysis of TPR and TPRI (Table 4), we observed a statistically significant decrease when comparing the 1-min moments with the baseline in energies of 75 J and 300 J, with p = 0.017 and p = 0.014, respectively. Moreover, at 75 J energy, we observed a decrease in TPR and TPRI when comparing the baseline with 15′ post-PBM, with p = 0.030 (Figure S1). In the sham condition, we observed an increase in TPR and TPRI when comparing the moments 1 min with 15 min after PBM, with p = 0.020. Furthermore, we observed statistically significant differences between the energies 75 vs. 600 J and 300 vs. 600 in the ΔTPR (Figure 5E) and the ΔTPRI (Figure 5F) in the 1 min post-PBM, with p = 0.005 and p = 0.003, and 15 min post-PBM for energies 75 vs. 600 J, with p = 0.010.
The relationship to SV and SVI in the energies of 75 J and 300 J, a significant increase was observed after 1 min, with p = 0.009 and p = 0.002, respectively, and for SV at 15 min post-PBM, with p = 0.013. Comparing the ∆, Figure 5G,H, we observed differences between the energies of 75 J vs. 600 J and 300 vs. 600 J both for ∆ 1 min post-PBM (p = 0.021, and p = 0.002), and for ∆ 15 min post-PBM (p = 0.021, and p = 0.029).
In the HR analysis (Table 4), a difference was observed between the energies of 300 vs. 450 J when compared to the baseline, with p = 0.020. Regarding the 1 min post-PBM moment, we observed that the energies of 300 J and 450 J showed an increase in HR, with p = 0.035 and p = 0.013, respectively, and the energies of 300 and 600 J showed a reduction after 15 min of irradiation of PBM when compared to the 1-min moment (p = 0.024 and p = 0.017). Moreover, in the ∆HR of the 1st minute post-PBM, we observed a difference between the energies of 150 vs. 300 J, with p = 0.039 (Figure 5I).
Finally, we observed a difference between the energies of 75 vs. 600 J in the ∆MAP (Figure 5L) at 15 min post PBM (p = 0.039). We did not observe significant differences for the ∆SBP and ∆DBP variables (Figure 5J,K).

4. Discussion

To the best of our knowledge, the present study is the first one to investigate the dose response effect of photobiomodulation (PBM) by light-emitting diodes (LEDs) as a therapeutic tool in subjects with T2DM. The main findings of the present study were (a) a reduction in fasting plasma glucose levels after 15 min of irradiation for 75 and 450 J; (b) a reduction in blood lactate levels after 15 min of irradiation with energies of 75, 450 and 600 J; (c) an increase in Q ˙ and CI after 1 min of irradiation with energies of 75 and 300 J; (d) a reduction in Q ˙ and CI after 15 min of irradiation for the energy of 300 J; (e) a reduction in HR after 15 min of irradiation for the energy of 600 J; (f) and statistical differences between 75 J vs. 600 J and 300 vs. 600 J for hemodynamic variables (Δ Q ˙ , ΔCI, ΔTPR, and ΔTPRI).
The choice of therapeutic windows presented in this study is due to previous results of Francisco et al. [7]. Based on the answers presented by the authors, we chose to adopt 2 energies above and 2 energies below the proposal in the aforementioned study, which worked with the energies of 150 and 300 J.
An interesting result observed was the clear biphasic response to the irradiation of PBM by LEDs in hemodynamic variables, showing beneficial effects at lowered and intermediate energies, and possible inhibitory effects with high energy (600 J) and/or tissue exposure time. In contrast, for the metabolic variables, it was observed that higher energies (450 and 600 J) were able to produce a better effect. This indicates a positive effect of the PMB applied for cardiometabolic regulation and emphasizes the PBM application in clinical practice.

4.1. Hemodynamics Effects

Considering the mean arterial pressure as the product of cardiac output ( Q ˙ ) by total peripheral vascular resistance (TPR), blood pressure can be regulated by changes in Q ˙ (changes in stroke volume or heart rate) or changes in TPR or variations in both [16]. Therefore, the increase in Q ˙ may have been caused by a response mechanism for maintaining blood pressure since there were no significant changes to it.
As a response, we observed a decrease in TPR for energies between 75 and 300 J, which may be related to an increase in blood flow to peripheral tissues mediated by PBM due to the vasodilator effect induced by nitric oxide (NO), which is already documented in some experimental studies [16,30,31]. On the other hand, we observed an opposite hemodynamic effect when 600 J energy was applied, since an increase in TPR was observed.
Thus, as a possible explanation for the increase in TPR observed after 1 min of application of PBM, we speculate three possible mechanisms: (1) The acute local vascular response, with the production and release of local vasoconstrictor factors (e.g., endothelin) [8]; and/or (2) the acute effect of the sympathetic nervous system via modulation of peripheral vascular tone and on the modulation of heart rate responses, since an increase in HR was observed in the 1st minute, followed by a decrease after 15 min. However, there is no experimental evidence in humans that demonstrates such effects at higher PBM energies [32].
The same response at higher PBM energy was observed in an experimental study by PBM with laser irradiation in the variables of arterial pressure and HR [16]. However, little is known about the possible mechanisms, and authors speculated on a third hypothesis: (3) that light stimulates the production of mitochondrial oxygen reactive species (mtROS). Therefore, it is likely that, when stimulated by low energies, it can initiate beneficial cell signaling pathways; however, at higher energies, the production of mtROS can damage the mitochondria, which can lead to inducing apoptosis via a mitochondrial pathway, including the release of cytochrome c (Cyt c) [16,33].
Moreover, a prospective, randomized, and controlled clinical trial [34] evaluated 20 healthy young participants, non-smokers, for a time of 5 min. They investigated the effects of irradiation in the wrist region, including the ulnar and radial arteries, of a cluster composed of red LEDs (wavelength in 633 nm, power density of 70 mW/cm2 and delivered energy density of 21 J/cm2) or infrared (wavelength of 830 nm, power density of 55 mW/cm2 and delivered energy density of 16.5 J/cm2). The blood flow and skin temperature were monitored using photoplethysmography, laser doppler flowmetry (LDF), and thermal imaging before, during, and after 20 min of irradiation and observed that infrared PBM induced immediate arteriolar vasodilation and was long lasting. The authors found the increased capillary flow and tissue perfusion when compared to infrared PBM [34].
Although these findings were dependent on the specific wavelength and the energy, they show extremely relevant information since we observed an unprecedented effect with the reduction in TPR, which was most likely caused by the vasodilator effect promoted by PBM with LEDs.

4.2. Metabolic Responses

Although the subjects received pharmacological treatment for hyperglycemia and had normal blood lactate levels during the study, we can consider the use of PBM as a promising pathway for subjects with T2DM, as after 15 min of PBM irradiation we observed that fasting plasma glucose levels showed a reduction in 25 mg/dL and the lactate levels showed a reduction of up to 0.24 mmol/L for the highest energy applied (600 Joules).
The possible mechanisms of action are related to the regulation of cytochrome c oxidase (Cox) activity as photoreceptors and the muscle glycogen synthesis [8,15,35,36]. PBM is known to modulate mitochondrial function, increasing muscle cell adenosine triphosphate (ATP) synthesis [35,36,37], possible phosphocreatine resynthesis, and reducing acidification by accelerating the oxidation of lactate to pyruvate through the mitochondrial metabolism [38]. Moreover, concerning the mechanisms of action of the PBM, an animal model study observed that PBM increases the activity of citrate synthase (CS), a key enzyme responsible for catalyzing the first reaction of the citric acid cycle (Krebs Cycle), which is closely related to Cox [39,40]. Thus, there appears to be an increase in the activity of the Krebs cycle after irradiation of PBM, increasing the use of glucose for the synthesis of ATP, which can contribute to increased muscle glycogen synthesis and a consequent reduction in fasting plasma glucose levels [15,40].
A previous randomized clinical trial found that the combination of aerobic exercise of moderate intensity with PBM irradiation of 150 J by LEDs (wavelength of 850 ± 20 nm, 75 mW each diode, applied bilaterally to the quadriceps femoris and triceps surae muscles for 40 s at each site) were able to promote a significant decrease in fasting plasma glucose levels, yet there were no changes in lactate levels in subjects with T2DM [7]. In the present study, we observed the best magnitude response with a consequent reduction in fasting plasma glucose and lactate levels with 450 and 600 J, respectively. We assume that these differences are related to the fact that the present study evaluated the isolated effect of PBM, and Francisco et al. [7] combined PBM with physical exercise, as well as a smaller PBM irradiation area (only quadriceps and triceps surae muscles).
Moreover, in the proposed experimental design the participants were their own control for each of the energies, that is, the same individual participated in the effective energies and sham, we considered that the influence of the pharmacological therapy on the results was minimized. In addition, the medications in use and their respective dosages were not changed during the study.
Another study, in experimental model, evaluated the effect of energy density and time response of PBM using a cluster with 69 LEDs (with 35 red = 630 ± 10 nm and 34 infrared = 850 ± 20 nm). They assessed fasting plasma glucose and muscle glycogen concentration in non-diabetic rats. Thus the authors found that the energy density of 10 J/cm2 applied on the back, posterior limbs, and gluteus maximus muscles for 90 s induced lower fasting plasma glucose levels and higher muscle glycogen synthesis after PBM [15].
Regarding blood lactate levels, we observed that most studies combined PBM with exercise and evaluated the improvement in performance and muscle recovery after exercise in healthy people [10,41]. Despite the detailed analysis of the review studies, the authors observed that the studies showed a low to moderate level of scientific evidence and suggest attention and caution regarding the use of PBM, emphasizing the need for further studies including methodological quality increase and following a therapeutic window [10,41].
Our results suggest that PBM irradiation using LEDs promoted changes in metabolic and hemodynamic variables in men with T2DM. The best effects of PBM were observed mainly in the variable Q ˙ , TPR, HR, fasting plasma glucose, and lactate levels using in direct contact with the skin with wavelengths of 850 ± 20 nm and 75 mW power output. For hemodynamic variables, we observed an ideal therapeutic window ranging from 75 to 300 J, whereas for metabolic variables it ranged from 450 to 600 J.
The present study can be considered limited regarding its small sample size. However, regarding the primary outcome (fasting plasma glucose), the statistical power calculated to achieve: (a) The minimal difference between the means of 10 mg/dL; (b) the minimum standard deviation equal to 5 mg/dL; (c) number of groups = 6; (d) sample size equal to 10; and (e) alpha of 0.08, resulted a Power of 0.954.

Supplementary Materials

The following supporting information can be downloaded at: https://www.mdpi.com/article/10.3390/photonics9070481/s1, Figure S1: Individual response of total peripheral vascular resistance (TPR) (mmHg/L/min) pre and 15 min post experimental protocol for each energy, sham, 75, 150, 300, 450 and 600 J.

Author Contributions

All authors made substantial contributions to this study and participated in the experimental design, hypotheses development, and data interpretation and discussion. Linares, S.N.L., T.B., G.A.M.G., M.C.M.F., M.O.G. and J.C.M.-M. were responsible for the data collection, C.F., V.S.B. and N.A.P. were part of the PBM device development team, A.B.-S., P.F.d.B. and F.B.M.-G. helped with the glucose and blood lactate level analyses and A.M.C. conceived the study; acquisition of resources for project development; supervised the data collection, statistical analysis and writing. S.N.L. and T.B. drafted the first version of the manuscript and from there all authors made substantial text improvements. All authors have read and agreed to the published version of the manuscript.

Funding

This research was funded by Brazilian National Council for Scientific and Technological Development—CNPq (grant 310612/2019-5 and 425360/2018-0), the São Paulo State Research Foundation—FAPESP (grant 2013/07953-3 and 2017/09639-5), and the Coordination for the Improvement of Higher Education Personnel—CAPES (Finance Code 001).

Institutional Review Board Statement

The study was conducted in accordance with the Declaration of Helsinki (1964) for medical research involving humans; was approved by the Ethics Committee in Human of the Federal University of São Carlos (UFSCar), São Carlos, SP, Brazil (CAAE: 80989017.6.0000.5504) and registered at Brazilian Clinical Trials Registry (ReBEC, ID RBR-6vgmtb in 8 October 2018).

Informed Consent Statement

Informed consent was obtained from all subjects involved in the study.

Data Availability Statement

The data presented in this study are available on request from the corresponding author.

Acknowledgments

We thank the volunteers who kindly participated in this study. We gratefully acknowledge funding supported by the Brazilian National Council for Scientific and Technological Development—CNPq (grant 310612/2019-5 and 425360/2018-0), the São Paulo State Research Foundation—FAPESP (grant 2013/07953-3 and 2017/09639-5), and the Coordination for the Improvement of Higher Education Personnel—CAPES (Finance Code 001). The funders had no role in the study design, data collection and analysis, decision to publish, or preparation of manuscript.

Conflicts of Interest

The authors declare that the research was conducted in the absence of any commercial or financial relationships that could be construed as a potential conflict of interest.

References

  1. Rawshani, A.; Rawshani, A.; Franzén, S.; Eliasson, B.; Svensson, A.-M.; Miftaraj, M.; McGuire, D.K.; Sattar, N.; Rosengren, A.; Gudbjörnsdottir, S. Mortality and Cardiovascular Disease in Type 1 and Type 2 Diabetes. N. Engl. J. Med. 2017, 376, 1407–1418. [Google Scholar] [CrossRef] [PubMed] [Green Version]
  2. Cho, N.H.; Shaw, J.E.; Karuranga, S.; Huang, Y.; da Rocha Fernandes, J.D.; Ohlrogge, A.W.; Malanda, B. IDF Diabetes Atlas: Global estimates of diabetes prevalence for 2017 and projections for 2045. Diabetes Res. Clin. Pract. 2018, 138, 271–281. [Google Scholar] [CrossRef] [PubMed]
  3. Chawla, A.; Chawla, R.; Jaggi, S. Microvasular and macrovascular complications in diabetes mellitus: Distinct or continuum? Indian J. Endocrinol. Metab. 2016, 20, 546–551. [Google Scholar] [CrossRef] [PubMed]
  4. ADA. 2. Classification and Diagnosis of Diabetes: Standards of Medical Care in Diabetes—2021. Diabetes Care 2021, 44, S15–S33. [Google Scholar] [CrossRef]
  5. Paneni, F.; Beckman, J.A.; Creager, M.A.; Cosentino, F. Diabetes and vascular disease: Pathophysiology, clinical consequences, and medical therapy: Part I. Eur. Heart J. 2013, 34, 2436–2443. [Google Scholar] [CrossRef]
  6. Poitras, V.J.; Hudson, R.W.; Tschakovsky, M.E. Exercise intolerance in Type 2 diabetes: Is there a cardiovascular contribution? J. Appl. Physiol. 2018, 124, 1117–1139. [Google Scholar] [CrossRef]
  7. De Francisco, C.O.; Beltrame, T.; Hughson, R.L.; Milan-Mattos, J.C.; Ferroli-Fabricio, A.M.; Galvão Benze, B.; Ferraresi, C.; Parizotto, N.A.; Bagnato, V.S.; Borghi-Silva, A.; et al. Effects of light-emitting diode therapy (LEDT) on cardiopulmonary and hemodynamic adjustments during aerobic exercise and glucose levels in patients with diabetes mellitus: A randomized, crossover, double-blind and placebo-controlled clinical trial. Complement. Ther. Med. 2019, 42, 178–183. [Google Scholar] [CrossRef]
  8. de Freitas, L.F.; Hamblin, M.R. Proposed Mechanisms of Photobiomodulation or Low-Level Light Therapy. IEEE J. Sel. Top. Quantum Electron. 2016, 22, 348–364. [Google Scholar] [CrossRef] [Green Version]
  9. Linares, S.N.; Beltrame, T.; Ferraresi, C.; Galdino, G.A.M.; Catai, A.M. Photobiomodulation effect on local hemoglobin concentration assessed by near-infrared spectroscopy in humans. Lasers Med. Sci. 2020, 35, 641–649. [Google Scholar] [CrossRef]
  10. Nampo, F.K.; Cavalheri, V.; Dos Santos Soares, F.; de Paula Ramos, S.; Camargo, E.A. Low-level phototherapy to improve exercise capacity and muscle performance: A systematic review and meta-analysis. Lasers Med. Sci. 2016, 31, 1957–1970. [Google Scholar] [CrossRef]
  11. Wang, X.; Tian, F.; Soni, S.S.; Gonzalez-Lima, F.; Liu, H. Interplay between up-regulation of cytochrome-c-oxidase and hemoglobin oxygenation induced by near-infrared laser. Sci. Rep. 2016, 6, 30540. [Google Scholar] [CrossRef] [PubMed] [Green Version]
  12. Silva, G.; Ferraresi, C.; de Almeida, R.T.; Motta, M.L.; Paixão, T.; Ottone, V.O.; Fonseca, I.A.; Oliveira, M.X.; Rocha-Vieira, E.; Dias-Peixoto, M.F.; et al. Infrared photobiomodulation (PBM) therapy improves glucose metabolism and intracellular insulin pathway in adipose tissue of high-fat fed mice. Lasers Med. Sci. 2018, 33, 559–571. [Google Scholar] [CrossRef] [PubMed]
  13. Gál, P.; Mokrý, M.; Vidinský, B.; Kilík, R.; Depta, F.; Harakalová, M.; Longauer, F.; Mozes, S.; Sabo, J. Effect of equal daily doses achieved by different power densities of low-level laser therapy at 635 nm on open skin wound healing in normal and corticosteroid-treated rats. Lasers Med. Sci. 2009, 24, 539–547. [Google Scholar] [CrossRef] [PubMed]
  14. Tang, J.; Du, Y.; Lee, C.A.; Talahalli, R.; Eells, J.T.; Kern, T.S. Low-intensity far-red light inhibits early lesions that contribute to diabetic retinopathy: In vivo and in vitro. Investig. Ophthalmol. Vis. Sci. 2013, 54, 3681–3690. [Google Scholar] [CrossRef] [PubMed] [Green Version]
  15. Castro, K.M.R.; de Paiva Carvalho, R.L.; Junior, G.M.R.; Tavares, B.A.; Simionato, L.H.; Bortoluci, C.H.F.; Soto, C.A.T.; Ferraresi, C. Can photobiomodulation therapy (PBMT) control blood glucose levels and alter muscle glycogen synthesis? J. Photochem. Photobiol. B Biol. 2020, 207, 111877. [Google Scholar] [CrossRef] [PubMed]
  16. De Moraes, T.F.; Filho, J.C.C.; Oishi, J.C.; Almeida-Lopes, L.; Parizotto, N.A.; Rodrigues, G.J. Energy-dependent effect trial of photobiomodulation on blood pressure in hypertensive rats. Lasers Med. Sci. 2020, 35, 1041–1046. [Google Scholar] [CrossRef] [PubMed]
  17. Yoshimura, T.M.; Sabino, C.P.; Ribeiro, M.S. Photobiomodulation reduces abdominal adipose tissue inflammatory infiltrate of diet-induced obese and hyperglycemic mice. J. Biophotonics 2016, 9, 1255–1262. [Google Scholar] [CrossRef]
  18. Beltrame, T.; Ferraresi, C.; Parizotto, N.A.; Bagnato, V.S.; Hughson, R.L. Light-emitting diode therapy (photobiomodulation) effects on oxygen uptake and cardiac output dynamics during moderate exercise transitions: A randomized, crossover, double-blind, and placebo-controlled study. Lasers Med. Sci. 2018, 33, 1065–1071. [Google Scholar] [CrossRef]
  19. Ferraresi, C.; Huang, Y.-Y.; Hamblin, M.R. Photobiomodulation in human muscle tissue: An advantage in sports performance? J. Biophotonics 2016, 9, 1273–1299. [Google Scholar] [CrossRef] [Green Version]
  20. de Oliveira, A.R.; Vanin, A.A.; Tomazoni, S.S.; Miranda, E.F.; Albuquerque-Pontes, G.M.; De Marchi, T.; Dos Santos Grandinetti, V.; de Paiva, P.R.V.; Imperatori, T.B.G.; de Carvalho, P.T.C.; et al. Pre-Exercise Infrared Photobiomodulation Therapy (810 nm) in Skeletal Muscle Performance and Postexercise Recovery in Humans: What Is the Optimal Power Output? Photomed. Laser Surg. 2017, 35, 595–603. [Google Scholar] [CrossRef]
  21. Milan-Mattos, J.C.; de Oliveira Francisco, C.; Ferroli-Fabrício, A.M.; Minatel, V.; Marcondes, A.C.A.; Porta, A.; Beltrame, T.; Parizotto, N.A.; Ferraresi, C.; Bagnato, V.S.; et al. Acute effect of photobiomodulation using light-emitting diodes (LEDs) on baroreflex sensitivity during and after constant loading exercise in patients with type 2 diabetes mellitus. Lasers Med. Sci. 2020, 35, 329–336. [Google Scholar] [CrossRef] [PubMed]
  22. Diagnosis and Classification of Diabetes Mellitus. Diabetes Care 2014, 37, S81–S90. [CrossRef] [PubMed] [Green Version]
  23. Boulton, A.J.M.; Vinik, A.I.; Arezzo, J.C.; Bril, V.; Feldman, E.L.; Freeman, R.; Malik, R.A.; Maser, R.E.; Sosenko, J.M.; Ziegler, D. Diabetic neuropathies: A statement by the American Diabetes Association. Diabetes Care 2005, 28, 956–962. [Google Scholar] [CrossRef] [PubMed] [Green Version]
  24. American Heart Association. Exercise Testing and Training of Apparently Healthy Individuals: A Handbook for Physicians; American Heart Association: Dallas, TX, USA, 1972; Available online: http://books.google.com/books?id=9o1qAAAAMAAJ (accessed on 1 June 2022).
  25. Matthews, D.R.; Hosker, J.P.; Rudenski, A.S.; Naylor, B.A.; Treacher, D.F.; Turner, R.C. Homeostasis model assessment: Insulin resistance and beta-cell function from fasting plasma glucose and insulin concentrations in man. Diabetologia 1985, 28, 412–419. [Google Scholar] [CrossRef] [Green Version]
  26. Patel, N.; Durland, J.; Makaryus, A.N. Physiology, Cardiac Index. In Treasure Island (FL); StatPearls Publishing: Treasure Island, FL, USA, 2021. [Google Scholar]
  27. de Waal, E.E.C.; Konings, M.K.; Kalkman, C.J.; Buhre, W.F. Assessment of stroke volume index with three different bioimpedance algorithms: Lack of agreement compared to thermodilution. Intensive Care Med. 2008, 34, 735–739. [Google Scholar] [CrossRef] [Green Version]
  28. Hill, L.K.; Sollers Iii, J.J.; Thayer, J.F. Resistance reconstructed estimation of total peripheral resistance from computationally derived cardiac output-biomed 2013. Biomed. Sci. Instrum. 2013, 49, 216–223. [Google Scholar] [PubMed]
  29. da Cruz, J.P.; Messias, L.H.D.; Cetein, R.L.; Rasteiro, F.M.; Gobatto, C.A.; Manchado-Gobatto, F.B. Anaerobic and Agility Parameters of Salonists in Laboratory and Field Tests. Int. J. Sports Med. 2020, 41, 450–460. [Google Scholar] [CrossRef]
  30. Thomas, D.D.; Ridnour, L.A.; Isenberg, J.S.; Flores-Santana, W.; Switzer, C.H.; Donzelli, S.; Hussain, P.; Vecoli, C.; Paolocci, N.; Ambs, S.; et al. The chemical biology of nitric oxide: Implications in cellular signaling. Free Radic. Biol. Med. 2008, 45, 18–31. [Google Scholar] [CrossRef] [Green Version]
  31. da Silva-Santos, J.E.; Assreuy, J. Long-lasting changes of rat blood pressure to vasoconstrictors and vasodilators induced by nitric oxide donor infusion: Involvement of potassium channels. J. Pharmacol. Exp. Ther. 1999, 290, 380–387. [Google Scholar]
  32. Paolillo, F.R.; Arena, R.; Dutra, D.B.; de Cassia Marqueti Durigan, R.; de Araujo, H.S.; de Souza, H.C.D.; Parizotto, N.A.; Cipriano, G.J.; Chiappa, G.; Borghi-Silva, A. Low-level laser therapy associated with high intensity resistance training on cardiac autonomic control of heart rate and skeletal muscle remodeling in wistar rats. Lasers Surg. Med. 2014, 46, 796–803. [Google Scholar] [CrossRef]
  33. Huang, Y.-Y.; Sharma, S.K.; Carroll, J.; Hamblin, M.R. Biphasic dose response in low level light therapy—An update. Dose-Response 2011, 9, 602–618. [Google Scholar] [CrossRef] [PubMed]
  34. Gavish, L.; Hoffer, O.; Rabin, N.; Halak, M.; Shkilevich, S.; Shayovitz, Y.; Weizman, G.; Haim, O.; Gavish, B.; Gertz, S.D.; et al. Microcirculatory Response to Photobiomodulation-Why Some Respond and Others Do Not: A Randomized Controlled Study. Lasers Surg. Med. 2020, 52, 863–872. [Google Scholar] [CrossRef]
  35. Ferraresi, C.; Kaippert, B.; Avci, P.; Huang, Y.-Y.; de Sousa, M.V.P.; Bagnato, V.S.; Parizotto, N.A.; Hamblin, M.R. Low-level laser (light) therapy increases mitochondrial membrane potential and ATP synthesis in C2C12 myotubes with a peak response at 3-6 h. Photochem. Photobiol. 2015, 91, 411–416. [Google Scholar] [CrossRef] [PubMed]
  36. Ferraresi, C.; Parizotto, N.A.; Pires de Sousa, M.V.; Kaippert, B.; Huang, Y.-Y.; Koiso, T.; Bagnato, V.S.; Hamblin, M.R. Light-emitting diode therapy in exercise-trained mice increases muscle performance, cytochrome c oxidase activity, ATP and cell proliferation. J. Biophotonics 2015, 8, 740–754. [Google Scholar] [CrossRef] [PubMed] [Green Version]
  37. Ferraresi, C.; de Sousa, M.V.P.; Huang, Y.-Y.; Bagnato, V.S.; Parizotto, N.A.; Hamblin, M.R. Time response of increases in ATP and muscle resistance to fatigue after low-level laser (light) therapy (LLLT) in mice. Lasers Med. Sci. 2015, 30, 1259–1267. [Google Scholar] [CrossRef] [Green Version]
  38. Ferraresi, C.; de Brito Oliveira, T.; de Oliveira Zafalon, L.; de Menezes Reiff, R.B.; Baldissera, V.; de Andrade Perez, S.E.; Matheucci Júnior, E.; Parizotto, N.A. Effects of low level laser therapy (808 nm) on physical strength training in humans. Lasers Med. Sci. 2011, 26, 349–358. [Google Scholar] [CrossRef]
  39. Azzone, G.F.; Carafoli, E. Biochemical properties of skeletal muscle mitochondria: I. Oxidative phosphorylation. Exp. Cell Res. 1960, 21, 447–455. [Google Scholar] [CrossRef]
  40. de Brito Vieira, W.H.; Ferraresi, C.; Schwantes, M.L.B.; de Andrade Perez, S.E.; Baldissera, V.; Cerqueira, M.S.; Parizotto, N.A. Photobiomodulation increases mitochondrial citrate synthase activity in rats submitted to aerobic training. Lasers Med. Sci. 2018, 33, 803–810. [Google Scholar] [CrossRef]
  41. Vanin, A.A.; Verhagen, E.; Barboza, S.D.; Costa, L.O.P.; Leal-Junior, E.C.P. Photobiomodulation therapy for the improvement of muscular performance and reduction of muscular fatigue associated with exercise in healthy people: A systematic review and meta-analysis. Lasers Med. Sci. 2018, 33, 181–214. [Google Scholar] [CrossRef]
Figure 1. (A) The participants were submitted to a clinical evaluation consisting of blood assays and clinical cardiopulmonary exercise testing (CPET). After screening, the photobiomodulation (PBM) active or sham corresponding to each session was randomly selected and respecting 15 days of interval between sessions. (B) On the day of the experimental protocol, subjects were monitored and positioned in a sitting position at rest and the first blood sample was performed for fasting plasma glucose and lactate concentration analysis. After 5 min at rest, the PBM (active or sham) was applied, and a blood sample was collected 1 min and 15 min post PBM irradiation.
Photonics 09 00481 g001
Figure 2. Array of 50 light-emitting diodes (LEDs), with a wavelength of 850 ± 20 nm, power output of 75 mW and a beam area of 0.20 cm2 in each LED and 3 cm equidistant. For the sham condition, a hidden switch interrupted the light emissions. PBM was performed in direct contact over the skin on rectus and oblique abdomen (A), quadriceps femoris (B), triceps surae (C), and hamstrings (D) muscle areas, bilaterally.
Photonics 09 00481 g002
Figure 3. Flowchart (CONSORT). A total of 104 subjects who met the inclusion criteria were included in the study from November 2018 to December 2019. Ninety subjects were excluded due to the exclusion criteria; seventeen with cardiovascular autonomic neuropathy; six with complications from heart disease; seven with other pre-existing conditions; fourteen did not meet the inclusion criteria and forty-six dropped out due to long evaluation periods but, before randomizing. In total, 14 subjects were randomized, one was excluded due to personal reasons, one was excluded due to generalized anxiety disorder during the sessions and two because of missing data. In total, ten participants completed the study. Moreover, we included three subjects in the intention to treat (ITT) them for hemodynamic analysis.
Photonics 09 00481 g003
Figure 4. (A) Individual response of fasting plasma glucose (mg/dL) pre and 15 min post experimental protocol for each energy, sham, 75, 150, 300, 450, and 600 J. (B) Individual response of lactate (mmol/L) pre and 15 min post experimental protocol for each energy, sham, 75, 150, 300, 450, and 600 J. *: p < 0.05 when compared to the baseline.
Photonics 09 00481 g004
Figure 5. Average and SD deltas (∆) of (A) fasting plasma glucose, (B) lactate, (C) cardiac output ( Δ Q ˙ ), (D) cardiac index (ΔCI), (E) total peripheral resistance (TPR), (F) total peripheral resistance index (ΔTPRI), (G) stroke volume (ΔSV), (H) stroke volume index (ΔSVI), (I) heart rate (ΔHR), (J) systolic blood pressure (ΔSBP), (K) diastolic blood pressure (ΔDBP), and (L) mean arterial pressure (ΔMAP) at 1 min and 15 min post PBM for sham, 75, 150, 300, 450, and 600 J. *: p <0.05 when compared to the energy of 600 J in the moment baseline. #: p <0.05 when compared to the energy of 600 J in the moment 15 min post-PBM. ⁑: p <0.05 when compared to the energy of 300 J in the moment 1 min post-PBM.
Photonics 09 00481 g005
Table 1. Photobiomodulation parameters and application sites.
PBM—Irradiation Parameters
Type of PBMGa-AI-As semiconductor diodes
Number of points/LEDs50
Wavelength850 ± 20 nm
FrequencyContinuous output
Power output75 mW each diode
Spot size (each LED)0.2 cm2
Energy per LED0 J, 1.5 J, 3 J, 6 J, 9 J, 12 J
Power density per LED0 or 375 mW/cm2
Device area612 cm2
Application modeSkin contact
Sham75 J150 J300 J450 J600 J
Treatment time over each muscle group (s)80204080120160
Total energy delivered per muscle group0 J75 J150 J300 J450 J600 J
Total time (s)5601402805608401.120
Total energy delivered (7 regions)0 J525 J1.050 J2.100 J3.150 J4.200 J
PBM: photobiomodulation; LEDs: light emitting diodes; nm: nanometers; mW: milliwatts; cm2: square centimeter; J: joules; mW/cm2: milliwatts per square centimeter; s: seconds.
Table 2. Clinical and laboratory characteristics of the subjects (n = 13).
Age (years)52 ± 7
Anthropometric characteristics
Weight (Kg)91.0 ± 10.8
BMI (Kg/m2)29.3 ± 2.9
BSA (m2)2.10 ± 0.14
Clinical characteristics
Duration of diabetes (years)13 ± 7
HR at rest (bpm)75 ± 10
SBP at rest (mmHg)126.7 ± 6.8
DBP at rest (mmHg)72.2 ± 3.3
Blood tests
HbA1c (%)7.8 ± 1.8
Fasting insulin (µU/mL)15.6 ± 14.1
Fasting plasma glucose (mg/dL)180.1 ± 42.3
Insulin sensitive (%, HOMA)4.0 ± 2.1
Medications (n, (%))
Insulin3 (23.07)
Oral hypoglycemic
Biguanides13 (100)
Sulphonylureas3 (23.07
Glitazones3 (23.07)
SGLT2 inhibitors1 (7.69)
Antihypertensive
Diuretics4 (30.76)
AT1-receiver blockers8 (61.53)
Hypercholesterolemia
Fibrate1 (7.69)
Statin4 (30.76)
T4 replacement1 (7.69)
Values are expressed as mean ± standard deviation; Kg: kilogram; %: percentage; BMI: body mass index; BSA: body surface area; Kg/m2: kilogram per square meter; HR: heart rate; bpm: beats per minute; SBP: systolic blood pressure; mmHg: millimeter of mercury; DBP: diastolic blood pressure; HbA1c: glycated hemoglobin; µU/mL: micro units per milliliter; mg/dL: milligram deciliter; HOMA: homeostasis model assessment of insulin resistance; SGLT2: sodium-glucose 2 cotransporter; AT1-receiver: angiotensin type 1 receptors; T4: tetraiodothyronine.
Table 3. Mean and standard deviation of metabolic variables at baseline, 1 min and 15 min post-PBM for sham energies, 75, 150, 300, 450, and 600 J.
Sham75 J150 J300 J450 J600 J
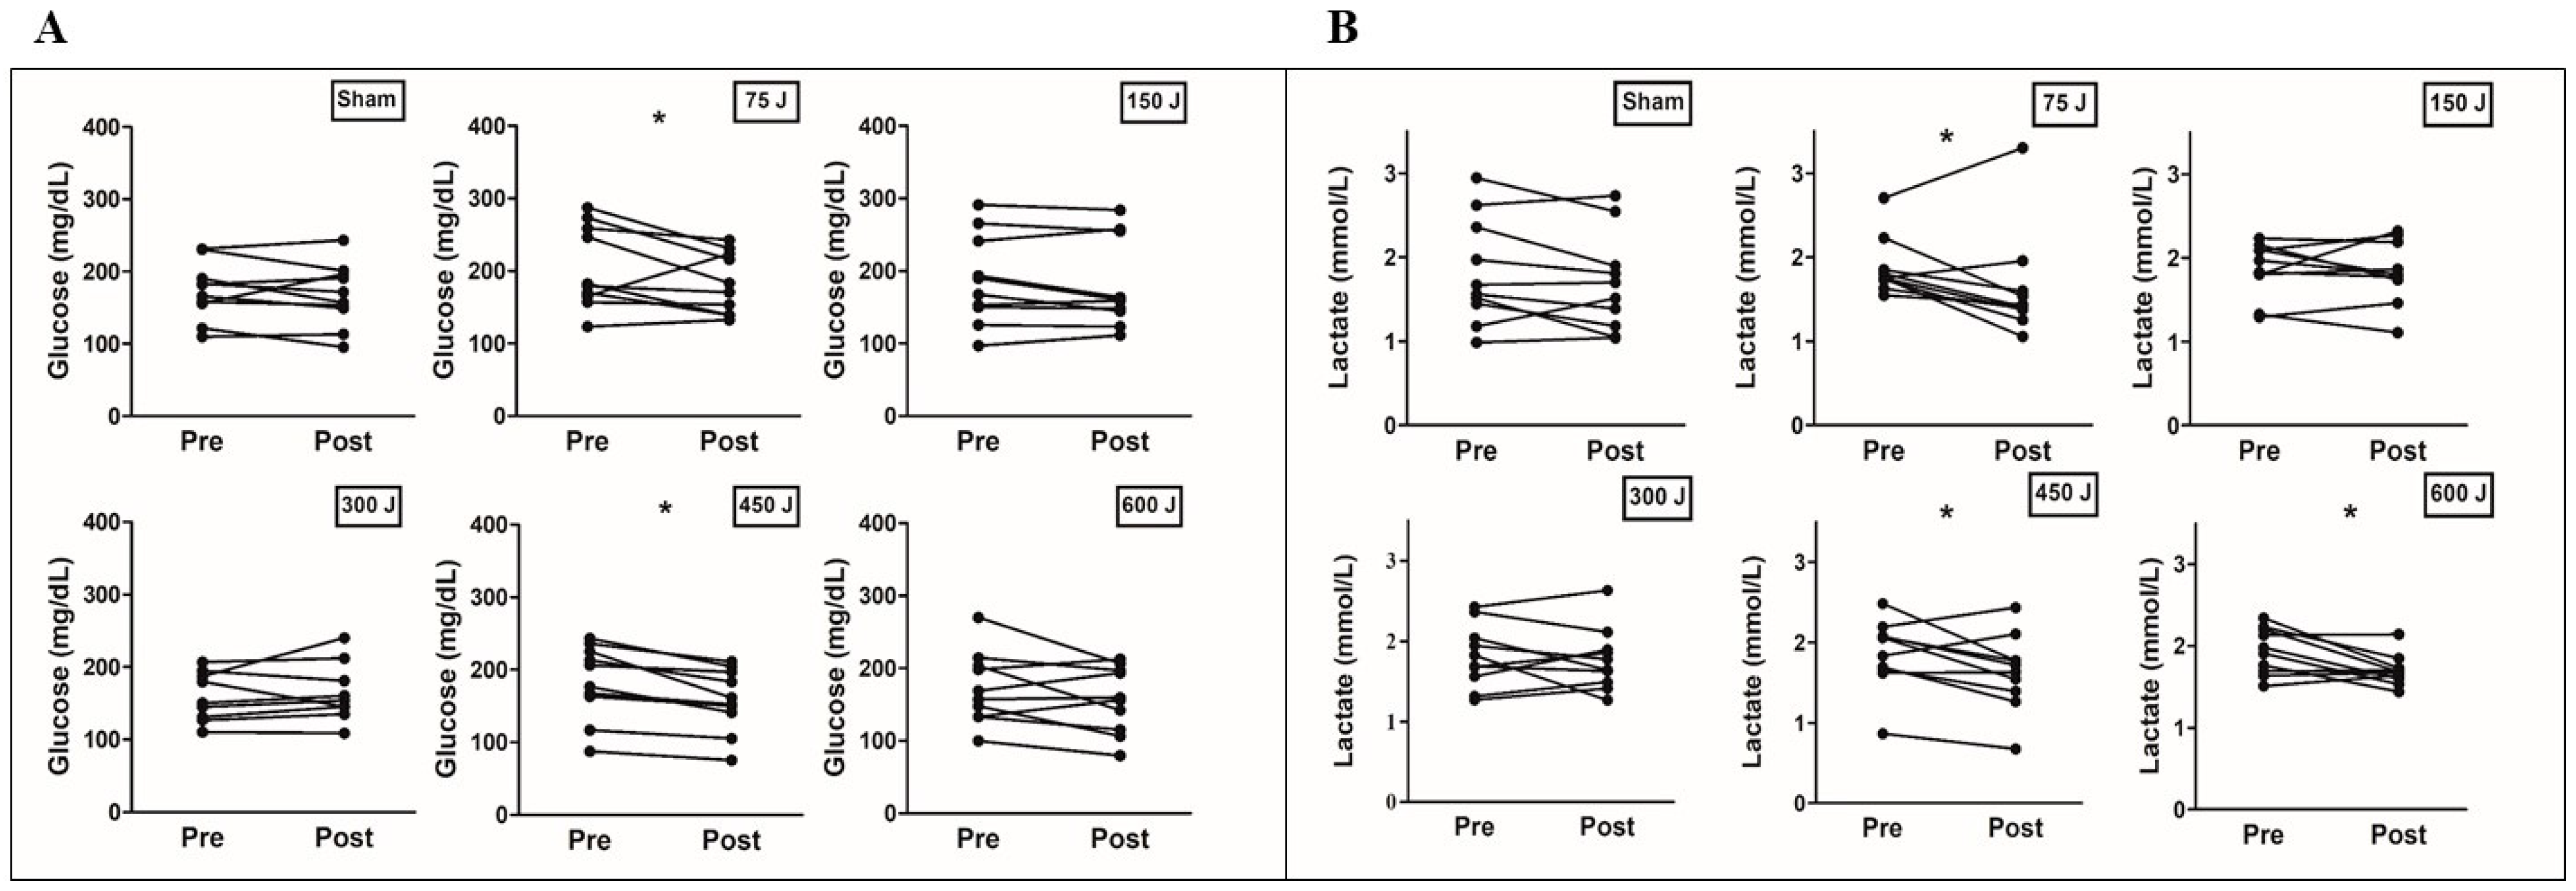
Glucose (mg/dL) (n = 10)
Baseline172.7 ± 39.9204.2 ± 56.8187.3 ± 62.2176.5 ± 63.6183.4 ± 51.4172.5 ± 49.5
1 min post-PBM172.4 ± 39.0197.7 ± 50.8190.6 ± 61.7182.6 ± 42168.4 ± 49.7165.0 ± 49.5
15 min post-PBM167.1 ± 43.5183.0 ± 42.1 *180.6 ± 61.2176.9 ± 54.1158.1 ± 43.8 *156.8 ± 45.9
Lactate (mmol/L) (n = 10)
Baseline1.82 ± 0.631.87 ± 0.341.86 ± 0.321.81 ± 0.391.85 ± 0.441.93 ± 0.28
1 min post-PBM1.76 ± 0.641.75 ± 0.471.88 ± 0.351.90 ± 0.531.70 ± 0.441.78 ± 0.28
15 min post-PBM1.68 ± 0.581.63 ± 0.63 *1.83 ± 0.371.77 ± 0.391.63 ± 0.47 *1.69 ± 0.19 *
PBM: photobiomodulation; J: Joules; mg/dL: milligram deciliter; mmol/L: millimole liter; *: p < 0.05 when compared with the baseline.
Table 4. Mean and standard deviation of hemodynamic variables at baseline, 1 min and 15 min post-PBM for sham energies, 75, 150, 300, 450, and 600 J.
Sham75 J150 J300 J450 J600 J
Q ˙ (L) (n = 13)
Baseline8.75 ± 2.48.13 ± 1.68.68 ± 2.08.56 ± 1.58.13 ± 1.38.83 ± 1.5
1 min post-PBM9.23 ± 2.68.97 ± 1.9 *8.84 ± 2.39.72 ± 1.7 *8.57 ± 1.58.69 ± 1.6
15 min post-PBM8.73 ± 2.58.78 ± 1.7 *8.85 ± 2.29.01 ± 1.5 #8.17 ± 1.78.54 ± 1.6
CI (mL/m2) (n = 13)
Baseline4.20 ± 1.13.91 ± 0.84.16 ± 0.84.11 ± 0.63.91 ± 0.64.25 ± 0.7
1 min post-PBM4.43 ± 1.24.32 ± 0.9 *4.26 ± 1.04.66 ± 0.7 *4.12 ± 0.74.18 ± 0.7
15 min post-PBM4.18 ± 1.14.24 ± 0.9 *4.24 ± 0.94.33 ± 0.6 #3.93 ± 0.84.11 ± 0.7
SV (mL) (n = 13)
Baseline114.5 ± 23.6102.3 ± 20.7115.7 ± 24.7110.3 ± 21.3110.9 ± 17.2110.3 ± 20.2
1 min post-PBM119.4 ± 25.7111.1 ± 21.6 *115.7 ± 27.0120.9 ± 17.0 *113.6 ± 22.6107.5 ± 16.5
15 min post-PBM116.0 ± 30.4110.9 ± 23.0 *118.1 ± 27.3116.8 ± 23.8110.8 ± 25.0108.4 ± 20.4
SVI (mL/m2) (n = 13)
Baseline55.1 ± 11.149.2 ± 9.755.4 ± 10.853.0 ± 9.953.3 ± 7.853.0 ± 9.2
1 min post-PBM57.3 ± 11.953.5 ± 10.8 *55.5 ± 11.958.1 ± 7.5 *54.7 ± 10.751.6 ± 7.0
15 min post-PBM55.7 ± 14.653.5 ± 12.2 *56.6 ± 12.256.2 ± 11.253.3 ± 11.752.1 ± 9.2
HR (bpm) (n = 13)
Baseline77 ± 1278 ± 1177 ± 1179 ± 11 ¥74 ± 879 ± 10 ¥
1 min post-PBM78 ± 1179 ± 1177 ± 1081 ± 10 * §76 ± 7 *80 ± 8
15 min post-PBM77 ± 1177 ± 1176 ± 1079 ± 11 #75 ± 978 ± 10 #
SBP (mmHg) (n =13)
Baseline138.3 ± 11.1132.6 ± 11.6132.4 ± 9.8130.2 ± 8.6133.5 ± 9.7137.1 ± 12.1
1 min post-PBM138.0 ± 16.3135.8 ± 15.8130.2 ± 7.9133.7 ± 12.4135.0 ± 12.0139.7 ± 17.3
15 min post-PBM137.3 ± 11.8133.6 ± 13.6133.2 ± 9.9132.0 ± 8.1134.7 ± 16.1138.3 ± 16.0
DBP (mmHg) (n = 13)
Baseline74.9 ± 7.773.1 ± 7.071.8 ± 4.971.6 ± 4.072.5 ± 5.074.1 ± 8.5
1 min post-PBM72.1 ± 10.671.4 ± 7.770.1 ± 5.670.1 ± 5.672.4 ± 6.375.3 ± 11.7
15 min post-PBM74.7 ± 7.871.6 ± 6.472.0 ± 4.371.0 ± 3.372.6 ± 6.274.1 ± 9.4
MAP (mmHg) (n = 13)
Baseline96.0 ± 8.192.9 ± 7.892.0 ± 6.191.1 ± 4.292.8 ± 5.995.1 ± 8.8
1 min post-PBM94.1 ± 12.192.9 ± 9.990.8 ± 6.091.3 ± 7.393.3 ± 7.496.7 ± 13.1
15 min post-PBM95.7 ± 8.292.3 ± 7.792.4 ± 5.691.4 ± 3.393.3 ± 8.895.5 ± 10.5
TPR (mmHg/L/min) (n = 13)
Baseline11.9 ± 3.012.3 ± 3.711.5 ± 2.411.1 ± 2.011.8 ± 2.111.1 ± 1.5
1 min post-PBM11.0 ± 2.511.0 ± 2.6 *11.2 ± 2.99.8 ± 1.4 *11.4 ± 2.211.5 ± 1.7
15 min post-PBM12.2 ± 4.4 #11.2 ± 2.9 *11.2 ± 2.410.5 ± 1.611.9 ± 1.911.7 ± 2.3
TPRI (mmHg.min/L/m2) (n = 13)
Baseline5.7 ± 1.65.9 ± 1.95.6 ± 1.45.4 ± 1.25.7 ± 1.25.3 ± 0.8
1 min post-PBM5.3 ± 1.25.3 ± 1.3 *5.4 ± 1.64.7 ± 0.9 *5.5 ± 1.25.6 ± 0.9
15 min post-PBM5.9 ± 2.4 #5.4 ± 1.5 *5.4 ± 1.45.1 ± 1.05.8 ± 1.15.6 ± 1.3
PBM: photobiomodulation; J: Joules; Q ˙ : cardiac output; L: liter; CI: cardiac index; mL/m2: milliliter per square meter; SV: end stroke volume; mL: milliliter; SVI: stroke volume index; HR: heart rate; bpm: beats per minute; SBP: systolic blood pressure; mmHg: millimeter of mercury; DBP: diastolic blood pressure; MAP: mean arterial pressure; TPR: total peripheral resistance; mmHg/L/min: millimeters of mercury per liter per minute TPRI: total peripheral resistance index; mmHg.min/L/m2: millimeters of mercury per minute per liter per square meter. *: p < 0.05 when compared with baseline. #: p < 0.05 when compared with 1 min post-PBM. §: p < 0.05 when compared to the energy of 450 J in the moment 1 min post-PBM. ¥: p < 0.05 when compared to the energy of 450 J in the baseline.
Publisher’s Note: MDPI stays neutral with regard to jurisdictional claims in published maps and institutional affiliations.

