1. Introduction
Long-haul optical fiber links are generally limited by various fiber centric impairments which result into signal degradation. Optical power loss is among the main factors which determines the power budget that can be used to extend the range of the link, the number of subscribers and the data rate per subscriber [
1]. Therefore, compensation of the optical losses helps in realizing the long-haul optical networks. Optical amplifiers (OAs) are active devices which can be used to compensate the optical losses originated by fiber attenuation and insertion losses of different passive components. Initially, semiconductor optical amplifiers (SOAs) were the only available option for optical amplification having one of the major drawbacks of compatibility issues with optical components and fiber transmission system [
2]. Similarly, O-to-E and E-to-O conversion is also a major problem in SOAs which increases the latency, complexity, and cost [
2]. Thanks to the invention of rare-earth doped fiber amplifiers (DFAs) by Mears in 1987 which can amplify the optical signals with high gain solely in optical domain hence resolving the compatibility, cost, and latency related issues [
3]. Major rare-earth dopants that can be used in the fabrication of DFAs are Erbium, Thulium, Praseodymium, Holmium, and Ytterbium [
4]. However, a significant limitation of these DFAs is that beyond 2 μm, zero emission occurs for Praseodymium, Erbium, and Ytterbium and reduced emission occurs for Thulium, thus, making them impractical for optical amplification.
It is reported recently that HDFAs operating beyond 2 μm have attracted rapid research interests due to potential applications in various emerging technologies such as light detection and ranging, high capacity DWDM networks, coherent lightwave systems, and sensing applications [
5,
6,
7,
8,
9]. HDFAs have multiple advantages compared to other DFAs such as high power conversion efficiency (PCE), high gain, high output power, and mid-IR amplification [
5]. The significance of 2–2.15 μm wavelength range in the applications of optical communication and optical sensor technology is undeniable. Currently, widely employed 1.55 μm optical window specific for optical communications is facing its capacity crunch [
4]. Therefore, it is inevitable to explore new wavelength regions to accommodate the ever increasing growth in customers demand for greater transmission bandwidth [
4]. Recently, 2–2.15 μm wavelength range is getting huge research attention to provide high bandwidth by the telecom system designers and network operators. Similarly, lasers operating in the 2–2.15 μm wavelength range are best suited to measure wind velocity, detection of water vapours, and CO
2 concentration [
10]. The detection of water vapour and CO
2 is useful for the prediction of weather and climate changes and for analysing the green house effect [
10]. Wind sensing enables us to forecast weather conditions, track storms and ensure the safety of airlines [
10]. HDFAs exhibit extremely high small-signal gain, low NF, high output power, and high PCE, as compared to other DFAs [
5]. Therefore, Holmium is being considered as an excellent rare-earth element for employment as gain medium as compared to Thulium for 2–2.15 μm wavelength range for optical communication and sensing applications [
11].
DFAs have researched widely since past few decades but as such HDFAs are concerned, we find handful contributions such as [
5,
12,
13,
14,
15,
16,
17] because this dopant is being recently considered for applications in 2–2.15 μm wavelength range. R. E. Tench et al. proposed a medium efficiency HDFA design employing an alternate pump wavelength of 1.84 μm instead of conventional in-band pump wavelength of 1.940 μm. Using this new pump wavelength, a small-signal peak gain and output power of 54 dB and 1 W, respectively are obtained at signal wavelength of 2.050 μm while incorporating a short length of HDF equals to 3 m [
5]. A NF of 6.8 dB and PCE of 64% is also demonstrated. Kamynin et al. demonstrated the amplification of optical signals in the wavelength range of 2–2.15 μm by HDFA employing a pump of 1.125 μm wavelength [
12]. A gain of around 35 dB was observed. Simakov et al. proposed [
13] a HDFA which produces a peak gain of 25 dB at 2.04 μm and a NF of 4–6 dB is also obtained when the gain medium is excited by pump of 1.14 μm wavelength. Moreover, the performance of the amplifier was also compared at various pump wavelengths. A maximum gain of 41 dB at signal wavelength of 2.06 μm by using a pump of 1.95 μm with a NF of 7–10 was achieved. In [
14], a wideband HDFA was realized providing a small-signal gain of approximately 28 dB and NF of 4–9.5 dB for optical communication applications in the wavelength range of 2.05–2.13 μm. R. E. Tench et al. proposed a single and double stage-pumped HDFA providing small-signal peak gain and output power of 43 dB and 3.5 W, respectively at 2.051 μm while a PCE of 70% is also obtained [
15]. Zhluktova et al. proposed a HDFA which produce a gain of 34.5 dB and output power of 0.798 W for signal having wavelength of 2.016 μm [
16]. A broadband Thulium and Holmium dopants based hybrid amplifier was proposed where peak gain of 49.1 dB and output power of 3.54 W at 2.051 μm was demonstrated [
17].
In this work, to the best of our knowledge we optimize the performance of Holmium doped fiber amplifier in such a way to achieve a high small-signal peak gain and saturated output power along with extra benefits of simple structure and cost efficiency. The HDFA is based on a single in-band forward pump source of 1.94 μm wavelength providing gain in the wavelength range of 2–2.15 μm. After optimizing the length of HDF, Ho3+ concentration, and pump power, a highest ever small-signal gain of 56.5 dB, PCE of 79%, and output power of 3 W is achieved at 2.0321 μm. Moreover, a highest ever 3 dB saturated output power of 33.3 dBm and minimum NF of 8.2 dB is also observed at signal wavelength of 2.0321 μm. By considering the ion-ion interaction, a reduction of 24.2 dB and 0.051 W is observed in peak gain and output power of HDFA, respectively. Based on the above analysis, the exclusive findings of this research are summarized below:
The optimized design of the amplifier yields a small-signal peak gain of 56.5 dB and output power of 3 W at 2.0321 μm.
Output power obtained at 3 dB saturation point is 33.3 dBm and minimum NF of 8.2 dB is observed at signal wavelength of 2.0321 μm.
3 dB gain and ASE noise bandwidths of 35 nm and 48 nm are obtained, respectively.
The optimized design of HDFA provides promising results alongwith simplicity and cost efficiency.
The simulation is performed using OptiSystem commercial software [
18]. OptiSystem is used to optimize the Ho
3+ concentration, Holmium doped fiber length, and pump power to evaluate the performance. We believe that the optimized design of the HDFA will help the designers of photonics industry to tailor their end products for efficient and cost effective amplification in the wavelength range of 2–2.15 μm.
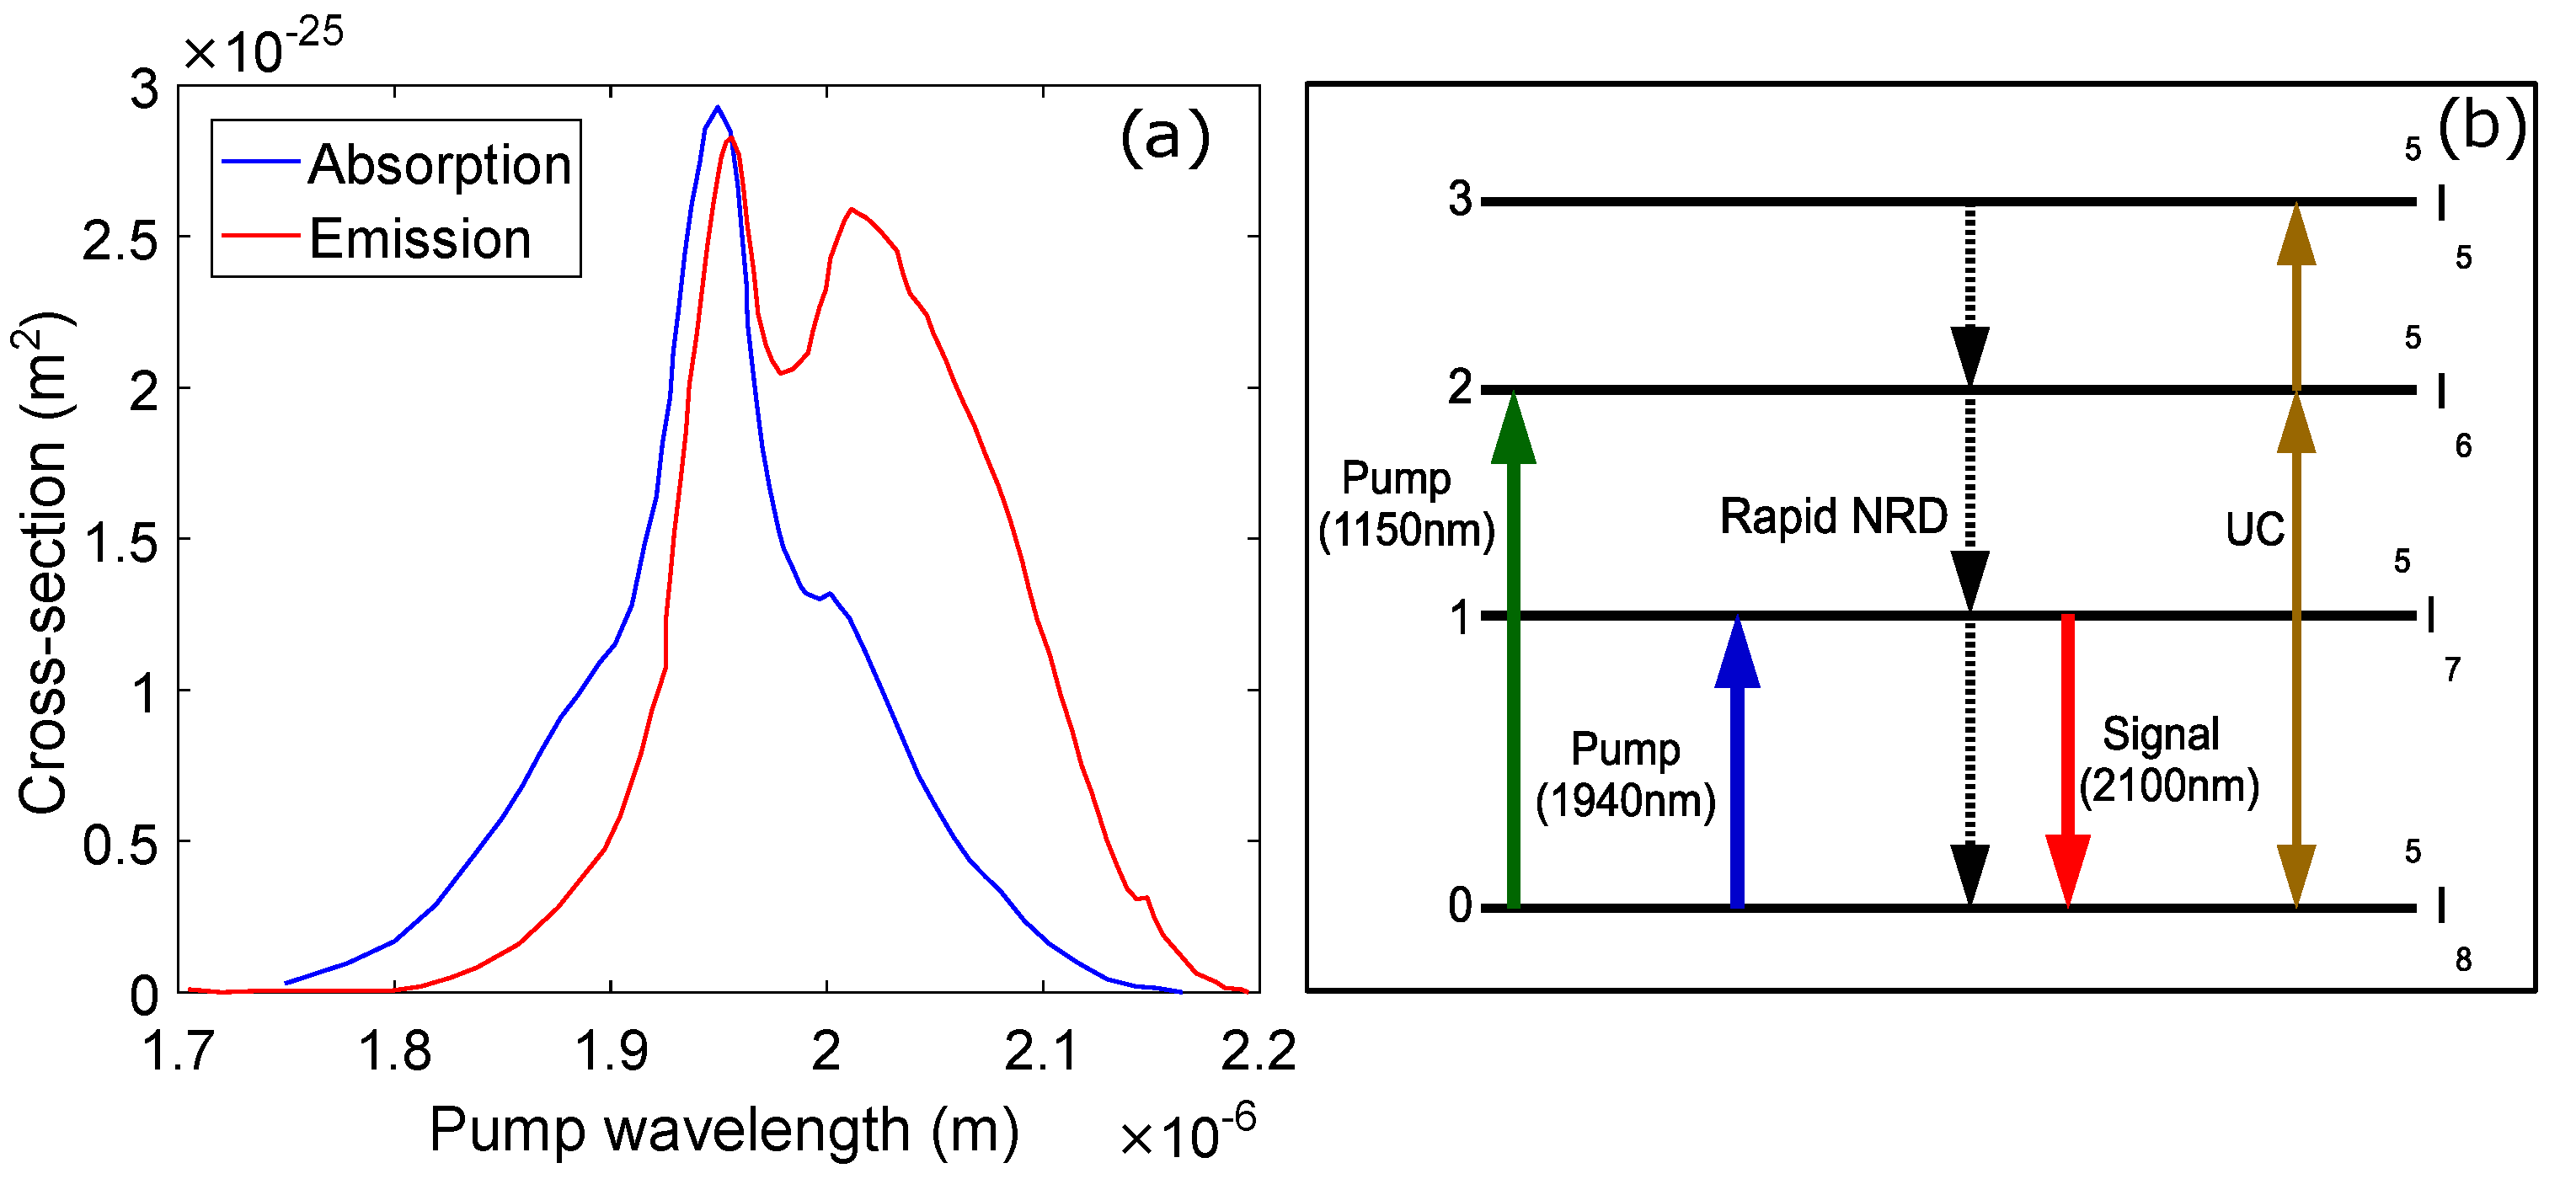
2. Theoretical Background
The signal amplification mechanism in HDFA may be understood by analyzing the absorption and emission spectra along with energy level diagram of Ho
3+. There are two types of pumping typically used in HDFAs which are in-band or resonant pumping and indirect pumping, which can be forward, backward or bidirectional [
19,
20]. The pump absorption and emission occur in the same transition for in-band pumping while in the case of indirect pumping, both occur in different transitions [
20]. The most commonly used pump wavelengths for in-band and indirect pumping are 1.94 μm and 1.15 μm, respectively [
13,
20]. The 1.94 μm pump wavelength (corresponding to
5I8→
5I
7 transition) is realized by Thulium-doped fiber lasers while Raman fiber or Ytterbium-doped fiber lasers are used for 1.15 μm pump wavelength (corresponding to
5I8→
5I
6 transition) as shown in
Figure 1b. The pump absorption and emission spectra of Ho
3+ are shown in
Figure 1a and in [
13]. Typically, the HDF should be pumped using wavelengths where absorption cross section is maximum.
It may be observed from
Figure 1a that maximum absorption occurs around 1.94 μm [
13]. Therefore, we have selected 1.94 μm wavelength for pumping the HDF. The simplified energy diagram of Ho
3+ has been shown in
Figure 1b where the ground state energy is taken as
5I
8 manifold while the first excited state is
5I
7. The 1.15 μm pump is typically injected at a higher energy level which is
5I
6 manifold [
20]. This state rapidly first decays non-radiatively to first excited state with spontaneous emission and then to ground energy state radiatively with stimulated emission. On the other hand when in-band pumping is injected at
5I
7 manifold, considerable bleaching of the absorption takes place owing to aggregation of ground state depletion and stimulated emission [
20]. The ion-ion interaction that includes homogeneous up-conversion, cross relaxation and pair induced quenching, is a non-radiative energy transfer between a pair of excited Holmium ions. This energy transfer occurs due to electric multi-polar interaction and can adversely affect the performance of HDFA [
21]. Consequently, the ion-ion interaction results in the transfer of one Ho
3+ ion to an excited manifold while the other one is demoted to low energy manifold. There are two up-conversion (UC) processes occur in HDF which can be expressed as UC1 (
5I
7,
5I7→
5I
6,
5I
8) and UC2 (
5I
7,
5I7→
5I
5,
5I
8) [
21]. Due to very short lifetime of
5I
7 manifold, both UCs collectively considered as one [
21]. The up-conversion efficiency (UCE) typically occurs in ion-clusters in fibers having very high doping concentration of Ho
3+.
On the basis of four level model shown in
Figure 1b, the system can be represented by the carrier rate expressions mentioned as follows [
20].
In Equations (1) and (2), the pump absorption or ground state absorption (
) and the laser emission or stimulated emission (
) rates are given by the following expressions [
20].
Similarly,
rate is given by the following expression [
20].
In Equation (
6) and Equation (
7),
and
are called power filling factors of pump and signal, respectively and can be calculated by the following expression [
20].
Moreover,
r and
can be given as.
In Equation (
10),
V is given by
where NA is numerical aperture. Different symbols used in Equations (1)–(10) can be elaborated in
Table 1.
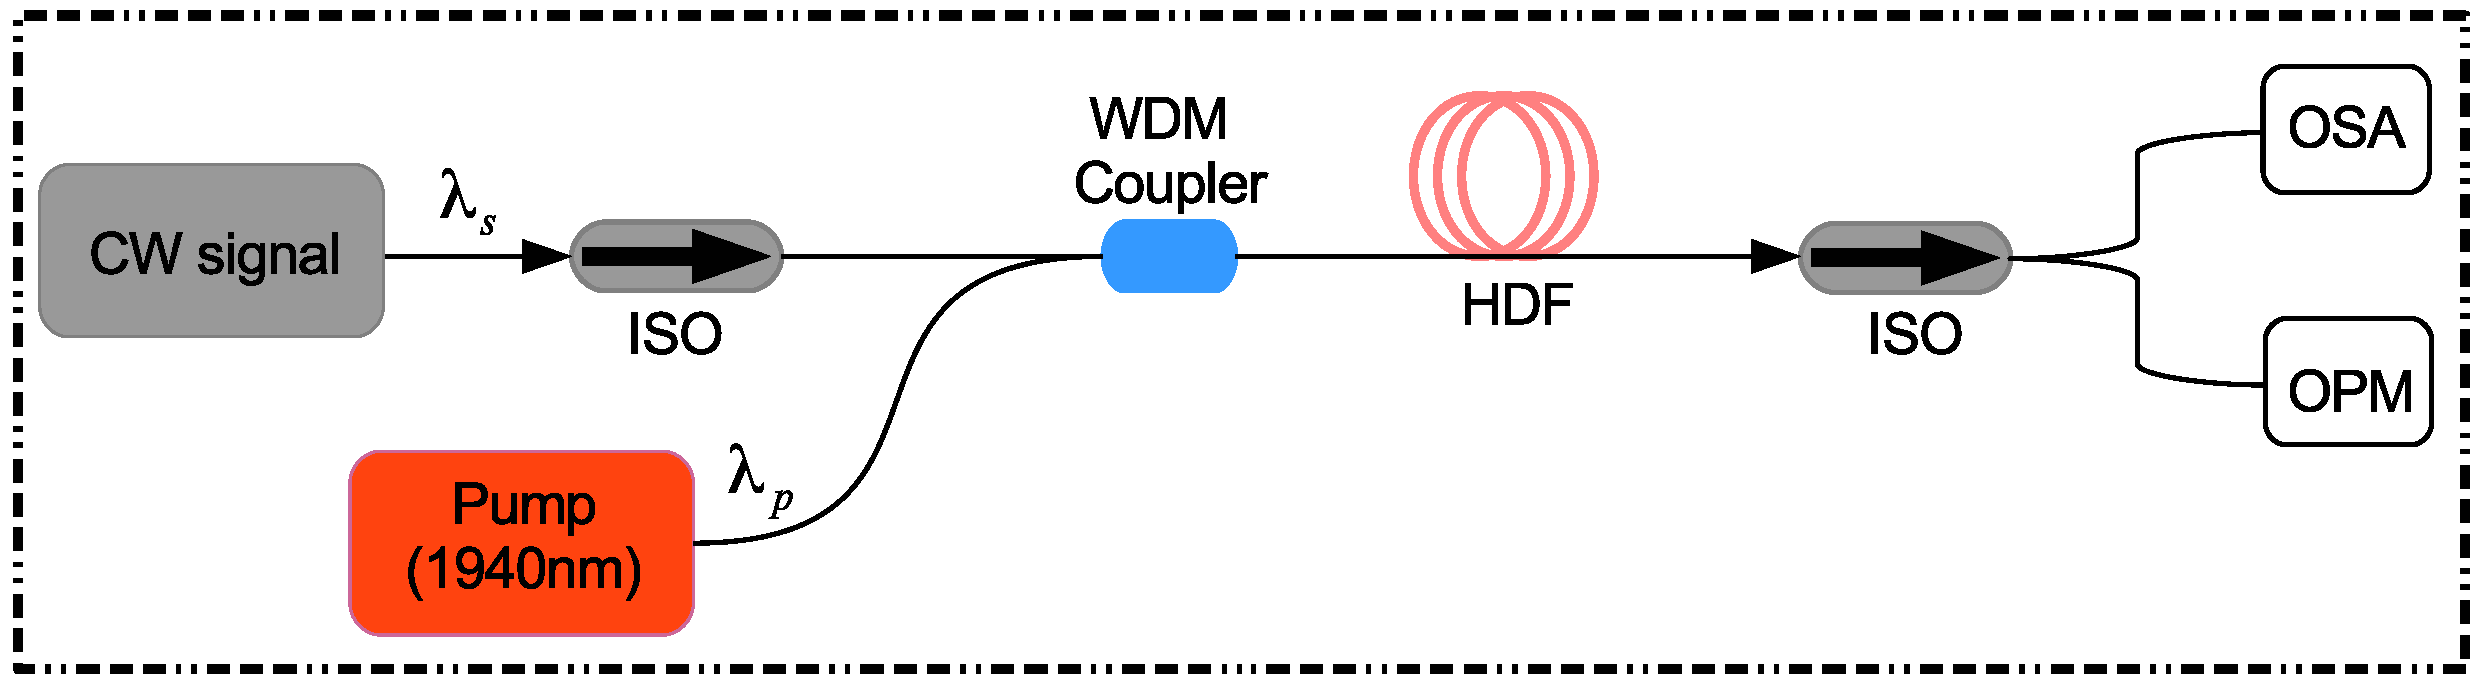
3. Simulation Setup
The schematic of the optimized design of the HDFA is shown in
Figure 2. It is comprised of a pump, a CW laser representing the signal which is to be amplified, a WDM coupler, a gain medium which is a short piece of fiber that is doped with Ho
3+, and two isolators. The short piece of HDF is the most critical component in the proposed optimized design whose parameters greatly affect the performance of the HDFA. The parameters of HDF used in the simulation are shown in
Table 2, which are offered by iXblue for their polarization maintaining Ho
3+ doped single clad silica fiber used in experimental work [
22]. This fiber is nominally single-mode at 2.05 μm having V-number and mode-field diameter (MFD) of 2.45 and 8.6 μm, respectively. The optical isolators used in the setup eliminate the back reflections that can disturb the amplifier’s normal operation [
4]. Moreover, isolators also prevent the amplifier from working in the lasing regime. The parameters of the optical isolators employed in this work are shown in
Table 2, which is commercially offered by Thorlabs [
23].
First of all, the HDF is pumped with an in-band pump source having a wavelength of
= 1.94 μm and an optimized pumping power of 3.5 W. As a result of pumping, the Ho
3+ in HDF are excited from
5I
8 manifold to
5I
7 manifold which is at higher energy. The photons belonging to the signal that have emission wavelength in the 2–2.15 μm spectral range, interact with the excited Ho
3+ at
5I
7 manifold. This interaction results into a radiative transition of Ho
3+ from
5I
7 manifold to
5I
8 manifold with the release of supplementary photons as a consequence of stimulated emission of excited Ho
3+. The phase and frequency of the newly generated photons are identical to the photons of the signal. The important results are monitored and analyzed with the help of dual port WDM analyzer, optical spectrum analyzer (OSA) and optical power meter (OPM). The operating parameters of OSA and OPM used in this work are similar to OSA203C and PM400, respectively which are commercially available models offered by Thorlabs [
23]. The critical parameters used in simulation are shown in
Table 2.
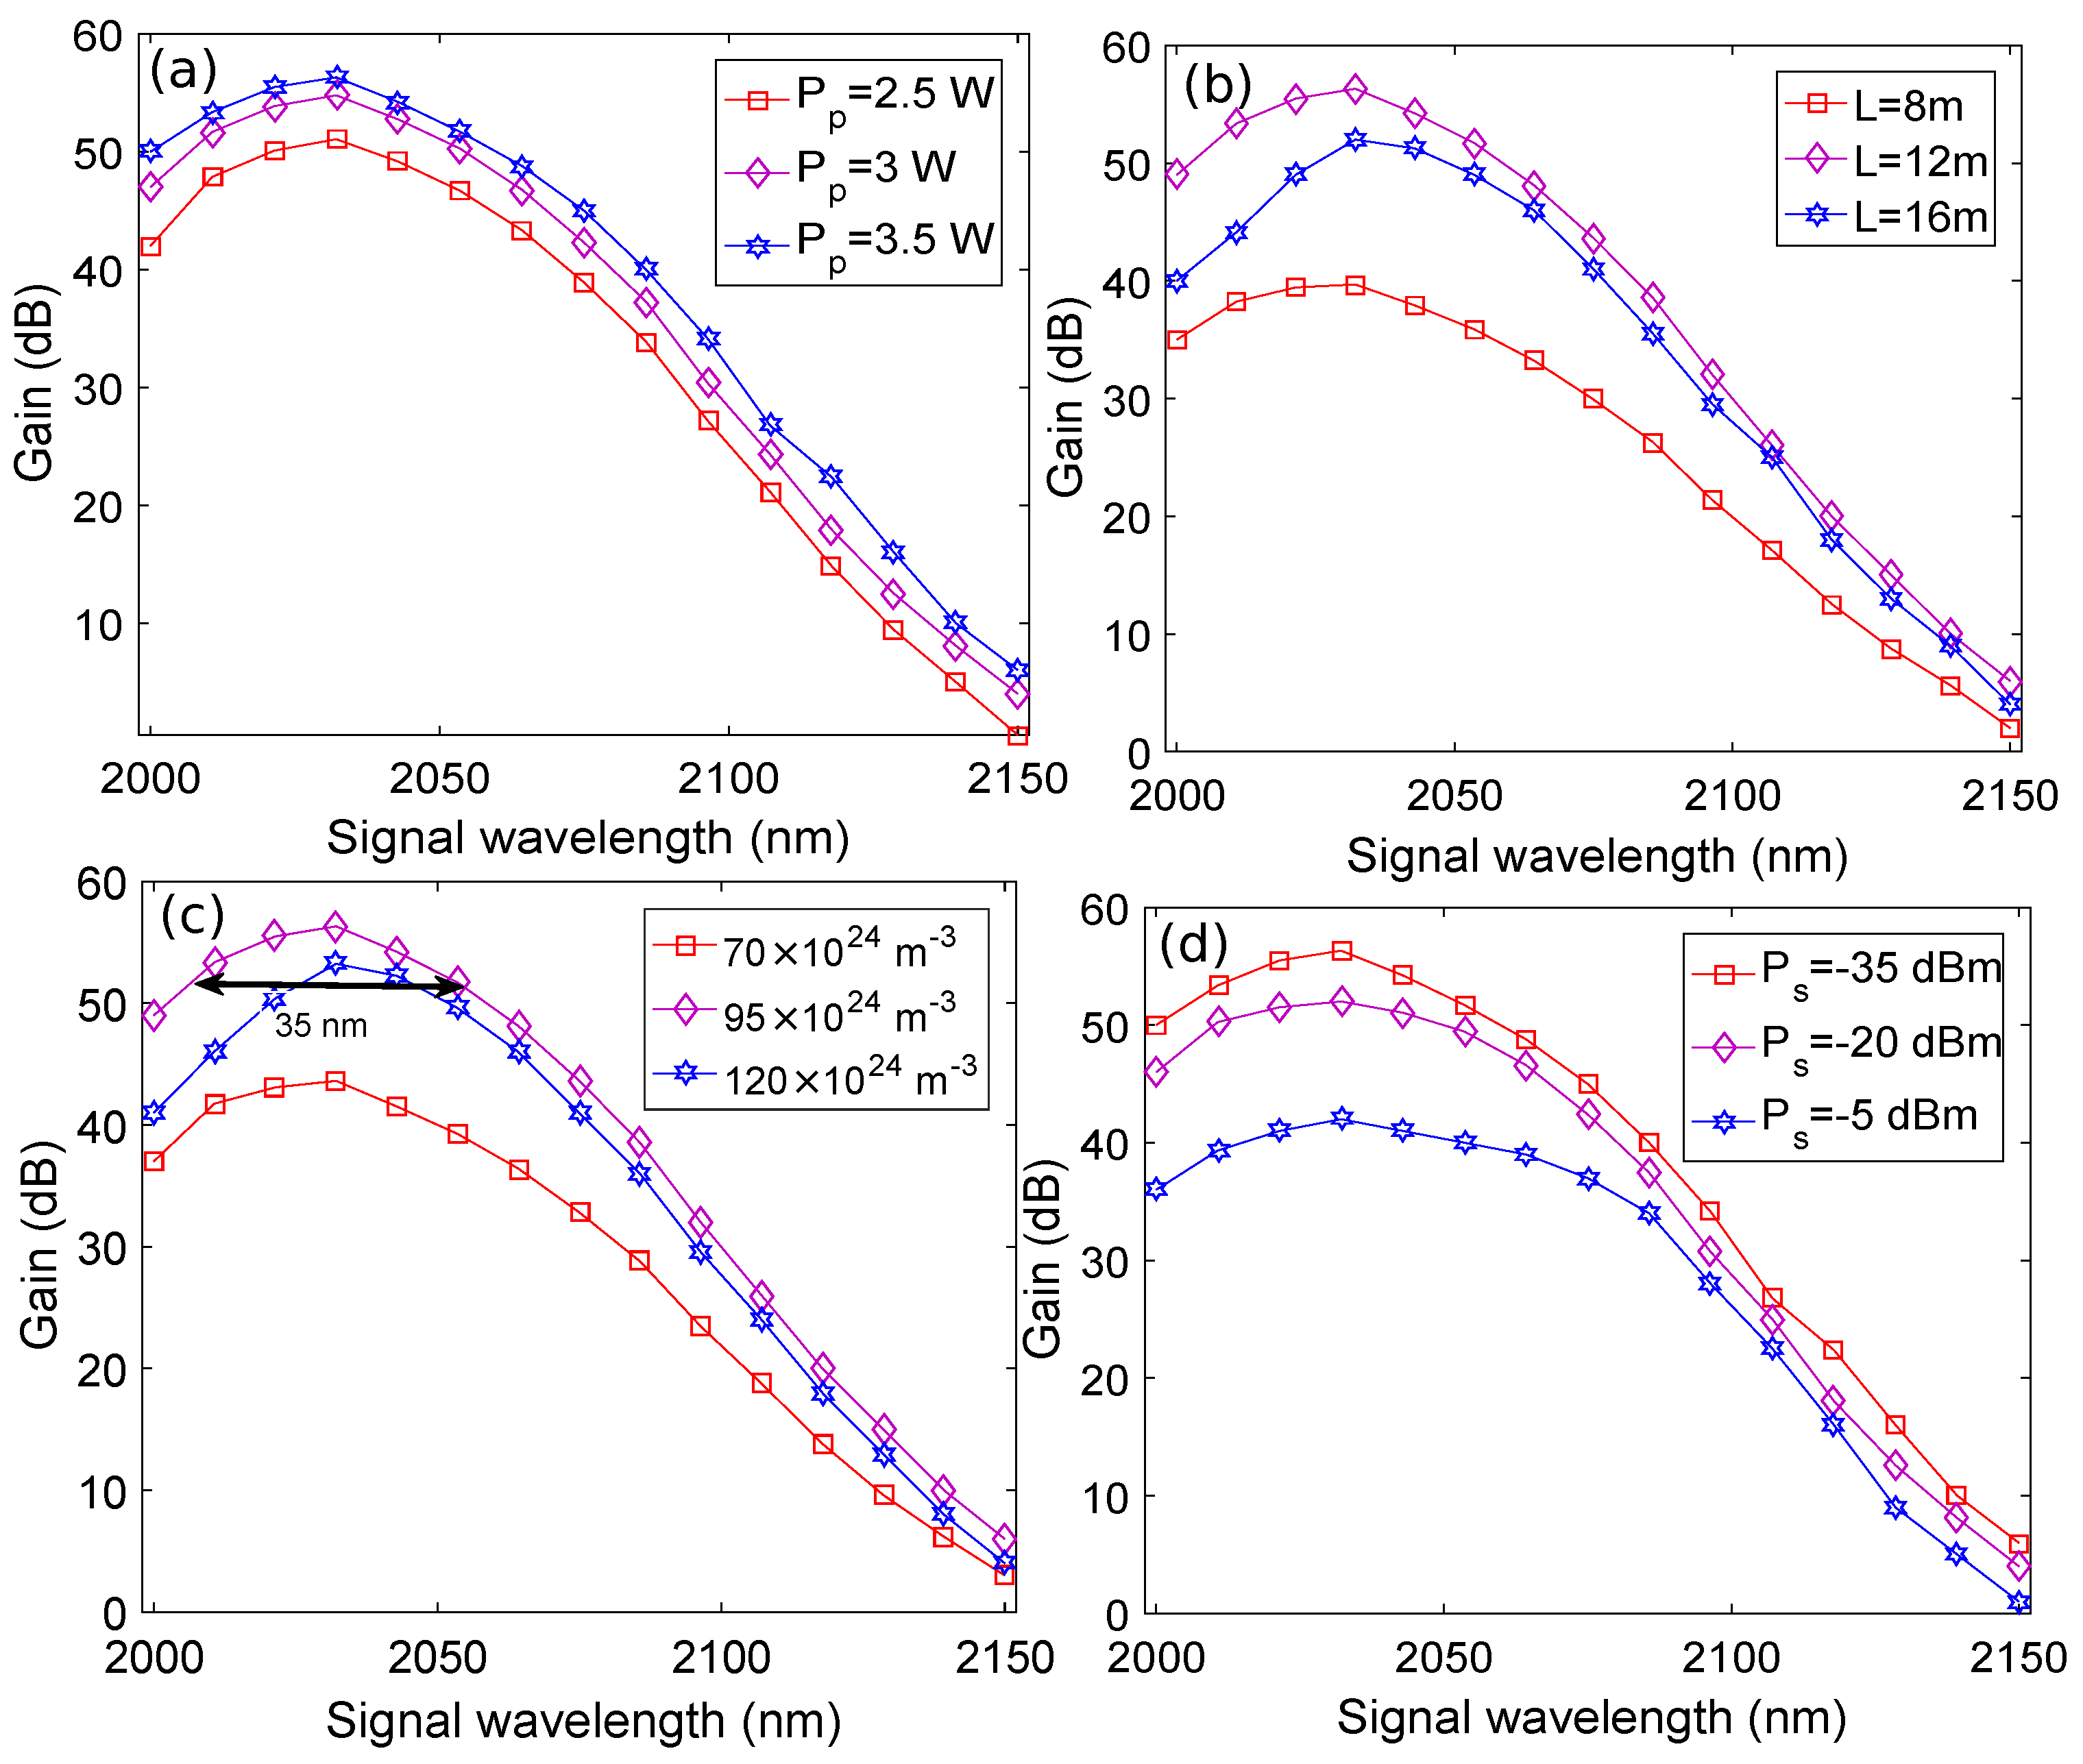
4. Results and Discussion
The performance of the HDFA is investigated for different conditions such as pumping power, HDF length, doping concentration of Ho
3+, and input signal power levels, as shown in
Figure 3. It may be observed from
Figure 3a that the highest value of gain of the HDFA is 56 dB at input signal wavelength of 2.0321 μm. For this gain, the value of pump power, input signal power, HDF length, and doping concentration are 3.5 W, −35 dBm, 12 m, and 95 × 10
24 m
−3, respectively. It is also clear that no additional amplifier gain is observed beyond 3.5 W. Similarly, it may be observed from
Figure 3b that the amplifier exhibits the highest gain of around 56 dB for HDF length of 12 m and input signal wavelength of 2.0321 μm. To achieve this gain, the pump power is 3.5 W, while the input signal power and doping concentration are chosen as −35 dBm and 95 × 10
24 m
−3, respectively. The gain of the amplifier decreased to 52 dB when the length of the HDF is 16 m, which may be attributed to a decrease in population inversion and signal absorption [
4,
24]. Therefore, HDF length of 12 m is used for rest of the calculations because it yields the highest small signal gain.
Figure 3c shows the amplifier gain versus input signal wavelength plots for different doping concentrations of Ho
3+ for input signal power of −35 dBm, pump power of 3.5 W, and HDF length of 12 m. It may be noticed that the gain of the amplifier is 56.3 dB when the doping concentration was 95 × 10
24 m
−3. Moreover, a 3 dB gain bandwidth of 35 nm is observed at the chosen values of pump power, HDF length, and Ho
3+ doping concentration when the input signal power is −35 dBm. Finally,
Figure 3d shows the amplifier gain versus input signal wavelength for different input signal power levels using the selected parameters. It may be observed from
Figure 3d that the lowest and highest gain of the amplifier is equal to 42 dB and 56.5 dB at −5 dBm and −35 dBm, respectively for signal wavelength of 2.0321 μm.
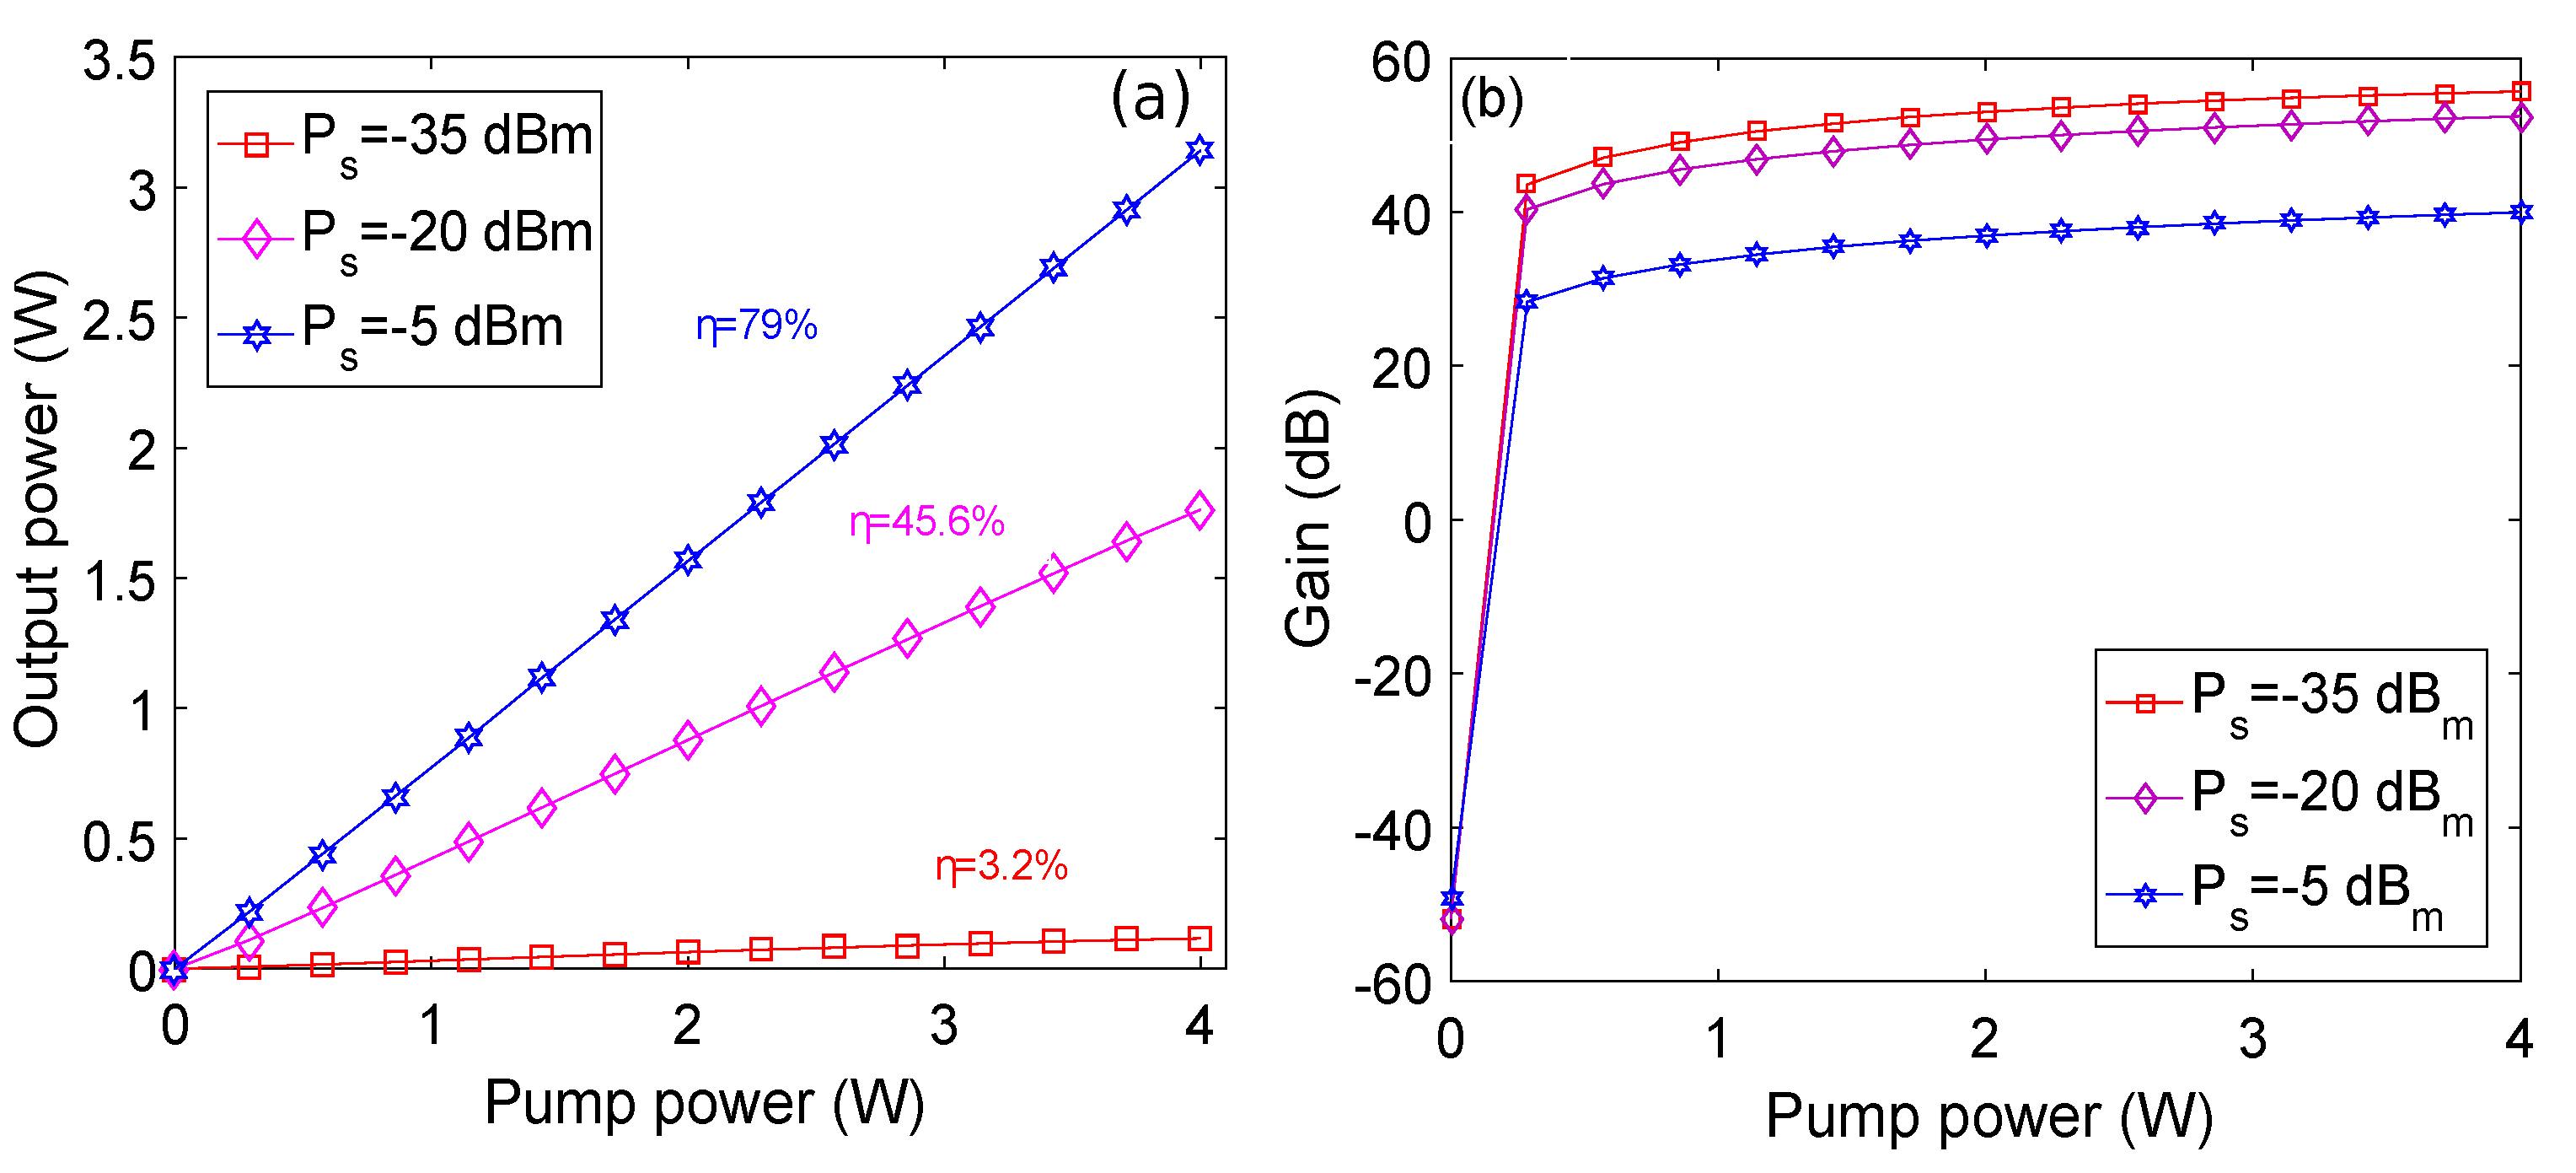
Figure 4 shows the output power and gain plotted against pump power for different values of signal powers at optimized length of HDF and doping concentration of Ho
3+ for an input signal wavelength of 2.0321 μm. It may be observed from
Figure 4a that PCE of 3.2% is obtained for signal power of −35 dBm. The highest value of PCE obtained is equal to 79%, that is for signal power of −5 dBm. Moreover, it is also evident that an output power of around 3 W is achieved at 2.0321 μm for pump and signal powers of 3.5 W and −5 dBm, respectively. Similarly, it may be observed from
Figure 4b that the gain has a negligible value of around −50 dB when the pump power is 0 W, which is due to non-existence of lasing action. The gain starts increasing rapidly with an increase in pump power due to initiation of lasing action. It is evident that the rise of gain with an increase in pump power is highest for signal power of −35 dBm.
Figure 5 describes the effect of varying the pump wavelength on output power and gain of the amplifier at optimized length of HDF and doping concentration of Ho
3+ for signal wavelength and power of 2.0321 μm and −35 dBm, respectively. It is clear that the gain and output power of the amplifier varies with the pump wavelength. The reason behind this trend could be explained by referring to
Figure 1a which shows that different wavelengths have different absorption and emission cross sections. The absorption of pump photons occur in the 1.75–2.15 μm wavelength range, having peak absorption around 1.94 μm. After this wavelength, the pump absorption gradually decreases. Similarly, emission exists between 1.8 μm to 2.2 μm region with peak value at around 1.97 μm. When the pump wavelength is increased between the 1.88–1.98 μm range, the gain of the HDFA initially increases due to an increase in pump absorption until the wavelength of peak absorption reaches. After this value, the gain starts decreasing due to a decrease in absorption of the pump photons, as shown in
Figure 5a. A similar trend is observed for the output power of the HDFA, as shown in
Figure 5b. The output power first increases with an increase in the pump wavelength up to 1.938 μm due to an increase in pump absorption until the wavelength of peak absorption reaches. After this value, the output power stops increasing further and starts decreasing drastically following the absorption spectrum.
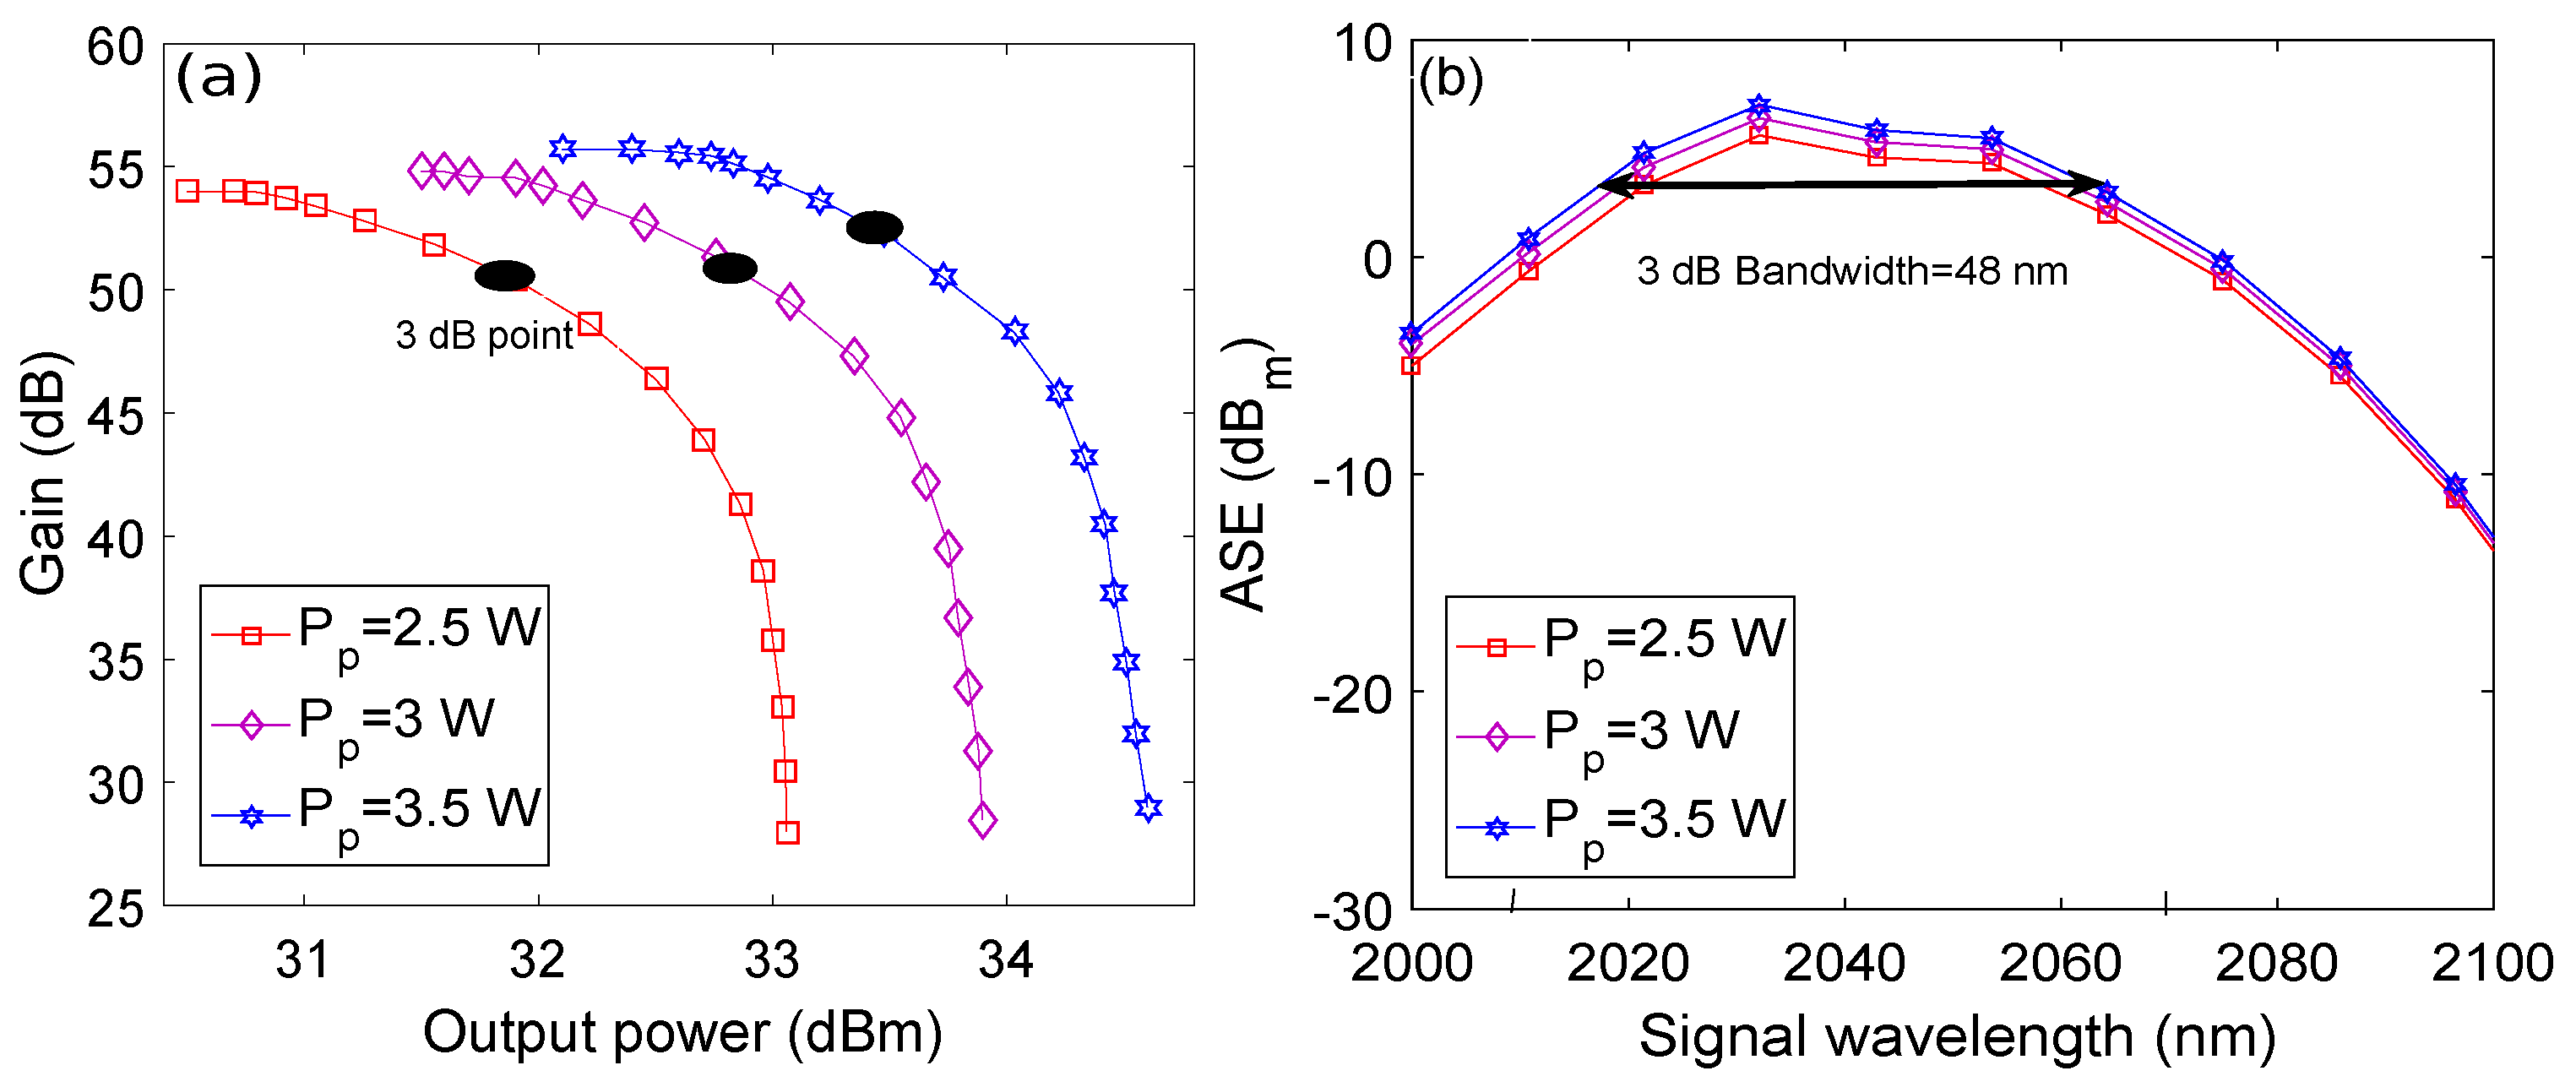
3 dB saturated output power of an optical amplifier is the highest output power from an amplifier when signal of enough optical power, usually around 0 dBm is given to the amplifier [
25].
Figure 6a presents the variation in gain of the amplifier at optimized parameters, plotted against the output power for different values of the pump power. The points where 3 dB saturated output power of HDFA is obtained have also been marked on the plots. It may be observed that 3 dB saturated output powers equal to 31.8 dBm, 32.8 dBm, and 33.7 dBm are observed for pump powers of 2.5 W, 3 W, and 3.5 W, respectively.
Figure 6b shows ASE versus signal wavelength plots for different pump powers obtained at optimized parameters. It may be seen that peak ASE noise power of 7 dBm is obtained at 3.5 W pump power for signal wavelength of 2.0321 μm. The ASE power has a decreasing trend while moving towards longer wavelengths. The reason behind this trend may be explained by considering
Figure 1a, where it may be observed that the HDF peak emission is around 1.96 μm, while it has another lower peak at 2.01 μm. At the same wavelength of 1.96 μm, the absorption of the pump power is almost maximum. The conversion efficicncy of this absorbed pump power to signal power depends on the signal wavelength, Holmium ions concentration, and the length of the HDF. It should be noted that due to the overlap of emission and absorption spectra, the signal wavelength also gets absorbed while travelling through the HDF. Therefore, the overall gain of the input signal depends upon the balance of the absorption and emission processes [
4]. Further, 3 dB bandwidth of around 48 nm is obtained at 3.5 W pump power.
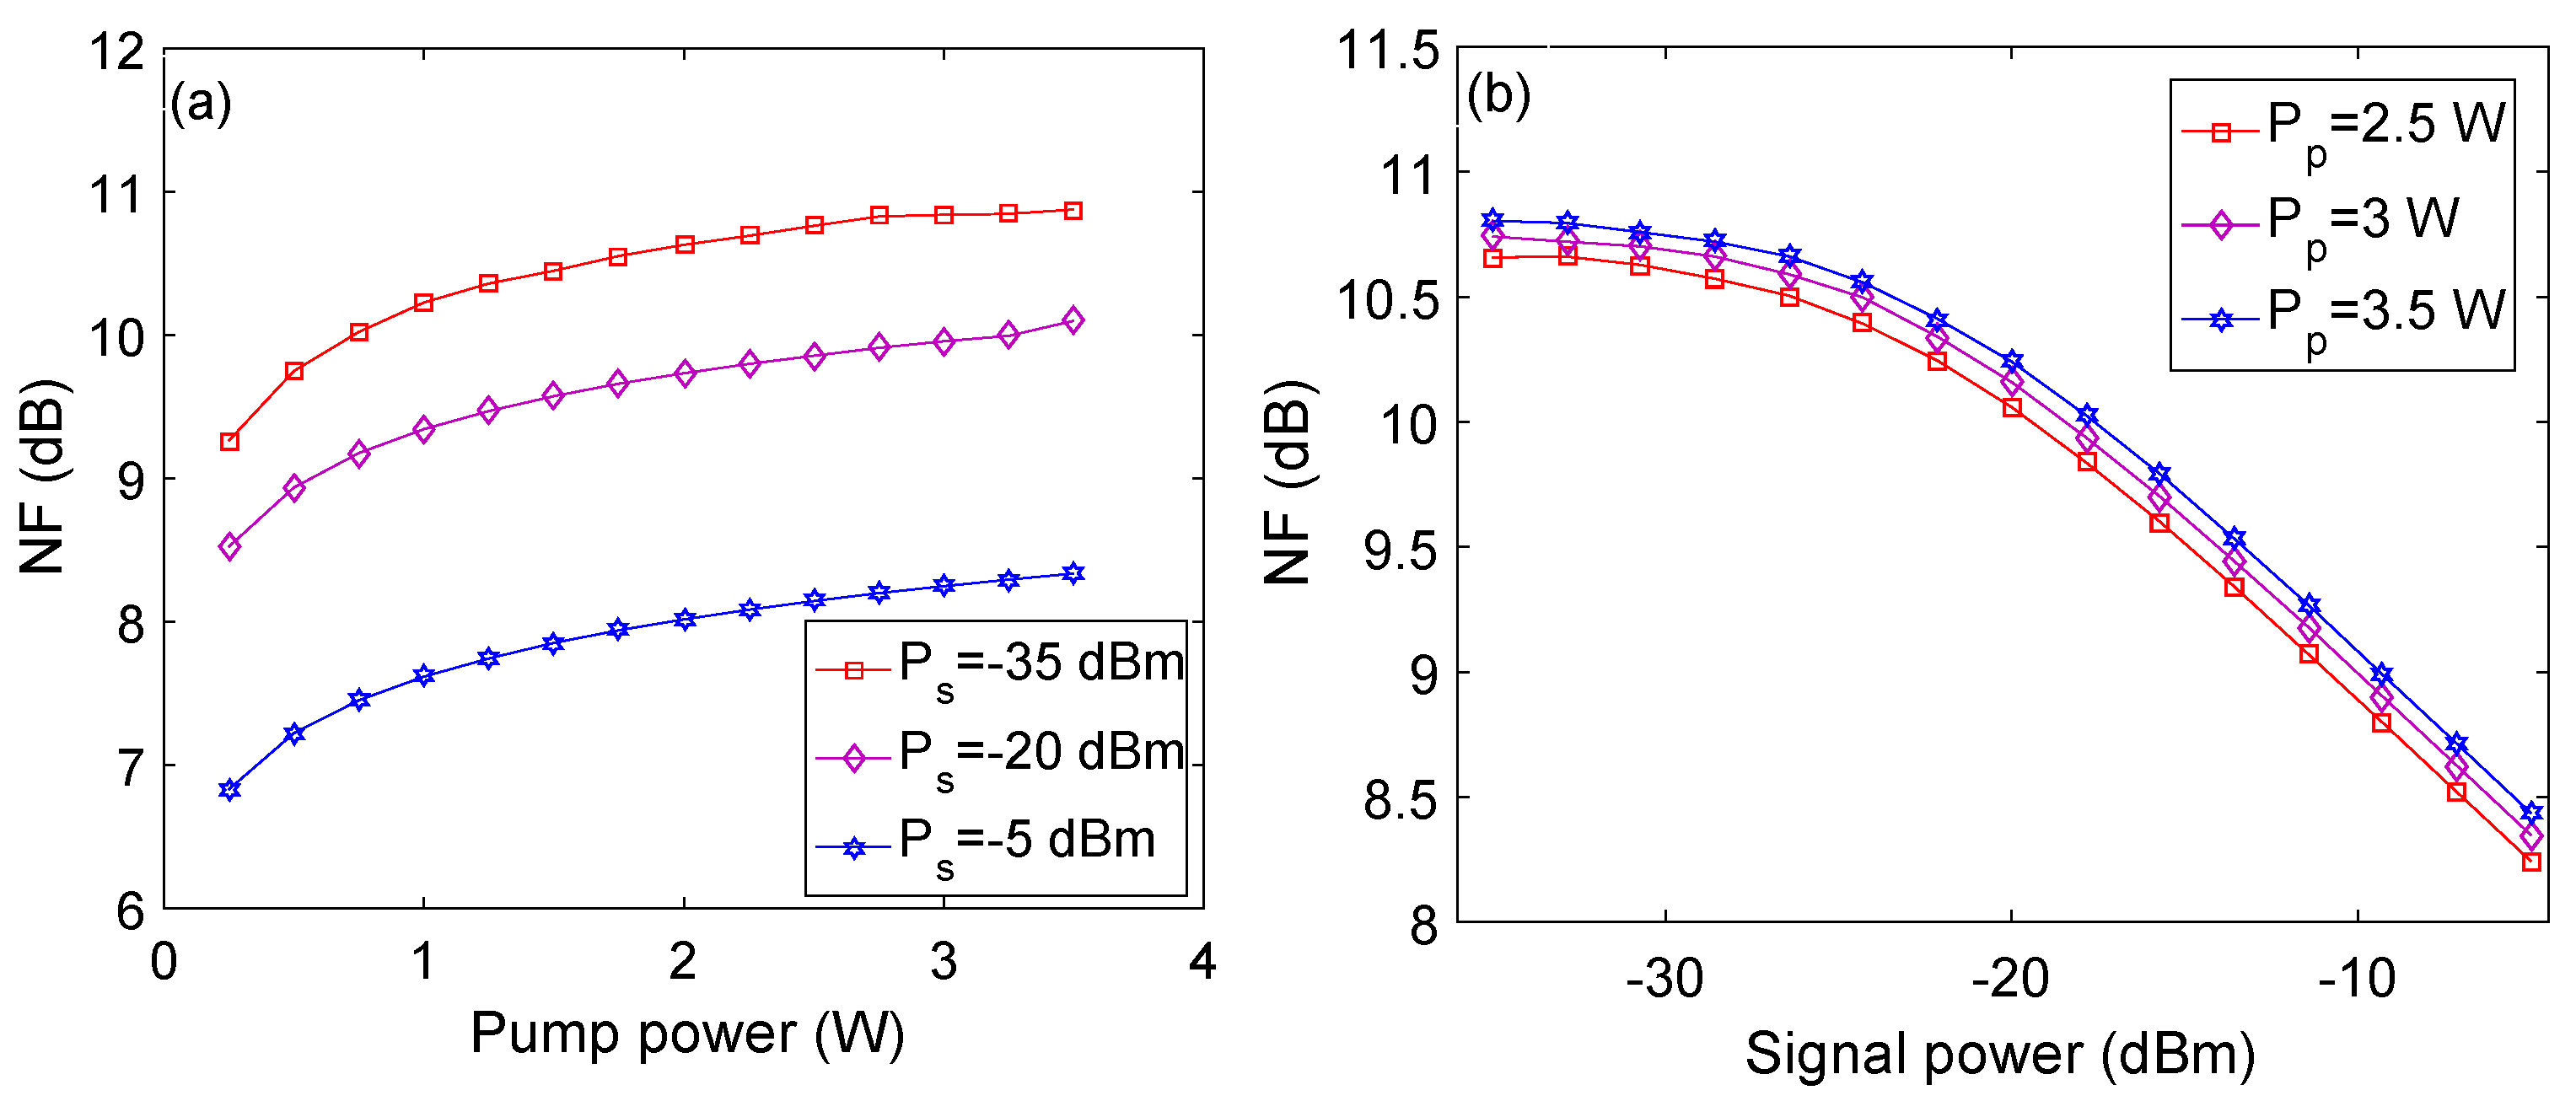
We have shown NF versus pump power and signal power plots as a function of signal power and pump power, respectively in
Figure 7 at optimized length of HDF and doping concentration of Ho
3+ for signal wavelength of 2.0321 μm. It may be observed from
Figure 7a that the values of NF increase on increasing the pump power at each value of signal power. The increase in pump power increases the stimulated as well as spontaneous emission of photons. Consequently, the ASE noise increases which degrades the OSNR of the amplified signal and finally NF of the amplifier increases. It is also evident that the NF is higher when the power of the signal is lower because ASE grows faster when the input signal power is low. Minimum NF of around 8.2 dB is observed at 3.5 W of pump power for signal power of −5 dBm. Similarly,
Figure 7b shows that NF decreases on increasing the power of signal at each value of pump power. Minimum NF of 8.3 dB is observed at −5 dBm of signal power for pump power equals to 2.5 W.
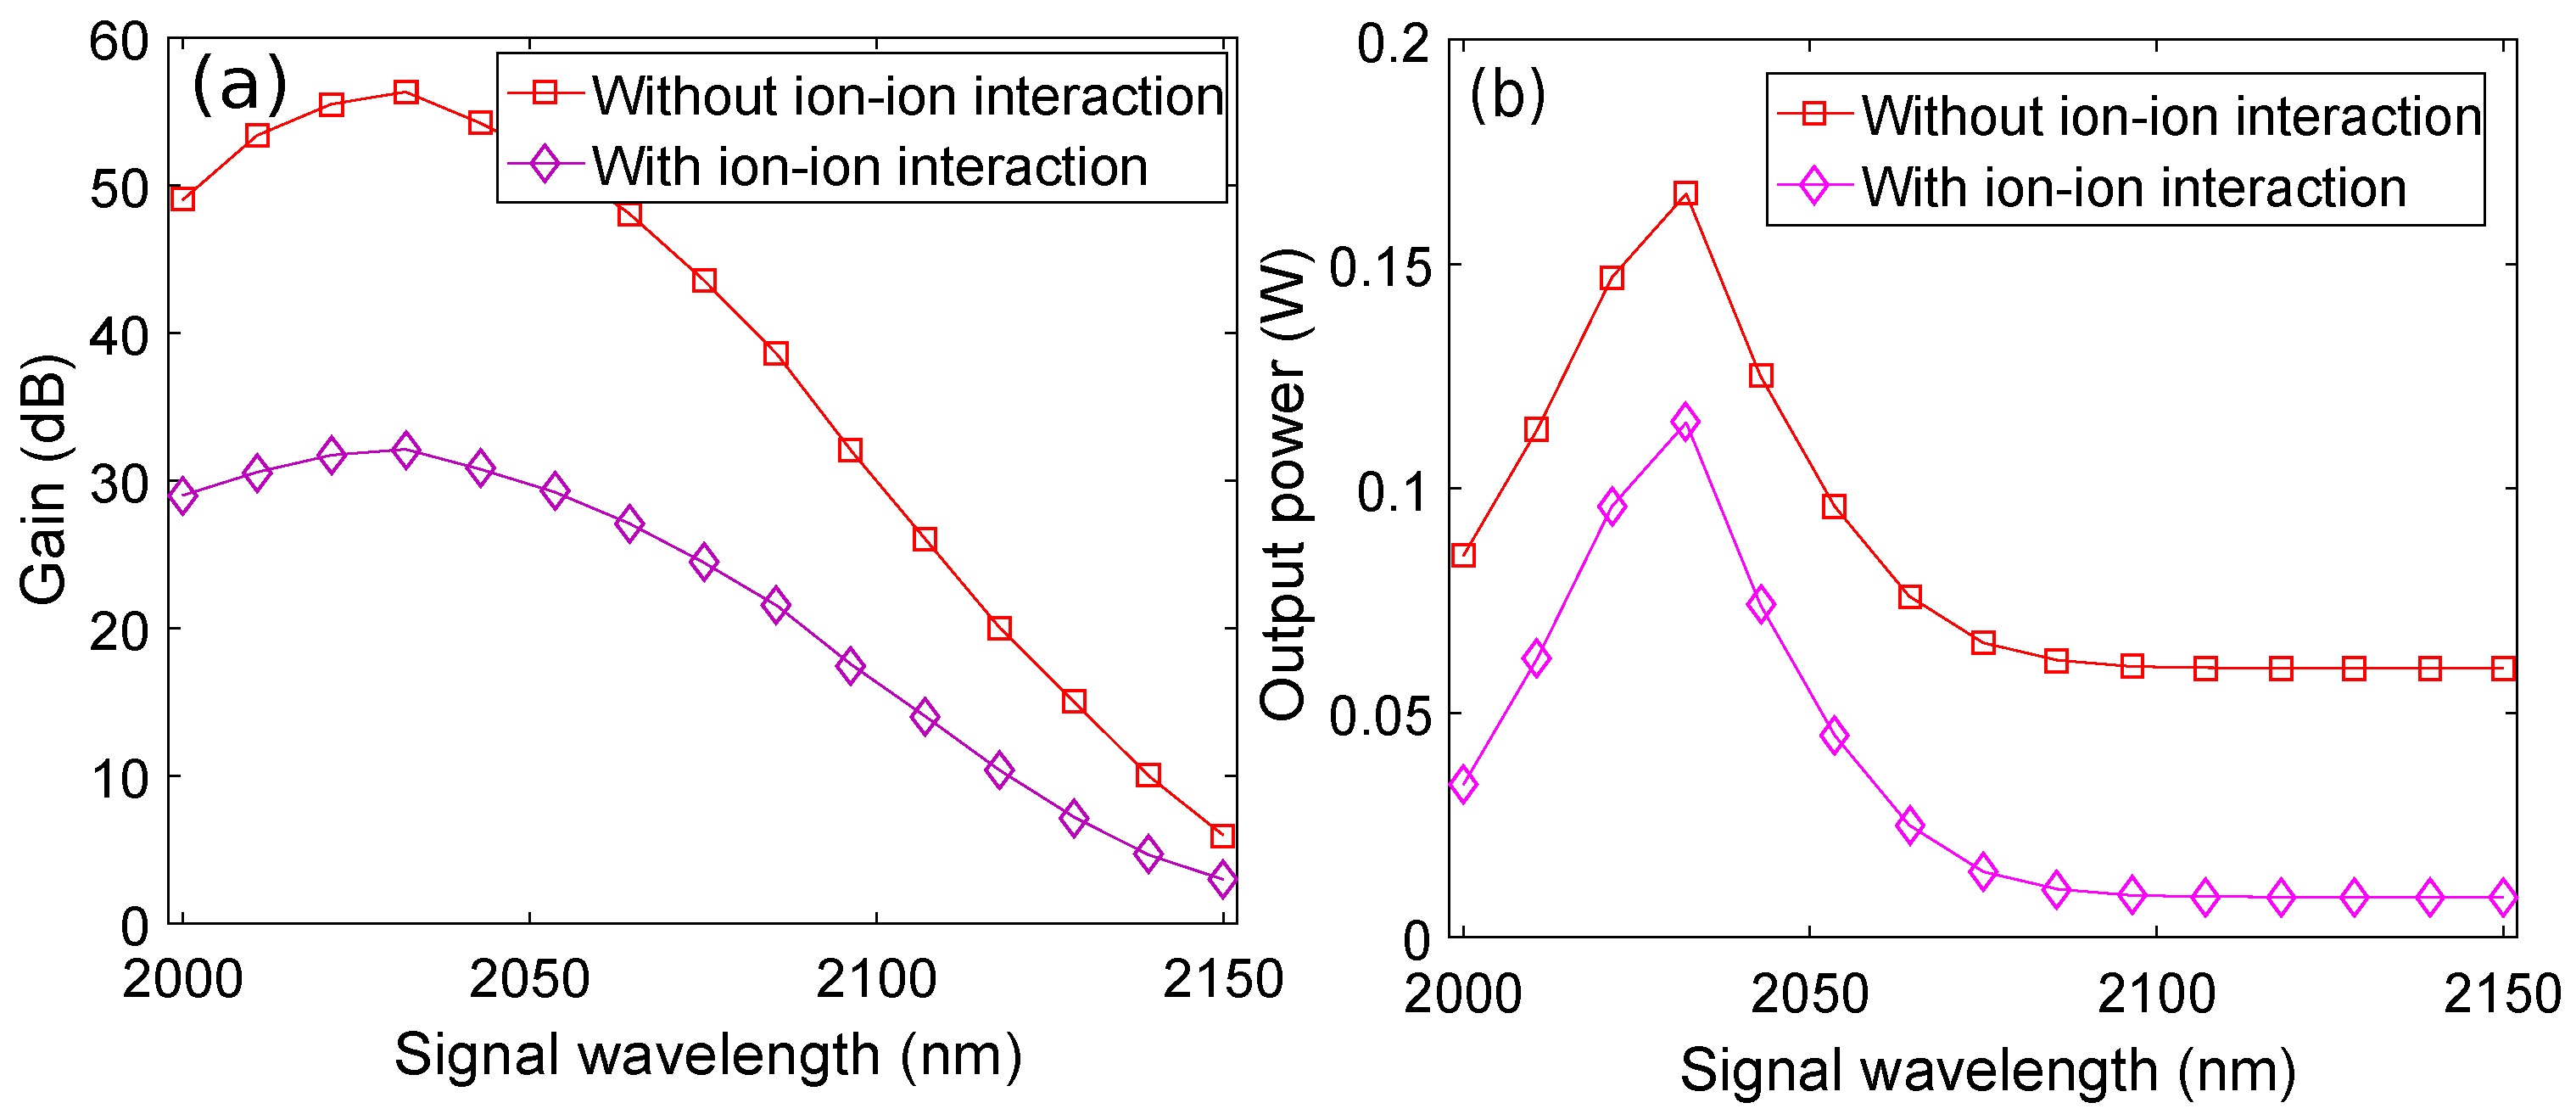
In our simulation study, we consider the combined effects of homogeneous up-conversion, cross relaxation and pair induced quenching as ion-ion interaction. The ion-ion interaction relates to the issue of energy transfer between rare-earth dopant ions. When the local concentration of the ions become high enough, it is no longer valid to assume that each ion is isolated and acts independently of its neighbors. This can have a negative impact on amplifier performance when the upper state of an amplifying transition is being depleted by energy transfer. Homogeneous up-conversion, cross relaxation and pair induced quenching can be individually characterized by their coefficients and number of ions per cluster in the commercial OptiSystem software. To demonstrate the impact of ion-ion interaction on the performance of HDFA, we have plotted input signal wavelength versus gain and output power of the HDFA without and with ion-ion interaction at optimized pump power, HDF length and doping concentration of Ho
3+ for pump and signal powers of 3.5 W and −35 dBm, respectively.
Table 3 shows the values of various coefficients used in the analysis of ion-ion interaction.
Figure 8 shows the variations in gain and output power of the amplifier with respect to input signal wavelength, without and with the ion-ion interaction. It may be observed from
Figure 8 that peak gain and output power of the amplifier at input signal wavelength of 2.0321 μm have been decreased by a factor of 24.2 dB and 0.051 W, respectively by considering the ion-ion interaction. The analysis confirms that ion-ion interaction has a negative effect on the performance of HDFA by reducing the gain and output power. This is due to the reduction in population inversion, resulting from promotion of one Ho
3+ to an excited manifold while the demotion of the other to a low energy manifold in case of homogeneous up-conversion and vice versa in the case of cross relaxation.
Finally, we compare the important results of this study with the results from past studies which are simulation as well as experimental based in order to elaborate the perfection of our results. For a fair comparison, we consider only those past studies in which only single pump source was used to excite the gain medium which is a short piece of fiber doped with Ho
3+.
Table 4 exhibits a comprehensive comparison of major results obtained for our proposed design and of the previous studies. It may be observed that our proposed amplifier design with optimized parameters has better performance as compared to the results of the past studies as mentioned in [
5,
12,
13,
14,
16]. There are few past studies in the literature [
22,
26,
27] in which the authors have demonstrated higher peak gains and output powers as compared to the same in the proposed work. The design of the HDFA proposed in [
26,
27] is based on multi-stage pumping and the design of [
22] exploits shared pump double-stage pumping while our optimized design is based on a single forward pump source and a single short piece of HDF. Although, the schemes of multi-stage pumping and shared pump double-stage pumping enhance the small-signal gain and output power, but increase the cost and complexity. Therefore, to the best of our knowledge we believe that our results are more promising along with extra benefits of cost-efficiency and simplicity.

 ,
, 

