Article

In Vivo and In Silico Study of Photodynamic Necrosis Volume in Rat Liver

by
Marlon Rodrigues Garcia
1,†,
Víctor Sánchez
1,†,
Thereza Cury Fortunato
1,
Michelle Barreto Requena
1,
Clóvis Grecco
1,
José Dirceu Vollet-Filho
1,
Layla Pires
2,
Lilian Tan Moriyama
1 and
Sebastião Pratavieira
1,*
1
São Carlos Institute of Physics, University of São Paulo, P.O. Box 369, São Carlos 13560-970, SP, Brazil
2
Princess Margaret Cancer Center, University Health Network, Toronto, ON M5G 2C1, Canada
*
Author to whom correspondence should be addressed.
These authors contributed equally to this work.
Photonics 2022, 9(12), 993; https://doi.org/10.3390/photonics9120993
Submission received: 10 November 2022 / Revised: 8 December 2022 / Accepted: 13 December 2022 / Published: 16 December 2022

Abstract

:
Photodynamic therapy is a treatment modality that can be used to treat various types of lesions. To produce cell death, reaching a certain threshold dose of reactive oxygen species (ROS) is required. The estimation of ROS production is of paramount importance to predict the depth of necrosis and to ensure that the volume to be treated receives doses higher than the threshold. In this study, we compared a theoretical model for PDT based on Monte Carlo simulations of light irradiance and rate equations with a rat liver model. At the end of the simulation, necrosis depths and volumes were estimated, as well as the photosensitizer (PS), oxygen, and ROS concentrations at each position of the treated area. From the in vivo study, we obtained the ROS concentration threshold of about 1 mM for Photogem in rat liver. This proposed method can be used for any PS or tissue, including tissues with multiple layers. The proposed method can be used to estimate parameters for any PS or tissue, including layered tissues, as long as their parameters are known. In addition, other protocols can be tested, or compared with the standard ones, providing the bases for analyzing a diverse range of photodynamic treatment scenarios.

1. Introduction

Photodynamic therapy (PDT) is a procedure capable of treating several diseases and inactivating microorganisms [1,2,3]. PDT is based on the combination of light, a photosensitizer (PS), and molecular oxygen (3O2). The reactions that result from their interaction produce reactive oxygen species (ROS,) such as superoxide anion ( O 2 ), hydrogen peroxide (H2O2), hydroxyl free radicals (•OH), and notably singlet oxygen (1O2), in sufficient quantities to promote cell death by necrosis or apoptosis, induced either by direct oxidative damage of cell structures or imbalance between concentrations of ROS and antioxidants within cells [4]. This process is only possible if the photosensitizer molecules absorb energy from light and produce ROS via either charge (type I mechanism) or energy (type II mechanism) transfer processes [5].
The photosensitizer molecules that do not absorb enough light and thus do not participate in the therapeutic action of PDT are eliminated by the organism along with the photoproducts, without adverse effects. A good PS also has preferential pharmacokinetics, that is, a different affinity for healthy and tumor tissues. Generally, PS molecules preferably remain accumulated in the tumor tissue for longer times, and this fact along with the targeted irradiation makes PDT a selective process [6].
Although PDT parameters, such as PS concentration, fluence (J/cm2), fluence rate (W/cm2), and the interval between PS and irradiation (the drug-light interval, DLI) [7], can be controlled at the beginning of a treatment session, quantifying the photodynamic dose delivered to the tissue requires a considerable additional effort. Both light and photosensitizer distribution in the tissue have a heavy dependence on patients’ lesions’ optical and physiological parameters [8,9]. The literature describes that to produce cell death a certain threshold dose must be reached. Patterson et al. [10] stated that to produce cell death with PDT, the number of photons absorbed by the PS molecule per unit volume should exceed a minimum value [10], defining this number as the threshold dose. This definition was later expanded to consider the amount of singlet oxygen (as the main ROS for most PS, type II mechanism) produced by this threshold dose to cause cell death [7,11,12]. Thus, this concept can naturally be further expanded for other ROS produced during PDT, which is the basis of the present study’s approach [13,14,15]. To calculate the equivalent for a ROS concentration ( [ R O S ] ) threshold (i.e., the minimum amount of ROS per area necessary to induce cell death), the related PDT parameters have to be either calculated or obtained for the tissue locally, such as light fluence rate, PS spectral absorption coefficient, and PS and 3O2 concentrations. Whenever these quantities have a spectral or spatial dependence, this dependence also has to be considered in the calculations.
Knowing how light propagates through the target tissue is another issue to be considered in the photodynamic effect. However, it is not an easy task to accomplish, since light propagation is dependent on tissue optical properties, and they can vary from site to site and from patient to patient. For example, for human normal skin tissue, three main layers can be considered: epidermis, dermis, and subcutaneous layer, each one with its own optical properties [16,17]. Similarly, regarding skin lesions, such as non-melanoma skin cancer, actinic keratosis, and Bowen’s disease, among others frequently treated with PDT, each lesion type has its own specific optical properties, which can vary considerably from those of normal skin. In this scenario, Monte Carlo simulations have become an alternative and interesting way to determine light propagation in different biological media by solving the Radiative Transport Equation (RTE) in two or three dimensions [18,19,20].
In order to estimate the photodynamic effect under more controlled conditions, it is interesting to use a more homogeneous media. The healthy rat liver has been broadly used for this purpose [14,20,21]. In rat liver, the necrosis profile produced by PDT is homogeneous, and its borders can be easily identified. The results of an in vivo experiment such as rat liver PDT can be used as a connection between the mathematical models that can predict photodynamic dose and the actually observed necrosis profile in vivo [22]. In this kind of experiment, it is interesting to define the PDT explicit dosimetry, which is to measure or calculate magnitudes directly related to the photodynamic light dose. This is normally translated into the estimation of the [ 1 O 2 ] generated or, more generally, the total [ R O S ] generated in the tissue. Nevertheless, explicit dosimetry can also be considered as the measurement of cell death profile in animal models such as rat liver. Both mathematical and animal models have used explicit dosimetry to bring together light fluence rate, [ P S ] , and [ 3 O 2 ] in the resulting estimation of photodynamic dose [7,12,23,24]. This improved understanding may not only contribute to a better determination of photophysical parameters and necrosis profile, but also contribute to clinical applications of PDT for liver cancer, such as in palliative hepatocellular carcinoma treatment and other related diseases [25].
In the present study, we compared a mathematical model to predict the [ R O S ] generated during PDT with the extension of the necrotic profile of an in vivo experiment in healthy rat livers. The rate equations use the light fluence rate as an input, which for this study was estimated using MCX (Monte Carlo eXtreme), a Monte Carlo simulations method accelerated by Graphics Processing Units (GPUs), considering the optical properties of rat liver.

2. Methods and Materials

2.1. Animal Model

A total of three male Wistar rats (about 200 to 250 g of body weight) were used in this study. The rats were kept under controlled conditions of temperature and humidity, with ad libitum food and water access, and in a 12/12 h light/dark cycle. The experimental procedures were approved by the local ethics committee (Internal Review Board for Animal Studies of the Department of Experimental Surgery of the Ribeirão Preto Medical School, University of São Paulo). For the photodynamic therapy procedure, the animals were anesthetized with an intramuscular injection of a combination of 100 mg/kg of ketamine and 6 mg/kg of xylazine. A laparotomy surgery was performed to expose the liver and the vena cava, where 1.5 mg/kg of Photogem (Photogem, Russia) was injected [26,27]. After a DLI of 30 min [28], the liver was gently exposed to perform the irradiation.
The liver surface irradiation was performed using a laser diode emitting at 630 nm (Eagle Heron, Quantum Tech, Brazil) coupled to an optical fiber. The treatment spot was a 0.2 cm 2 circle defined by using a mask placed on the liver surface. The light was delivered at an in-air fluence rate (irradiance) of 74 mW/cm 2 for 34 min, totaling an in-air fluence (i.e., light dose) of 150 J/cm 2 . After irradiation, the animals were sutured and received 2.2 mg/kg of analgesic intramuscularly (Banamine®, Coopers Brazil Ltda, Cotia, SP, Brazil). Thirty hours after the end of the PDT procedure, the animals were euthanized, and livers were removed, sliced, and sent for histological procedure. The histological liver slices were stained with hematoxylin and eosin (H&E) and then scanned and digitized (Pannoramic DESCK, 3DHISTECH, Budapest, Hungary) for further analysis.

2.2. In Silico Model

2.2.1. Monte Carlo Simulation

Light propagation into biological medium was studied using Monte Carlo eXtreme (MCX), an open-access Monte Carlo simulation software available at http://mcx.space/ accessed on 14 December 2022) [18]. This software is one of the fastest Monte Carlo simulators because it uses the massive number of parallel threads of Nvidia® GPUs [18]. The software used to call the MCX functions and to plot and save the results was Matlab® (MathWorks, Natick, MA, USA), using a personal computer with an Intel(R) Core i7-7700HQ at 2.8 GHz processor, 16 GB of RAM and a graphics card NVIDIA GeForce GTX 1050 Ti of 4 GB.
The simulated medium consisted of a 10 × 10 × 3 cm 3 cube with Cartesian coordinates (x, y, z), respectively, and a resolution of 0.25 mm involving 400 × 400 × 120 voxels. The light source was a disk with a 2.5 mm radius positioned at (5, 5, 0) cm. The number of photons used was 10 8 , and the simulations were performed 5 times for noise reduction. Table 1 summarizes the optical properties of rat liver at the wavelength used in the study (630 nm). In this table, μ a , μ s , g, and n are the absorption coefficient, scattering coefficient, anisotropy factor, and refractive index, respectively. Given the small contribution of the PS to the tissue optical parameters, it was disregarded in the estimation of light distribution inside the liver ( μ a , l i v e r > > μ a , p h o t o s e n s i t i z e r , therefore μ a , t o t a l μ a , l i v e r ). The values in Table 1 were obtained from direct assessment of graphs presented in Parsa et al. [29]. It must be mentioned that those parameters may vary according to the obtaining method and used technology as much as on the assumptions made [30,31]. They may also change during PDT irradiation, which was not taken into consideration for the present study.

2.2.2. Reactive Oxygen Species Estimation

As a predictive model for the generation of reactive oxygen species (ROS), we used a well-known system of coupled differential equations [12,23,32,33,34]. This system takes into consideration the different photochemical reactions present in both type I and II mechanisms of PDT, initiated by the light fluence rate, F e x ( r , λ ) . Equations (1)–(3) describe this model. A detailed description of the parameters and initial conditions used can be found in Table 2 and Table 3, respectively.
d [ S 0 ] d t = σ a ( λ ) h c / λ F e x ( r , λ ) ϕ t γ β + γ + [ 3 O 2 ] [ S 0 ] μ ξ F e x ( r , λ ) [ 3 O 2 ] β + γ + [ 3 O 2 ] ( [ S 0 ] + δ ) [ S 0 ]
d [ 3 O 2 ] d t = ξ F e x ( r , λ ) [ 3 O 2 ] β + γ + [ 3 O 2 ] [ S 0 ] + g o x y 1 [ 3 O 2 ] [ 3 O 2 ] 0
d [ R O S ] d t = σ a ( λ ) h c / λ F e x ( r , λ ) ϕ t γ β + γ + [ 3 O 2 ] [ S 0 ] + ξ F e x ( r , λ ) [ 3 O 2 ] β + γ + [ 3 O 2 ] [ S 0 ]
The simulations were performed using the Photofrin parameters found in the literature, assuming that this PS has similar photochemical parameters to Photogem, both being a mixture of oligomers of hematoporphyrin derivatives (HpD). From now on, we will use the acronym HpD in the text for both. The Equations (1)–(3) follow the description presented by Sánchez et al. [15]. The light fluence rate, F e x ( r , λ ) , was considered a function of both spatial position and wavelength. Finally, this system of differential equations was solved in space and time, where the concentrations of PS, oxygen, and ROS were evaluated.
After performing Monte Carlo simulations for light propagation into the rat liver, the first step was to estimate the light fluence rate, F e x ( r , λ ) , to be given as an input to the coupled differential equations. This was performed by multiplying the Monte Carlo result (photons flux) by the energy of a single photon at the chosen wavelength, with a numerical adjustment to consider the real irradiance of the light source. In a second step, the numerical estimation for the system of coupled differential Equations (1)–(3) were solved with the function NDSolve available in the commercial software Wolfram Mathematica (Wolfram Research, Champaign, IL, USA), using the parameter values and initial conditions of Table 2 and Table 3. At the end of this process, the necrosis volume was estimated considering an adjustment between the experimental data (necrosis profile in rat liver) and the mathematical model to obtain a specific threshold of [ R O S ] . The schematic diagram in Figure 1 exemplifies the sequence for solving the model. It can be observed that Equations (1)–(3) were solved for each voxel. As a result, the spatial and temporal changes of [ S 0 ] , [ 3 O 2 ] , and [ R O S ] concentrations can be estimated for each voxel.

3. Results and Discussion

3.1. In Vivo

Figure 2 shows an example of PDT effects on rat liver using a laser light source with an irradiance of 74 mW/cm 2 and delivering a light dose of 150 J/cm 2 when 1.5 mg/kg of HpD was systemically administered. After the liver removal, as described in Section 2.1 (30 h after irradiation), the signs of necrosis were clearly observed. Necrosis can be macroscopically distinguished from healthy tissue by its whitish color. The necrosis measured approximately 0.6 cm in diameter. This and other necrosis features were similar for all three animals. The larger diameter compared with the incident light beam spot (0.5 cm in diameter of the opaque mask vs. the necrosis shown in Figure 2b) can be explained by the lateral diffusion of incident photons as it propagates in the tissue. A liver slice centered in the illuminated region was collected and used to estimate the depth of necrosis. In Figure 2b, we observed that frontal illumination of liver surface resulting in a necrotic volume with radial symmetry in depth.

3.2. Light Propagation

The simulation of light distribution into the rat liver carried out using MCX is presented in Figure 3a. It shows the spatial photon migration at 630 nm. It can be seen that there is an axial symmetry along the z axis, at the position (5, 5, z) cm, with a high variation in the photons flux along the depth and along the x axis. It can also be observed that most photons remain in regions shallower than 1.5 mm, as expected for visible wavelengths [37]. Figure 3b presents the depth profile of the light fluence rate in the cube center region, considering three different values of irradiance: 75, 100, and 150 mW/cm 2 . The results demonstrated that F e x ( z , λ ) decreases as a function of depth and that its surface value dictates the light intensity distributed inside the tissue. Thus, the higher the irradiance at the liver surface, the larger the number of photons available in deeper regions to perform the PDT [38,39].

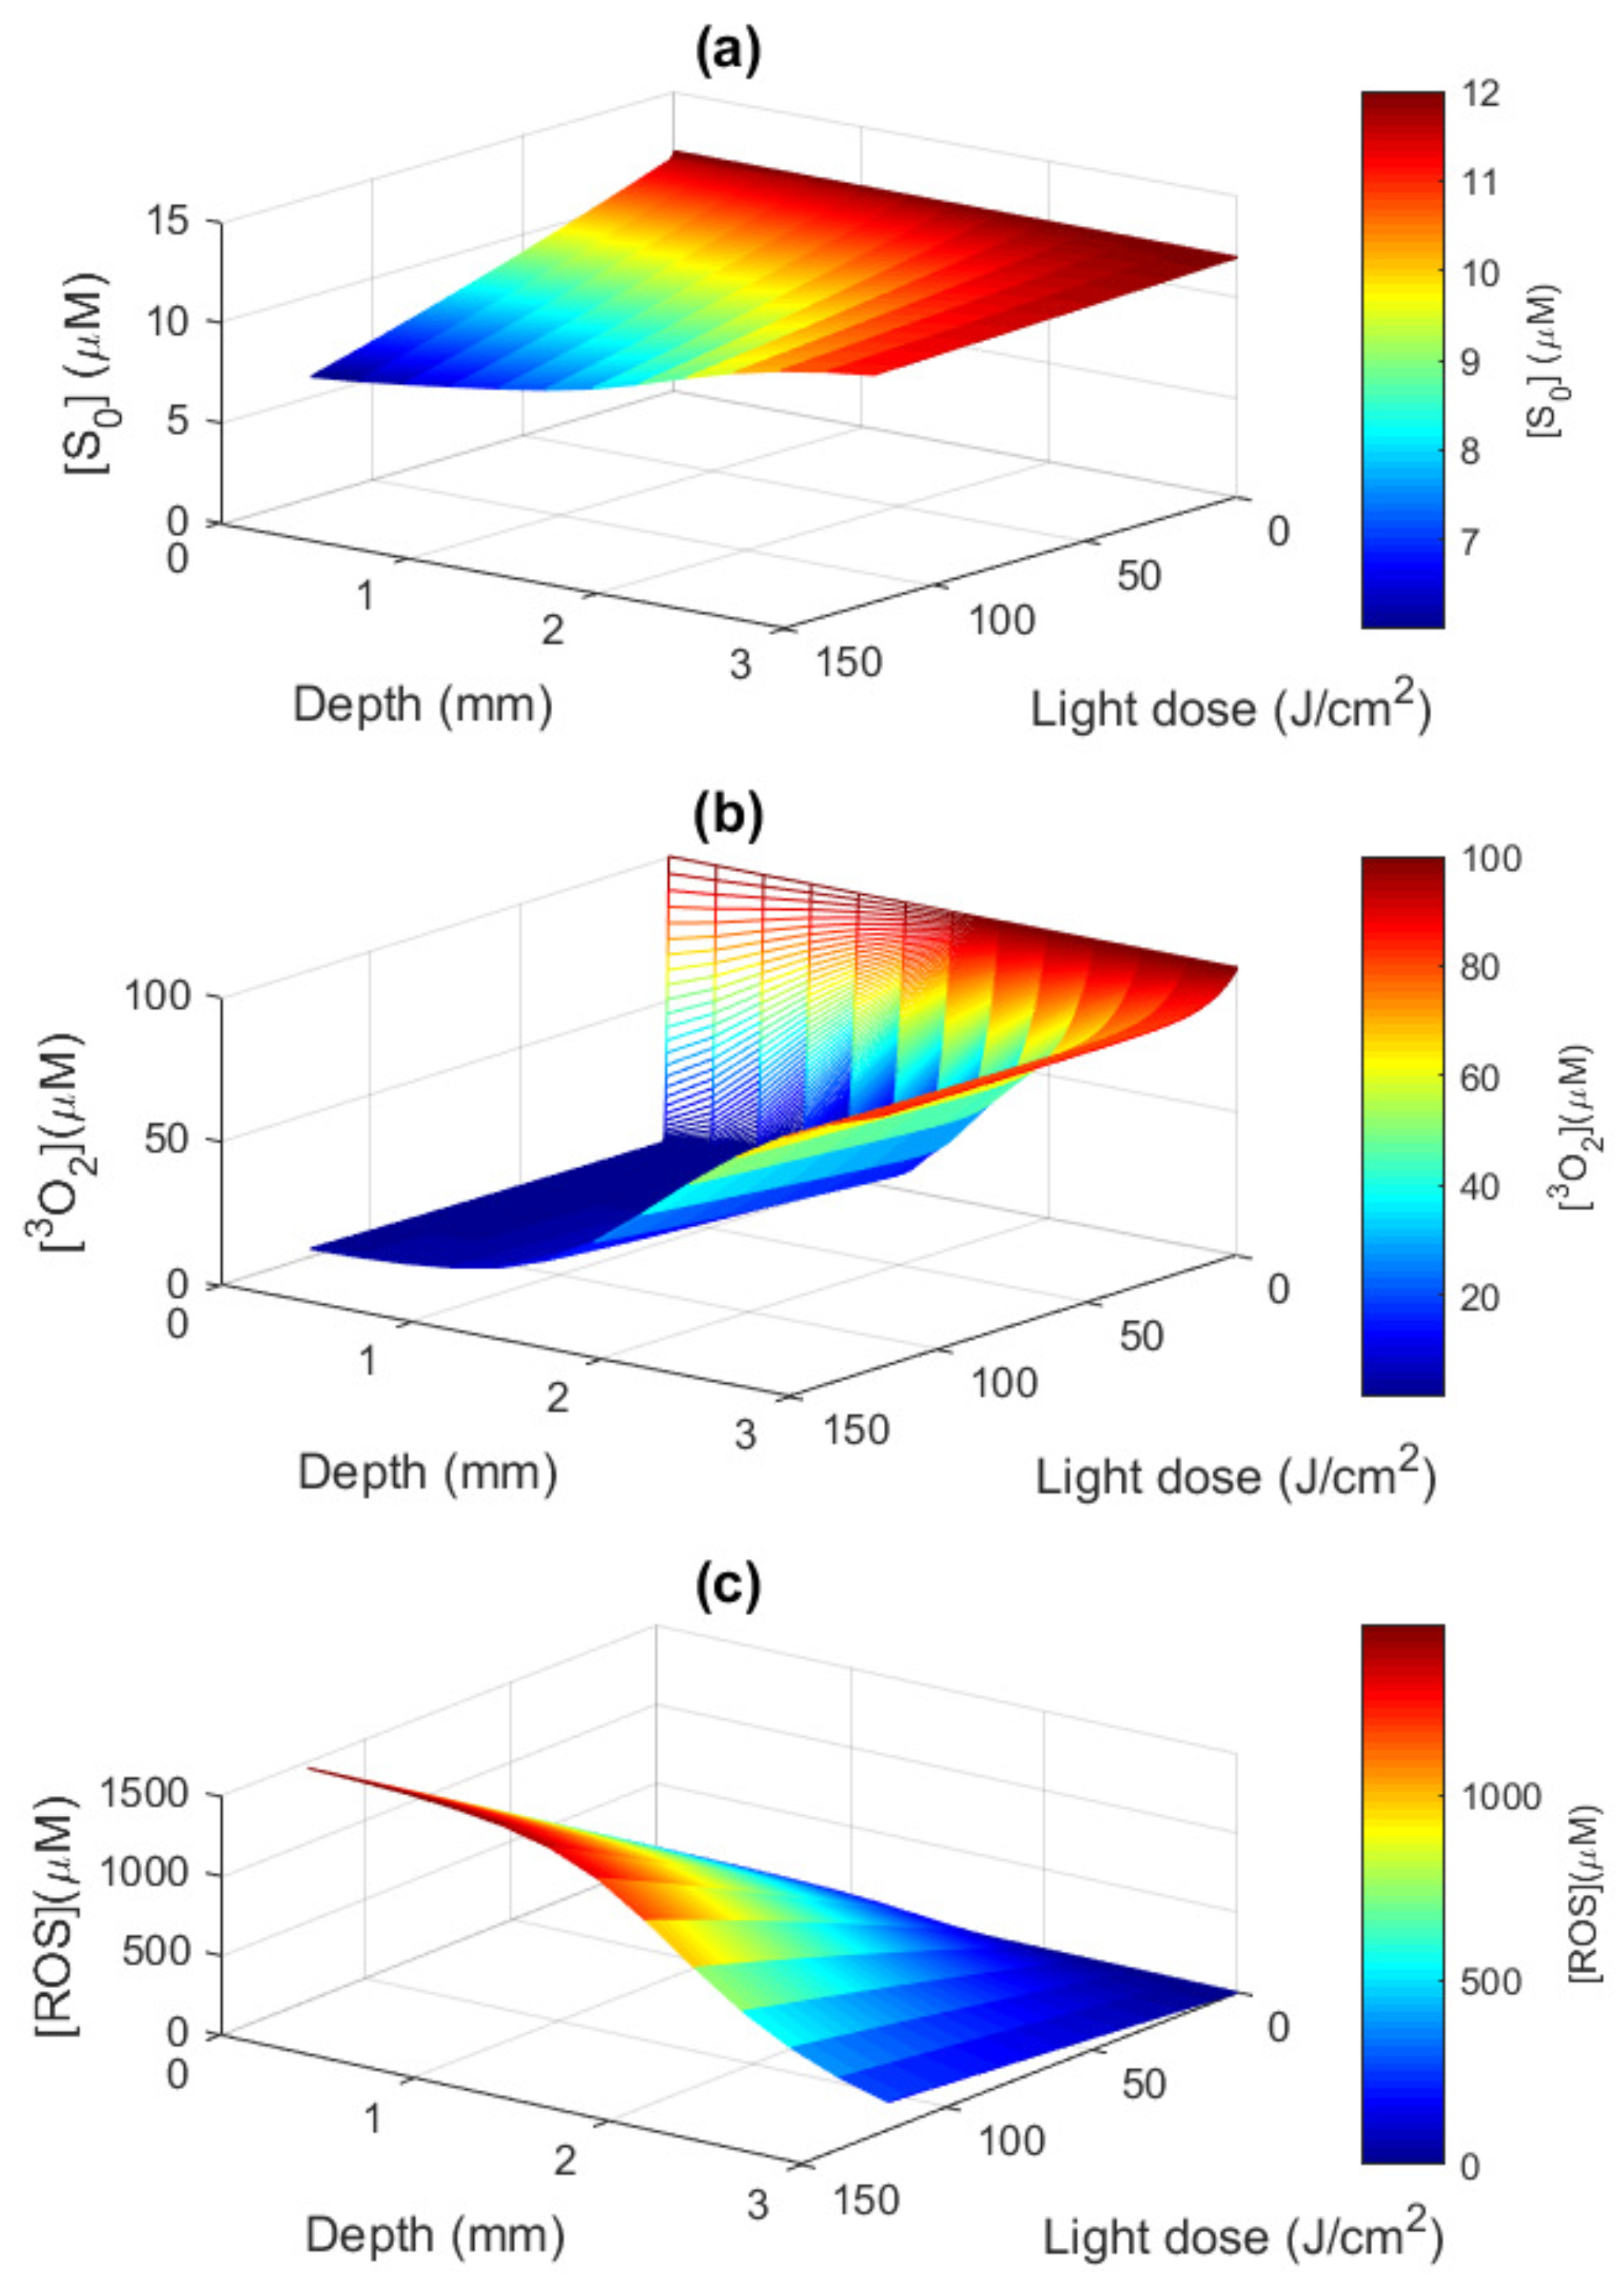
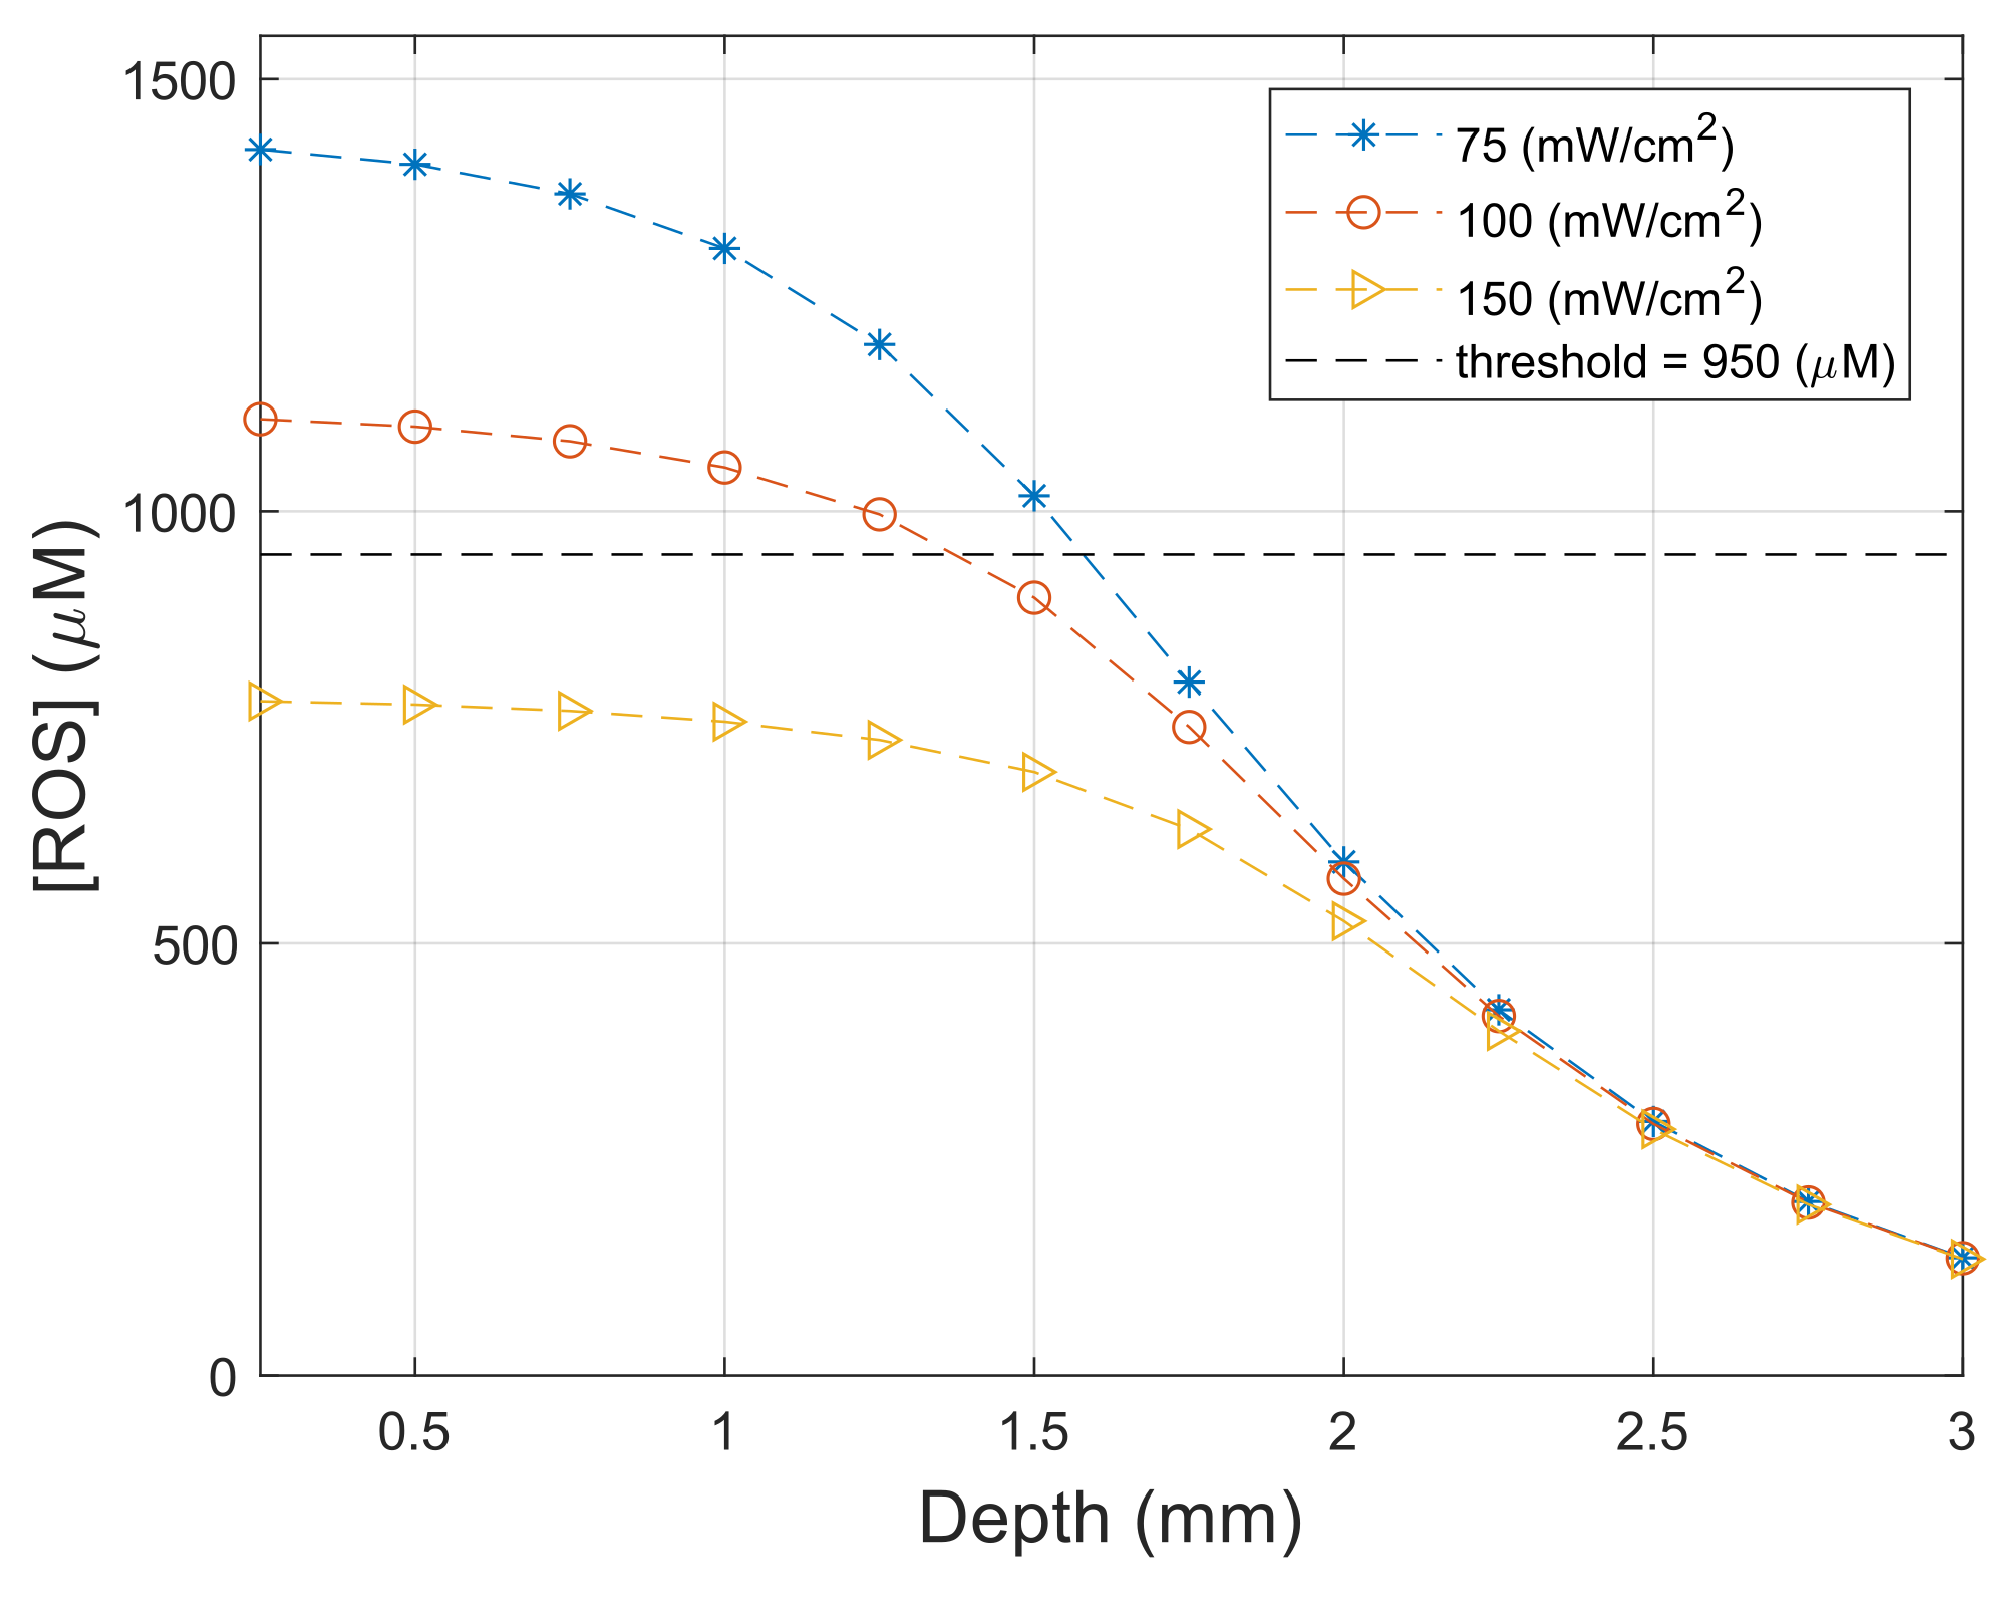
3.3. Macroscopic ROS Model

In order to verify the dynamic model, the differential rate Equations (1)–(3) were evaluated for each voxel. The Monte Carlo estimation of F e x ( z , λ ) was taken as an input in the equations, using the parameters and initial concentrations stated in Table 2 and Table 3. The simulated cube was of 400 × 400 × 120 voxels, which in the millimeter scale is equivalent to 100 × 100 × 30 mm. The light dose was evaluated by multiplying the treatment time by the light irradiance (75 mW/cm 2 ). Figure 4 presents the behavior of [ S 0 ] , [ 3 O 2 ] , and [ R O S ] as functions of depth and delivered light dose. It was observed that the concentrations of PS and 3O2 decrease with light dose and increase with depth, whereas the opposite happens for ROS concentration. This is the classical behavior for these concentrations, as previously reported in the literature [12,24,40].

3.4. Necrosis Profile

The experimental necrotic profile can be seen in the histology slide image presented in Figure 5a. This profile is our reference to know the portion of the tissue which reached a minimum amount of [ R O S ] to obtain cell death, since this is the tissue that actually died by necrosis. Thus, any [ R O S ] value observed within this region was sufficient to produce cell death. Therefore, knowing the experimental necrotic volume allowed us to simply estimate the [ R O S ] threshold based on the simulation model, which eventually was found to be 950 μM. This concentration threshold was used to generate the live–dead image shown in Figure 5b, obtained using the theoretical prediction for each voxel of the 400 × 400 × 120 phantom cube.
By extrapolating the theoretical prediction for cases different from our in vivo experiment, it was possible to evaluate the [ R O S ] profile in depth for different irradiance values ( F e x ( z , λ ) ), as shown in Figure 6. This profile was calculated in the phantom cube center for the line (5, 5, z) cm, and it is shown in Figure 6 along with a horizontal dashed line representing the threshold dose of 950 μ M. The same light dose of 150 J/cm 2 was used for all light fluence rates, yielding times of 2000, 1500, and 1000 s for the fluence rates of 75, 100, and 150 mW/cm 2 , respectively. At smaller depths, we can see from Figure 6 that the [ R O S ] production is inversely proportional to the light irradiance, with an interesting overlap of all curves for depths greater than 2.25 mm.
In the case of the ROS concentration profile seen in Figure 6, the superposition of all curves after 2.25 mm can indicate that, considering the present threshold dose, the limit of light penetration within the tissue was reached for this wavelength. Figure 4 also corroborates this finding, where it can be seen that the other two photodynamic ingredients are both present (PS and oxygen). Since the oxygen supply rate is also considered in the simulation, it is also possible to see the difference in the ROS production for different irradiances under the same conditions (light dose, wavelength, and optical properties) (Figure 6).The oxygen supply rate used in this simulation is fixed and does not necessarily correspond to the real one. With that, the results of (Figure 6) can also be altered for a higher oxygen supply. This difference is likely related to the high oxygen consumption during PDT, which increases with irradiance without providing enough time for oxygen to recover. For this extrapolation of our mathematical model, for rat liver tissue, if lower values of irradiance are used, the ROS production in the first 2 mm of tissue can be significantly improved.
Many studies have already sought to develop mathematical methods to better predict PDT outcomes and estimate the resulting necrotic region. First, some in vitro studies using different approaches obtained the singlet oxygen threshold for some PS and cell lineage. Using Colo 26 multicell spheroids photosensitized by meta-tetra-(hydroxyphenyl)chlorin (mTHPC), Coutier et al. [41] determined a threshold dose of reacting singlet oxygen of 7.9 ± 2.2 mM [41]. Using the same PS, nevertheless, using MAT-LyLu (MLL) rat prostate adenocarcinoma cells irradiated with 652 nm, Dysart et al. [11] obtained a total amount of 7.63 × 10 8 to 10.93 × 10 8 molecules of 1 O 2 per cell required to reduce cell survival by 1/e [11].
The study published by Wang et al. [12] used a fibrosarcoma tumor model treated with Photofrin, with radially distributed light delivery due to interstitial illumination, and light propagation based on the light diffusion equation. Considering only singlet oxygen production, they obtained threshold values ranging from 0.5 to 1 mM [12]. A similar study from Qiu et al. [42] with Photofrin but for radioactively induced fibrosarcoma and superficial irradiation obtained a singlet oxygen threshold dose of 0.74 ± 0.25 mM [42]. The study published by Zhu et al. [7] was also based only on singlet oxygen generated by benzoporphyrin derivative monoacid ring A (BPD), for which the irradiation was performed using a 1 cm long cylindrical diffusing fiber. The authors observed in this study a difference due to the drug-light interval (DLI), with threshold doses of 0.12 mM for a 15 min DLI and 0.72 mM for a 3 h DLI [7].
In a study similar to ours, Rocha et al. [14] also performed frontal illumination but used bacteriochlorin as the photosensitizer and obtained a dose threshold of 11 mM of ROS based on a mathematical–analytical one-dimensional model for light propagation [14]. Alternatively, the study of Ong et al. [13] measured PS and oxygen blood flow during PDT in a model of radiation-induced fibrosarcoma (RIF) using the commercial photosensitizer Tookad and irradiation on the surface of the tumor at 763 nm [13]. This study obtained a ROS concentration threshold of approximately 20 mM and was the first one to include ROS modeling in addition to singlet oxygen. The Penjweini et al. [43] and Kareliotis et al. [44] studies used the Monte Carlo method to obtain the spatial distribution of light in the tissue. The study from Penjweini et al. [43] followed the variations of PS concentration and oxygen blood flow during PDT, also with superficial/frontal illumination, in radiation-induced fibrosarcoma of mice tumors treated with 2-(1-Hexyloxyethyl)-2-devinyl pyropheophorbide. Their conclusion was that PDT depends on all parameters involved, such as tissue oxygenation, photosensitizer uptake of the tumors, total energy, and light fluence rate [43,44].
The method here presented was capable of estimating the depth of necrosis and the ROS spatial profile generated inside the liver tissue submitted to PDT (Figure 5 and Figure 6). It was also possible to simulate and analyze the dynamic evolution of PS, 3 O 2 , and ROS concentrations over time (Figure 4), which can lead to important conclusions on the analyses and creation of protocols. Other studies have shown a correlation between PS photobleaching assessed by superficial fluorescence and depth of necrosis [27,45]. This sort of experimental input might provide further elements to the [ R O S ] threshold model estimate, potentially improving PDT clinical protocols in the future.
Our method is also capable of simulating other types of tissues with Monte Carlo, for example, tissues with multiple layers, given that the optical properties are known for each layer. In addition, other PS molecules can also be studied if their photochemistry properties are known, as shown in Table 2 for HpD. The mathematical model used was an extension of a method described by Sánchez et al. [15], which can consider light sources with multiple wavelengths activating the photosensitizer simultaneously (such as the sun, in daylight PDT), and is based on the so-called PDT rate equations [15]. Since other protocols can be simulated, it is possible to use this model to guide the development of new protocols, analyze existing ones, or propose effective protocols for other types of lesions by seeking to exceed the minimum threshold dose in the whole lesion.

4. Conclusions

Using rat liver as an animal model and a mathematical model based on the PDT rate equations and Monte Carlo simulations allowed the comparison of theoretical and experimental results, showing that it is possible to predict PDT outcome. The [ R O S ] threshold obtained for Photogem, in this case, is close to the values for other PS, showing that this approach is also validated as a direct method to obtain this threshold value. This knowledge will help future studies in determining the PDT outcome. The same approach could be used in other tissues and PS, on the condition that the tissue optical properties, the PS photophysical parameters, as well as the threshold dose, must be known. The results here obtained are totally dependent on the available data from the literature. This fact reinforces the importance of basic studies to determine the photophysical characteristics of photosensitizers to support these mathematical models that may lead to PDT dosimetry and application optimization.

Author Contributions

Conceptualization, V.S., L.T.M. and S.P.; methodology, M.R.G., V.S., T.C.F., M.B.R., C.G., L.T.M. and S.P.; software, V.S., T.C.F. and L.T.M.; formal analysis and data curation, M.R.G., V.S., T.C.F., M.B.R., C.G., L.P., L.T.M. and S.P.; writing—original draft preparation, M.R.G. and V.S.; writing—review and editing, L.T.M., J.D.V.-F. and S.P.; supervision, S.P. All authors have read and agreed to the published version of the manuscript.

Funding

This research was funded by Brazilian Funding Agencies: Coordenação de Aperfeiçoamento de Pessoal de Nível Superior—Brasil (CAPES)—Finance Code 001; National Council for Scientific and Technological Development—CNPq (465360/2014-9 and 306919/2019-2) and São Paulo Research Foundation (FAPESP) grants: 2013/07276-1 (CEPOF); 2014/50857-8 (INCT); 2022/10860-6 (MBR scholarship).

Institutional Review Board Statement

The study was conducted according to the guidelines of the Declaration of Helsinki, and approved by the Institutional Review Board of Internal Review Board for animal studies of the Department of Experimental Surgery of the School of Medicine of Ribeirão Preto, University of São Paulo (protocol code No. 151/2007).

Informed Consent Statement

Not applicable.

Data Availability Statement

Not applicable.

Conflicts of Interest

The authors declare no conflict of interest.

References

  1. Krutmann, J.; Honigsmann, H.; Craig, A. Dermatological Phototherapy and Photodiagnostic Methods; Springer: Berlin/Heidelberg, Germany, 2001; p. 412. [Google Scholar] [CrossRef]
  2. Pratavieira, S.; Requena, M.B.; Stringasci, M.D.; Ayala, E.T.P.; Bagnato, V.S. The Physics of Light and Sound in the Fight Against Skin Cancer. Braz. J. Phys. 2022, 52, 106. [Google Scholar] [CrossRef]
  3. Alves, F.; Ayala, E.T.P.; Pratavieira, S. Sonophotodynamic Inactivation: The power of light and ultrasound in the battle against microorganisms. J. Photochem. Photobiol. 2021, 7, 100039. [Google Scholar] [CrossRef]
  4. Dąbrowski, J.M. Chapter Nine—Reactive Oxygen Species in Photodynamic Therapy: Mechanisms of Their Generation and Potentiation. In Inorganic Reaction Mechanisms; van Eldik, R., Hubbard, C.D., Eds.; Academic Press: Cambridge, MA, USA, 2017; Volume 70, pp. 343–394. [Google Scholar] [CrossRef]
  5. Wilson, B.; Patterson, M. The physics, biophysics and technology of photodynamic therapy. Phys. Med. Biol. 2008, 53, 61–109. [Google Scholar] [CrossRef] [PubMed]
  6. Allison, R.R.; Downie, G.H.; Cuenca, R.; Hu, X.H.; Childs, C.J.; Sibata, C.H. Photosensitizers in clinical PDT. Photodiagn. Photodyn. Ther. 2004, 1, 27–42. [Google Scholar] [CrossRef]
  7. Zhu, T.; Kim, M.; Liang, X.; Finlay, J.; Busch, T. In-vivo singlet oxygen threshold doses for PDT. Photonics Lasers Med. 2015, 4, 59–71. [Google Scholar] [CrossRef] [PubMed]
  8. Wilson, B.C.; Patterson, M.S.; Lilge, L. Implicit and explicit dosimetry in photodynamic therapy: A new paradigm. Lasers Med. Sci. 1997, 12, 182–199. [Google Scholar] [CrossRef] [PubMed]
  9. Pogue, B.; Elliott, J.; Kanick, S.; Davis, S.; Samkoe, K.; Maytin, E.; Pereira, S.; Hasan, T. Revisiting photodynamic therapy dosimetry: Reductionist & surrogate approaches to facilitate clinical success. Phys. Med. Biol. 2016, 61, 57–89. [Google Scholar] [CrossRef] [Green Version]
  10. Patterson, M.; Wilson, C.; Ronald, G. In vivo test of the concept of photodynamic threshold dose in normal rat liver photosensitized by aluminum chlorosulphonated phthalocyanine. Photochem. Photobiol. 1990, 51, 343–349. [Google Scholar] [CrossRef]
  11. Dysart, J.S.; Singh, G.; Patterson, M.S. Calculation of Singlet Oxygen Dose from Photosensitizer Fluorescence and Photobleaching During mTHPC Photodynamic Therapy of MLL Cells. Photochem. Photobiol. 2005, 81, 196–205. [Google Scholar] [CrossRef]
  12. Wang, K.; Finlay, J.; Busch, T.; Hahn, S.; Zhu, T. Explicit dosimetry for photodynamic therapy: Macroscopic singlet oxygen modeling. J. Biophotonics 2010, 3, 304–318. [Google Scholar] [CrossRef] [Green Version]
  13. Ong, Y.H.; Kim, M.M.; Huang, Z.; Zhu, T.C. Reactive oxygen species explicit dosimetry (ROSED) of a type 1 photosensitizer. In Optical Methods for Tumor Treatment and Detection: Mechanisms and Techniques in Photodynamic Therapy XXVII; International Society for Optics and Photonics—SPIE: Bellingham, WA, USA, 2018; Volume 10476, pp. 57–66. [Google Scholar]
  14. Rocha, L.B.; Soares, H.T.; Mendes, M.I.P.; Cabrita, A.; Schaberle, F.A.; Arnaut, L.G. Necrosis depth and photodynamic threshold dose with redaporfin-PDT. Photochem. Photobiol. 2020, 96, 692–698. [Google Scholar] [CrossRef] [PubMed]
  15. Sánchez, V.; Garcia, M.R.; Requena, M.B.; Romano, R.A.; de Boni, L.; Guimarães, F.E.; Pratavieira, S. Theoretical and Experimental Analysis of Protoporphyrin IX Photodegradation Using Multi-Wavelength Light Sources. Photochem. Photobiol. 2020, 96, 1208–1214. [Google Scholar] [CrossRef] [PubMed]
  16. Salomatina, E.V.; Jiang, B.; Novak, J.; Yaroslavsky, A.N. Optical properties of normal and cancerous human skin in the visible and near-infrared spectral range. J. Biomed. Opt. 2006, 11, 064026. [Google Scholar] [CrossRef] [Green Version]
  17. Jacques, S.L. Optical properties of biological tissues: A review. Phys. Med. Biol. 2013, 58, 37–61. [Google Scholar] [CrossRef]
  18. Fang, Q.; Boas, D. Monte Carlo simulation of photon migration in 3D turbid media accelerated by graphics processing units. Opt. Express 2009, 17, 20178–20190. [Google Scholar] [CrossRef] [PubMed] [Green Version]
  19. LaRochelle, E.P.; Marra, K.; LeBlanc, R.E.; Chapman, M.S.; Maytin, E.V.; Pogue, B.W. Modeling PpIX effective light fluence at depths into the skin for PDT dose comparison. Photodiagn. Photodyn. Ther. 2019, 25, 425–435. [Google Scholar] [CrossRef]
  20. Kareliotis, G.; Papachristou, M.; Priftakis, D.; Datseris, I.; Makropoulou, M. Computational study of necrotic areas in rat liver tissue treated with photodynamic therapy. J. Photochem. Photobiol. Biol. 2019, 192, 40–48. [Google Scholar] [CrossRef]
  21. Ferreira, J.; Moriyama, L.; Kurachi, C.; Sibata, C.; Castro e Silva, O., Jr.; Zucoloto, S.; Bagnato, V. Experimental determination of threshold dose in photodynamic therapy in normal rat liver. Laser Phys. Lett. 2007, 4, 469. [Google Scholar] [CrossRef]
  22. Farrell, T.J.; Wilson, B.C.; Patterson, M.S.; Chow, R. Dependence of photodynamic threshold dose on treatment parameters in normal rat liver in vivo. In Optical Methods for Tumor Treatment and Early Diagnosis: Mechanisms and Techniques; International Society for Optics and Photonics—SPIE: Bellingham, WA, USA, 1991; Volume 1426, pp. 146–155. [Google Scholar]
  23. Liu, B.; Farrell, T.; Patterson, M. A dynamic model for ALA-PDT of skin: Simulation of temporal and spatial distributions of ground-state oxygen, photosensitizer and singlet oxygen. Phys. Med. Biol. 2010, 55, 5913–5932. [Google Scholar] [CrossRef]
  24. Sánchez, V.; Romero, M.P.; Pratavieira, S.; Costa, C. Physiological considerations acting on triplet oxygen for explicit dosimetry in photodynamic therapy. Photodiagn. Photodyn. Ther. 2017, 19, 298–303. [Google Scholar] [CrossRef]
  25. Zou, H.; Wang, F.; Zhou, J.J.; Liu, X.; He, Q.; Wang, C.; Zheng, Y.W.; Wen, Y.; Xiong, L. Application of photodynamic therapy for liver malignancies. J. Gastrointest. Oncol. 2020, 11, 431. [Google Scholar] [CrossRef] [PubMed]
  26. Stranadko, E.P.; Skobelkin, O.K.; Mironov, A.E. Photodynamic therapy of cancer by photogem. In Photodynamic Therapy of Cancer; Jori, G., Moan, J., Star, W.M., Eds.; International Society for Optics and Photonics—SPIE: Bellingham, WA, USA, 1994; Volume 2078, pp. 499–501. [Google Scholar] [CrossRef]
  27. Vollet-Filho, J.D.; Menezes, P.F.C.; Moriyama, L.T.; Grecco, C.; Sibata, C.; Allison, R.R.; Castro e Silva, O.; Bagnato, V.S. Possibility for a full optical determination of photodynamic therapy outcome. J. Appl. Phys. 2009, 105, 102038. [Google Scholar] [CrossRef] [Green Version]
  28. Melo, C.; Kurachi, C.; Grecco, C.; Sibata, C.; Castro-e Silva, O.; Bagnato, V. Pharmacokinetics of Photogem using fluorescence monitoring in Wistar rats. J. Photochem. Photobiol. Biol. 2004, 73, 183–188. [Google Scholar] [CrossRef] [PubMed]
  29. Parsa, P.; Jacques, S.L.; Nishioka, N.S. Optical properties of rat liver between 350 and 2200 nm. Appl. Opt. 1989, 28, 2325–2330. [Google Scholar] [CrossRef]
  30. Carneiro, I.; Carvalho, S.; Henrique, R.; Oliveira, L.; Tuchin, V.V. Measurement of Optical Properties of Normal and Pathological Human Liver Tissue from Deep-UV to NIR In Tissue Optics and Photonics; Tuchin, V.V., Blondel, W.C.P.M., Zalevsky, Z., Eds.; International Society for Optics and Photonics—SPIE: Bellingham, WA, USA, 2020; Volume 11363, p. 113630G. [Google Scholar] [CrossRef]
  31. Akter, S.; Maejima, S.; Kawauchi, S.; Sato, S.; Hinoki, A.; Aosasa, S.; Yamamoto, J.; Nishidate, I. Evaluation of light scattering and absorption properties of in vivo rat liver using a single-reflectance fiber probe during preischemia, ischemia–reperfusion, and postmortem. J. Biomed. Opt. 2015, 20, 076010. [Google Scholar] [CrossRef] [Green Version]
  32. Finlay, J.C.; Mitra, S.; Patterson, M.S.; Foster, T.H. Photobleaching kinetics of Photofrin in vivo and in multicell tumour spheroids indicate two simultaneous bleaching mechanisms. Phys. Med. Biol. 2004, 49, 4837. [Google Scholar] [CrossRef]
  33. Zhu, T.C.; Finlay, J.C.; Zhou, X.; Li, J. Macroscopic modeling of the singlet oxygen production during PDT. In Optical Methods for Tumor Treatment and Detection: Mechanisms and Techniques in Photodynamic Therapy XVI; International Society for Optics and Photonics—SPIE: Bellingham, WA, USA, 2007; Volume 6427, p. 642708. [Google Scholar]
  34. Pratavieira, S.; Santos, P.; Menezes, P.; Kurachi, C.; Sibata, C.; Jarvi, M.; Wilson, B.; Bagnato, V. Phototransformation of hematoporphyrin in aqueous solution: Anomalous behavior at low oxygen concentration. Laser Phys. 2009, 19, 1263–1271. [Google Scholar] [CrossRef]
  35. Georgakoudi, I.; Nichols, M.G.; Foster, T.H. The mechanism of Photofrin photobleaching and its consequences for photodynamic dosimetry. Photochem. Photobiol. 1997, 65, 135–144. [Google Scholar] [CrossRef]
  36. Nichols, M.G.; Foster, T. Oxygen diffusion and reaction kinetics in the photodynamic therapy of multicell tumour spheroids. Phys. Med. Biol. 1994, 39, 2161. [Google Scholar] [CrossRef]
  37. Martelli, F.; Del Bianco, S.; Ismaelli, A.; Zaccanti, G. Light Propagation through Biological Tissue and Other Diusive Media; International Society for Optics and Photonics—SPIE: Bellingham, WA, USA, 2010; p. 298. [Google Scholar]
  38. Brancaleon, L.; Moseley, H. Laser and non-laser light sources for Photodynamic Therapy. Lasers Med. Sci. 2002, 13, 173–186. [Google Scholar] [CrossRef]
  39. Mang, T.S. Lasers and light sources for PDT: Past, present and future. Photodiagn. Photodyn. Ther. 2008, 1, 43–48. [Google Scholar] [CrossRef] [PubMed]
  40. Salas-García, I.; Fanjul-Vélez, F.; Arce-Diego, J.L. Superficial radially resolved fluorescence and 3D photochemical time-dependent model for photodynamic therapy. Opt. Lett. 2014, 39, 1845–1848. [Google Scholar] [CrossRef] [PubMed] [Green Version]
  41. Coutier, S.; Mitra, S.; Bezdetnaya, L.N.; Parache, R.M.; Georgakoudi, I.; Foster, T.H.; Guillemin, F. Effects of Fluence Rate on Cell Survival and Photobleaching in Meta-Tetra-(hydroxyphenyl) chlorin–photosensitized Colo 26 Multicell Tumor Spheroids. Photochem. Photobiol. 2001, 73, 297–303. [Google Scholar] [CrossRef]
  42. Qiu, H.; Kim, M.M.; Penjweini, R.; Zhu, T.C. Dosimetry study of PHOTOFRIN-mediated photodynamic therapy in a mouse tumor model. In Optical Methods for Tumor Treatment and Detection: Mechanisms and Techniques in Photodynamic Therapy XXV; International Society for Optics and Photonics—SPIE: Bellingham, WA, USA, 2016; Volume 9694, pp. 123–129. [Google Scholar]
  43. Penjweini, R.; Kim, M.M.; Liu, B.; Zhu, T.C. Evaluation of the 2-(1-Hexyloxyethyl)-2-devinyl pyropheophorbide (HPPH) mediated photodynamic therapy by macroscopic singlet oxygen modeling. J. Biophotonics 2016, 9, 1344–1354. [Google Scholar] [CrossRef] [PubMed] [Green Version]
  44. Kareliotis, G.; Chronopoulou, E.; Makropoulou, M. In Silico, Combined Plasmonic Photothermal and Photodynamic Therapy in Mice. J. Nanotheranostics 2022, 3, 39–54. [Google Scholar] [CrossRef]
  45. Garcia, M.R.; Requena, M.B.; Pratavieira, S.; Moriyama, L.T.; Becker, M.; Bagnato, V.S.; Kurachi, C.; Magalhães, D.V. Development of a system to treat and online monitor photodynamic therapy of skin cancer using PpIX near-infrared fluorescence. Photodiagn. Photodyn. Ther. 2020, 30, 101680. [Google Scholar] [CrossRef]
Figure 1. Schematic pathway for estimating the necrosis volume by first estimating the light fluence rate with the Monte Carlo simulation and second solving the couple differential equations of PDT. The initial concentrations of PS and oxygen were considered homogeneous inside the simulated cube.
Photonics 09 00993 g001
Figure 2. PDT of rat liver with 630 nm laser irradiation, where (a) shows the rat liver just after necropsy, (b) shows a transversal slice used to measure the depth of necrosis, and (c) is a typical histological image showing the transitions between necrotic and healthy tissue.
Photonics 09 00993 g002
Figure 3. (a) Photons flux in logarithmic scale, resulting from Monte Carlo simulation at 630 nm, and (b) the light fluence rate as a function of depth (z axis) for three different irradiances.
Photonics 09 00993 g003
Figure 4. Dynamic variations of: (a) [ S 0 ] ; (b) [ 3 O 2 ] ; and (c) [ R O S ] as functions of depth and delivered light dose for a fluence rate of 75 mW/cm 2 and a total light dose of 150 J/cm 2 .
Photonics 09 00993 g004
Figure 5. (a) Histological H&E stained slide image for rat liver and (b) the necrotic profile obtained from the mathematical model, considering a light fluence rate of 75 mW/cm 2 , a light dose of 150 J/cm 2 , and a threshold dose of 950 μ M for [ R O S ] .
Photonics 09 00993 g005
Figure 6. ROS concentration as a function of depth, calculated for different values of F e x ( z , λ ) , considering a total light dose of 150 J/cm 2 . The initial conditions and parameters of Table 2 and Table 3 were used.
Photonics 09 00993 g006
Table 1. Numerical values for the optical parameters of rat liver at 630 nm.
WavelengthParameterValue [29]
630 nm μ a 0.71 mm 1
μ s 14.60 mm 1
g0.95
n1.37
Table 2. Symbols, parameters, and definitions of Photofrin at 630 nm used in this study.
SymbolDefinitionUnits
[ S 0 ] PS concentration in ground state μ M
[ 3 O 2 ] Oxygen concentration in ground state μ M
[ 3 O 2 ] 0 Oxygen concentration in ground state at time zero μ M
[ R O S ] Concentration of ROS μ M
δ Low PS concentration correction term μ M
g o x y Maximum oxygen supply rate
σ a ( λ ) PS absorption cross section as a function of λ cm 2
h c / λ PS activation energy as a function of λ J
F e x ( r , λ ) Light fluence ratemW/cm 2
Parameter (Units)DefinitionValueReference
ϕ t ( a . u . ) k i s c k f + k i s c 0.831[23]
μ ( μ M 1 ) k o s k o a [ A ] 7.6 × 10 5 [35]
ξ ( c m 2 m W 1 s 1 ) S Δ ϕ t k o a [ A ] k d + k o a [ A ] σ a ( λ ) h c / λ 3.7 × 10 3 [35,36]
β ( μ M ) k p k o t 11.9[35]
γ ( μ M ) k t a [ A ] k o t 5.26 × 10 10 [15]
Table 3. Initial concentration of [ S 0 ] , [ 3 O 2 ] , [ R O S ] , and fixed parameters.
SymbolValue (Units)Reference
Initial conditions [ S 0 ] 0 12 ( μ M)In this study
[ 3 O 2 ] 0 100 ( μ M)[20]
[ R O S ] 0 0 ( μ M)Typical
Parameters δ 33 ( μ M)[11]
g o x y 0.7 ( μ M/s)[12]
Publisher’s Note: MDPI stays neutral with regard to jurisdictional claims in published maps and institutional affiliations.

