Article

Modeling Effect of Bubbles on Time-Dependent Radiation Transfer of Microalgae in a Photobioreactor for Carbon Dioxide Fixation

1
School of Energy and Power Engineering, Shandong University, Jinan 250061, China
2
Optics & Thermal Radiation Research Center, Institute of Frontier and Interdisciplinary, Shandong University, Qingdao 266237, China
3
College of Energy and Power Engineering, Northeast Electric Power University, Jilin City 132012, China
4
School of Energy Science and Engineering, Harbin Institute of Technology, Harbin 150001, China
*
Authors to whom correspondence should be addressed.
Photonics 2022, 9(11), 864; https://doi.org/10.3390/photonics9110864
Submission received: 13 October 2022 / Revised: 7 November 2022 / Accepted: 13 November 2022 / Published: 16 November 2022

Abstract

:
Microalgae are considered one of the most efficient and environmentally friendly ways for carbon dioxide fixation. The bubbles play an important role in analyzing the radiation transfer in photobioreactors during microalgae growth. Herein, Chlorella sp. and Scenedesmus obliquus were cultured in the airlift flat plate photobioreactor and evaluated for the temporal evolution of radiation characteristics. A one-dimensional model of bubbles on time-dependent radiation transfer in a photobioreactor was proposed, and it was well verified with the experimental result. The results indicated that with the increase of bubble volume fraction or the decrease of bubble radius, the local irradiance increased at the illuminated surface of the microalgal culture and was attenuated more rapidly along with the radiation transfer. The average specific growth rate of microalgae decreases as bubble volume fraction increases or bubble radius decreases. The volume fraction of 0.003 and a radius of 3.5 mm are the optimal operating conditions in this study for microalgae growth and carbon dioxide fixation. The presented analysis would facilitate the design and optimization of the optical and aeration configurations of photobioreactors for carbon dioxide fixation.

1. Introduction

Biological photosynthesis is considered one of the most viable ways for carbon dioxide capture and storage [1]. Compared with terrestrial plants, microalgae exhibit the advantages of high photosynthetic efficiency, strong environmental adaptability and no major competition for agricultural land [2,3]. Biomass components, such as carbohydrates, proteins and fatty acids [4], and its valuable metabolites, such as pigments and antibiotics, offer a wide range of applications and arouse extensive attention [5]. Nowadays, large-scale cultivation of microalgae is mainly carried out in open ponds that require large spaces. However, closed-system photobioreactors (PBRs) allow the maintenance of optimal conditions for growth, making them more efficient than open systems [6]. The utilization of light energy by microalgae is a crucial factor for biomass productivity and cultivation efficiency [7,8]. The radiation characteristics of microalgae vary during the growing period, which will affect the light utilization efficiency. Sparging with bubbles not only enables effective mixing within the PBR but also improves gas-liquid mass transfer [9,10,11]. However, the presence of bubbles affects the light transfer within the PBRs. Therefore, a comprehensive analysis of the radiation transfer in PBRs during the growth of microalgae considering the effect of bubbles is instructive to design and optimize the light distribution and aeration to achieve a high growth rate and promote carbon dioxide fixation.
The Lambert–Beer law and two-flux method were widely used to simulate the local fluence rate in PBRs due to their simplicity [12,13,14,15]. Note that it can lead to large errors in predicting the fluence distribution where multiple scattering dominates. Pruvost et al. [16] theoretically calculated the radiative transfer in a solar rectangular PBR, considering dynamic solar radiation combined with growth kinetics. Huang et al. [17] studied the light distribution in the internally irradiated cylindrical PBR. The reflection of walls was found to play an important role in light distribution. However, an empirical reflectance was adopted in the model, and the scattering was approximated as isotropic. Lee et al. [18] investigated the light distribution coupled with growth kinetics in open ponds and PBRs exposed to time-dependent solar irradiance. Kandilian et al. [19] investigated the radiation characteristics of microalgae influenced by the growth conditions using both theoretical and experimental methods. The coated sphere approximation agreed well with the measured integral radiation characteristics of Chlorella vulgaris. It is noted that these studies did not take into account bubbles and time-dependent radiation characteristics of microalgae.
Some works have considered the time-dependent radiation characteristics to simulate light distribution in PBRs. Some researchers [20,21] uncovered diel variations in the scattering and absorption cross-sections of microalgae. Pilon’s group [22] reported the time evolution radiation characteristics of Nannochloropsis oculata over full growth phases, which were found to vary significantly in response to changes in fluence rate and nutrient availability. Moreover, Pilon’s group [23] investigated the mass absorption and scattering cross-sections of Anabaena cylindrica on 5 different days and found that the trends of different absorption peaks were quite different from each other. Zhao et al. [24] measured the time-dependent radiation characteristics of the three species of microalgae and showed that the absorption and scattering cross-sections generally decreased with cultivation time. Ma et al. [25] determined the time-dependent radiative properties of C. vulgaris based on the Lorenz–Mie theory in combination with the growth-dependent cell size distributions and pigment content and indicated that large errors will be introduced when cell growth is neglected. In previous studies, the influence of CO2 bubbles on the radiation characteristics of microalgae during the growing period has been neglected.
A clear growth enhancement is generally observed when supplying an air stream containing CO2 [26,27,28]. Furthermore, some studies [29,30,31] reported that reducing the size of CO2 bubbles can significantly improve the growth of microalgae in PBRs. However, that research focused on the gas-liquid mass transfer rather than the changes and effects of radiative transfer with aeration. Pilon’s group [32] first proposed a model accounting for anisotropic scattering by both the bubbles and microorganisms and considered the spectral radiation characteristics. It was concluded that the Lambert–Beer law cannot be applied to predict the irradiance and that anisotropic scattering by the bubbles should be considered. They also obtained the radiation characteristics of several species of microalgae from normal-normal and normal-hemispherical transmittance measurements and a polar nephelometer [33,34]. Wheaton and Krishnamoorthy [35] simulated the 3D distributions of radiation coupled with fluid hydrodynamics in the PBRs and found that 1-μm-size bubbles more effectively redistribute the radiation downstream of the radiators. McHardy et al. [36] numerically investigated the impact of gas bubbles on light distribution in a bubble column PBR under different gas flow rates and microalgae concentrations. Luzi et al. [37] evaluated the enhancement of culture growth by pulsed illumination and pneumatic mixing in a bubble column PBR through numerical simulations. The above studies revealed that it was necessary to consider bubbles in the radiation transfer calculation for PBRs. However, the effects of bubble parameters, including bubble volume fraction and size, have not been well studied.
In this work, two typical species of CO2 fixation microalgae, Chlorella sp. and S. obliquus, were selected for experimental cultivation in an airlift flat plate PBR. An improved transmission method was conducted to determine the time-dependent radiation characteristics of microalgae. An accurate radiation transfer model considering microalgal time-dependent radiation characteristics, bubble scattering and wall surface reflection was verified to predict radiation distribution in the PBR during the growing period. The local irradiance in the PBR for time-dependent radiation characteristics was obtained and compared with the stationary results. An investigation of bubble volume fraction and radius was also carried out.

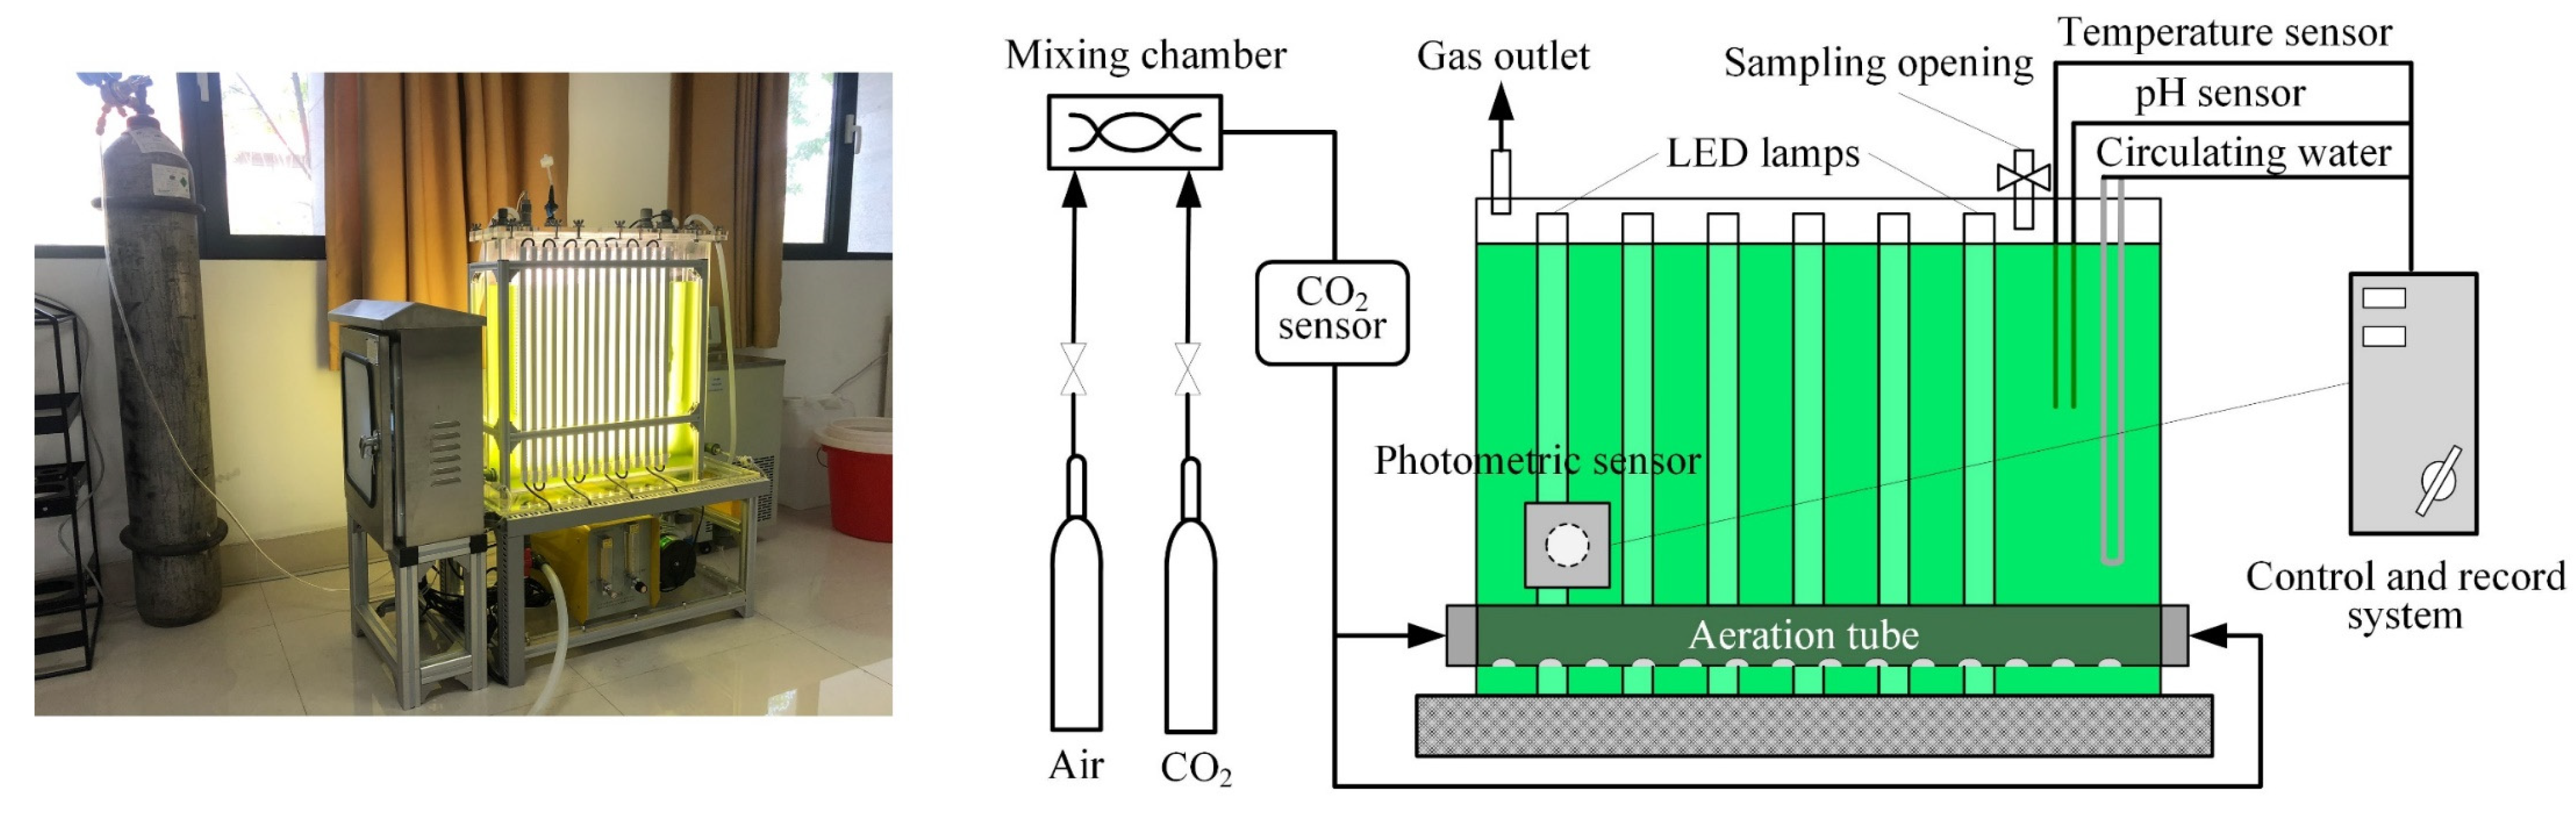
2. Experiments and Methodology

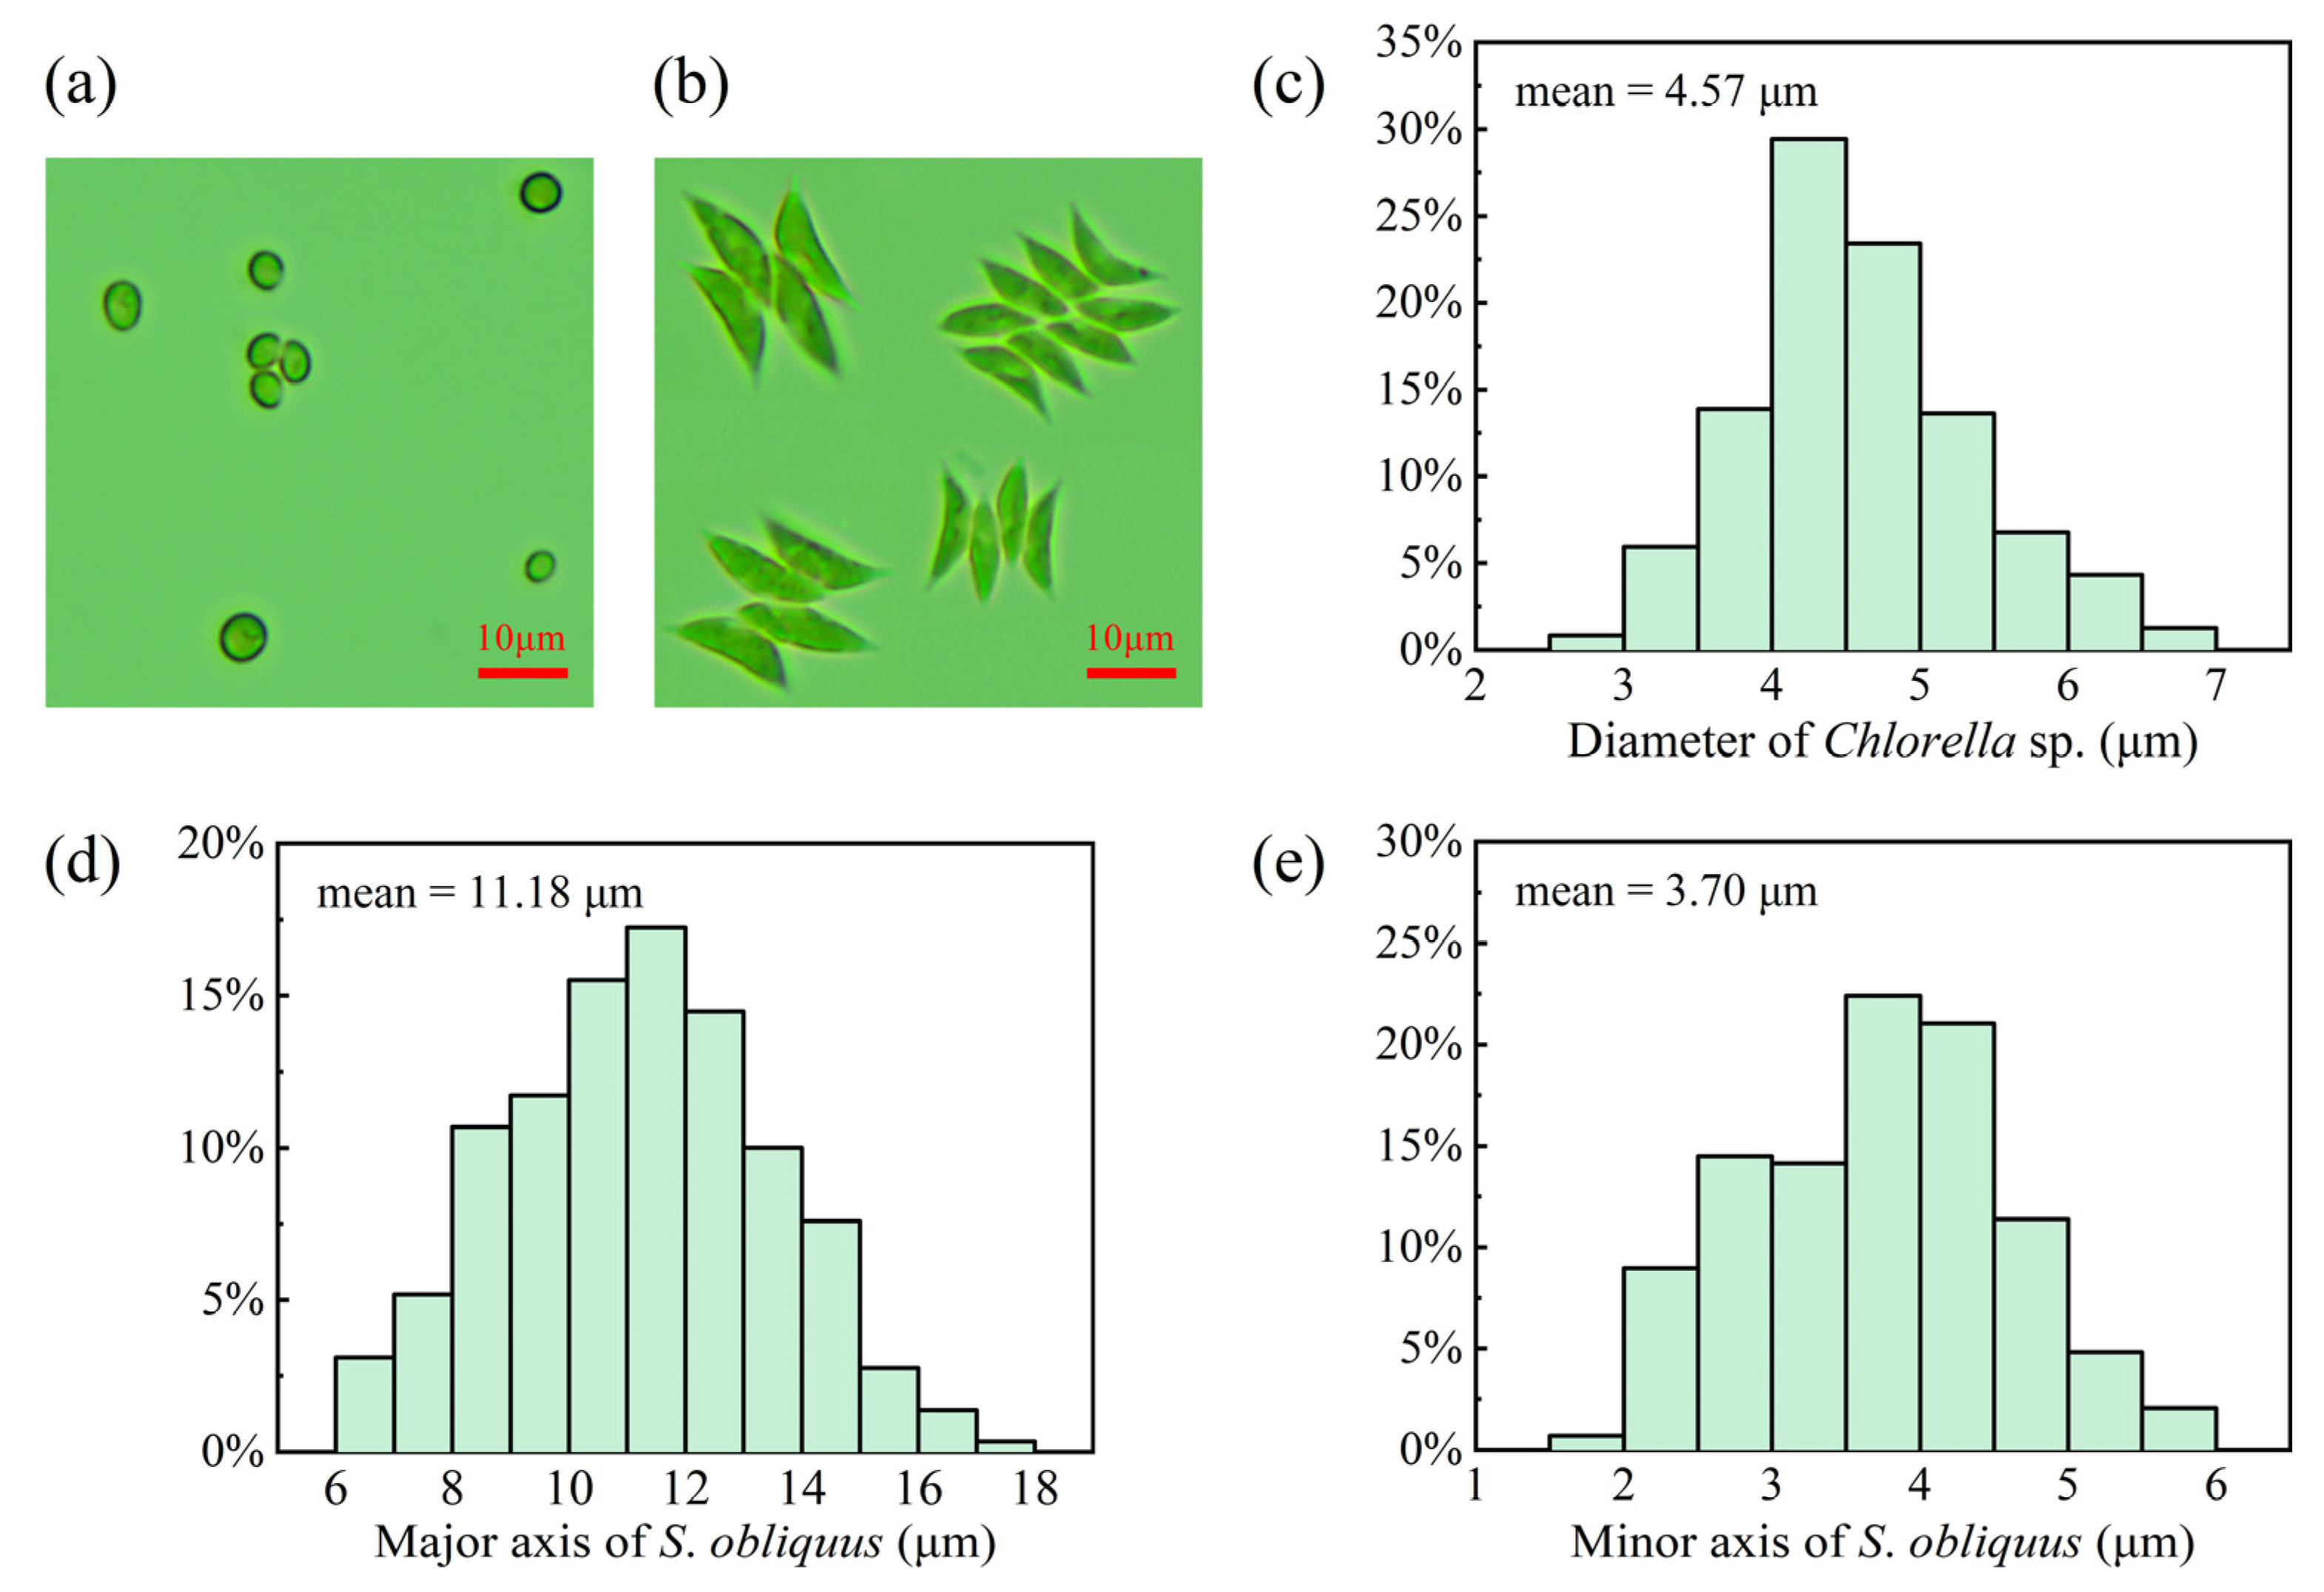
2.1. Cultivation and Sample Preparation

To cultivate microalgae, an airlift flat panel of polymethyl methacrylate (PMMA) PBR (produced by Shanghai Guangyu Biological Technology Co., Ltd., Wenzhou, China) with an inner length of 58 cm, a width of 8 cm and a height of 58 cm was chosen. As presented in Figure 1, 15 columns of LED lamps were parallelly installed on one side, and a photometric sensor was set on the other side to measure the intensity of transmitted light. The temperature of cultures, the intensity of LED lamps and the inflow velocity of air and CO2 can be controlled with supporting equipment.
Chlorella sp. and S. obliquus, two typical CO2 fixation and lipid accumulation species of green algae with high CO2 tolerance, were selected for cultivation [38,39,40]. The BG11 medium [41] was used for microalgal culture, whose composition is listed in Supplementary Materials. The medium was sterilized via heating in a high-pressure vessel, and the pH value was adjusted to 7.1 with HCl or NaOH before cultivation. The microalgae were precultured in 250-mL conical flasks and subcultured in the PBR with a total culture volume of 24.6 L. The culture temperature was kept constant at 25 °C. The sparging air was mixed with pure CO2 to give a concentration of 1% at a total rate of 2 L/min. The transmitted light was about 4300 lx with only BG11 medium in the PBR after adjusting light intensity. The working cycle of illumination and aeration was 12 h on and 12 h off. A black cloth was covered outside of the PBR to avoid the influence of ambient light.
A direct microscopic count was performed on the sample of microalgal culture using a plankton-counting chamber (counting area 20 × 20 mm2, volume 100 μL) and an optical microscope (model UB203i) equipped with a CCD camera. The size of the microalgae was obtained by analyzing the microscopic images with the software ImageView. Microalgal biomass was determined by measuring the dry weight: Filter a certain volume of culture and then weigh the microalgae after drying at 105 °C for 8 h. About 500 mL of culture was sampled per day for measurements, and the same volume of fresh and sterilized BG11 medium was added to the culture after sampling. The sampling volume was small enough and barely affected the status of culture in the PBR.

2.2. Radiation Characteristics Measurements

The time-dependent radiation characteristics of microalgae are fundamental for radiation transfer analysis in the PBR. However, the simplified optical model used in the traditional approach to obtain the extinction coefficient omits high-order transmission [42]. Here, an improved transmission method was conducted to determine the extinction and absorption coefficients of microalgae suspensions [43]. A certain amount of culture was sampled into a cuvette to measure the normal-normal transmittance and the normal-hemispherical transmittance. Subsequently, the extinction coefficient β and absorption coefficient α were calculated by [44]:
β = 1 L 2 ln ( t 1 t 3 + t 1 2 t 3 2 + 4 T EXP 2 r 3 r 1 2 T EXP r 3 r 1 ) ,
α = 1 L 2 ln ( t 1 t 3 + t 1 2 t 3 2 + 4 T h , EXP 2 r 3 r 1 2 T h , EXP r 3 r 1 ) ,
where TEXP is the normal-normal transmittance and Th,EXP is the normal-hemispherical transmittance. L2 is the thickness of layer 2 (liquid layer). t1 and t3 represent the transmittance of layer 1 (incident glass) and layer 3 (outgoing glass) of the cuvette from the incident side, respectively, r1′ and r3 represent the reflectance of layer 1 from the nonincident side and layer 3 from the incident side, respectively. t1, t3, r1′ and r3 are given as follows [42]:
t 1 = τ 01 τ 12 e α 1 L 1 1 ρ 10 ρ 12 e 2 α 1 L 1 ,   t 3 = τ 23 τ 30 e α 3 L 3 1 ρ 32 ρ 30 e 2 α 3 L 3 ,
r 1 = ρ 21 + τ 21 τ 12 ρ 10 e 2 α 1 L 1 1 ρ 12 ρ 10 e 2 α 1 L 1 ,   r 3 = ρ 23 + τ 23 τ 32 ρ 30 e 2 α 3 L 3 1 ρ 32 ρ 30 e 2 α 3 L 3 ,
where ρij and τij represent the reflectivity and transmissivity at the interface between two neighboring media, i and j. L1 and L3 are the thicknesses of layer 1 and layer 3, respectively. Moreover, α1 and α3 are the corresponding absorption coefficients. The single scattering is assumed to prevail due to the quite small volume fraction of microalgae (generally < 0.001) in our experiments. Then, the average absorption and extinction cross-sections of microalgae were obtained by dividing the absorption and extinction coefficients by the cell number density, and the extinction cross-section minus the absorption cross-section is the scattering cross-section.
The normal-normal transmittance was measured by the spectroscopic ellipsometer (model RC2-DI; J.A. Woollam Co., Inc., Lincoln City, NE, USA) with a spectral range of 193–1690 nm. The normal-hemispherical transmittance was determined using an integrating sphere (model RTC-060-IG; Labsphere, Inc., North Sutton, NH, USA) with a measuring system (model Omni-DR830-SDU; Zolix Instruments Co., Ltd., Beijing, China) based on the lock-in amplifier and monochromator and ranged from 400 to 1100 nm. The optical constants of H2O and SiO2 were obtained from refs. [45,46], respectively. The thickness of cuvette glass is 1.63 mm, and the optical path is 9.80 mm. In addition, a multi-angle polarized light scattering meter (LISST-VSF; Sequoia Scientific, Inc., Bellevue, WA, USA) covering the angular range of 0.1–150° at wavelength 515 nm was employed to measure the scattering phase functions of microalgae.

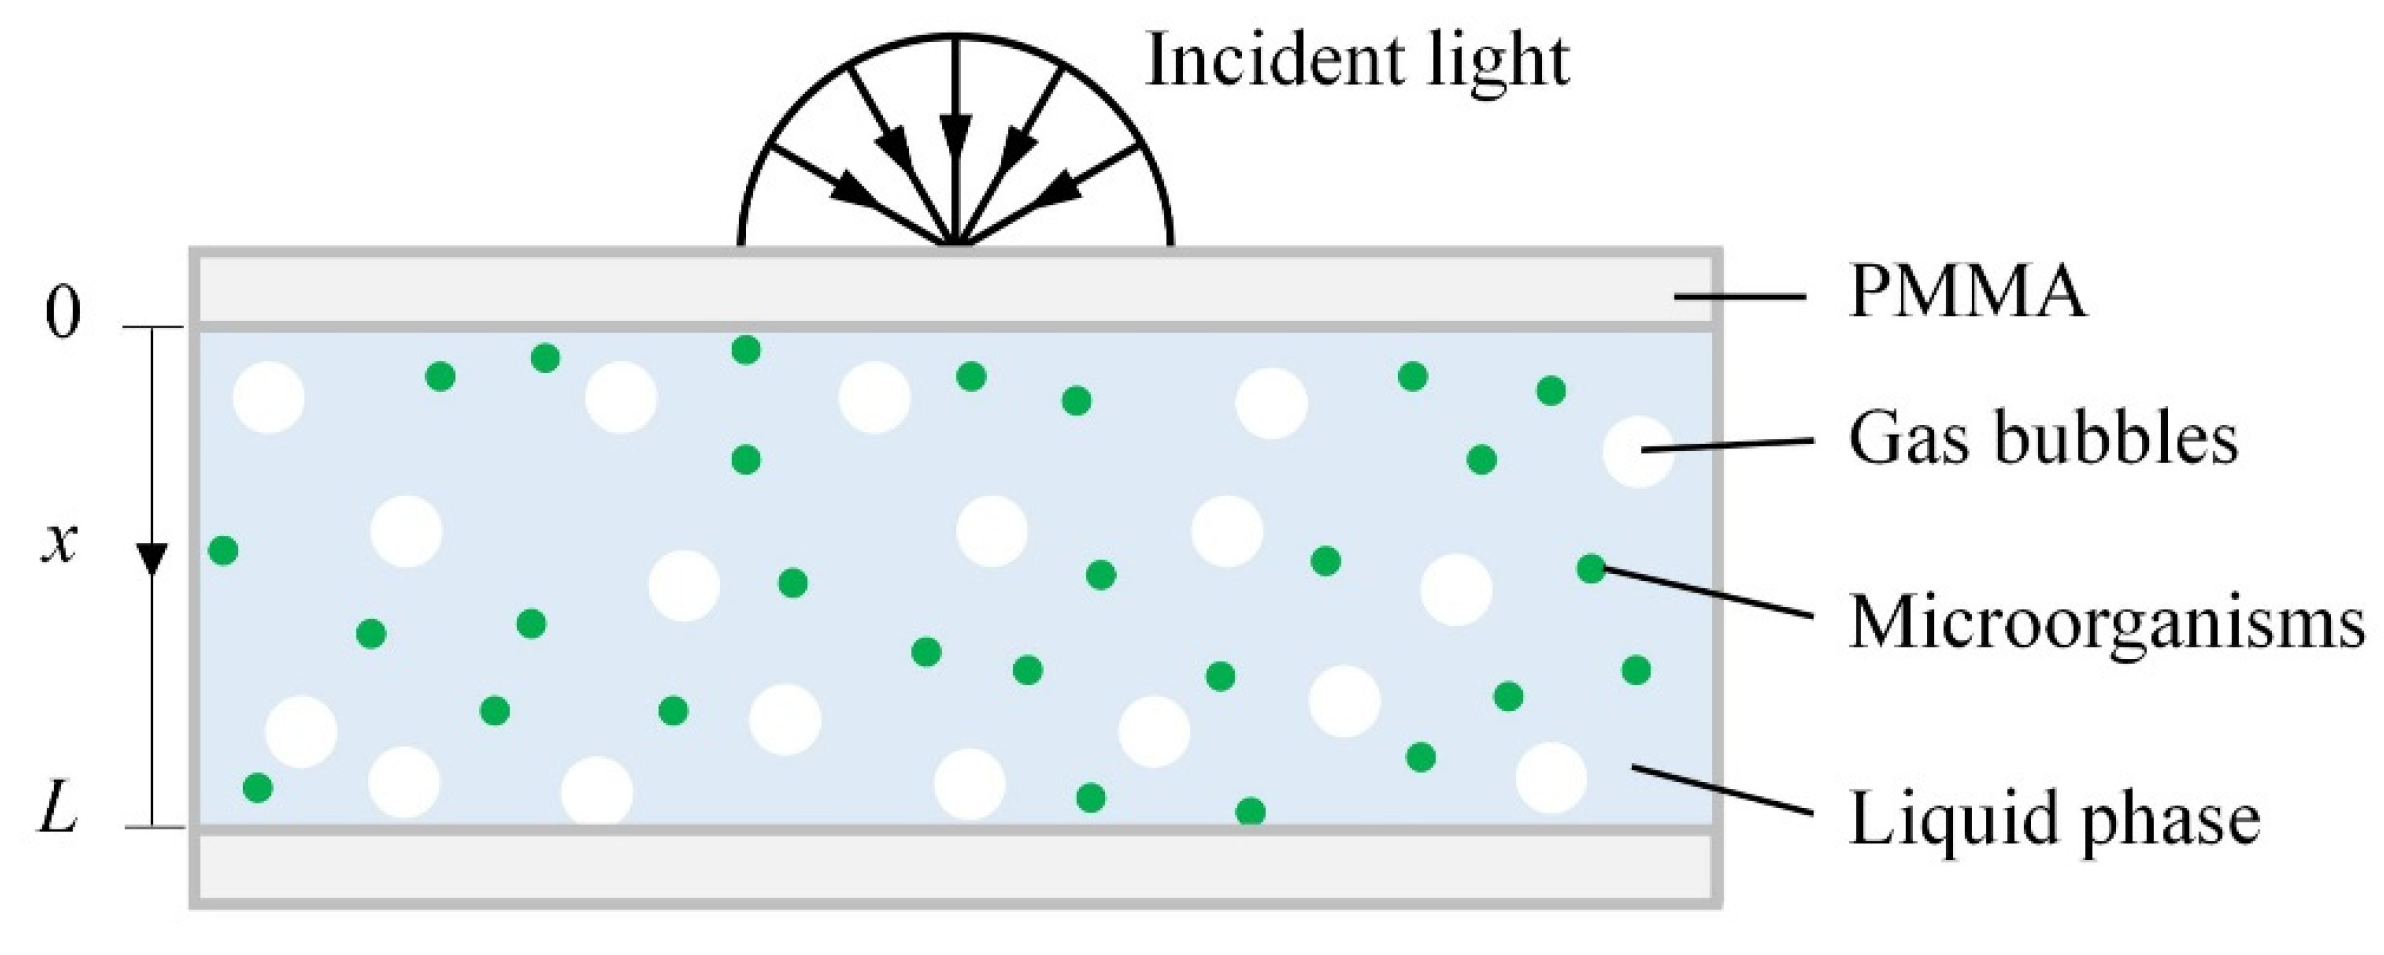
2.3. Radiation Transfer Modeling of the PBR

The radiation transfer model considering microalgal time-dependent radiation characteristics, bubble scattering and wall surface reflection was established to predict radiation distribution in the PBR. Microalgae and bubbles are uniformly distributed and randomly oriented in general due to the agitation caused by continuous aeration from the bottom. So, the cultures are assumed to be homogeneous, absorbing, scattering and non-conducting.
As shown in Figure 2, in a suspension, the radiation intensity Iλ(r,ŝ) in direction ŝ and wavelength λ at location r can be expressed by the steady-state radiation transfer equation (RTE) and written as [47]:
s ^ I λ ( r , s ^ ) = β λ I λ ( r , s ^ ) + κ λ I b ( r , s ^ ) + σ s , λ 4 π 4 π I λ ( r , s ^ i ) Φ λ ( s ^ i , s ^ ) d Ω i ,
where κλ and σs,λ are the effective spectral absorption and scattering coefficients, and the extinction coefficient is defined as βλ = κλ + σs,λ. The scattering phase function Φλ(ŝi,ŝ) represents the probability of light in direction ŝi and solid angle dΩi scattering to the direction ŝ and solid angle dΩ.
The finite volume method (FVM) was employed to discretely solve the RTE, assuming that the light transfer is one-dimensional (see computational details in Refs. [48,49] and a brief description in Supplementary Materials). The emission of the dispersive medium and walls is ignored because of the relatively low temperature. The phase functions of the bubbles and microalgae are approximated as Henyey–Greenstein (H–G) phase functions ΦHG [50]. The expressions of κλ, σs,λ and ΦHG are shown in Supplementary Materials.
The incident light was assumed to be diffuse, and the boundary conditions were also regarded as diffuse reflection since the light transferring in the suspension illuminated the PMMA walls in different directions. The light source irradiance and boundary reflection are given in the Supplementary Materials. A box model [47] was used in which the absorption and scattering spectrum at 400–1100 nm was divided into four sections according to the position of the absorption peak. Each sub-spectrum of absorption and scattering is then approximately represented by its mean value; the light source irradiance spectrum and liquid phase absorption spectrum are also divided into four corresponding sub-spectrum in the same way; the liquid phase is cold, absorbing, and non-scattering, whose optical properties are regarded as those of pure water; the bubbles are spherical, and their scattering properties do not vary appreciably within the spectrum considered; the bubbles and microalgae are monodisperse and independent scattering prevails. In addition, the effective incident irradiance Gin, average single scattering albedo ωeff and the interfacial area concentration of bubbles Ab are described in Supplementary Materials.

3. Results and Discussion
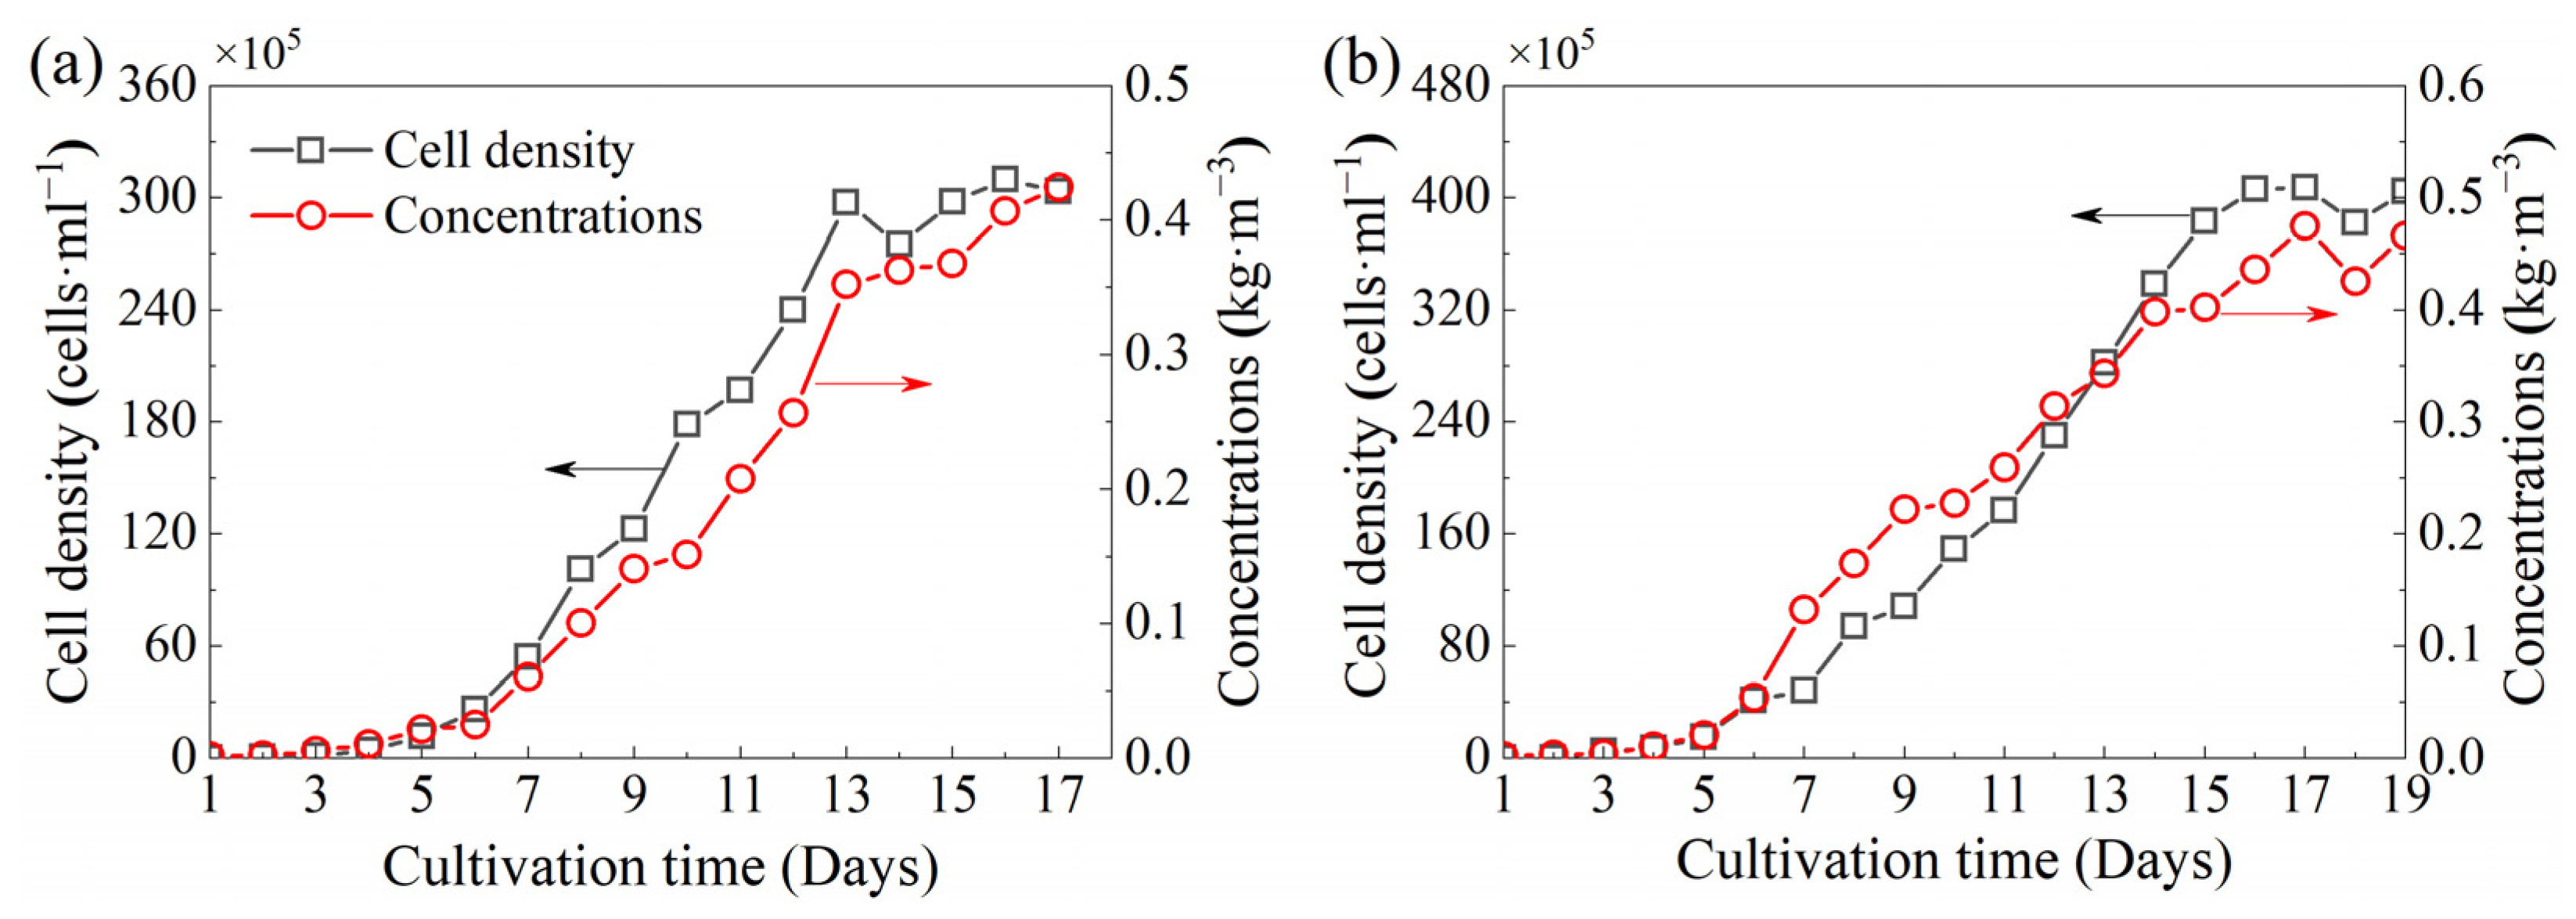
3.1. Cell Growth

Figure 3 presents the growth curves of Chlorella sp. and S. obliquus plotted in cell number density and biomass mass concentrations. The curves show three typical growth phases, namely the lag phase, the exponential phase and the stationary phase. The lag phase is characterized by slow initial growth of microalgae, which was attributed to the adaptation to the new growth environment of microalgae incubated from the conical flask to the PBR. The exponential phase is characterized by a large growth rate that corresponds to the cultivation time from day 6 to day 13 for Chlorella sp. and from day 6 to day 15 for S. obliquus. The stationary phase, where the growth rate slowed down, finally occurred due to the insufficiencies of lights, nutrients or CO2. The fluctuations of the microalgal growth curve result from the wall-adhering growth of microalgae, the deposition of low-activity or dead cells, and the experimental uncertainty. During sampling, the cells depositing on or adhering to the PBR walls are not collected to reduce the influence on measurements of microalgal radiation characteristics.
Figure 4 shows micrographs and cell size distributions of Chlorella sp. and S. obliquus. Chlorella sp. is unicellular and near-spherical with a mean projected area equivalent diameter of 4.57 μm. S. obliquus often exists as colonies composed of 4 or 8 cells and is approximately ellipsoid. The projected area equivalent major and minor axes of a single cell average 11.18 μm and 3.70 μm.
Figure 5a is the transmitted light intensity in the PBR during the cultivation of Chlorella sp., and that of S. obliquus is shown in Supplementary Materials, both of which decrease slowly initially, then fast, and then slowly again. For Chlorella sp., the transmitted light intensity decreased rapidly from day 3 and was hardly detected after day 11. For S. obliquus, the transmitted light intensity decreased from day 2 to day 10. Figure 5b is the transmitted light intensity of the PBR with and without aeration every day for Chlorella sp., and that for S. obliquus is shown in Supplementary Materials. The results show that the transmitted light intensity of the PBR was reduced by bubbles in the initial stage with low microalgae concentrations. In addition, the presence of sparged bubbles did not reduce the transmitted light intensity any longer after day 6 for Chlorella sp. and day 4 for S. obliquus, meaning that the scattering by bubbles influences the radiation less at higher microalgae concentrations. The corresponding concentration on day 6 for Chlorella sp. (0.025 kg·m−3) is larger than that on day 4 for S. obliquus (0.011 kg·m−3), which means that S. obliquus attenuates radiation more than Chlorella sp. and the effect of bubbles for S. obliquus is less than that for Chlorella sp. Wheaton and Krishnamoorthy [35] showed that the effect of bubbles was negligible when the microalgae concentrations were over 0.5 kg·m−3, and McHardy et al. [36] found that the biomass already counteracted the effects of bubbles at concentrations less than 1 kg·m−3. Their results were larger than those in this study, which was mainly caused by the much smaller bubbles or larger aeration ratio (the ratio of gas volume inflowed per min to the culture volume) in their models. However, the research of Luzi et al. [37] indicated that this concentration was also related to the intensity of the light.
Figure 6 presents the difference between the CO2 concentration of the inlet and outlet gases of the PBR during the cultivation, which equals the amount of CO2 absorbed by the microalgal culture. The results show that the CO2 is almost not absorbed and utilized by microalgae, owing to their slow growth and low microalga concentration. The absorption of CO2 starts on day 2 for Chlorella sp. and day 3 for S. obliquus and saturates on day 6 for both species of microalgae. The maximal absorption amounts of CO2 are about 0.3% for both species of microalgae, which means that about 30% of CO2 is removed from the 1% CO2 aeration. Chiu et al. [27] reported the efficiency of CO2 reduction in the semicontinuous Chlorella sp. cultures was 58%, 27%, 20% and 16% in 2%, 5%, 10% and 15% CO2 aeration, respectively. De Morais and Costa [51] demonstrated that 7–13% of CO2 was fixed by S. obliquus at 6% CO2 aeration in a three-serial tubular PBR, and the fixation efficiency decreased to 4–9% at 12% CO2 aeration. The efficiency of CO2 removal or fixation in the PBR is dependent on not only the microalgae species, CO2 concentration, and PBR form [52], but also the CO2 bubble size, which was not mentioned in their research.
Note that the times when little transmitted light is detected and CO2 absorption no longer increases are both earlier than the end of the exponential phase. It suggests that microalgae keep growing rapidly with limited light and CO2. The same behaviors were observed by Tang et al. [53] and Heng and Pilon [22].

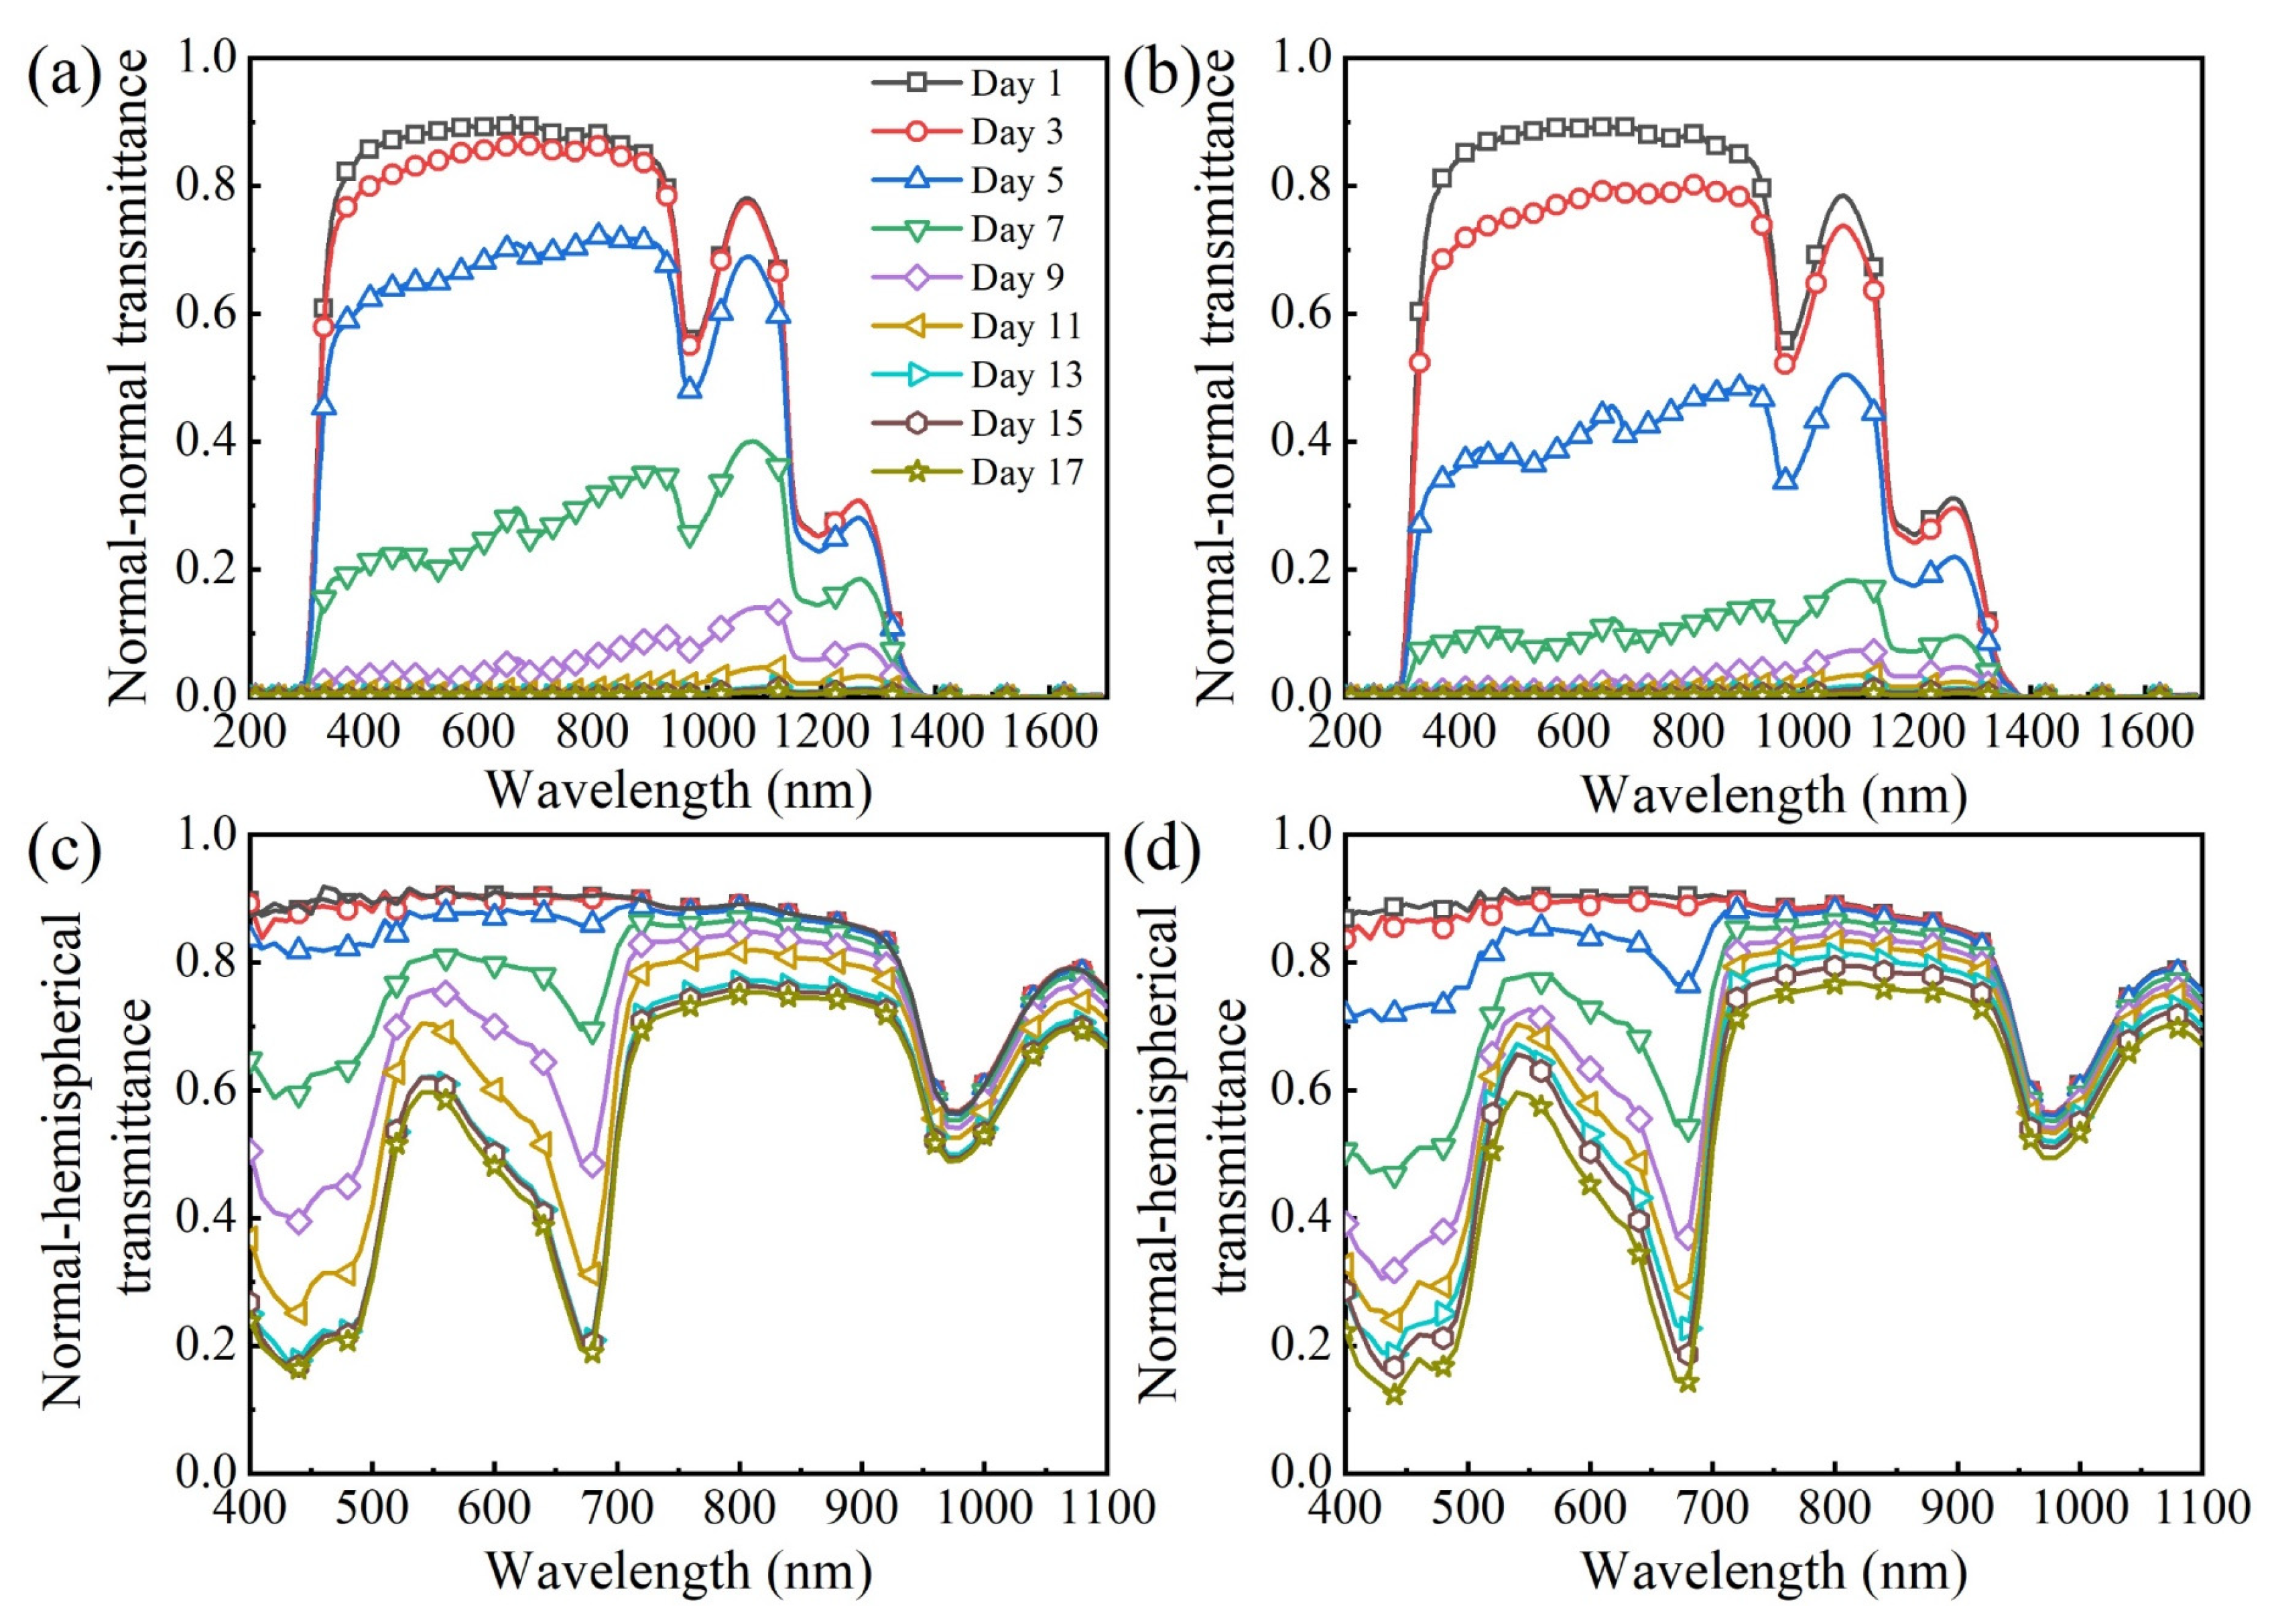
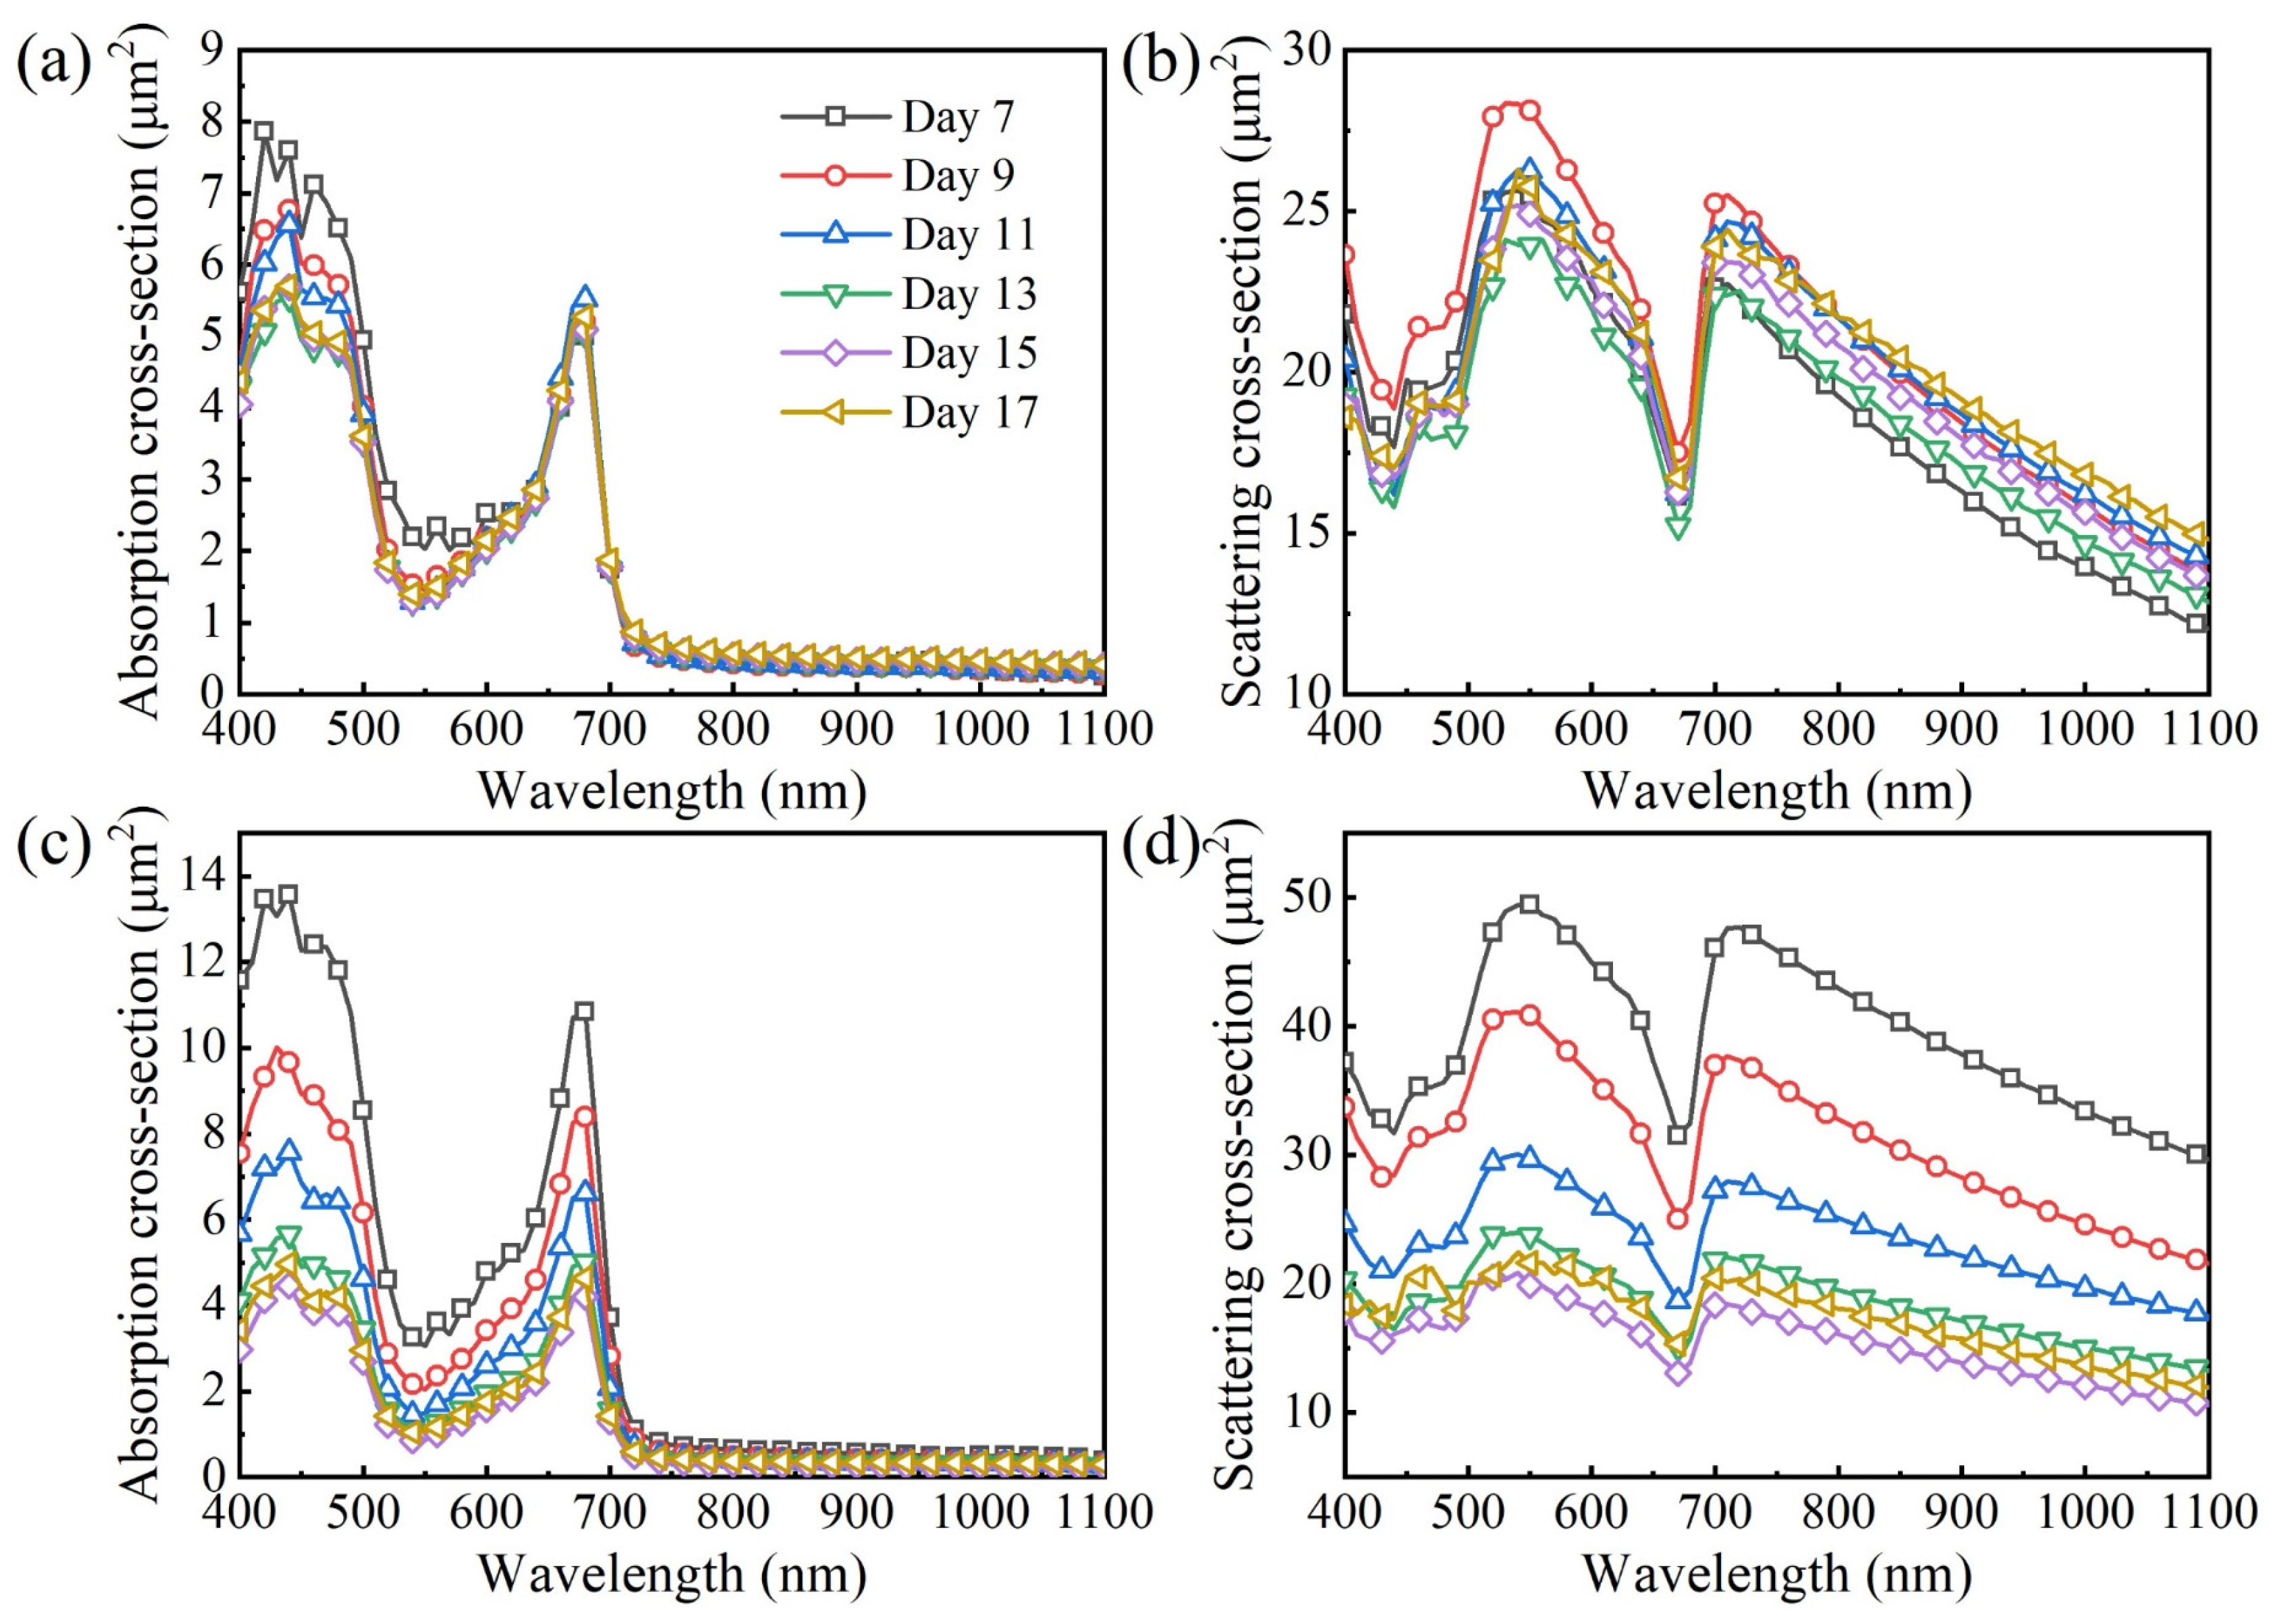
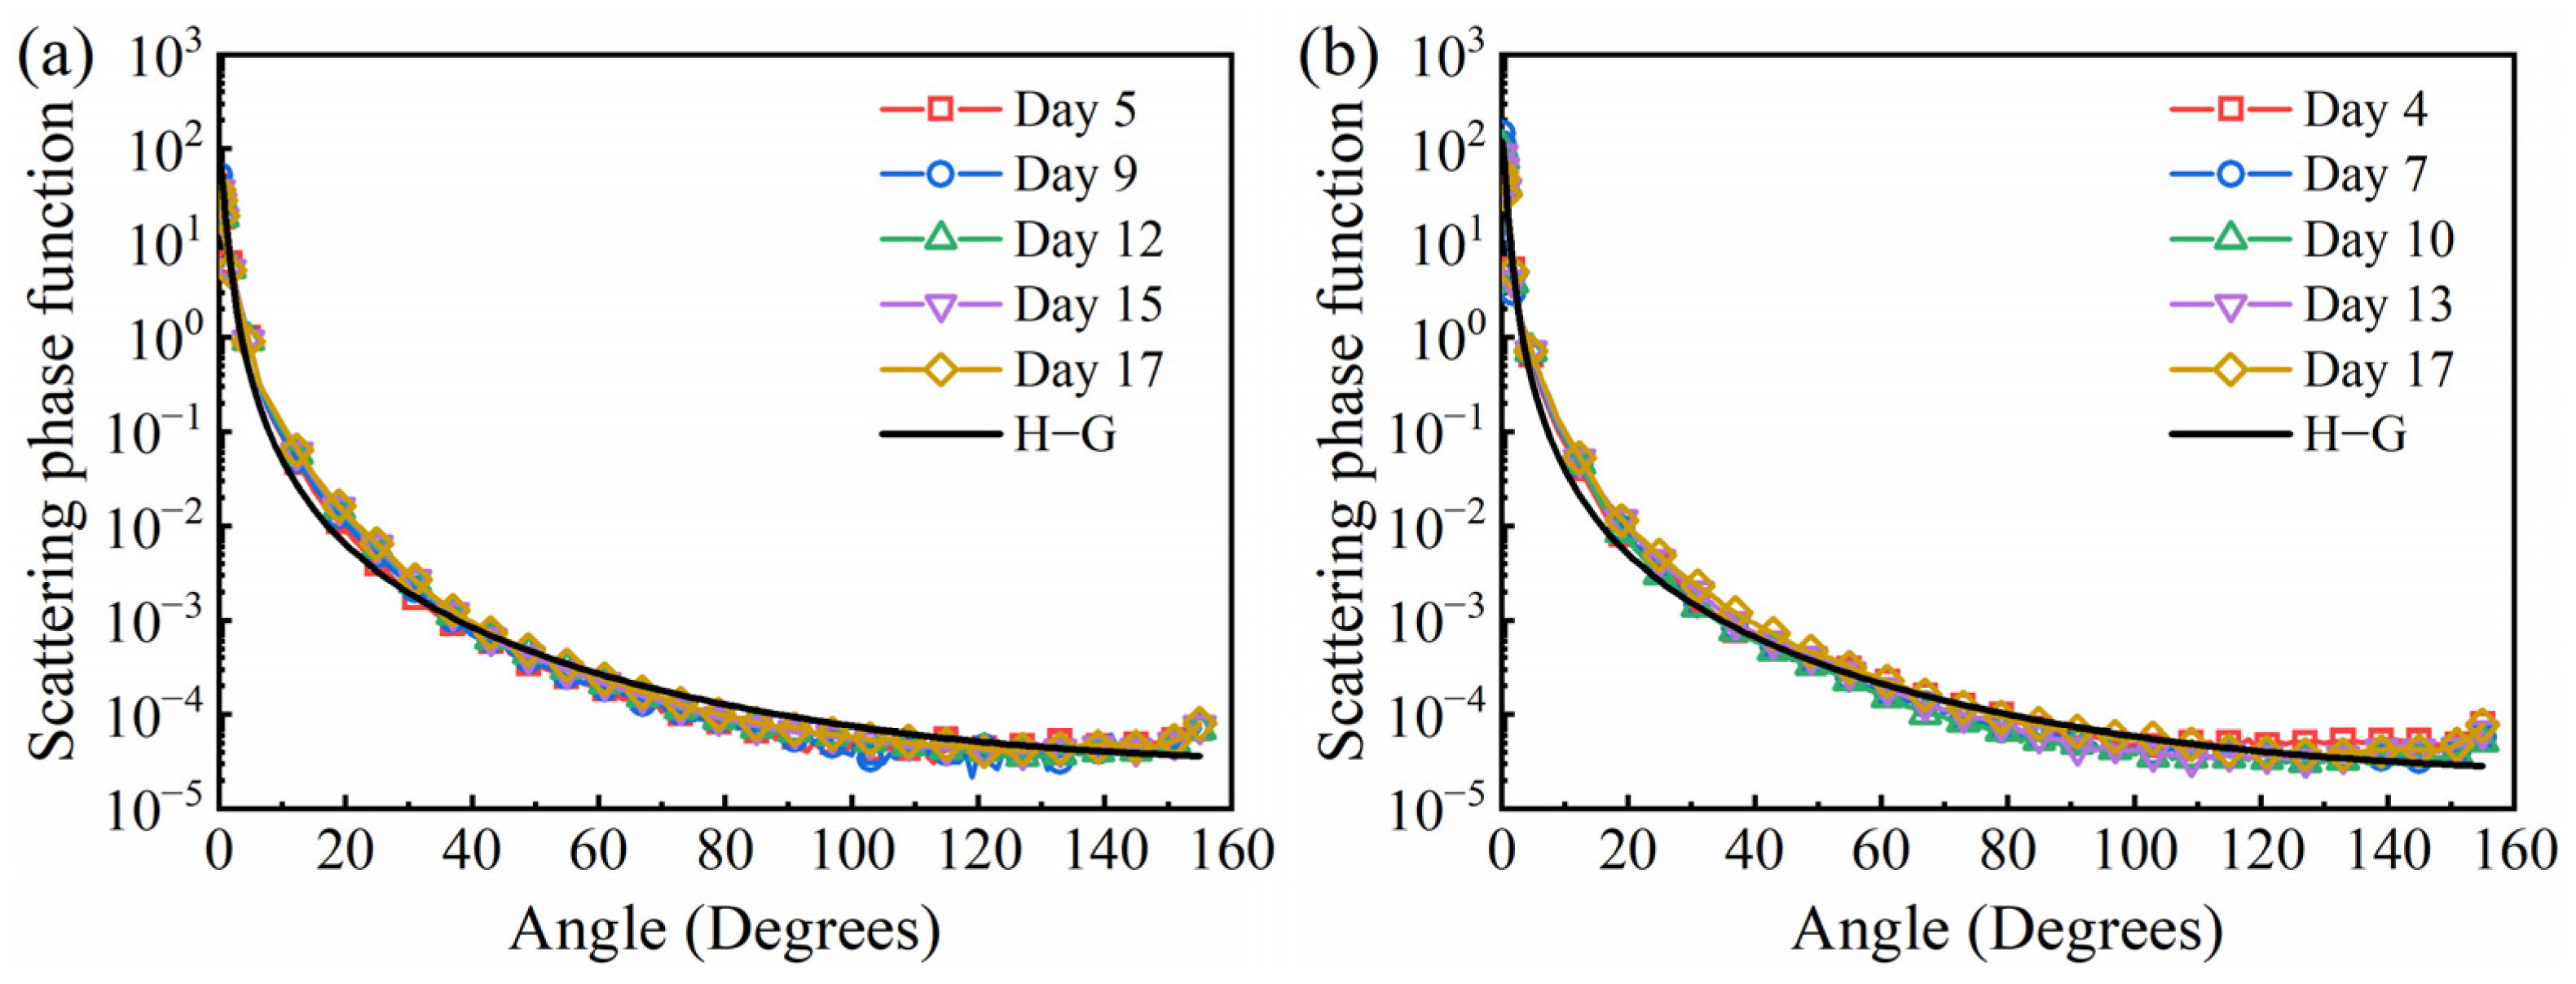
3.2. Time-Dependent Radiation Characteristics of Microalgae

Figure 7 shows the normal-normal and normal-hemispherical spectral transmittance of the cuvette containing microalgal culture. The results show that the normal-normal and normal-hemispherical transmittances for Chlorella sp. decrease rapidly from day 3 to about day 11. By contrast, the transmittance of S. obliquus starts to quickly decrease earlier, which is consistent with the decreasing trend of the transmitted light intensity in Figure 5a and Figure S2a. The cell density is extremely low (<105 cells·ml−1 for both species of microalgae) on day 1, so it is believed that the dip in normal-hemispherical transmittance curves over 900 nm is mainly caused by the absorption of the BG11 medium and cuvette glasses, while the microalgal absorption results in the dips around 450 nm and 700 nm as cell density increases.
Figure 8 presents the time-dependent radiation characteristics of the two species of microalgae in the spectral range from 400 to 1100 nm. The absorption cross-sections in Figure 8a,c display peaks at 430 and 680 nm attributed to chlorophyll a, at 450 nm and 660 nm attributed to chlorophyll b, and at 485 nm attributed to carotenoids [54]. Since drastic fluctuations (even negative values) appeared in cross-sections when microalgal culture was at the lag phase with small cell number density, the absorption and scattering cross-section curves of the first 6 days were omitted from Figure 8. The results show that the absorption cross-sections of both species of microalgae are small in the spectral range over 720 nm. The absorption and scattering cross-sections of S. obliquus decreased consistently until day 15, reaching the stationary phase. The maximum values of the absorption cross-section at 430 nm and 680 nm are 2.92 times and 2.58 times the minimum values, respectively, while the absorption and scattering cross-sections of Chlorella sp. change relatively slightly during growth. The absorption and scattering cross-sections of S. obliquus are larger than those of Chlorella sp. because of the larger cell size of S. obliquus. The results are consistent with refs. [24,55]. The reason why the absorption and scattering cross-sections decrease with growth time can be explained by the slow synthesis of photosynthetic pigments relative to rapid cell division in the exponential growth phase [24].
In Figure 9, the measured scattering phase function and calculated H-G phase function for Chlorella sp. and S. obliquus are presented. The scattering phase functions are strongly forward due to the relatively large size parameter and change little with growth time. Therefore, the microalgal scattering phase functions were assumed to be time-invariant. It was found that the H-G phase function provided good approximations of microalgal phase functions. Various species of microalgae scatter light strongly in the forward direction [56]. The asymmetry factor gXa is generally larger than 0.95 and does not change significantly with wavelength [57].

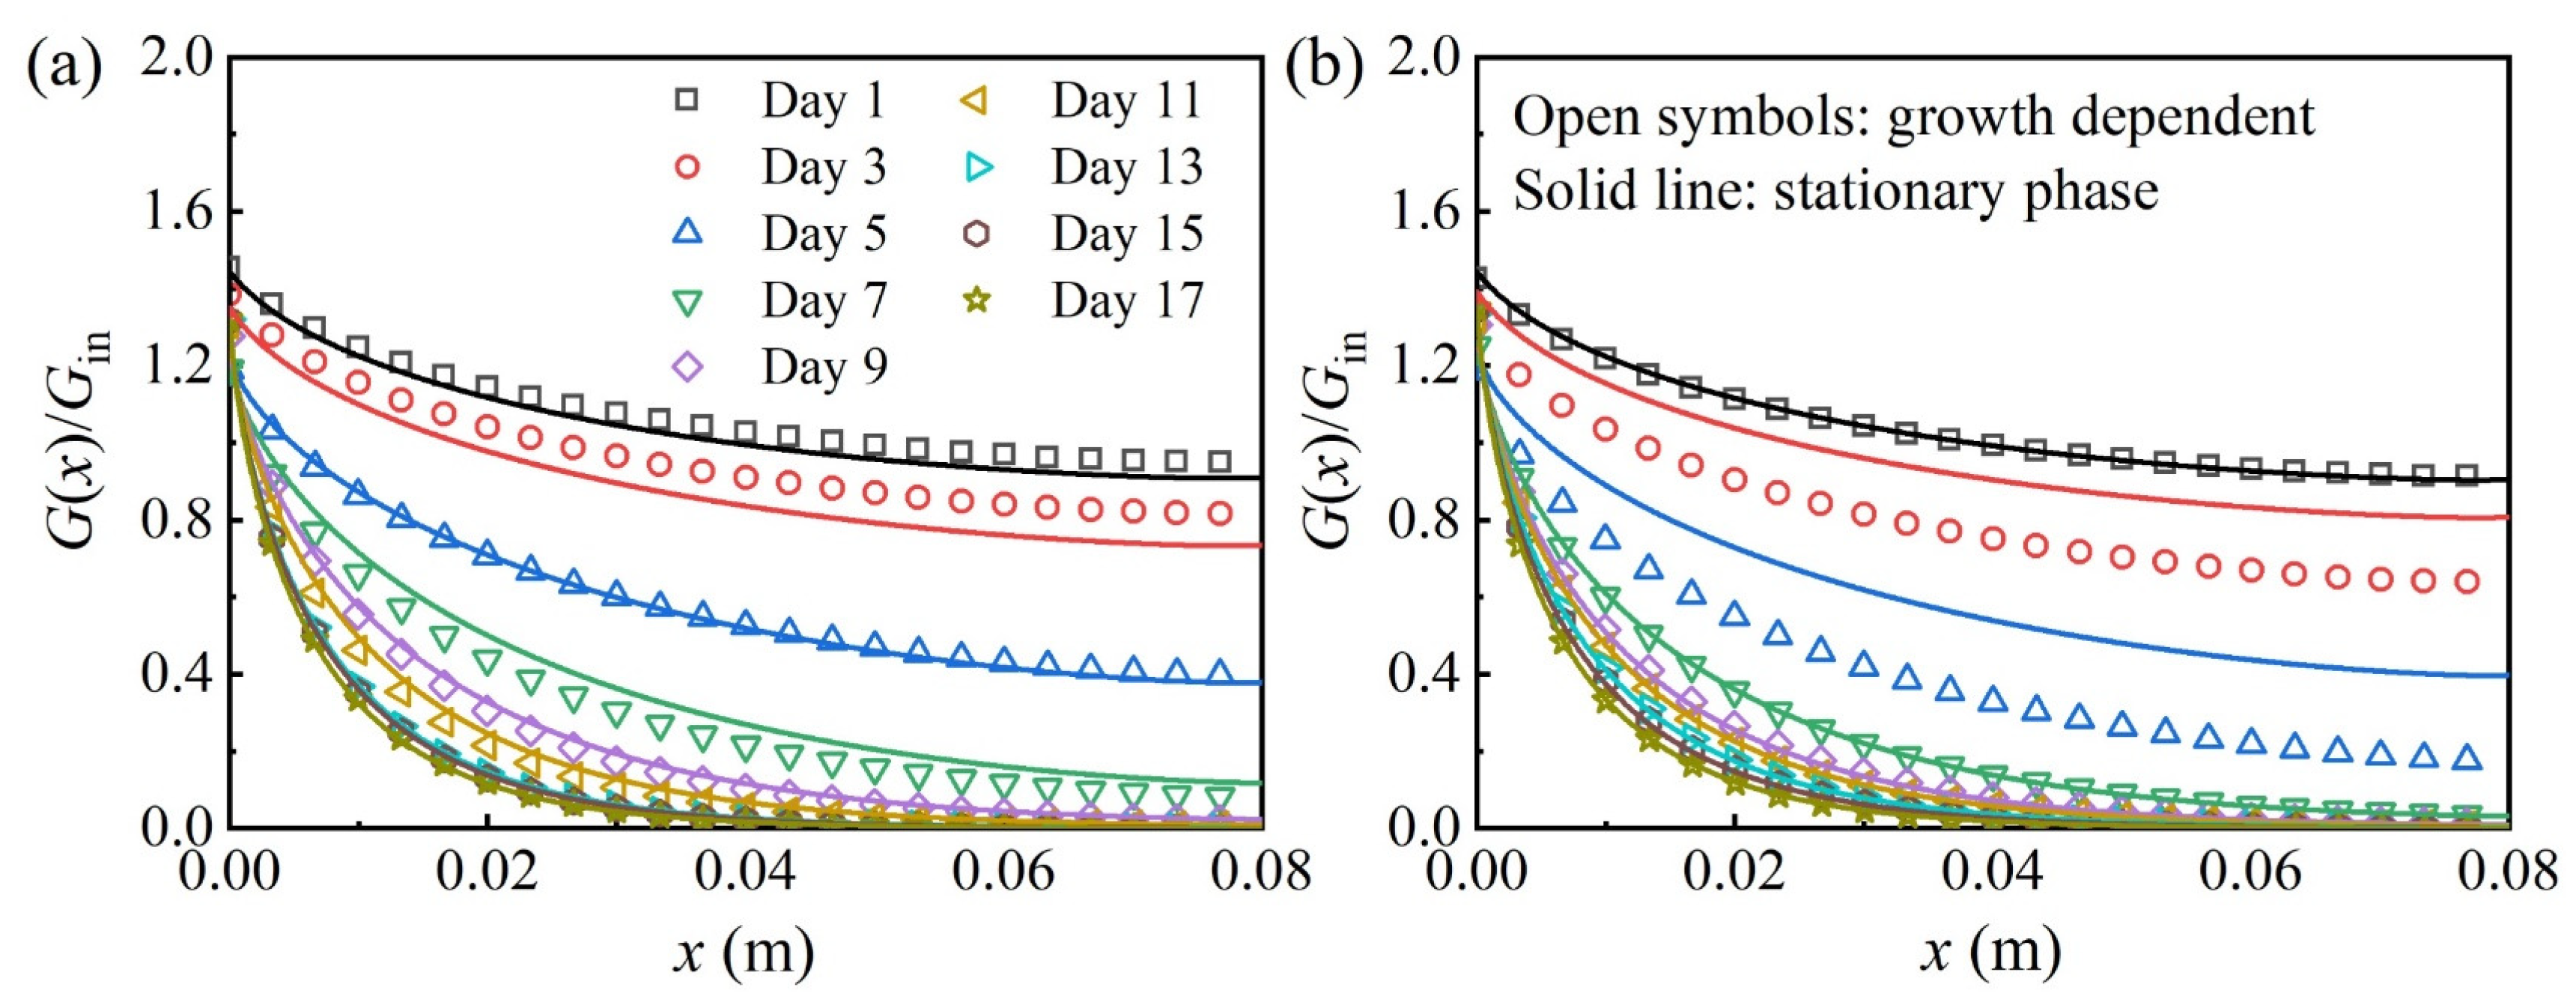
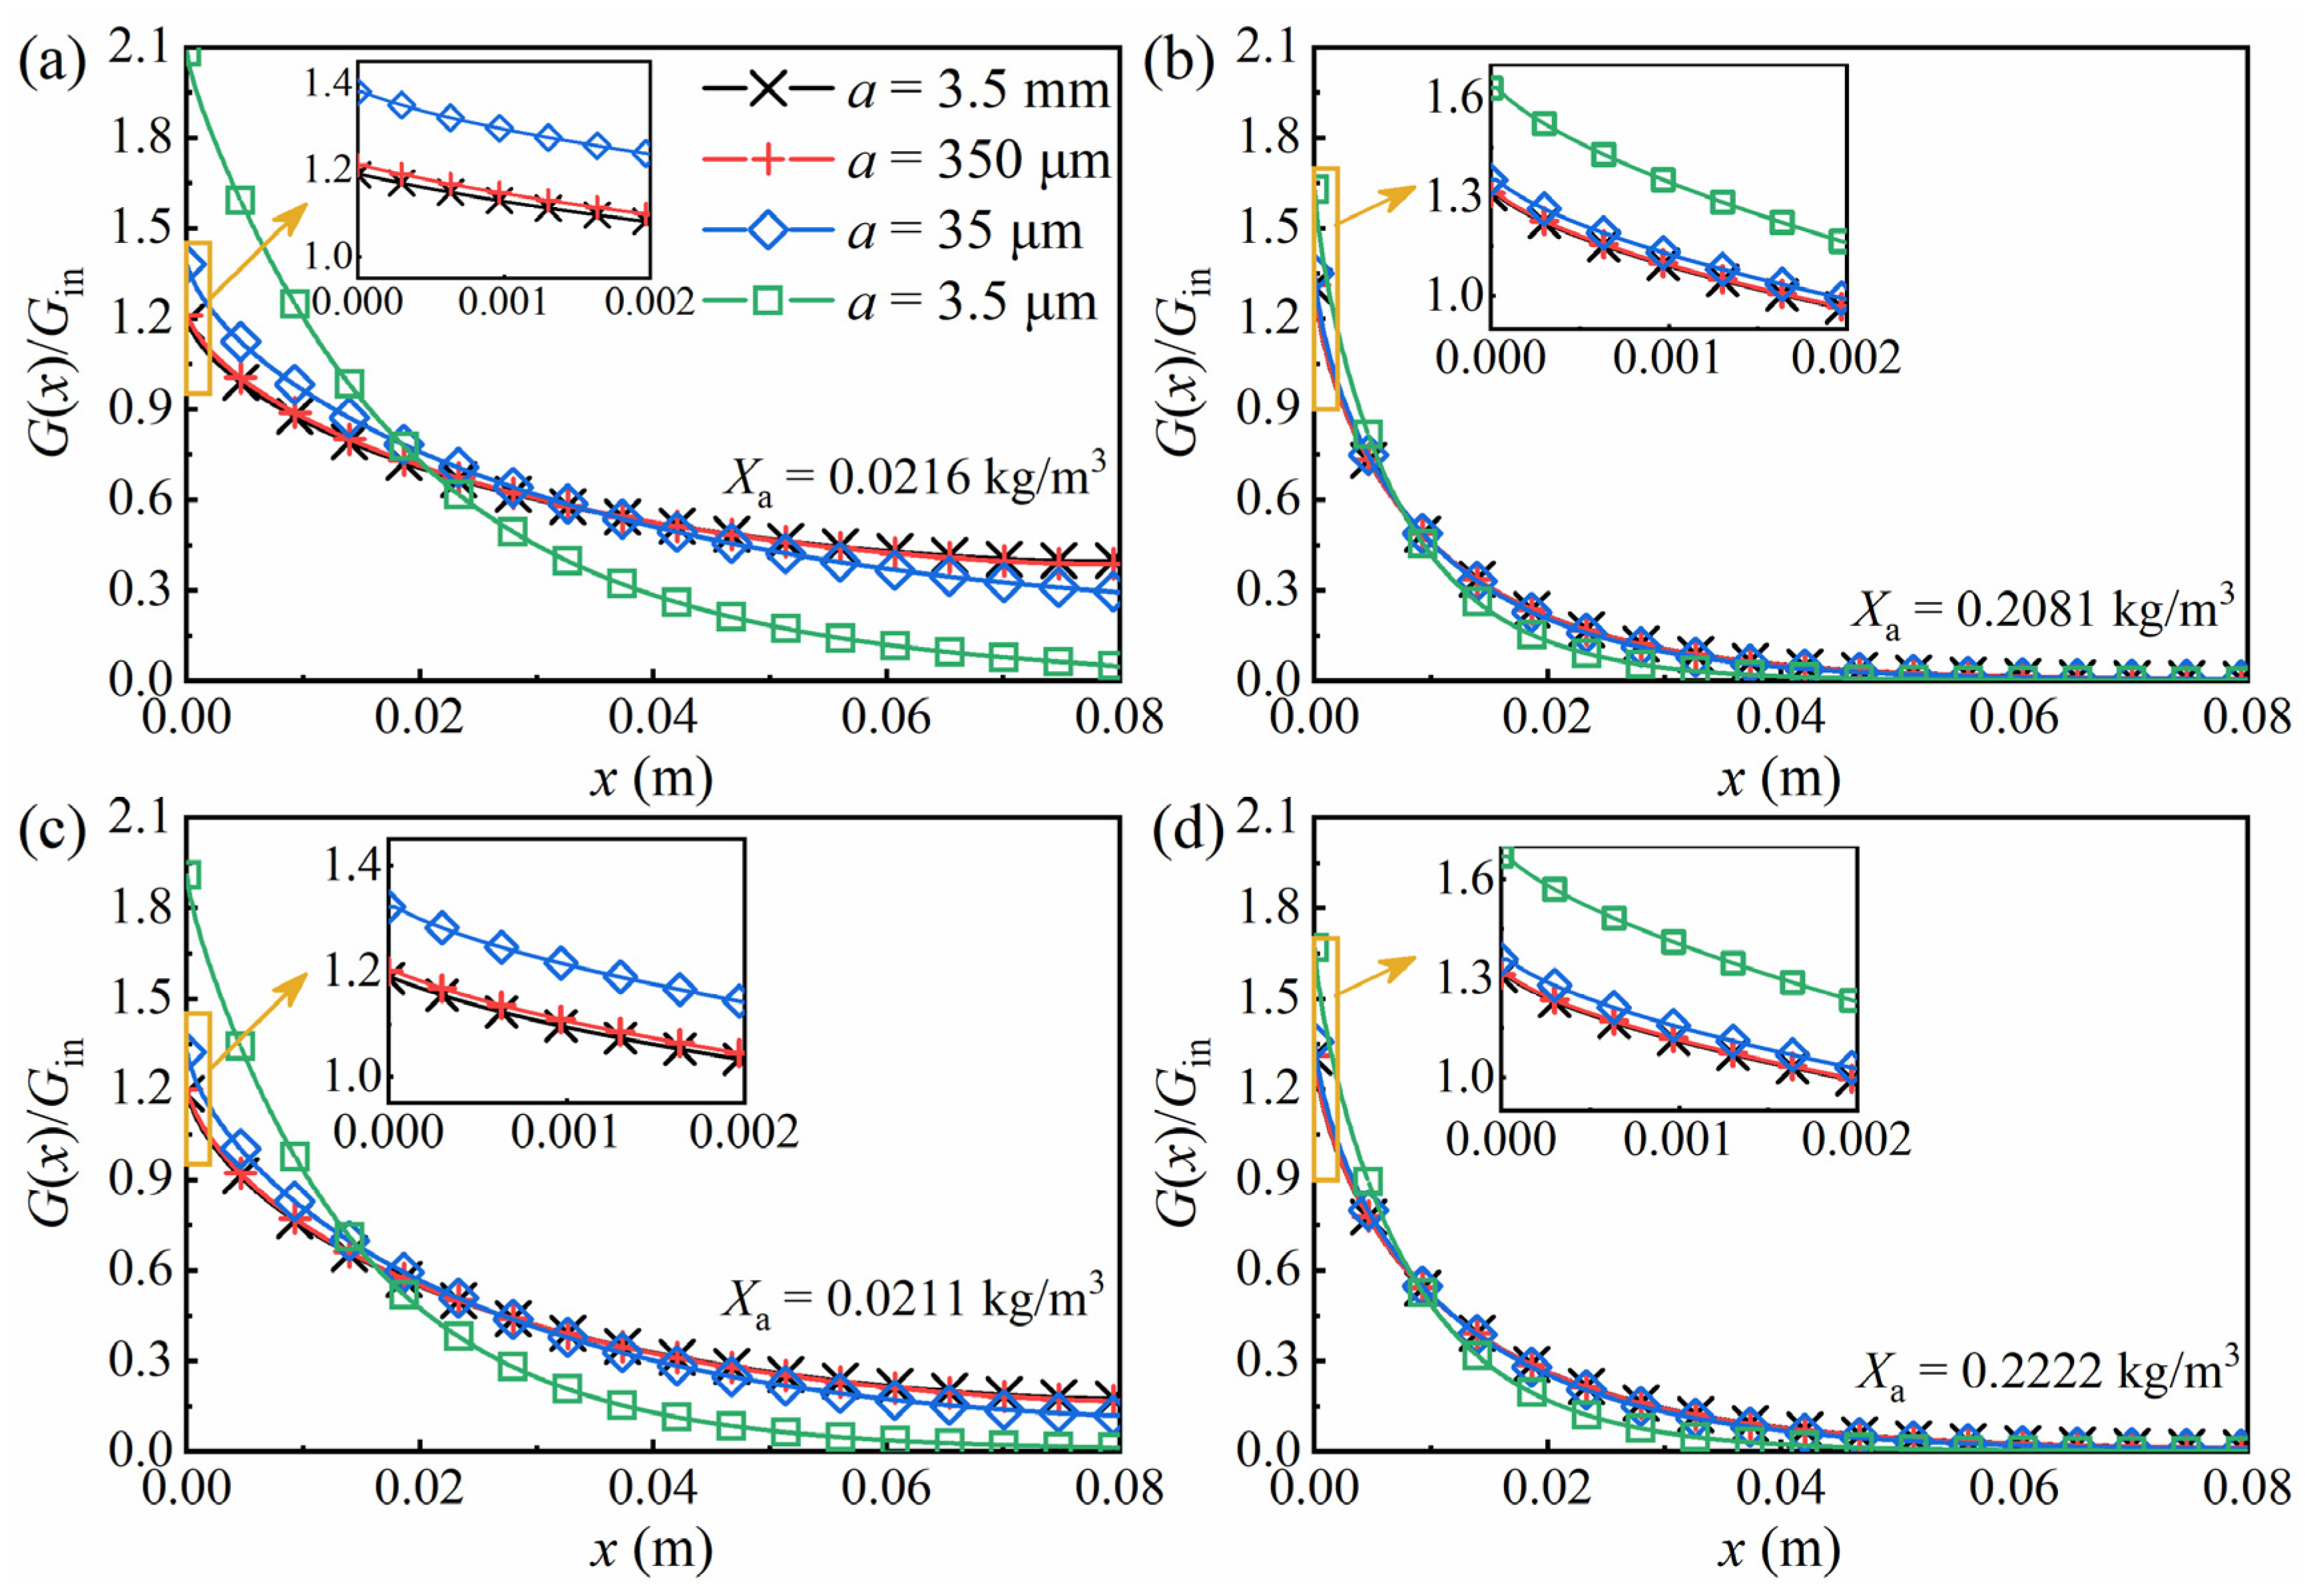
3.3. Time-Dependent Radiation Transfer in the PBR

It is of great significance for microalgal cultivation to simulate the radiation transfer in the PBR during the growth. The time-dependent radiation characteristics of microalgae as well as the optical properties of liquid phase and bubbles are approximated with the box model, as summarized in Supplementary Materials.
Figure 10 shows the one-dimensional radiation distribution in the PBR based on the time-dependent and stationary radiation characteristics, respectively. The results show that there is a relatively small difference for Chlorella sp. due to small changes in absorption and scattering cross-sections, while the local irradiance calculated using stationary radiation characteristics was larger than that using time-dependent radiation characteristics since the cross-sections of S. obliquus obviously decreased. The results are in agreement with reports by Ma et al. [55] but contrary to Ma et al. [25] as the cross-sections in the former decrease like this study, while those in the latter increase with time. In the early stage of cultivation, the radiation field was slightly affected by microalgae due to the extremely low cell number density. In the late stage of cultivation, the large density of microalgae strongly attenuated the light, and the time-dependent radiation characteristics gradually came close to the value at the stationary phase. As a consequence, the deviation of the local irradiance predicted with the stationary radiation characteristics from that predicted with the time-dependent radiation characteristics first increased and then decreased with cultivation days.
In comparison with Figure 10a,b, it is found that, when calculated with stationary radiation characteristics, the radiation distribution in the PBR of S. obliquus was similar to that of Chlorella sp. However, when calculated using time-dependent radiation characteristics, the local irradiance in the PBR of S. obliquus declines faster than that of Chlorella sp., which is consistent with Figure 7, where the spectral transmittance of S. obliquus declines faster than that of Chlorella sp. The radiation distribution in the PBR varies little after about 13 days for Chlorella sp. and 15 days for S. obliquus, which is consistent with the time reaching the stationary phase. In addition, the average single scattering albedo is calculated and given in Supplementary Materials, which contributes to the occurrence of values larger than 1 in Figure 10.

3.4. Bubble Volume Fraction and Size

Figure 11 illustrates the effect of bubble volume fraction fb on the one-dimensional radiation distribution in the PBR with different concentrations of (a,b) Chlorella sp. and (c,d) S. obliquus. The corresponding average single scattering albedo ωeff and percent increase in the total irradiance relative to effective incident irradiance at the illuminated culture surface are shown in Table 1. As shown in Figure 11a,c, as fb increased from 0 to 0.3, the irradiance at the illuminated surface of the culture was enhanced due to bubble scattering, and then it was attenuated more rapidly along with the radiation transfer and might be smaller than that without bubbles at larger culture depths. In Table 1, as fb increases from 0 to 0.3, the percent increase of the irradiance at the illuminated surface for Chlorella sp. in Figure 11a increases from 18.6% to 42.2%, with an increment of 23.6%, and ωeff increases by 0.185 from 0.745 to 0.930. Those for S. obliquus in Figure 11c increase by 18.1% and 0.082, respectively. It is found that the change in the radiation distribution in the PBR of S. obliquus is smaller than that of Chlorella sp. as fb increases with low microalgae concentrations, i.e., the effect of bubbles on radiation transfer in the PBR of S. obliquus is less than that of Chlorella sp. due to the larger absorption and scattering cross-sections of S. obliquus. As the fb increased from 0 to 0.3, the percent increase of surface irradiance and ωeff for Chlorella sp. in Figure 11b increased by 8.2% and 0.017, and those for S. obliquus in Figure 11d increased by 9.7% and 0.020, respectively. All increments at different fb in Figure 11b are smaller than those in Figure 11a for Chlorella sp. The same trend occurs in Figure 11c,d for S. obliquus, which demonstrates that the bubbles have no obvious effects on the radiation distribution in the PBR at high microalgae concentrations. It is believed that the radiation attenuation is dominated by the absorption of microalgae cells. The same conclusion was drawn by Wheaton and Krishnamoorthy [35].
As shown in Table 1, for fb = 0, 0.003, or 0.03, ωeff of two species of microalgal cultures are larger at higher concentrations, while for fb = 0.3, they are smaller at higher concentrations since the increased microalgae diminish the contribution of bubble scattering to ωeff, which also explains why the percent increase of the surface irradiance of Chlorella sp. culture declines from 42.2% to 38.7% in Table 1 (fb = 0.3). However, ωeff is not the only factor that affects surface irradiance. As shown in Table 1 (fb = 0.3), ωeff for S. obliquus in 0.0211 kg/m3 (0.917) is larger than that in 0.2222 kg/m3 (0.899), while the percent increase of the surface irradiance for 0.0211 kg/m3 (36.5%) is less than that for 0.2222 kg/m3 (40.2%) since the back-scattering of microalgae prevails when ωeff varies slightly. Moreover, ωeff of the two species of microalgae are not quite the same in low microalgae concentrations and small bubble volume fractions, but there is a tiny difference in the percent increase of the surface irradiance between the two species of microalgae, which is attributed to the small scattering coefficient. The percent increase of local radiation at the illuminated culture surface in the PBR in this study is generally larger than that in the research of Berberoğlu et al. [32]. Although the microalgae species and bubble size they studied differ from this study, the main reason is that they assume the boundaries to be ideally transparent, while the practical reflectance of the PMMA wall was considered in this study. The trend that the large wall reflectance increases the local irradiance is consistent with the findings of Huang et al. [17].
Figure 12 illustrates the effect of bubble radius a on the one-dimensional radiation distribution in the PBR with different concentrations of (a) and (b) Chlorella sp. and (c) and (d) S. obliquus. The corresponding average single scattering albedo ωeff and percent increase in the total irradiance relative to the effective incident irradiance at the illuminated culture surface are shown in Table 2. It is found that as bubble radius decreases, the trend of the local irradiance in the PBR is similar to that in Figure 11 when fb increases. The decrease in bubble radius enhances the scattering of a dispersive medium in the PBR, like the increase in fb, so that the local irradiance increases at the illuminated surface of the microalgal culture and is attenuated more rapidly along with the radiation transfer. As radius decreases from 3.5 mm to 3.5 μm, the percent increase in surface irradiance in Figure 12a–d increases by (a) 89.6%, (b) 32.3%, (c) 72.3% and (d) 36.3%, respectively. Figure 12 again indicates that the effect of bubbles on radiation transfer in the PBR of S. obliquus is less than that of Chlorella sp. and the bubbles have fewer effects on the radiation distribution in the PBR at higher microalgae concentrations. In Table 2 (a = 3.5 μm), S. obliquus shows the same behavior as Chlorella sp. in that the percent increase of surface irradiance is smaller in the higher microalgae concentrations. As the microalgae concentrations increase from 0.0211 kg/m3 to 0.2222 kg/m3 (a = 35 μm), ωeff decreases a little by 0.013, so the percent increase of surface irradiance still increases. Nevertheless, ωeff decreases relatively largely by 0.027 (a = 3.5 μm), which affects the surface irradiance more so than the percent increase in surface irradiance decreases.
Bubbles with smaller radii and a larger fb offer larger gas/liquid interfacial area for mass transfer. Berberoğlu et al. [32] found that the percent increase of surface irradiance tends to increase at higher interfacial area concentration Ab (= 3fb/a), while they did not investigate the effects of fb and bubble radius in detail. Comparing Table 2 with Table 1, it is found that in the same Ab, the irradiance at the illuminated culture surface with bigger bubbles in Figure 11 is larger than that with smaller bubbles in Figure 12. For example, Chlorella sp. cultures in Figure 11a (fb = 0.3, a = 3.5 mm) and Figure 12a (fb = 0.003, a = 35 μm) have the same Ab of 266 m−1. The percent increase in surface irradiance of the former (42.2%) is larger than that of the latter (38.0%) due to more absorbing volume in the latter, resulting in less light scattered to the illuminated surface. As shown in Figure 12, the smaller the bubbles are, the smaller the local irradiance is at the area near the back surface, which is in agreement with the research of Berberoğlu et al. [32], but opposite to the research of Wheaton and Krishnamoorthy [35]. The reason may be that the former is like this study in terms of PBR’s shape and light source installation, while the latter employs cylindrical PBR and sets the light source inside the reactor.
The most common specific growth rate model considering light saturation and inhibition, the Haldane model [58], is used to estimate the effects of bubbles on growth rate and the maximum efficiency of carbon dioxide fixation. The models and identification of parameters, as well as the local specific growth rate, are given in Supplementary Materials, and the average specific growth rates with different fb and bubble radius are shown in Table 3. The results showed that growth rate decreases as fb increases (except at a = 3.5 mm) or as radius decreases, since an increase in fb or a decrease in radius increases the gradient of the light field, resulting in inhibition with excessive irradiance [59] near the illuminated surface and a deficiency of light near the back. While for a = 3.5 mm, the irradiance was mildly and generally enhanced at the entire depth as fb increased. The maximum growth rate occurred at fb = 0.3 and a = 3.5 mm in all cases. While fb = 0.003 and a = 3.5 mm is recommended as the optimal condition considering the trade-off between increased growth rate and cost. The opposite effect of bubble radius on growth rate between this study and the literature [30] is not unacceptable since small bubbles improve the growth of microalgae through the promotion of mass transfer [11]. The results in this study indicate that the volume fraction and bubble radius should be simultaneously considered in radiation transfer rather than summarized as the interfacial area concentration.

4. Conclusions

The radiation transfer in PBRs is greatly affected by the microalgal time-dependent radiation characteristics of microalgae and bubbles. A thorough analysis of radiation transfer during the microalga growth in PBRs is essential for improving the cultivation. This study reports the temporal evolution of the scattering and absorbing cross-sections for Chlorella sp. and S. obliquus, which are grown in the airlift flat plate PBR. A one-dimensional model for radiation transfer in the PBR was proposed, considering the time-dependent radiation characteristics and bubbles. The scattering and absorption cross-sections of S. obliquus are found to decrease consistently over cultivation time, while those of Chlorella sp. change slightly. For S. obliquus, the local irradiance calculated using the radiation characteristics of the stationary phase is larger than that using time-dependent radiation characteristics. For Chlorella sp., the deviation is relatively small. With the increase of bubble volume fraction or the decrease of bubble radius, the local irradiance increases at the illuminated surface of the microalgal culture and is attenuated more rapidly along with the radiation transfer. The effect of bubbles on radiation transfer in the PBR of S. obliquus is less than that of Chlorella sp. The bubbles have no obvious effects on the radiation distribution in the PBR at high microalgae concentrations. It is believed that the radiation attenuation is dominated by the absorption of microalgae cells. The irradiance at the illuminated culture surface is related to various factors, including average single scattering albedo and boundary reflection. In the same interfacial area concentration, the irradiance at the illuminated culture surface with bigger bubbles is higher than that with smaller bubbles. The average specific growth rate decreases as bubble volume fraction increases or bubble radius decreases, resulting from the increased gradient of the light field. The volume fraction of 0.003 and a radius of 3.5 mm are the optimal operating conditions in this study for microalgae growth and carbon dioxide fixation. The presented analysis will facilitate the design and optimization of the optical and aeration configurations of PBRs to achieve a high growth rate and promote carbon dioxide fixation.

Supplementary Materials

The following supporting information can be downloaded at: https://www.mdpi.com/article/10.3390/photonics9110864/s1, Figure S1: The spectral irradiance of LED lights [60,61,62,63]; Figure S2: (a) The transmitted light intensity of the PBR of S. obliquus with respect to cultivation days. (b) The transmitted light intensity of the PBR with and without aeration every day; Figure S3: (a) The spectral mass scattering and absorption cross-sections of Chlorella sp. on day 13. (b) The spectral absorption coefficient of water; Figure S4: Temporal evolutions of average single scattering albedo of (a) Chlorella sp. and (b) S. obliquus; Figure S5: Specific growth rates of experimental data and kinetic model fitting with different irradiance [58,64]; Figure S6: Local specific growth rates for different bubble volume fractions and radii of (a,c,e) Chlorella sp. and (b,d,f) S. obliquus.; Table S1: BG11 (Blue-Green Medium) [41]; Table S2: A5 (Trace mental solution); Table S3: Summary of the optical properties of Chlorella sp. on day 13 and boundary conditions in the box model. [32,48,49,65].

Author Contributions

Conceptualization, X.L., J.-Y.Y. and L.L. (Linhua Liu); methodology, T.F. and L.L. (Li Lin); software, L.L. (Li Lin); validation, J.Z. and L.L. (Linhua Liu); resources, X.L. and J.Z.; data curation, T.F. and L.L. (Li Lin); writing—original draft preparation, T.F.; writing—review and editing, X.L., J.-Y.Y. and L.L. (Linhua Liu); supervision, X.L., J.-Y.Y., J.Z. and L.L. (Linhua Liu); project administration, X.L., J.-Y.Y. and L.L. (Linhua Liu). All authors have read and agreed to the published version of the manuscript.

Funding

This research was funded by the National Natural Science Foundation of China, grant number 52106080 and 52076123.

Data Availability Statement

Data underlying the results presented in this paper are not publicly available at this time but may be obtained from the authors upon reasonable request.

Acknowledgments

We are grateful to Haiyan Pei (Shandong Provincial Engineering Center on Environmental Science and Technology) for providing the cultures of Chlorella sp. and S. obliquus.

Conflicts of Interest

The authors declare no conflict of interest.

References

  1. Moreira, D.; Pires, J.C.M. Atmospheric CO2 capture by algae: Negative carbon dioxide emission path. Bioresour. Technol. 2016, 215, 371–379. [Google Scholar] [CrossRef]
  2. Brilman, W.; Alba, L.G.; Veneman, R. Capturing atmospheric CO2 using supported amine sorbents for microalgae cultivation. Biomass Bioenergy 2013, 53, 39–47. [Google Scholar] [CrossRef]
  3. Chew, K.W.; Chia, S.R.; Show, P.L.; Yap, Y.J.; Ling, T.C.; Chang, J.-S. Effects of water culture medium, cultivation systems and growth modes for microalgae cultivation: A review. J. Taiwan Inst. Chem. Eng. 2018, 91, 332–344. [Google Scholar] [CrossRef]
  4. Du, Z.; Hu, B.; Ma, X.; Cheng, Y.; Liu, Y.; Lin, X.; Wan, Y.; Lei, H.; Chen, P.; Ruan, R. Catalytic pyrolysis of microalgae and their three major components: Carbohydrates, proteins, and lipids. Bioresour. Technol. 2013, 130, 777–782. [Google Scholar] [CrossRef] [PubMed]
  5. Tourlouki, K.; Tsavatopoulou, V.; Alexandropoulos, D.; Manariotis, I.D.; Mazzucato, S. A novel microalgae harvesting method using laser micromachined glass fiber reinforced polymers. Photonics 2020, 7, 42. [Google Scholar] [CrossRef]
  6. Legrand, J.; Artu, A.; Pruvost, J. A review on photobioreactor design and modelling for microalgae production. React. Chem. Eng. 2021, 6, 1134–1151. [Google Scholar] [CrossRef]
  7. Krichnavaruk, S.; Powtongsook, S.; Pavasant, P. Enhanced productivity of Chaetoceros calcitrans in airlift photobioreactors. Bioresour. Technol. 2007, 98, 2123–2130. [Google Scholar] [CrossRef]
  8. Benemann, J.R. Hydrogen production by microalgae. J. Appl. Phycol. 2000, 12, 291–300. [Google Scholar] [CrossRef]
  9. Cheng, J.; Song, Y.; Guo, W.; Miao, Y.; Chen, S.; Zhou, J. Developing microporous fibrous-diaphragm aerator to decrease bubble generation diameter for improving microalgal growth with CO2 fixation in a raceway pond. Bioresour. Technol. 2019, 276, 28–34. [Google Scholar] [CrossRef]
  10. Le Gouic, B.; Marec, H.; Pruvost, J.; Cornet, J.F. Investigation of growth limitation by CO2 mass transfer and inorganic carbon source for the microalga Chlorella vulgaris in a dedicated photobioreactor. Chem. Eng. Sci. 2021, 233, 116388. [Google Scholar] [CrossRef]
  11. Guo, W.B.; Cheng, J.; Liu, S.Z.; Feng, L.C.; Su, Y.N.; Li, Y.G. A novel porous nickel-foam filled CO2 absorptive photobioreactor system to promote CO2 conversion by microalgal biomass. Sci. Total Environ. 2020, 713, 136593. [Google Scholar] [CrossRef] [PubMed]
  12. Pruvost, J.; Legrand, J.; Legentilhomme, P.; Muller-Feuga, A. Simulation of microalgae growth in limiting light conditions: Flow effect. AICHE J. 2002, 48, 1109–1120. [Google Scholar] [CrossRef] [Green Version]
  13. Fernandez, F.G.A.; Camacho, F.G.; Perez, J.A.S.; Sevilla, J.M.F.; Grima, E.M. A model for light distribution and average solar irradiance inside outdoor tubular photobioreactors for the microalgal mass culture. Biotechnol. Bioeng. 1997, 55, 701–714. [Google Scholar] [CrossRef]
  14. Cornet, J.F.; Dussap, C.G.; Dubertret, G. A structured model for simulation of cultures of the cyanobacterium Spirulina platensis in photobioreactors: I. Coupling between light transfer and growth kinetics. Biotechnol. Bioeng. 1992, 40, 817–825. [Google Scholar] [CrossRef] [PubMed]
  15. Cornet, J.F.; Dussap, C.G.; Gros, J.B.; Binois, C.; Lasseur, C. A simplified monodimensional approach for modeling coupling between radiant light transfer and growth kinetics in photobioreactors. Chem. Eng. Sci. 1995, 50, 1489–1500. [Google Scholar] [CrossRef]
  16. Pruvost, J.; Cornet, J.F.; Goetz, V.; Legrand, J. Modeling dynamic functioning of rectangular photobioreactors in solar conditions. AICHE J. 2011, 57, 1947–1960. [Google Scholar] [CrossRef]
  17. Huang, Q.; Liu, T.; Yang, J.; Yao, L.; Gao, L. Evaluation of radiative transfer using the finite volume method in cylindrical photoreactors. Chem. Eng. Sci. 2011, 66, 3930–3940. [Google Scholar] [CrossRef]
  18. Lee, E.; Pruvost, J.; He, X.; Munipalli, R.; Pilon, L. Design tool and guidelines for outdoor photobioreactors. Chem. Eng. Sci. 2014, 106, 18–29. [Google Scholar] [CrossRef] [Green Version]
  19. Kandilian, R.; Pruvost, J.; Artu, A.; Lemasson, C.; Legrand, J.; Pilon, L. Comparison of experimentally and theoretically determined radiation characteristics of photosynthetic microorganisms. J. Quant. Spectros. Radiat. Transfer 2016, 175, 30–45. [Google Scholar] [CrossRef] [Green Version]
  20. Ohi, N.; Ishiwata, Y.; Taguchi, S. Diel patterns in light absorption and absorption efficiency factors of Isochrysis galbana (Prymnesiophyceae). J. Phycol. 2002, 38, 730–737. [Google Scholar] [CrossRef]
  21. DuRand, M.D.; Green, R.E.; Sosik, H.M.; Olson, R.J. Diel variations in optical properties of Micromonas pusilla (Prasinophyceae). J. Phycol. 2002, 38, 1132–1142. [Google Scholar] [CrossRef] [Green Version]
  22. Heng, R.-L.; Pilon, L. Time-dependent radiation characteristics of Nannochloropsis oculata during batch culture. J. Quant. Spectros. Radiat. Transfer 2014, 144, 154–163. [Google Scholar] [CrossRef]
  23. Heng, R.-L.; Lee, E.; Pilon, L. Radiation characteristics and optical properties of filamentous cyanobacterium Anabaena cylindrica. J. Opt. Soc. Am. A 2014, 31, 836–845. [Google Scholar] [CrossRef] [PubMed]
  24. Zhao, J.M.; Ma, C.Y.; Liu, L.H. Temporal scaling of the growth dependent optical properties of microalgae. J. Quant. Spectros. Radiat. Transfer. 2018, 214, 61–70. [Google Scholar] [CrossRef] [Green Version]
  25. Ma, C.Y.; Zhao, J.M.; Liu, L.H.; Zhang, L. Growth-dependent radiative properties of Chlorella vulgaris and its influence on prediction of light fluence rate in photobioreactor. J. Appl. Phycol. 2019, 31, 235–247. [Google Scholar] [CrossRef]
  26. Araujo, S.D.; Garcia, V.M.T. Growth and biochemical composition of the diatom Chaetoceros cf. wighamii brightwell under different temperature, salinity and carbon dioxide levels. I. Protein, carbohydrates and lipids. Aquaculture 2005, 246, 405–412. [Google Scholar] [CrossRef]
  27. Chiu, S.-Y.; Kao, C.-Y.; Chen, C.-H.; Kuan, T.-C.; Ong, S.-C.; Lin, C.-S. Reduction of CO2 by a high-density culture of Chlorella sp. in a semicontinuous photobioreactor. Bioresour. Technol. 2008, 99, 3389–3396. [Google Scholar] [CrossRef]
  28. Chiu, S.-Y.; Kao, C.-Y.; Tsai, M.-T.; Ong, S.-C.; Chen, C.-H.; Lin, C.-S. Lipid accumulation and CO2 utilization of Nannochloropsis oculata in response to CO2 aeration. Bioresour. Technol. 2009, 100, 833–838. [Google Scholar] [CrossRef]
  29. Cheng, J.; Liu, S.; Guo, W.; Song, Y.; Kumar, S.; Kubar, A.A.; Su, Y.; Li, Y. Developing staggered woven mesh aerator with three variable-micropore layers in recycling water pipeline to enhance CO2 conversion for improving Arthrospira growth. Sci. Total Environ. 2021, 760, 143941. [Google Scholar] [CrossRef]
  30. Cheng, J.; Miao, Y.; Guo, W.; Song, Y.; Tian, J.; Zhou, J. Reduced generation time and size of carbon dioxide bubbles in a volute aerator for improving Spirulina sp. growth. Bioresour. Technol. 2018, 270, 352–358. [Google Scholar] [CrossRef]
  31. Huang, Y.; Zhao, S.; Ding, Y.-d.; Liao, Q.; Huang, Y.; Zhu, X. Optimizing the gas distributor based on CO2 bubble dynamic behaviors to improve microalgal biomass production in an air-lift photo-bioreactor. Bioresour. Technol. 2017, 233, 84–91. [Google Scholar] [CrossRef] [PubMed] [Green Version]
  32. Berberoglu, H.; Yin, J.; Pilon, L. Light transfer in bubble sparged photobioreactors for H2 production and CO2 mitigation. Int. J. Hydrog. Energy 2007, 32, 2273–2285. [Google Scholar] [CrossRef] [Green Version]
  33. Berberoglu, H.; Pilon, L.; Melis, A. Radiation characteristics of Chlamydomonas reinhardtii CC125 and its truncated chlorophyll antenna transformants tla1, tlaX and tla1-CW+. Int. J. Hydrog. Energy 2008, 33, 6467–6483. [Google Scholar] [CrossRef]
  34. Berberoglu, H.; Gomez, P.S.; Pilon, L. Radiation characteristics of Botryococcus braunii, Chlorococcum littorale, and Chlorella sp. used for CO2 fixation and biofuel production. J. Quant. Spectros. Radiat. Transfer 2009, 110, 1879–1893. [Google Scholar] [CrossRef]
  35. Wheaton, Z.C.; Krishnamoorthy, G. Modeling radiative transfer in photobioreactors for algal growth. Comput. Electron. Agric. 2012, 87, 64–73. [Google Scholar] [CrossRef]
  36. McHardy, C.; Luzi, G.; Lindenberger, C.; Agudo, J.R.; Delgado, A.; Rauh, C. Numerical analysis of the effects of air on light distribution in a bubble column photobioreactor. Algal Res. 2018, 31, 311–325. [Google Scholar] [CrossRef]
  37. Luzi, G.; McHardy, C.; Lindenberger, C.; Rauh, C.; Delgado, A. Comparison between different strategies for the realization of flashing-light effects—Pneumatic mixing and flashing illumination. Algal Res. 2019, 38, 101404. [Google Scholar] [CrossRef]
  38. Watanabe, K.; Imase, M.; Sasaki, K.; Ohmura, N.; Saiki, H.; Tanaka, H. Composition of the sheath produced by the green alga Chlorella sorokiniana. Lett. Appl. Microbiol. 2006, 42, 538–543. [Google Scholar] [CrossRef]
  39. Yoo, C.; Jun, S.Y.; Lee, J.Y.; Ahn, C.Y.; Oh, H.M. Selection of microalgae for lipid production under high levels carbon dioxide. Bioresour. Technol. 2010, 101, S71–S74. [Google Scholar] [CrossRef]
  40. Ansari, F.A.; Shriwastav, A.; Gupta, S.K.; Rawat, I.; Bux, F. Exploration of Microalgae Biorefinery by Optimizing Sequential Extraction of Major Metabolites from Scenedesmus obliquus. Ind. Eng. Chem. Res. 2017, 56, 3407–3412. [Google Scholar] [CrossRef]
  41. Rippka, R.; Deruelles, J.; Waterbury, J.B.; Herdman, M.; Stanier, R.Y. Generic assignments, strain histories and properties of pure cultures of cyanobacteria. J. Gen. Microbiol. 1979, 111, 1–61. [Google Scholar] [CrossRef] [Green Version]
  42. Li, X.C.; Zhao, J.M.; Wang, C.C.; Liu, L.H. Improved transmission method for measuring the optical extinction coefficient of micro/nano particle suspensions. Appl. Opt. 2016, 55, 8171–8179. [Google Scholar] [CrossRef] [PubMed] [Green Version]
  43. Li, X.; Wang, C.; Zhao, J.; Liu, L. A new method for determining the optical constants of highly transparent solids. Appl. Spectrosc. 2017, 71, 70–77. [Google Scholar] [CrossRef] [PubMed]
  44. Li, X.; Liu, L.; Zhao, J.; Tan, J. Optical properties of sodium chloride solution within the spectral range from 300 to 2500 nm at room temperature. Appl. Spectrosc. 2015, 69, 635–640. [Google Scholar] [CrossRef] [PubMed]
  45. Hale, G.M.; Querry, M.R. Optical constants of water in the 200-nm to 200-μm wavelength region. Appl. Opt. 1973, 12, 555–563. [Google Scholar] [CrossRef] [Green Version]
  46. Palik, E.D. Handbook of Optical Constants of Solids; Academic Press: San Diego, CA, USA, 1985. [Google Scholar]
  47. Modest, M.F. Radiative Heat Transfer, 3rd ed.; Academic Press: New York, NY, USA, 2013. [Google Scholar]
  48. Raithby, G.D.; Chui, E.H. A finite-volume method for predicting a radiant-heat transfer in enclosures with participating media. J. Heat Transf. -Trans. Asme 1990, 112, 415–423. [Google Scholar] [CrossRef]
  49. Chai, J.C. One-dimensional transient radiation heat transfer modeling using a finite-volume method. Numer. HeatTransf. Part B Fundam. 2003, 44, 187–208. [Google Scholar] [CrossRef]
  50. Henyey, L.G.; Greenstein, J.L. Diffuse radiation in the galaxy. Astrophys. J. 1941, 93, 70–83. [Google Scholar] [CrossRef]
  51. De Morais, M.G.; Costa, J.A.V. Biofixation of carbon dioxide by Spirulina sp. and Scenedesmus obliquus cultivated in a three-stage serial tubular photobioreactor. J. Biotechnol. 2007, 129, 439–445. [Google Scholar] [CrossRef]
  52. Cheng, L.; Zhang, L.; Chen, H.; Gao, C. Carbon dioxide removal from air by microalgae cultured in a membrane-photobioreactor. Sep. Purif. Technol. 2006, 50, 324–329. [Google Scholar] [CrossRef]
  53. Tang, D.; Han, W.; Li, P.; Miao, X.; Zhong, J. CO2 biofixation and fatty acid composition of Scenedesmus obliquus and Chlorella pyrenoidosa in response to different CO2 levels. Bioresour. Technol. 2011, 102, 3071–3076. [Google Scholar] [CrossRef] [PubMed]
  54. Pilon, L.; Berberoglu, H.; Kandilian, R. Radiation transfer in photobiological carbon dioxide fixation and fuel production by microalgae. J. Quant. Spectros. Radiat. Transfer 2011, 112, 2639–2660. [Google Scholar] [CrossRef]
  55. Ma, C.Y.; Zhao, J.M.; Liu, L.H.; Zhang, L. The growth dependent radiative properties of microalgae and light field distribution within photobioreactors. In Proceedings of the Progress in Electromagnetics Research Symposium-Fall (PIERS-FALL), Singapore, 19–22 November 2017. [Google Scholar]
  56. Pilon, L.; Kandilian, R. Interaction between light and photosynthetic microorganisms. In Advances in Chemical Engineering; Legrand, J., Ed.; Elsevier: Amsterdam, The Netherlands, 2016; Volume 48, pp. 107–149. [Google Scholar]
  57. Kandilian, R.; Lee, E.; Pilon, L. Radiation and optical properties of Nannochloropsis oculata grown under different irradiances and spectra. Bioresour. Technol. 2013, 137, 63–73. [Google Scholar] [CrossRef] [PubMed]
  58. Pico-Marco, E.; Navarro, J.L.; Bruno-Barcena, J.M. A closed loop exponential feeding law: Invariance and global stability analysis. J. Process Control 2006, 16, 395–402. [Google Scholar] [CrossRef]
  59. Pandey, S.S.; Kumar, D.; Tiwari, B.S. Chloroplast metabolic engineering for sustainable agriculture. In Current Developments in Biotechnology and Bioengineering: Crop Modification, Nutrition, and Food Production; Dubey, S.K., Pandey, A., Sangwan, R.S., Eds.; Elsevier: Amsterdam, The Netherlands, 2017; pp. 149–162. [Google Scholar]
  60. Stenzel, O. The Physics of Thin Film Optical Spectra; Springer: Berlin/Heidelberg, Germany, 2016. [Google Scholar]
  61. Zhang, Z.M. Nano/Microscale Heat Transfer; McGraw-Hill: New York, NY, USA, 2007. [Google Scholar]
  62. Gershun, A. Fresnel reflection of diffusely incident light. J. Opt. Soc. Am. 1945, 35, 162–163. [Google Scholar] [CrossRef]
  63. Zhang, X.; Qiu, J.; Li, X.; Zhao, J.; Liu, L. Complex refractive indices measurements of polymers in visible and near-infrared bands. Appl. Opt. 2020, 59, 2337–2344. [Google Scholar] [CrossRef]
  64. Sorokin, C.; Krauss, R.W. The effects of light intensity on the growth rates of green algae. Plant Physiol. 1958, 33, 109–113. [Google Scholar] [CrossRef]
  65. Bohren, C.F.; Huffman, D.R. Absorption and Scattering of Light by Small Particles; Wiley: New York, NY, USA, 1998. [Google Scholar]
Figure 1. The picture and schematic diagram of the airlift flat panel PBR. (The culture temperature is controlled by heat exchange with circulating water).
Photonics 09 00864 g001
Figure 2. Schematic of the PBR system.
Photonics 09 00864 g002
Figure 3. Cell number density and mass concentrations of (a) Chlorella sp. and (b) S. obliquus with different cultivation times.
Photonics 09 00864 g003
Figure 4. Micrographs of (a) Chlorella sp. and (b) S. obliquus. Projected area equivalent cell size distribution of (c) diameter of Chlorella sp., (d) major axis and (e) minor axis of S. obliquus.
Photonics 09 00864 g004
Figure 5. (a) The transmitted light intensity of the PBR of Chlorella sp. with different cultivation times. (b) The transmitted light intensity of the PBR with and without aeration every day.
Photonics 09 00864 g005
Figure 6. The differences in CO2 concentration between the inlet and outlet gas (ΔCCO2) during the cultivation of (a) Chlorella sp. and (b) S. obliquus.
Photonics 09 00864 g006
Figure 7. (a,b) Normal-normal and (c,d) normal-hemispherical spectral transmittance of the cuvette containing Chlorella sp. culture and S. obliquus culture, respectively.
Photonics 09 00864 g007
Figure 8. Time-dependent radiation characteristics in the spectral range from 400 to 1100 nm. (a,c) Absorption cross-sections and (b,d) scattering cross-sections of Chlorella sp. and S. obliquus, respectively.
Photonics 09 00864 g008
Figure 9. Measured and H–G scattering phase functions of (a) Chlorella sp. (gXa = 0.98) and (b) S. obliquus (gXa = 0.9847).
Photonics 09 00864 g009
Figure 10. Normalized local irradiance G(x)/Gin as a function of the distance x from the illuminated culture surface for (a) Chlorella sp. and (b) S. obliquus. Open symbols corresponding to time-dependent radiation characteristics, and solid lines corresponding to stationary radiation characteristics (average of last 3 days).
Photonics 09 00864 g010
Figure 11. Normalized local irradiance G(x)/Gin as a function of the distance x from the illuminated culture surface of (a,b) Chlorella sp. and (c,d) S. obliquus for different microalgae concentrations Xa and bubble volume fractions fb from 0 to 0.3 (bubble radius = 3.5 mm).
Photonics 09 00864 g011
Figure 12. Normalized local irradiance G(x)/Gin as a function of the distance x from the illuminated culture surface of (a,b) Chlorella sp. and (c,d) S. obliquus for different microalgae concentrations Xa and for bubble radii a from 3.5 μm to 3.5 mm (fb = 0.003).
Photonics 09 00864 g012
Table 1. Summary of the average single scattering albedo and percent increase in the total irradiance relative to the effective incident irradiance at the illuminated culture surface of Chlorella sp. and S. obliquus for bubble volume fractions from 0 to 0.3.
ωeff[G(0) − Gin]/Gin, %
fb = 0fb = 0.003fb = 0.03fb = 0.3fb = 0fb = 0.003fb = 0.03fb = 0.3
Chlorella sp. (Xa = 0.0216 kg/m3)0.7450.7510.7930.93018.618.921.242.2
Chlorella sp. (Xa = 0.2081 kg/m3)0.8790.8790.8810.89630.530.631.338.7
S. obliquus (Xa = 0.0211 kg/m3)0.8350.8360.8480.91718.418.620.236.5
S. obliquus (Xa = 0.2222 kg/m3)0.8790.8790.8810.89930.530.631.440.2
Table 2. Summary of the average single scattering albedo and percent increase in the total irradiance relative to effective incident irradiance at the illuminated culture surface of Chlorella sp. and S. obliquus for bubble radii from 3.5 μm to 3.5 mm.
ωeff[G(0) − Gin]/Gin, %
a = 3.5 mma = 350 μma = 35
μm
a = 3.5
μm
a = 3.5 mma = 350 μma = 35
μm
a = 3.5 μm
Chlorella sp. (Xa = 0.0216 kg/m3)0.7510.7900.9190.98918.921.138.0108.5
Chlorella sp. (Xa = 0.2081 kg/m3)0.8790.8800.8940.95030.631.035.062.9
S. obliquus (Xa = 0.0211 kg/m3)0.8360.8470.9090.98218.620.032.290.9
S. obliquus (Xa = 0.2222 kg/m3)0.8790.8810.8960.95530.631.135.866.9
Table 3. Average specific growth rate (d−1) different bubble volume fraction and radius.
fb = 0.003fb = 0.03fb = 0.3
a = 3.5 mma = 350 μma = 35 μma = 3.5 μma = 3.5 mma = 350 μma = 35 μma = 3.5 μma = 3.5 mma = 350 μma = 35 μma = 3.5 μm
Chlorella sp. (Xa = 0.0216 kg/m3)1.64921.64681.61071.22961.65071.61391.22840.53221.66141.27140.54800.2325
Chlorella sp. (Xa = 0.2081 kg/m3)0.64120.63860.61440.47290.64570.62080.47600.23070.70100.53020.25220.1207
S. obliquus (Xa = 0.0211 kg/m3)0.59780.59780.58720.44830.60130.59050.44900.20560.63490.47890.21630.0905
S. obliquus (Xa = 0.2222 kg/m3)0.18410.18370.17930.15040.18580.18130.15160.08500.20570.16960.09290.0441
Publisher’s Note: MDPI stays neutral with regard to jurisdictional claims in published maps and institutional affiliations.

