1. Introduction
Worldwide, the number of people being affected by respiratory diseases continues to establish new records, representing one of the leading causes of death and impairments [
1]. This problem is associated with the deterioration of air quality, due to exposure to pollution, secondhand tobacco smoke, and chemical fumes. Chronic obstructive pulmonary disease (COPD) is one of the most commonly diagnosed lung diseases, severely affecting about 65 million people and killing 3 million individuals each year, being the third leading cause of death worldwide [
1,
2]. Besides COPD, asthma affects more than 334 million people and is diagnosed in 14% of children, creating a predisposition to permanent pulmonary impairments and COPD. Despite asthma and COPD being the most common, there are several other lung-related diseases that impact and restrain the quality of life of countless people [
1,
3].
To break the upward trend of aggravations caused by respiratory diseases and improve the quality of life of patients, a timely diagnosis and control of the disorder evolution over time are required. To achieve such a goal, suitable and cost-effective tools are essential to provide accurate measurements of the pulmonary capacity. Among the clinical methods to evaluate lung function, the most common is spirometry, which measures the volume and flow of the inhaled and exhaled air during forced breathing cycles [
1,
4].
The forced expiratory maneuver, characteristic of spirometry, consists of a deep inhalation before a hard and fast exhaling, according to the standardization established by the American Thoracic Society (ATS) and the European Respiratory Society (ERS) [
4]. The outcome parameters of spirometric tests are based on the flow–volume and volume–time curves. From these curves, several pulmonary function values can be determined, for instance: the peak expiratory flow (PEF), which is the maximal air flow rate achieved; the forced vital capacity (FVC), which represents the amount of air volume exhaled; the forced expiratory volume in 1 s (FEV1), which corresponds to the maximal air volume in the first second of the maneuver; and the ratio of FEV1/FVC, which is used as an airway function index [
4,
5].
According to the underlying working principles, the spirometers can be categorized as bellows, pistons, water bells, turbinometers, anemometers, ultrasonic and pneumotachometers, with the latter being the most common one [
4,
5]. Recently, some authors envisioned the incorporation of wireless data transmission devices with compact affordable spirometers, such as a Lilly pneumotachometer [
6] and a platinum anemometer [
7], providing a remote access to results through web and smartphone apps. Nevertheless, like other electronic-based devices, these systems present inherent limitations regarding environmental factors and electromagnetic interferences, which could damage the equipment and cause misleading results.
Optical fiber-based sensors appear as an alternative capable of overcome such limitations by offering immunity to electromagnetic interferences and electrical isolation, along with low signal attenuation, high accuracy, and possibility of remote sensing [
8]. So far, there are reports of solutions based on the modulation of the fiber Bragg gratings (FBG) response due to the thermal variations associated with the breathing cycles [
9,
10], the bending losses, or vibrations induced by the air flow that impact on the optical signal intensity [
11,
12], cantilever mechanisms that apply strain proportional to the air flow onto FBG-based sensors [
13,
14], among others. An FBG 3D printed system was recently explored by the research team of this paper, also for the spirometry application [
15]. In this case it was proposed as a sensor based on two FBGs, to assess the pulmonary function, while providing the thermal effect compensation associated with breathing (hot air in exhalations and cold air in inhalations).
Regarding the use of Fabry–Perot interferometers (FPI), Zhao et al. proposed a device for air flow measurements, where a FPI was produced by splicing a single mode fiber (SMF) to a hollow-core fiber (HCF) at the end of an optical fiber. By conducting the air flow into this fiber end, the FPI cavity length is compressed, and consequently, its spectral response modulated [
16]. Nevertheless, this highly sensitive device is only able to monitor stationary air flows, and no dynamic monitoring results, essential for spirometry tests, are presented. Another reported system comprises a FPI micro-cavity produced by attaching a polymer to the end of a SMF. In this case, the polymer volume is dependent on the temperature and, therefore, after its initial heating, the hot polymer is cooled down by the air flow, which changes the FPI cavity length and modulates its spectrum [
17].
Furthermore, a solution based on the modulation of the FPI cavity length through the use of the air flow to cool down a heated system was reported in [
18]. Another FPI-based technique for flow sensing comprises a multiple cantilever system where their bending modulates the distance between an optical mirror and the fiber end [
19]. However, the reported FPI-based solution is not conceived for human breath dynamic flow sensing, requiring a dynamic acquisition upgrade to act as spirometers.
On similar applications, the authors Xu et al. have presented an FPI-diaphragm-based sensor for pressure and acoustic wave sensing, attaining measurement ranges from 5 to 10,000 psi, with a frequency response up to 2 MHz [
20]. The multifaceted prospective of FPI sensors render them suitable for a wide range of applications, from the highly sensitive to strain [
21], to large-range liquid level monitoring [
22].
This paper presents an in-line FPI-based sensor encased in a 3D printed system, designed to evaluate the respiratory condition of individuals and act as an optical spirometer. Since this system is based on the optical fiber technology, all its inherent advantages are included in the proposed sensing solution. Compared with the device presented in [
15], the main advantages of the presented FPI-based system are the use of a single optical fiber (and sensor) due to its low sensitivity to temperature, the improved design to maximize the response to strain, and the cost-effective methodology used for the FPI production in relation to the Bragg network recording system. To the best of our knowledge, this is the first time that an inline FPI optical fiber-based sensor is proposed for spirometer applications. Although other solutions have been previously developed for flow monitoring (air or liquids), as detailed above, they are static sensors, while we present a solution which has a good performance for dynamic measures, as is required in spirometry.
The rest of the manuscript is structured as follows: The FPI production, strain characterization, and the spirometer assembly are presented in
Section 2. In
Section 3, we present the sensing mechanisms and theoretical analysis.
Section 4 is dedicated to the testing protocol and the obtained results, and
Section 5 provides the conclusion.
2. FPI-Based Spirometer
FPI-based sensors have gained popularity in terms of sensing technology due to their efficiency and accuracy, as well as their versatility and responsiveness [
23]. An FPI includes two reflective surfaces forming a resonant micro-cavity. Within the cavity, the optical signal suffers multiple reflections, and the subsequent interaction between the reflected and the incident signals produces an interference pattern. Its intensity profile, I, is given by the optical signal intensities reflected in each reflective surface (I
1 and I
2) and the optical phase difference between two adjacent signals (Φ), according to:
The optical phase difference (Φ) is related with the refractive index of the micro-cavity (n), its physical length (L
m), and the optical signal wavelength (λ), which for a normal incidence can be defined as:
Therefore, the FPI interference spectrum can be modulated by a variation in the micro-cavity length or refractive index, which enables the use of FPIs as accurate sensors. For instance, in the case of fiber elongation, a strain is applied to the FPI, causing an increase in the physical length of the cavity, and consequently a wavelength shift in the FPI spectral response. This is the property that will be used in this work, to determine the air flow dynamics associated with spirometry tests.
Furthermore, given that in biomedical applications, the body temperature can significantly affect some sensing systems and produce inaccurate results, a sensing device suitable for temperature compensation in changing environments is required. In spirometry, different breathing cycles are associated with different temperatures, for instance, in inhalations there is cold air, while in exhalations hot air is in contact with the sensor. However, FPI sensors, similar to the one produced for the instrumentation of the proposed spirometer, present very low sensitivity to temperature [
24], which can be negligible if we consider the temperature variation expected during breathing (~5 °C). Therefore, the temperature influence in the spectral response of the proposed FPI cavity can be ignored.
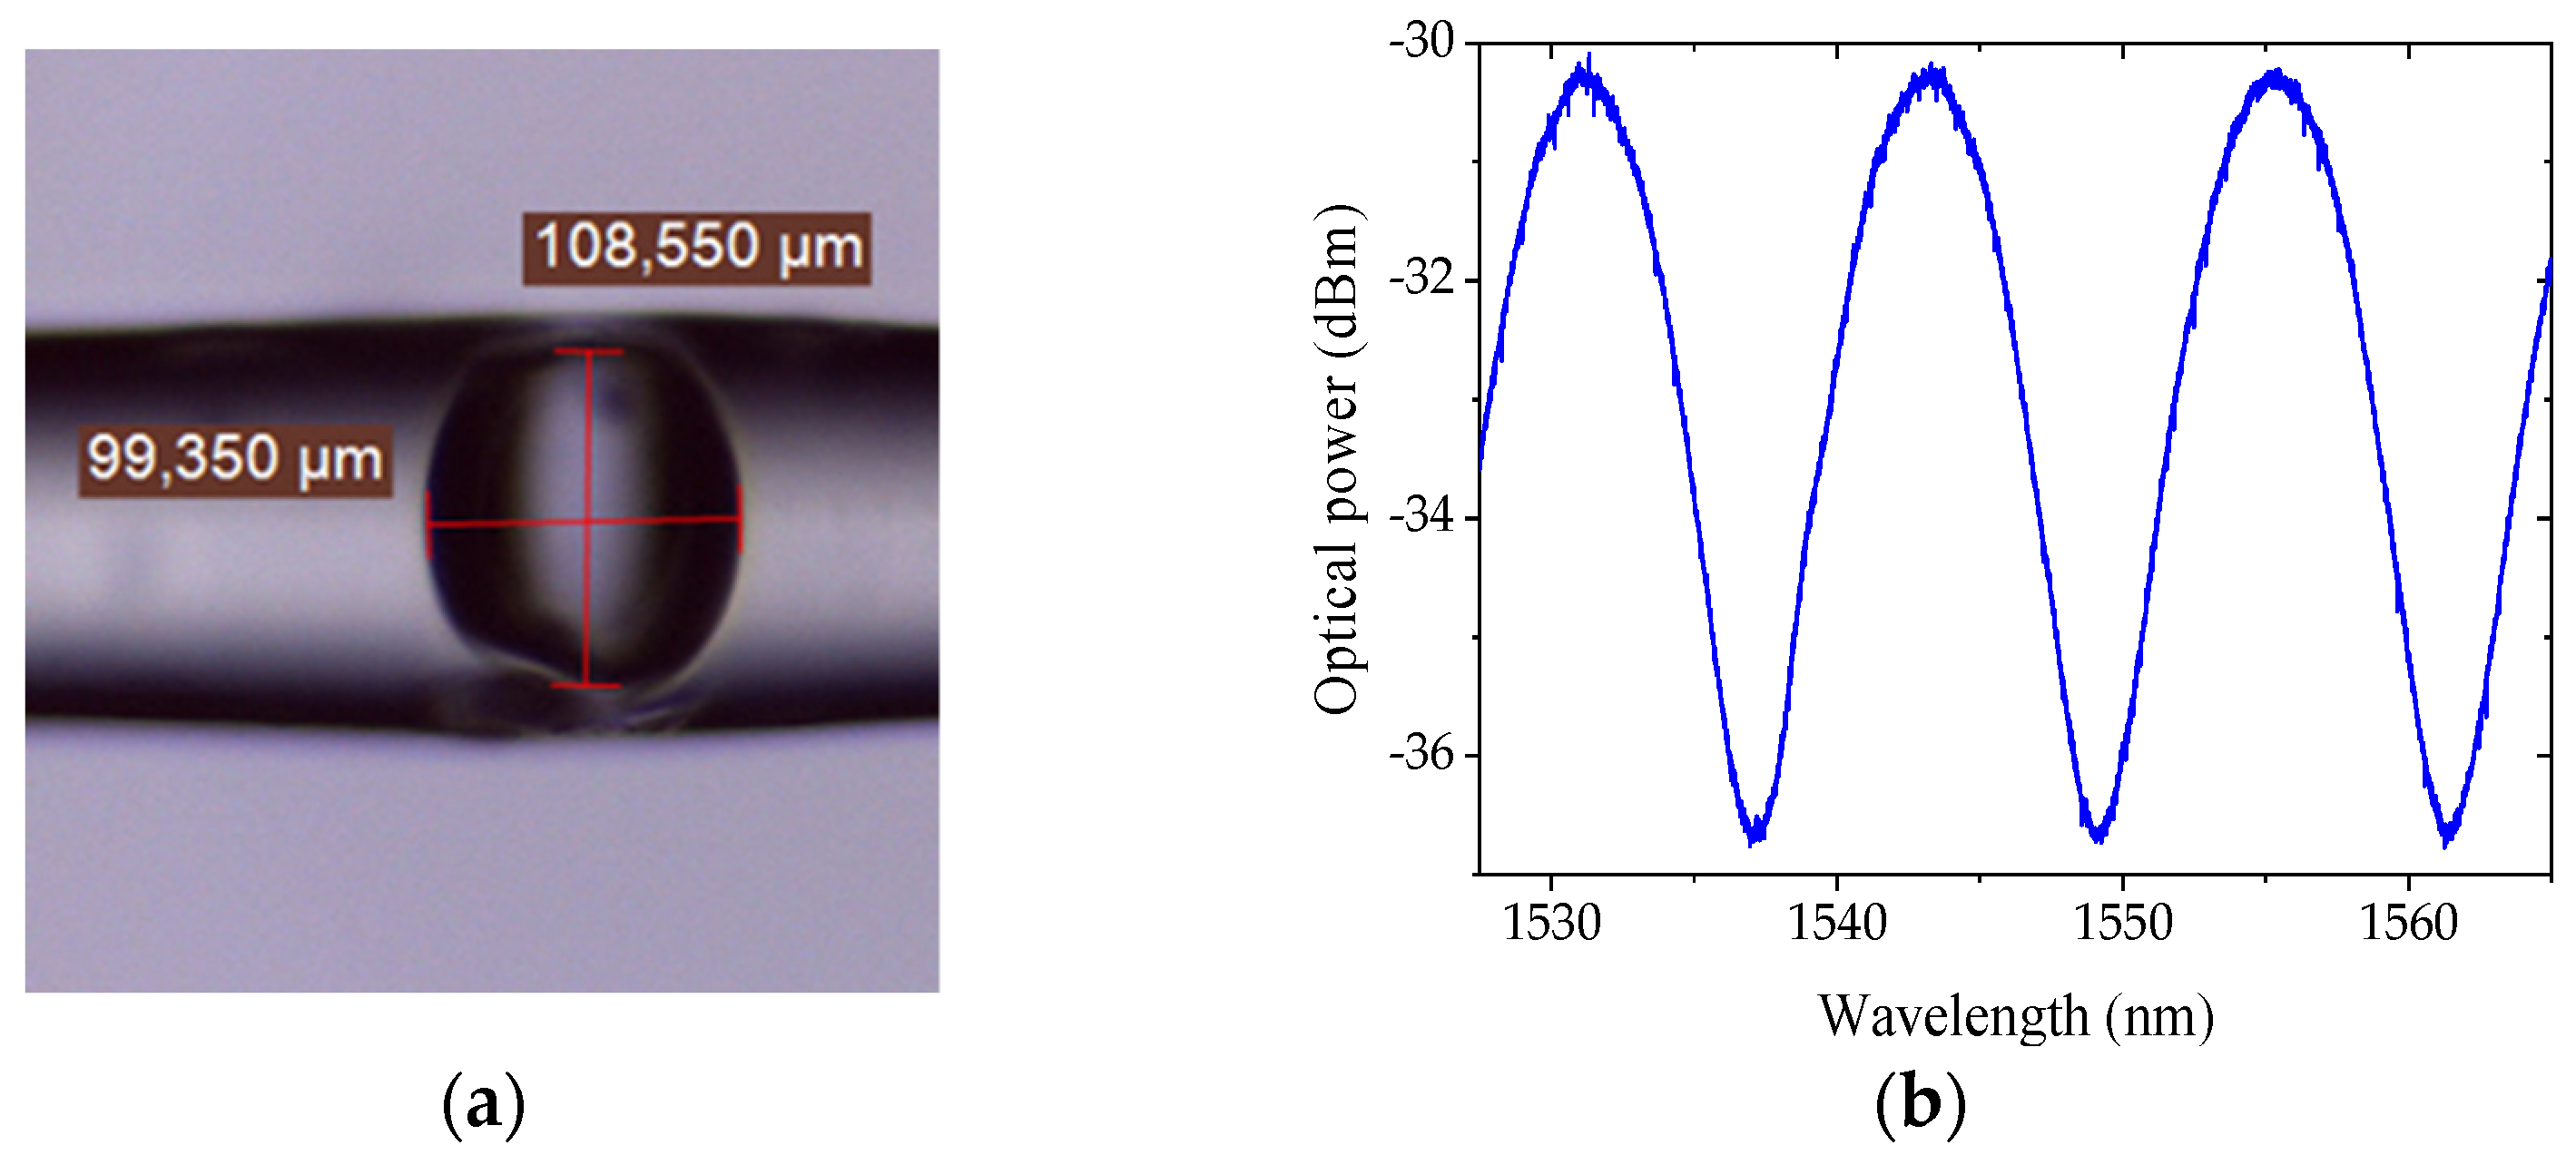
The production of the in-line FPI micro-cavity follows a cost-effective method that was first described in [
24]. This technique comprises the recycling of an optical fiber damaged by the catastrophic fuse effect, as it generates periodically spaced voids in the silica fiber core. By splicing the damaged fiber to a standard single mode fiber (SMF), a larger void emerges from the initial voids in the splicing area. To obtain a single FPI micro-cavity, the resultant fiber (containing the open void) is cleaved and spliced again to a similar SMF [
24]. In
Figure 1a, a microscopic image of the resultant FPI micro-cavity along with the respective dimensions is represented, whereas
Figure 1b depicts the FPI optical spectrum.
2.1. FPI Sensor Strain Characterization
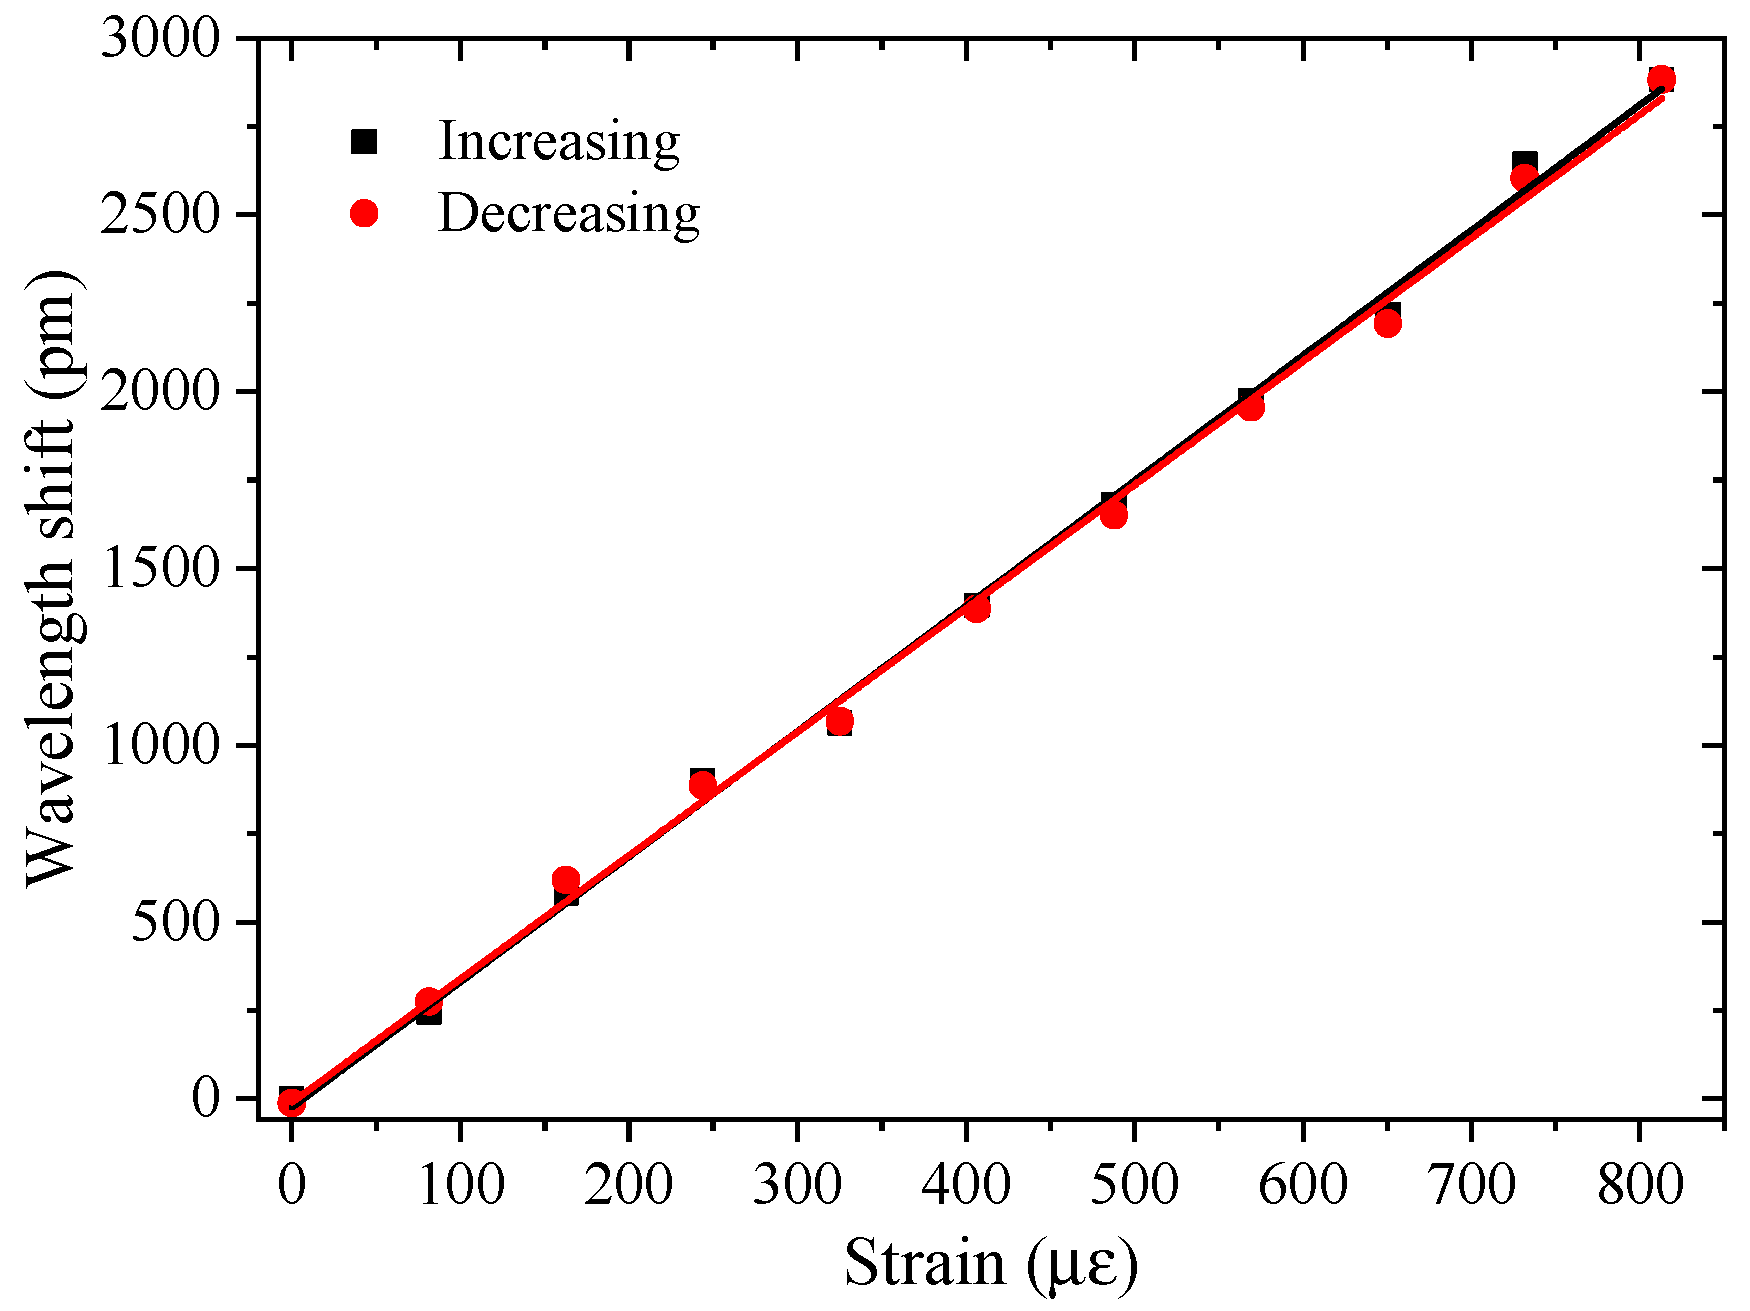
Prior to the implementation of the sensor, the FPI was characterized to strain variations, aiming to determine the relation between the strain applied to the optical fiber, ε, and the induced wavelength shift in the FPI spectrum, Δλ, written as:
where S
l represents the FPI sensitivity to strain variations. This characterization started by attaching each extremity of the fiber containing the FPI sensor to fixed and translation stages, which enables the control of the strain applied to the system. The anchorage points were initially distanced by 24.6 cm, and the applied elongation ranged from 0 to 200 µm, in 20 µm steps. The process was executed for an increasing and decreasing elongation, to evaluate the hysteresis effect on the FPI response. The FPI reflection spectra were monitored using a customized interrogation system based on the I-Mon 512 USB spectrometer (Ibsen Photonics). The experimental data obtained for the described process are represented in
Figure 2, along with the respective linear fits. From this test, considering the average value from the increasing and decreasing elongations, a strain sensitivity, S
l, of 3.51 ± 0.07 pm/µε, and a hysteresis of 0.02 nm were obtained.
The FPI sensitivity value is a key factor to find the relation between the air flow and the wavelength shift modulated at the FPI during the spirometry tests. Other parameters that influence the device feedback are the dimensions of the 3D printed spirometer, which is detailed in the following Sections/sub-Sections.
2.2. Spirometer Sensing Architecture and Implementation
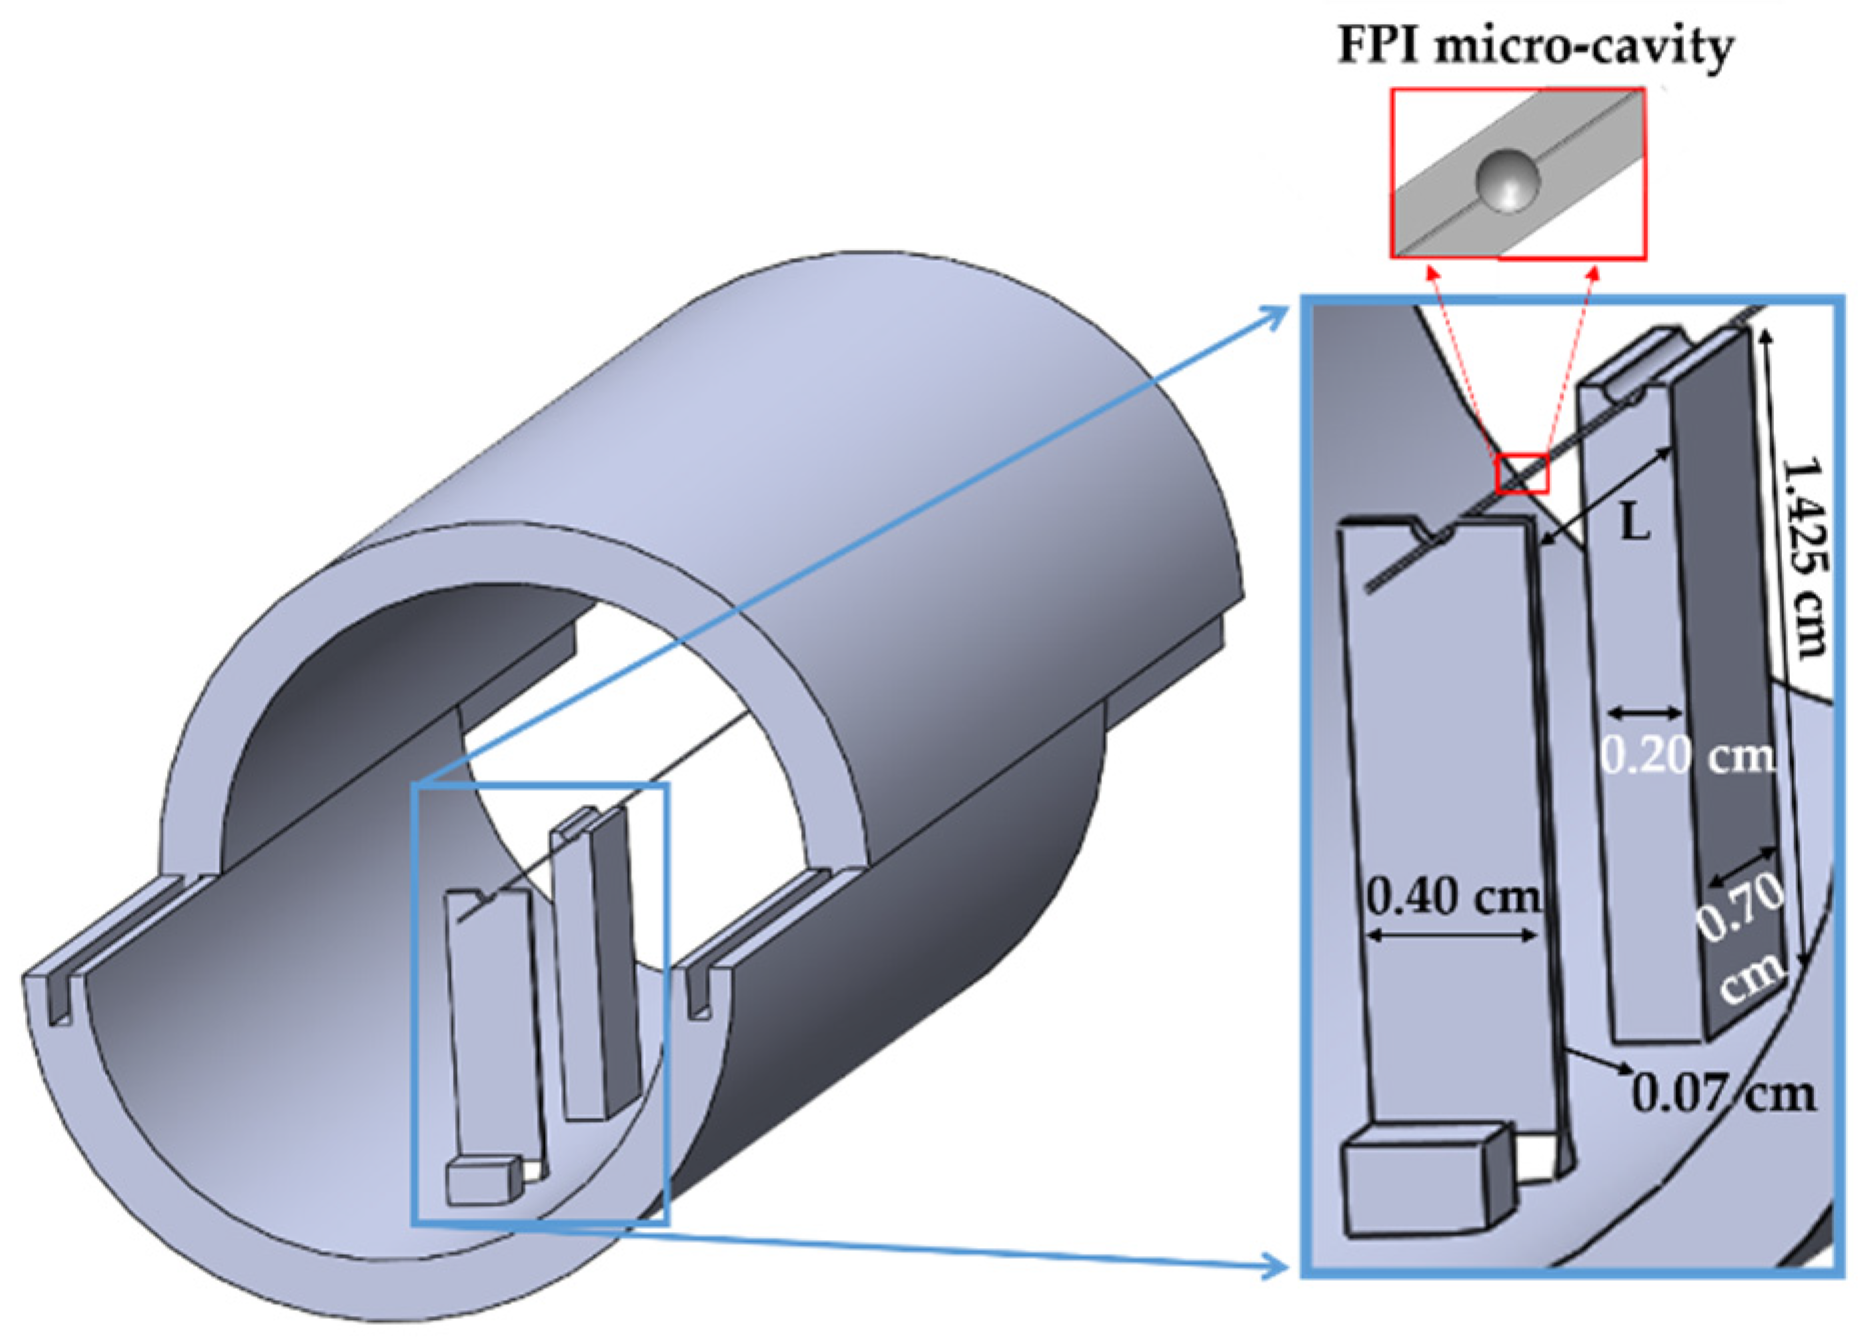
The presented sensing system is build based on a 3D-printed cylinder made of polylactic acid material (PLA), with an inner radius of 1.425 cm, which is the size of a standard bacterial filter mouthpiece [
15]. The PLA cylinder is printed as two separate halves to simplify its assemblage and enable the analysis of the sensing condition at any moment, if necessary. One of the halves is used as a sliding cover, while the other has a set of rods longitudinally spaced by L (with L = 1.620 cm), with the same height as the cylinder radius (1.425 cm). The set of rods have different dimensions, as one is projected to be flexible with a section area of 0.07 × 0.40 cm
2 and the other rod has a large base area of 0.70 × 20 cm
2. The overall structure is illustrated in
Figure 3. With this configuration, when the air flow interacts with the sensing system, it will cause a proportional bending of the flexible rod, while the larger rod remains still.
The bending induced in the flexible rod can be translated in a variation of the distance between the two rods (L). If we consider an optical fiber attached to these rods, such distance variation will induce a strain in the optical fiber, which will modulate the optical signal of the intrinsic FPI sensor, placed midway between the rods. Therefore, the bending (and consequently the distance variations) caused by the air flow can be determined through the monitoring of the wavelength shift of the FPI spectrum.
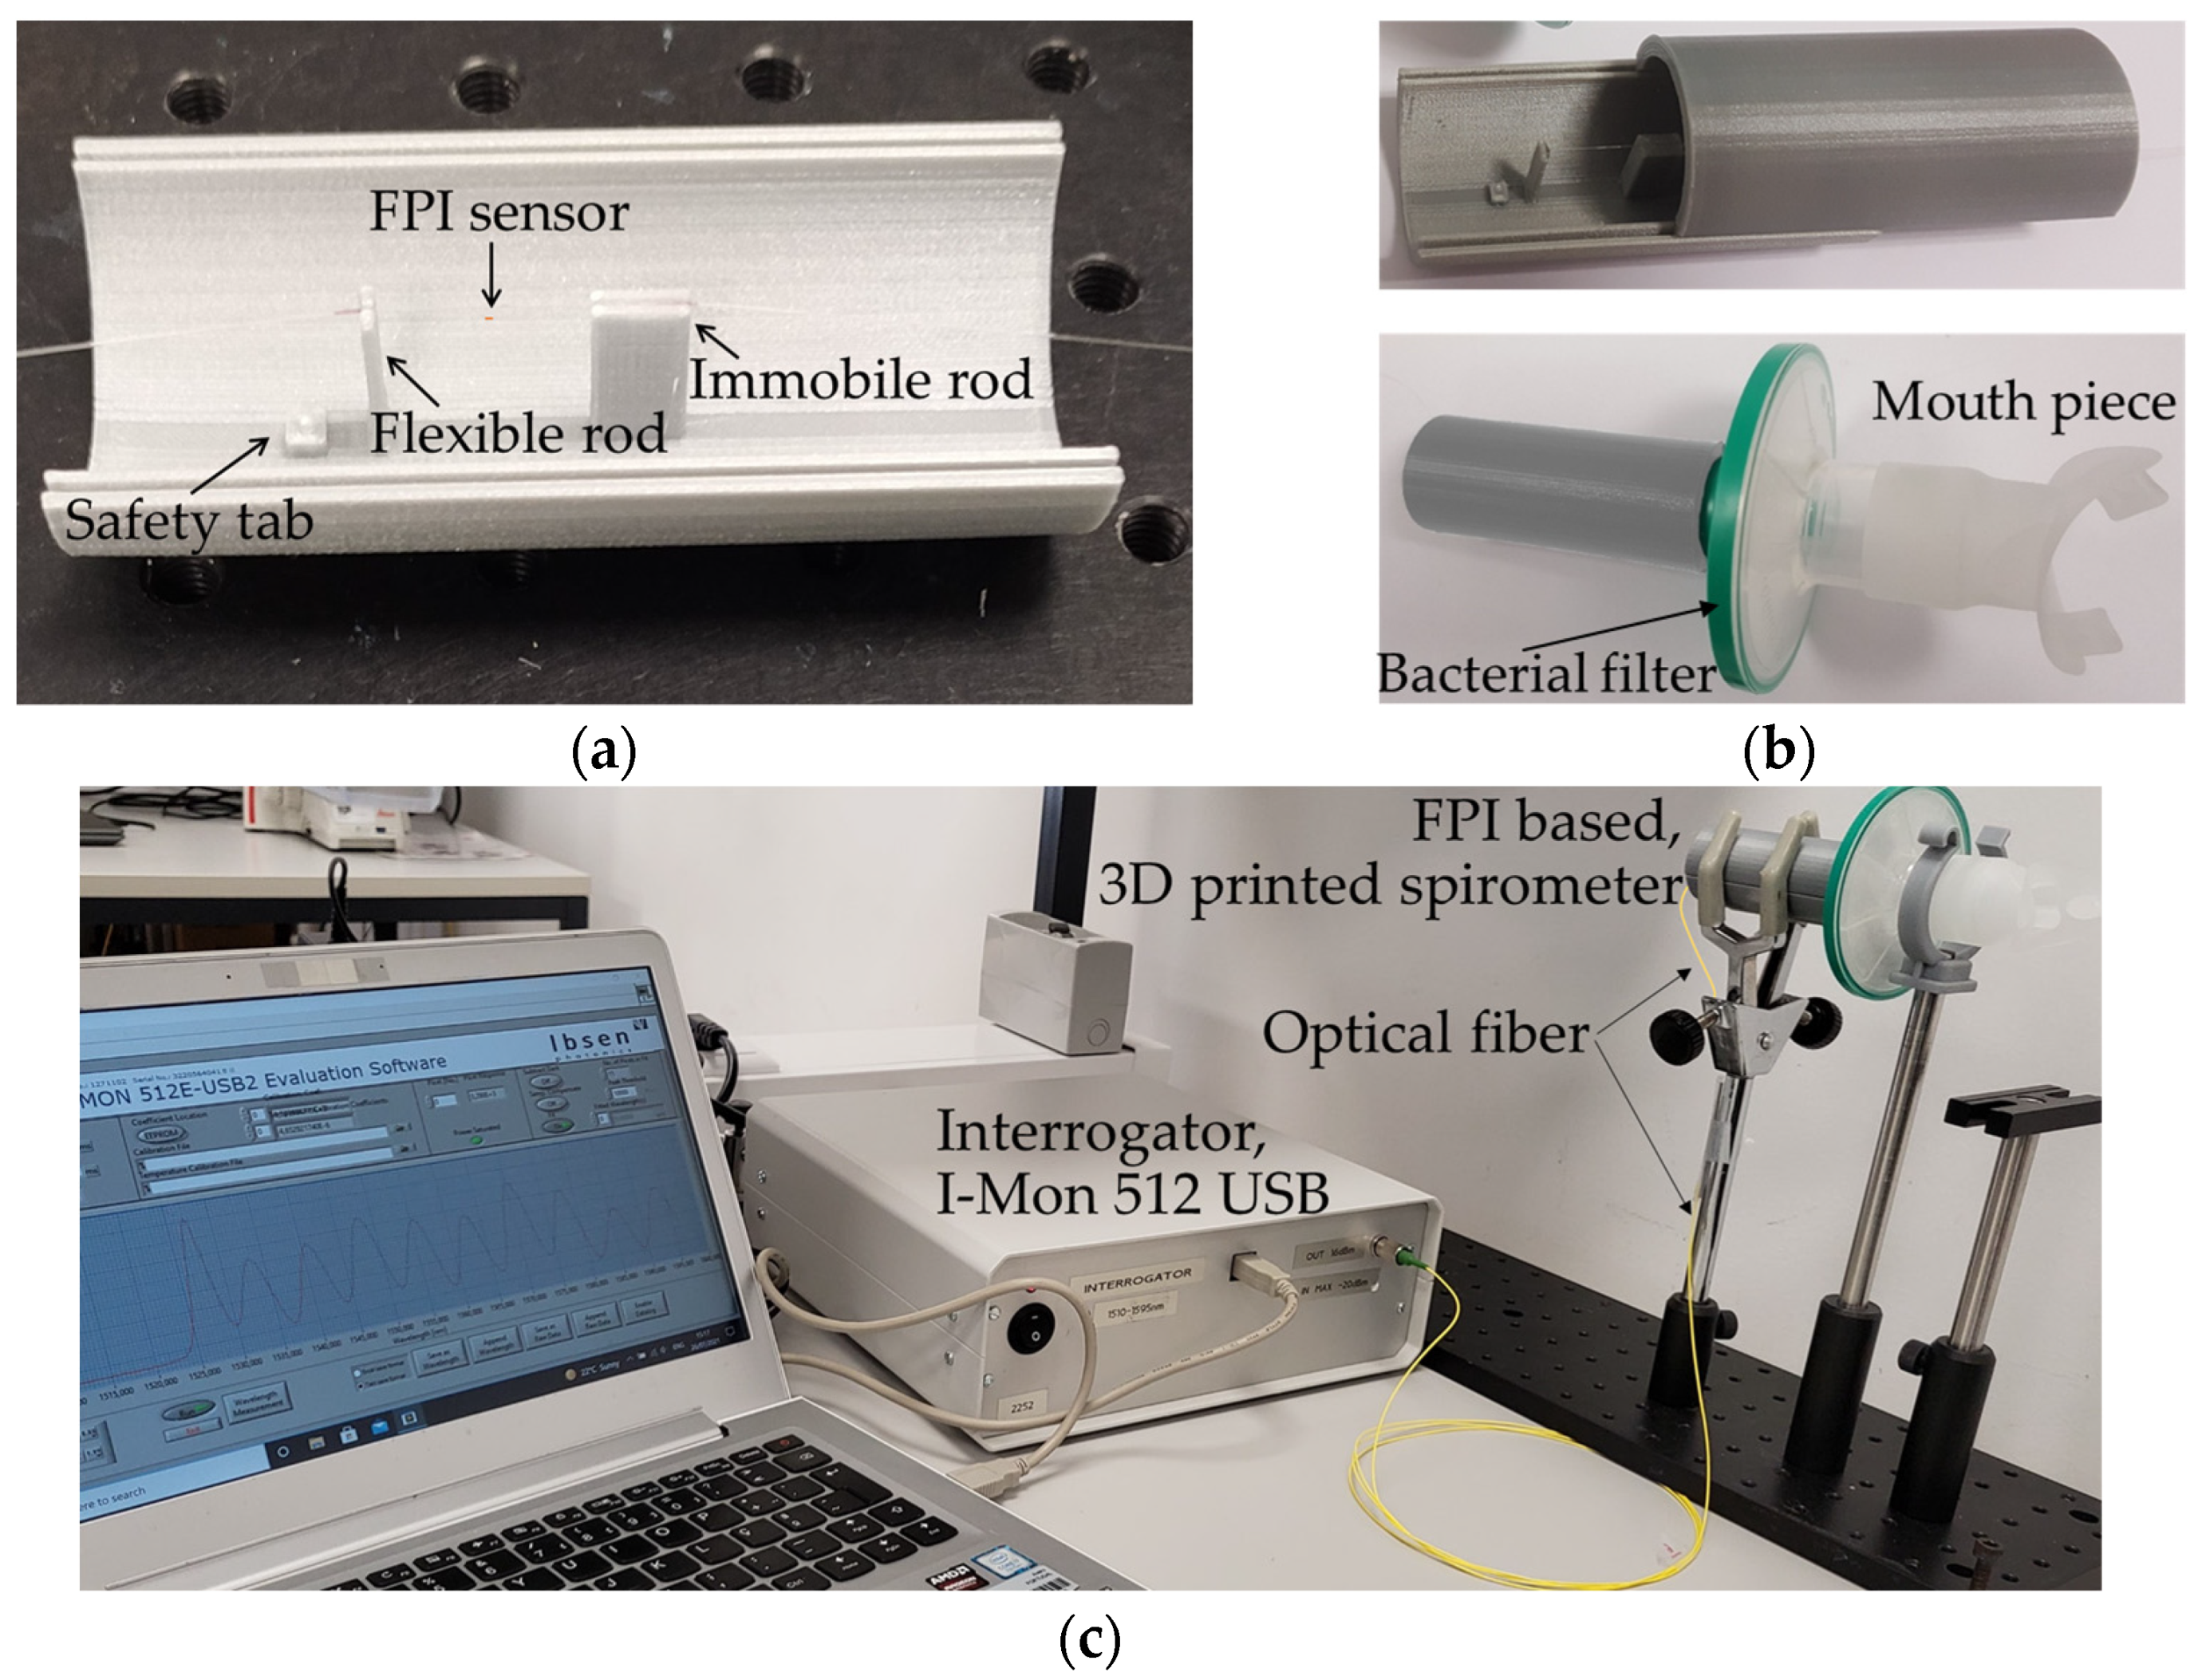
The assembly of the final FPI-based spirometer is of easy implementation and consists of positioning the optical fiber into the set of rods, with the FPI sensor located at the middle. The optical fiber is slightly tensioned and then glued onto the rods, enabling both directions of air flow to cause a spectral variation in the FPI response and, consequently, differentiate the breathing phases (inhalation and exhalation). The resultant sensing unit is depicted in
Figure 4a.
The presented device is ready for performing spirometry tests after the attachment of a removable and disposable breathing section, as depicted in
Figure 4b, comprising a bacterial filter case along with a mouthpiece, where each individual is asked to breathe into. This breathing section is hooked close to the flexible rod, where a safety tab prevents the contact between the two, securing the sensor’s integrity.
In
Figure 4c, the overall architecture of the sensing structure for spirometry tests is depicted. The sensing unit, portrayed in
Figure 4b, is firmly attached to a vertical adjustable support, with the mouth piece at the volunteer’s height. The flexible rod, faces the mouth piece and the volunteer. The optical fiber cable, exits the 3D printed spirometer case on the other extremity, and connects directly to the interrogator systems (I-Mon 512 USB, from Ibsen Photonics) with an acquisition frequency of 1900 Hz. For this spirometry application, the wavelength shift (due to strain variations) of one selected maximum/minimum of the FPI spectra was continuously monitored during the tests.
When compared with other previously reported airflow monitoring devices, such as the one presented in [
16], the device proposed in this manuscript, due to the interrogator software reconfiguration, allows continuous monitoring of the air flow, at the interrogator acquisition rate (1900 Hz). The authors in [
16], reported on a device, which, for each value of air flow, the correspondent FPI spectrum is acquired, and afterwards, upon data processing, the FPI spectral shift is analyzed for all the different air flow values tested. Here, the software customized for spirometry applications selects a smaller bandwidth of the FPI spectrum (here, the bandwidth of 1543–1554 nm was selected), and acquires, in a continuous mode at the interrogator acquisition rate, the wavelength shifts of the spectral dip in that bandwidth. For this application, the dip was chosen for its accentuation when compared with the spectral maximum. The wavelength shift is then converted to flow values, according to the theoretical assumptions detailed and demonstrated in the next section.
3. FPI-Based Spirometer Working Dynamics
In order to obtain the air flow dynamic parameters associated to spirometry, which enable the evaluation of the respiratory capacity, both flow and volume of air need to be determined. The volume of air is calculated through time integration of the flow, whereas the air flow (Flow
air) is achieved by applying the continuity equation to the system, resulting in [
25]:
where v is the velocity of the fluid (air in this case), and C
s is the cross section area of the 3D printed cylinder, with r = 1.425 cm. Given that any object standing in the flowing stream of air will have a force being applied to it (the drag force), the flexible rod will experience a force F, defined by:
with the air density ρ = 1.0 kg/m
3, v representing the air velocity, A
r representing the area of the rod facing the flow, and D
c representing the drag coefficient of the rod (D
c = 1.18 for a planar body with rectangular shape [
23]).
When considering mechanical perturbations in the elastic region of structural components, the Hooke’s law gives the relation between the perturbation force, F, and the induced deflection (or relative displacement), δ, as:
with K representing the stiffness (or elastic constant) of the material. However, when dealing with systems with more than one element, it is also possible to determine the stiffness of the system, i.e., the equivalent stiffness. In the cases where the elements deflection is the same, the equivalent stiffness is given by the sum of each individual stiffness. Considering the rod as a cantilever beam loaded at the end, and the optical fiber as a uniform cylindrical bar subjected to longitudinal loading, the system deflection δ results in [
26,
27,
28]:
with the first term concerning the rod properties such as the length T, which has the cylinder radius size of 1.425 cm, Young modulus of the rod material Y
PLA (3.33 GPa for the used 3D printed PLA), width (d = 0.40 cm), and thickness (s = 0.07 cm). The second term concerns the optical fiber, where h
f represents the length subjected to perturbations (h
f = 1.620 cm), Y
f represents the fiber Young modulus (Y
f = 69.2 GPa [
29]), and S
f is the cross section (considering the typical diameter of an uncoated fiber, 125 μm).
At the same time, the strain applied to the optical fiber that induces the modulation on the FPI response is given by the ratio of the distance variation between the two rods, Δl, to the initial rods separation, L (L = 1.620 cm), as:
Since the distance variation between the two rods Δl, corresponds to the deflection δ, from the association of (3) and (8), the relation between the rod displacement and the wavelength shift, ∆λ, is provided:
By further replacing (4) and (5) into (7), the air flow as a function of the FPI-induced wavelength shift can be obtained:
where the product is a constant associated with the material properties and dimensions of the cylinder, rod, and fiber. Substituting this term by a denominated flow constant, W, enables to simplify (10) as:
As the flexible rod is near to the origin of the air flow (the breathing section), exhalation cycles will decrease its distance to the fixed rod, inducing a compressive strain to be applied to the optical fiber. Compressive strains decrease the initial length of the FPI cavity and hence induce a spectral shift, to lower wavelengths, on the FPI spectral response. On the other hand, inhalation cycles will increase the distance between the two rods, causing a tensile strain and changing the FPI spectrum to higher wavelengths, since it induces an increase in the FPI cavity length.
Simulation of 3D Spirometer Deflection
The Solidworks Simulation and Solidworks Flow Simulation tools of the Solidworks 2019
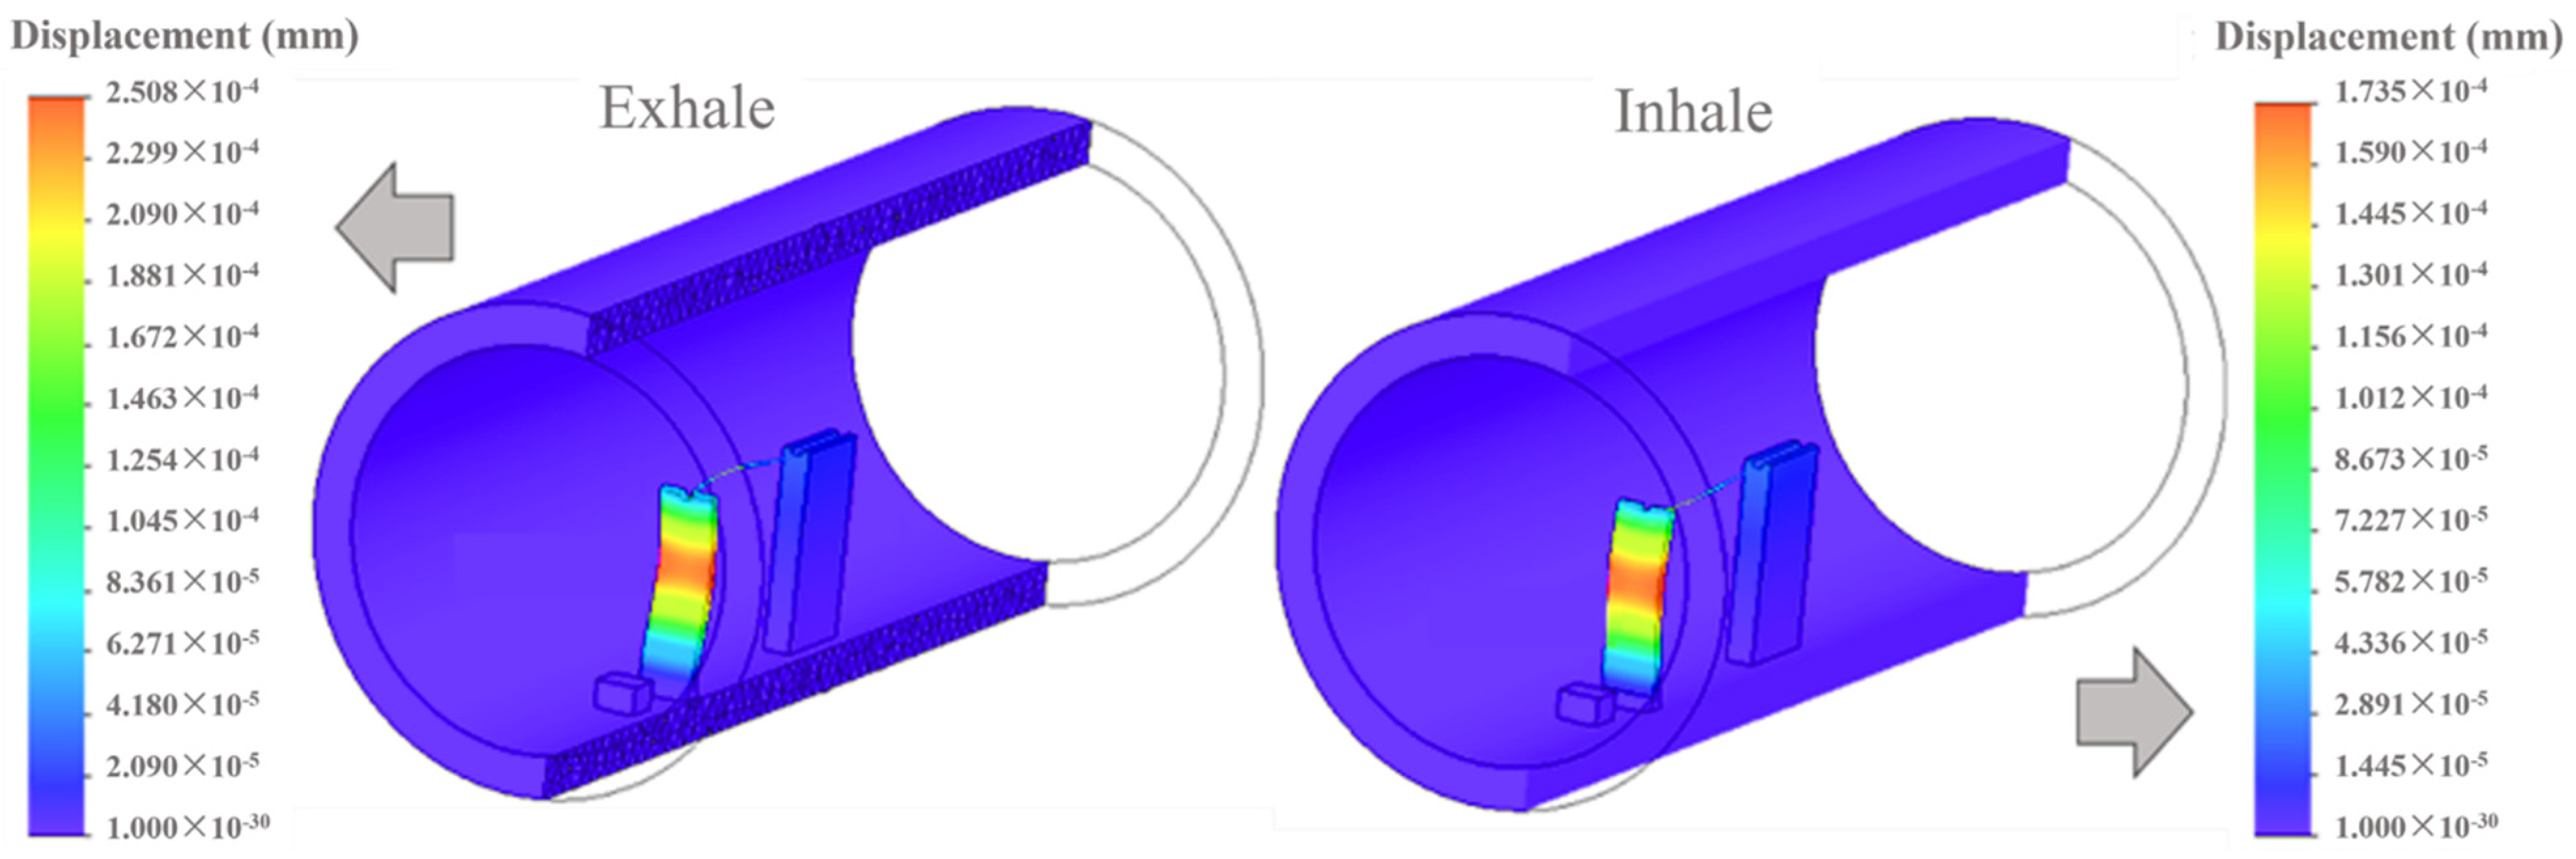
® (SW) program were used on the projected 3D model to corroborate the underlying theory through the simulation of the dynamics and structural impact associated with a forced expiratory maneuver. The forced exhalation was simulated by recreating an air flow within the cylinder and then assessing the rod response to it. The result was a bending of the flexible rod in the same direction as the flow, and since the larger rod remains immobile, the distance between the rods decreases, as expected. Following a similar process to simulate a forced inhalation resulted in the rod bending in the opposite direction, along with the air flow, and consequently, in the increasing of the rods separation. It should be noted that, due to the rod’s small thickness, and the optical fiber restraint effect, the displacement between the two rods is higher near the center of the rod. In
Figure 5, the lateral section view of the air flow effect on the system is depicted, resultant from the two simulations, considering an air flow of 6 L/s [
4]. Along with the illustration, the estimated displacement values of the overall system regarding its initial position are also provided.
As one can observe from
Figure 5, during the simulated inhalation, the rod bending capacity is lower than the one for the same flow in the exhalation moment. Such movement constraint is related with the attachment of the rod to the optical fiber, since in the inhalation cycles the movement of the rod is restrained by the fiber elongation. Therefore, it is necessary to consider a different flow constant for the inhalation (W
I) and exhalation (W
E) cycles, with W
E being the same as in Equations (10) and (11) and W
I being defined as:
with
p being a restraining factor that reflects the optical fiber resistance to the pulling movement of the rod during the inhalation process.
Considering the different flow constants W
I and W
E for inhalation and exhalation cycles, respectively, Equation (11) is now rewritten as:
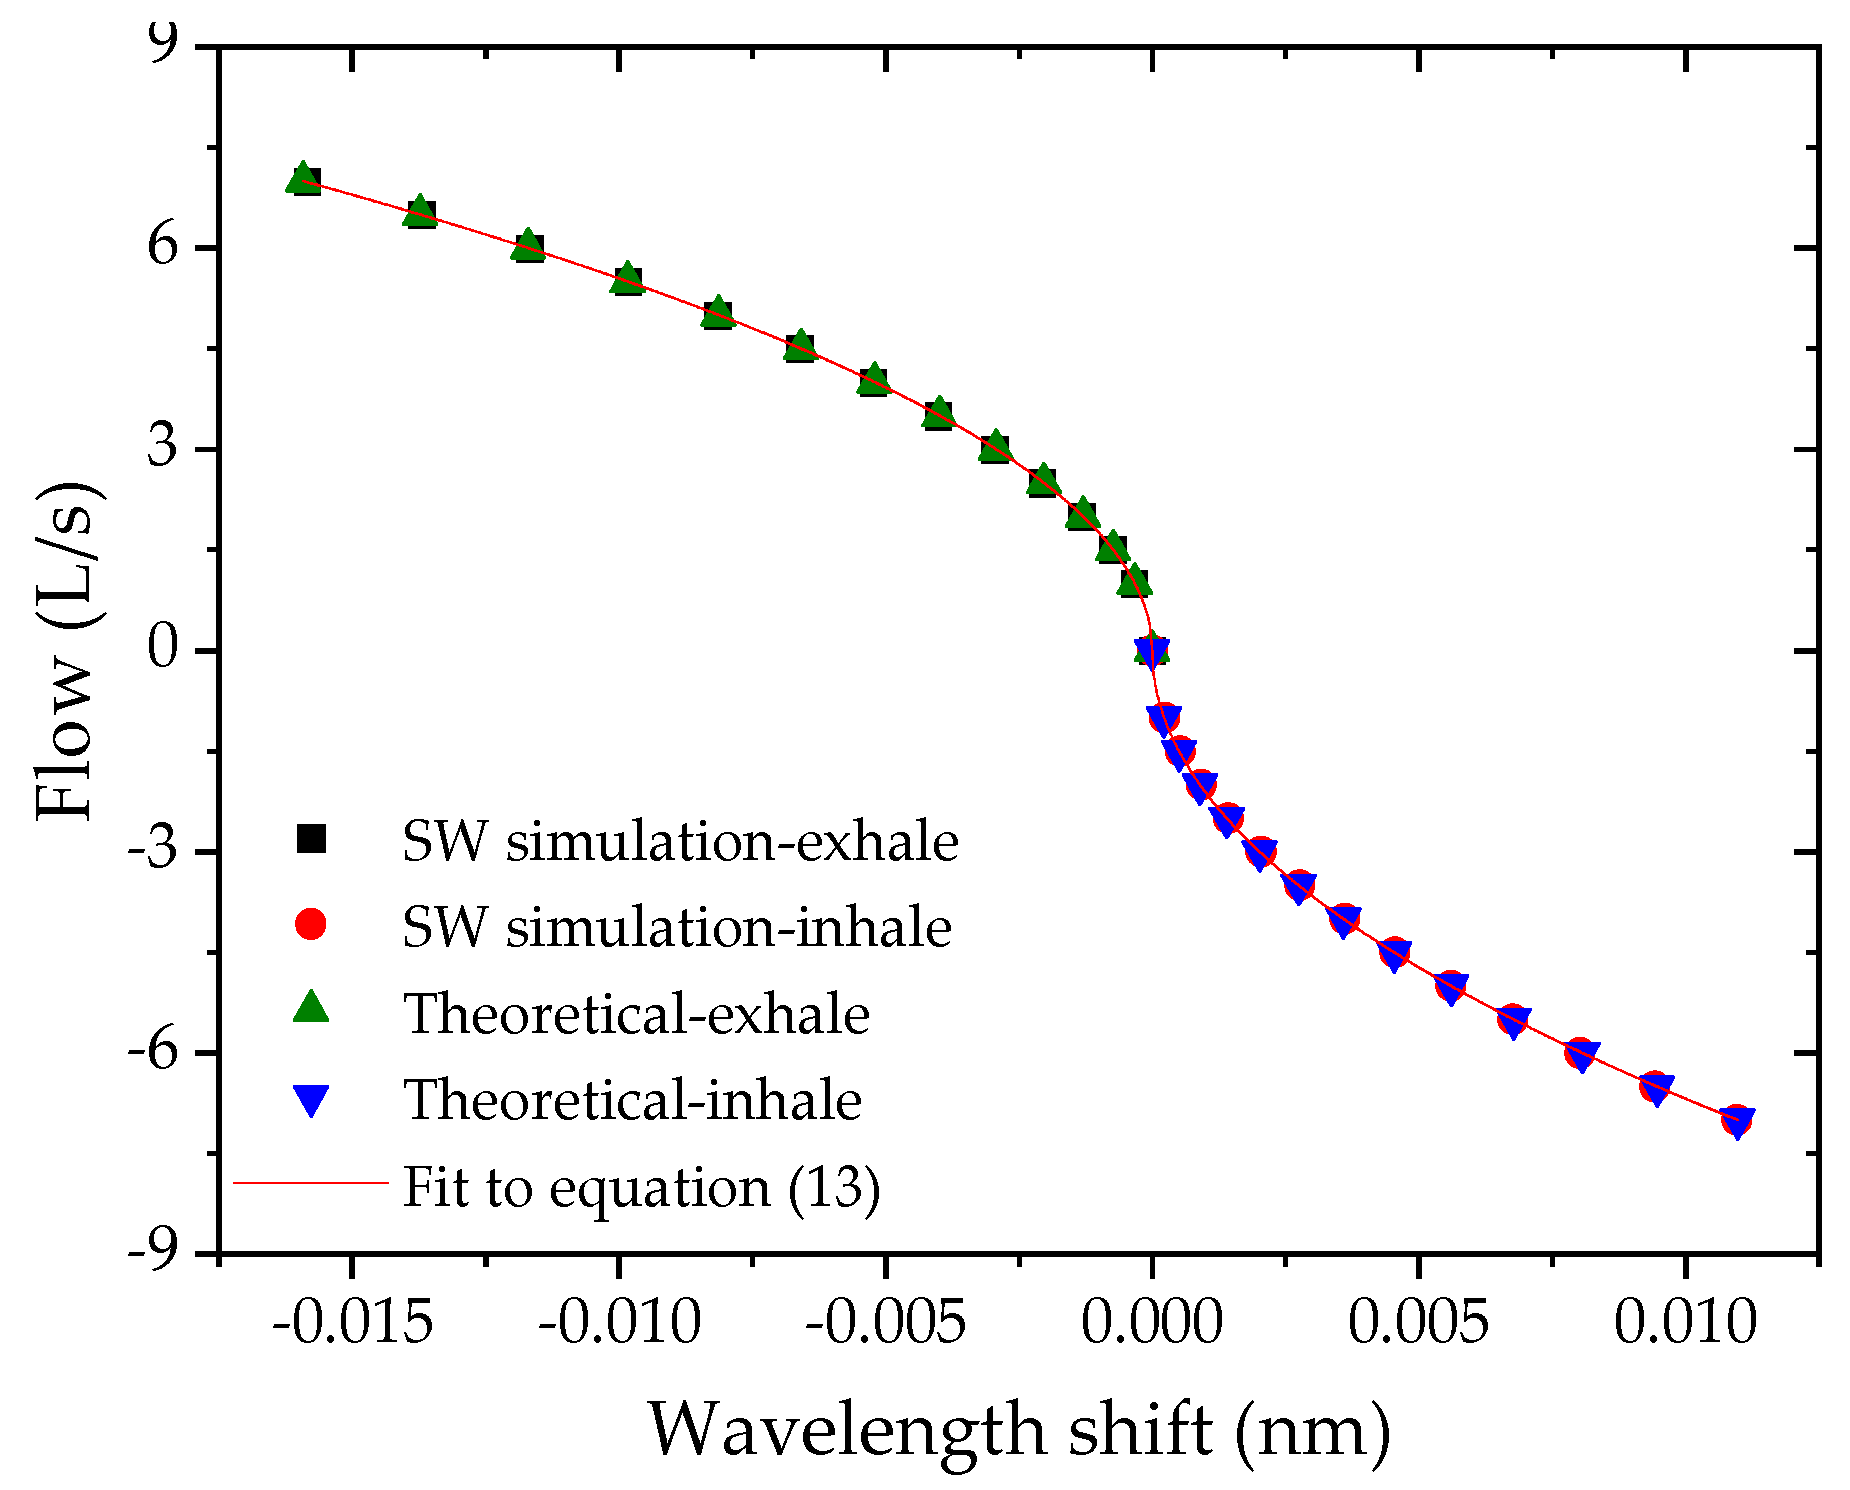
By extending this analysis to the typical air flow range expected in spirometry (0 up to 7 L/s) for inhalation and exhalation cycles [
4], a relation between the simulated rod displacement and the air flow can be determined. The obtained displacement can be converted into the spectral wavelength shift of the FPI by linking it with (3) and (8) and considering the strain sensitivity experimentally achieved, S
l = 3.51 ± 0.07 pm/µε. In
Figure 6, the relation established according to values retrieved through the SW simulation is displayed, where exhalation cycles are represented as positive flow values while inhalations are portrayed as negative flows.
The same figure also illustrates the theoretical wavelength shifts for the same values of flow, obtained according to (13), to provide a comparison with the underlying theory described in the previous sub-section. For the restraining factor
p in (12), a value of 0.7 was considered, found through data processing. From the fit performed to the data represented in
Figure 6, the values of the constants W
I and W
E, were found to be 66.76 L/s·(nm)
1/2 and 55.43 L/s·(nm)
1/2, respectively.
It should be noted that the behavior found for the air flow in the FPI spirometer follows the trend previously reported using other optical fiber technology [
15], in which the strain applied in the optical fiber has a linear response with the modulated optical signal.
4. Spirometry Tests and Results
To evaluate the performance of the assembled spirometer, the overall sensing and breathing unit was placed in a holding support, where a volunteer was asked to execute a series of spirometry tests. During each trial, the interrogation device (I-Mon 512 USB, from Ibsen Photonics) with an acquisition frequency of 1900 Hz and a wavelength fit resolution of 0.5 pm was used for continuous monitoring of the FPI spectral response.
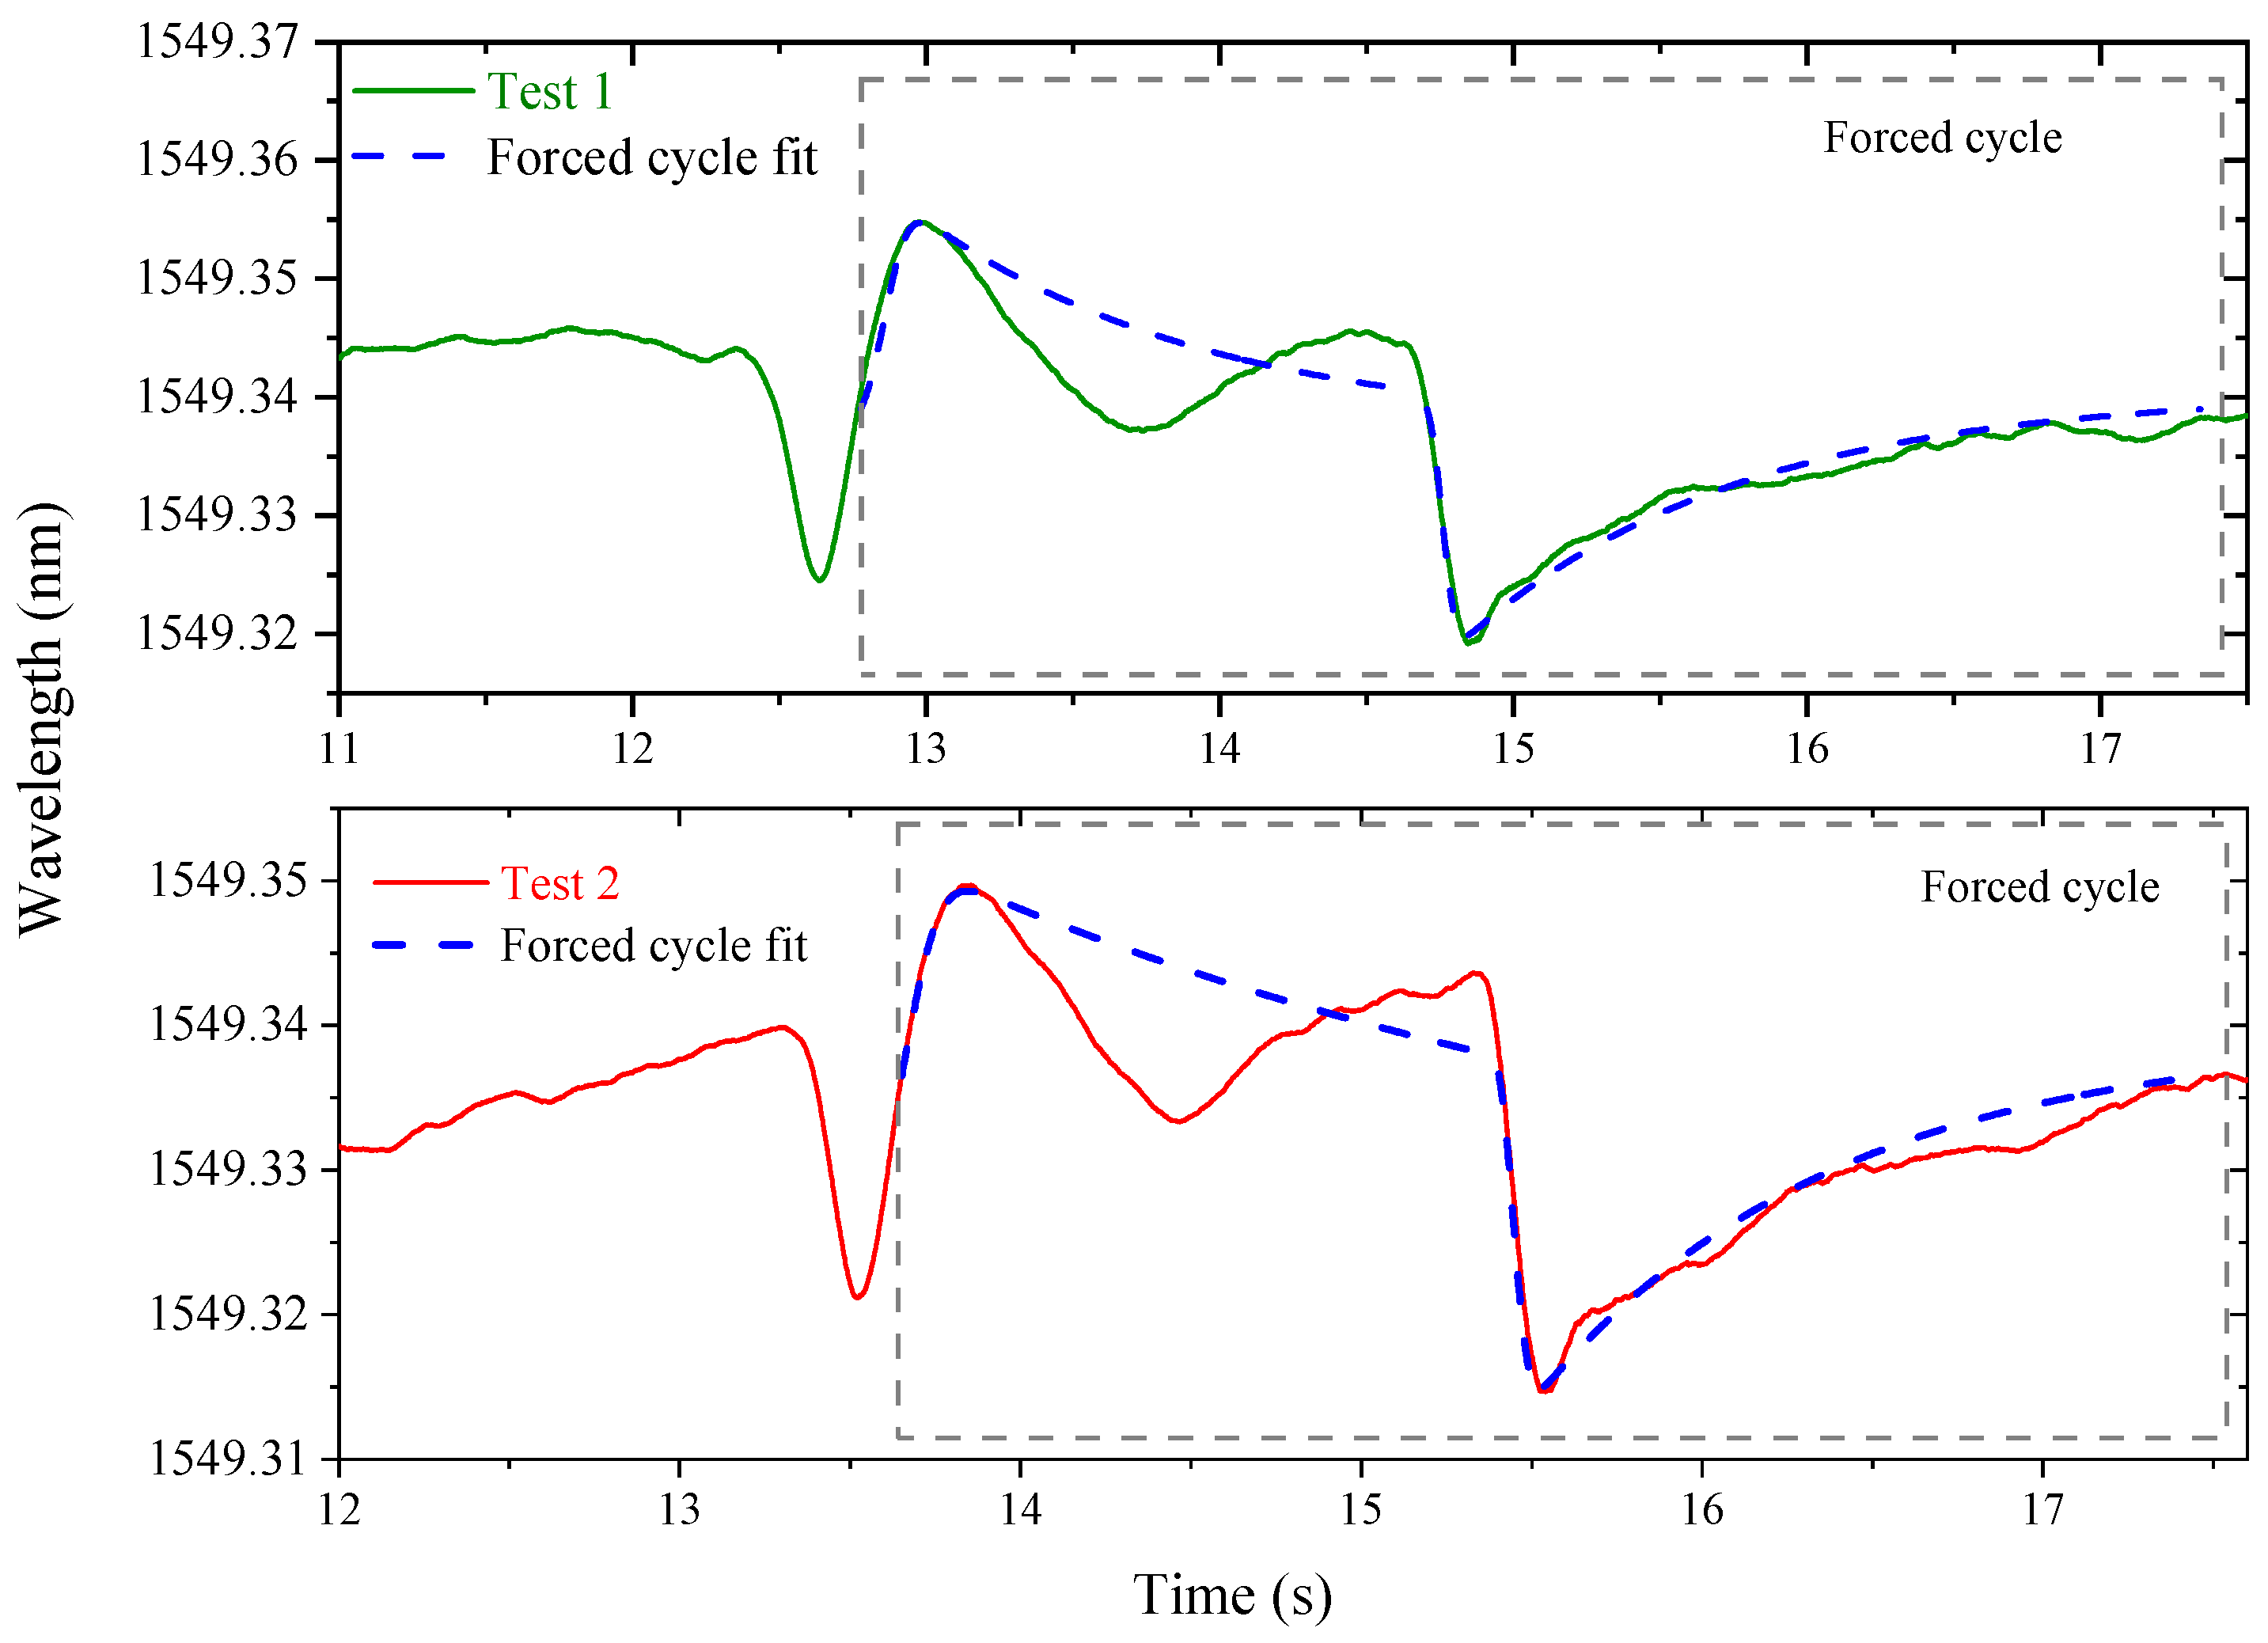
For the performance evaluation test, a healthy volunteer (female, 23 years) placed the mouthpiece and a nasal clip, to ensure that all the air flow was conducted entirely through the mouth. The test is started with normal breathing, followed by a deep inhale and a forced exhale, which normally should last approximately 6 s [
4].
Figure 7 presents the experimental data obtained in two different tests performed by the same person, concerning the forced breathing moment.
Due to the previously mentioned fiber restrains, the acquired signal during the inhalation considerably reflects the constrained movement of the rod. In the represented data, the influence of the optical fiber and the PLA inertia in the rod movement can be observed. The return to the rod’s original position also produces a deflection in the opposite direction, reflected by the negative wavelength shift during the inhale moments (which contradicts the predicted behavior). In order to clear the obtained signal, towards a trustworthy feedback as expected in a spirometry test, a fit to the obtained curve is performed, represented in blue, in
Figure 7.
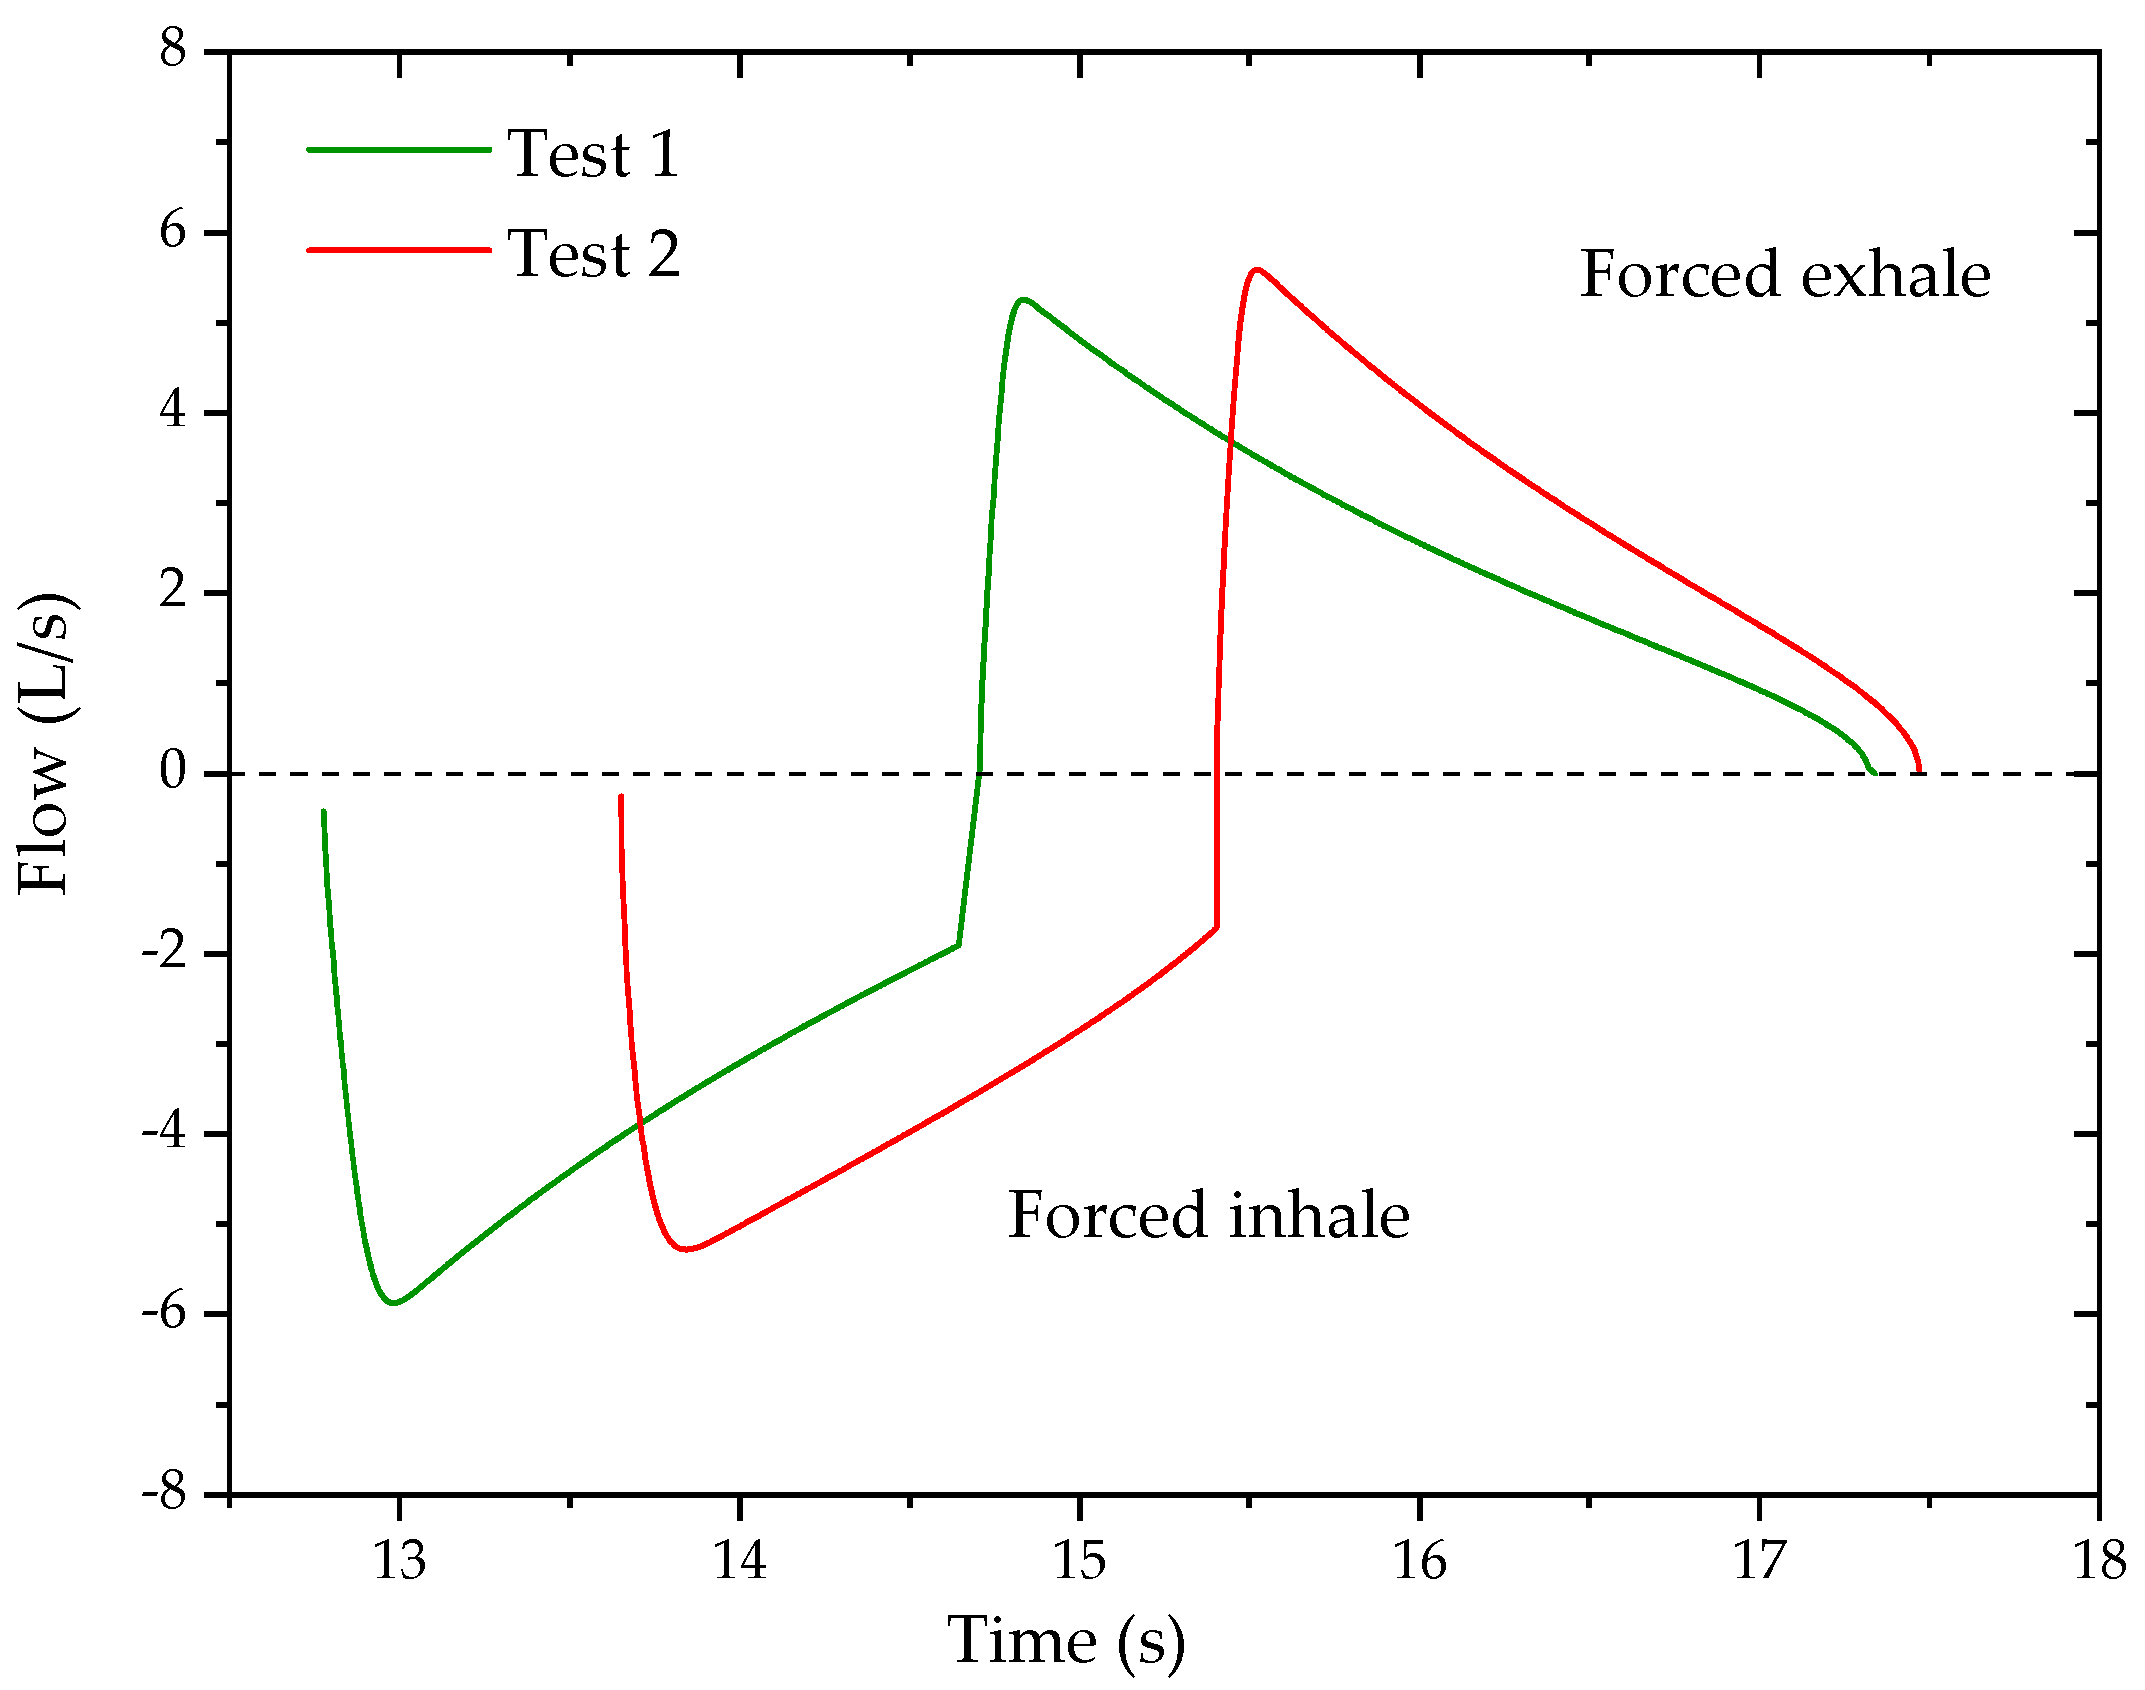
By applying Equation (13) to the obtained data (from the fit curve), the flow–time curves associated with the spirometry tests can be found.
Figure 8 displays the forced breathing section of the flow–time curves from each trial. In spirometry analytical representation, the exhalation process is associated with positive values of flow, whereas the inhalation process is portrayed as negative flow values.
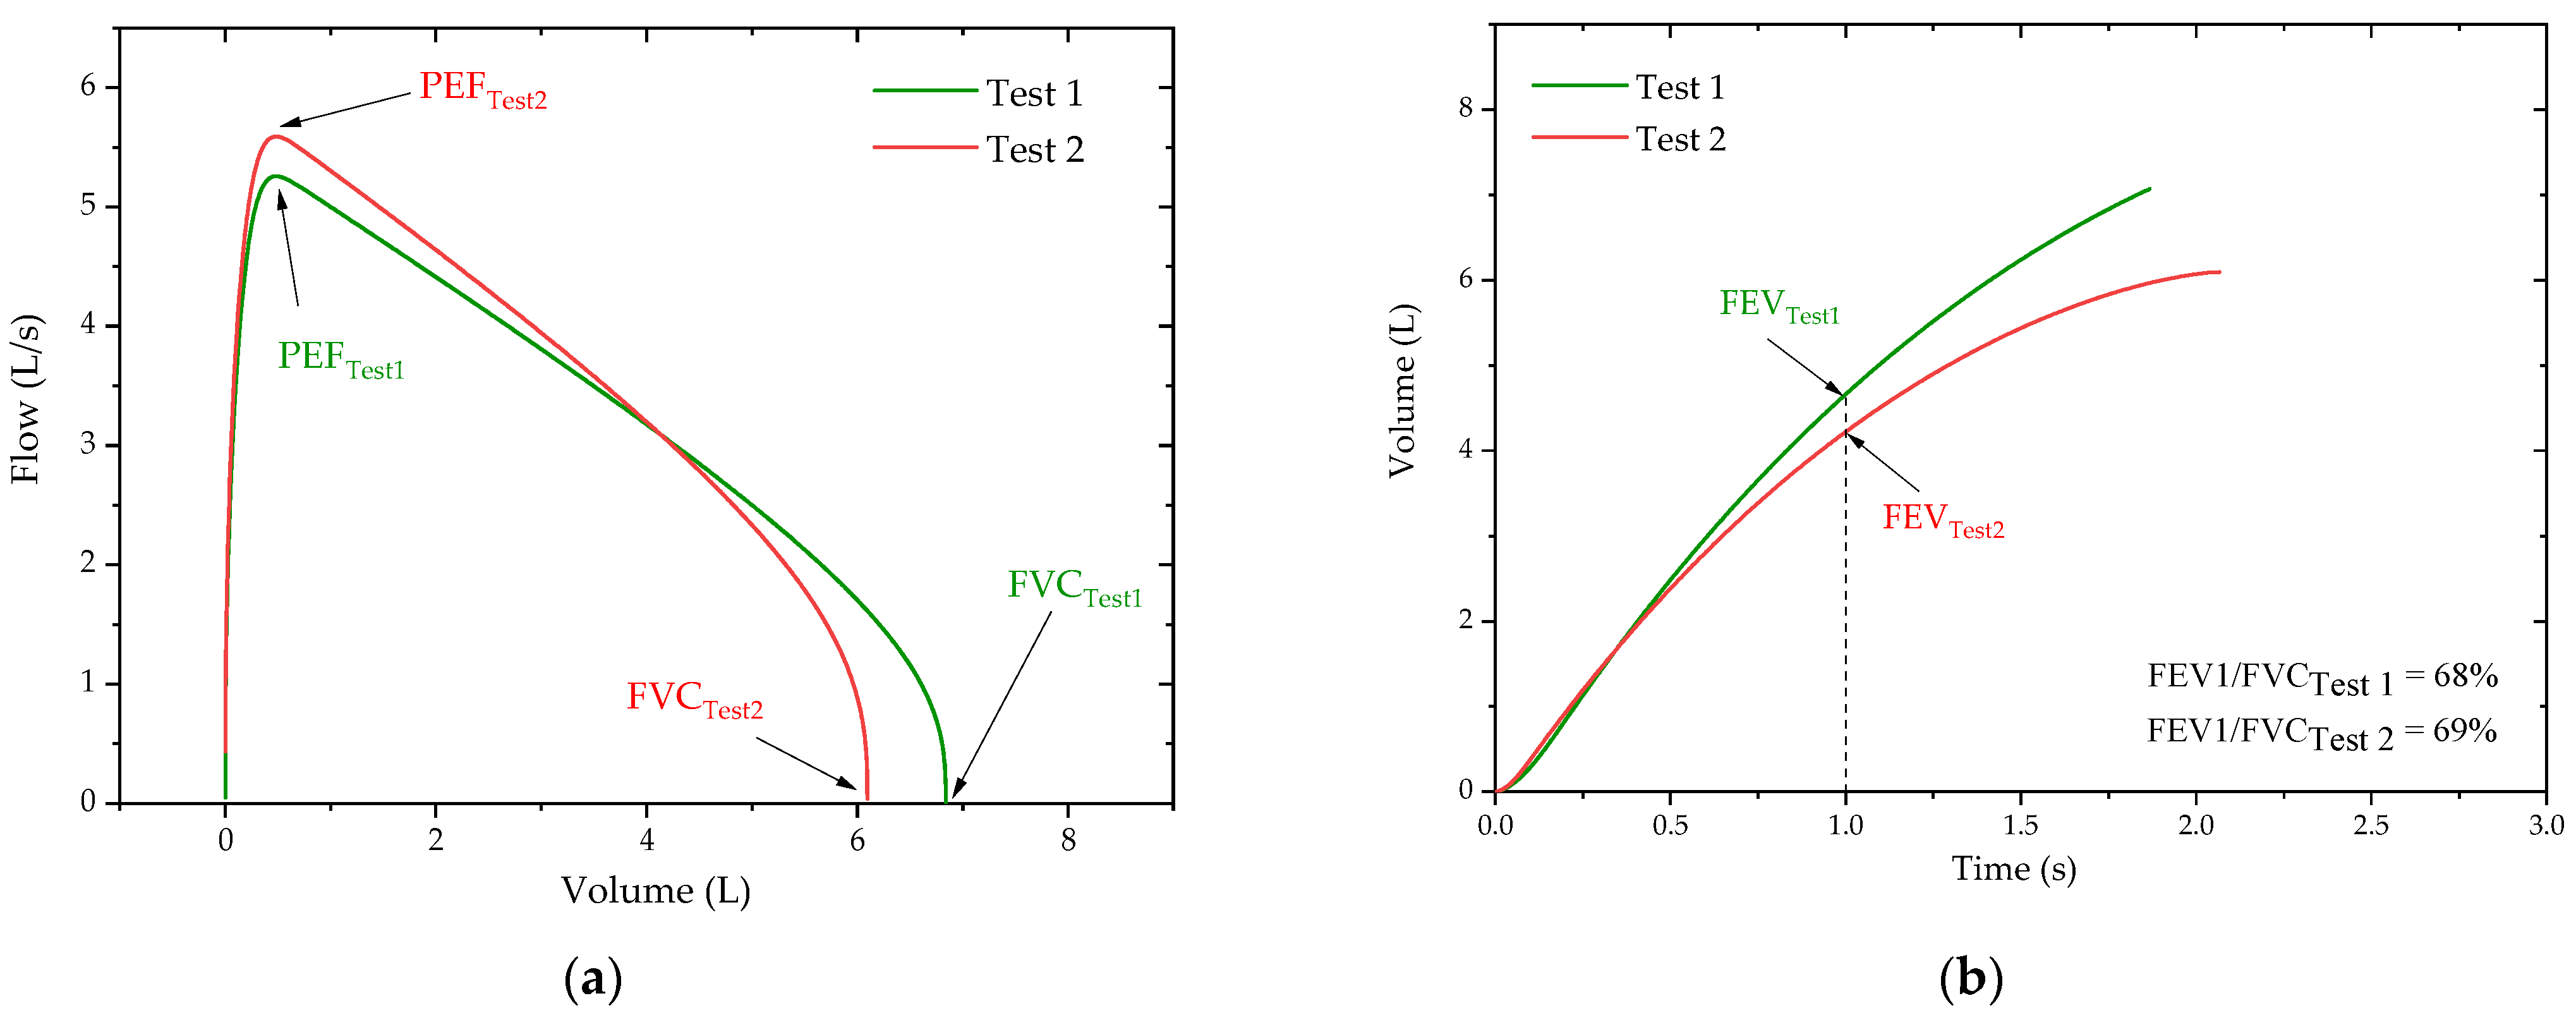
In order to obtain the typical outcome of a spirometer, which are the flow–volume and volume–time curves, the exhale cycles of the forced breathing were separately integrated to determine the air volume associated with the process. The resultant flow–volume and volume–time curves are depicted in
Figure 9a,b, respectively, along with the respiratory function parameters assessed during spirometry, such as FVC, PEF, FEV1, and the FEV1/FVC ratio.
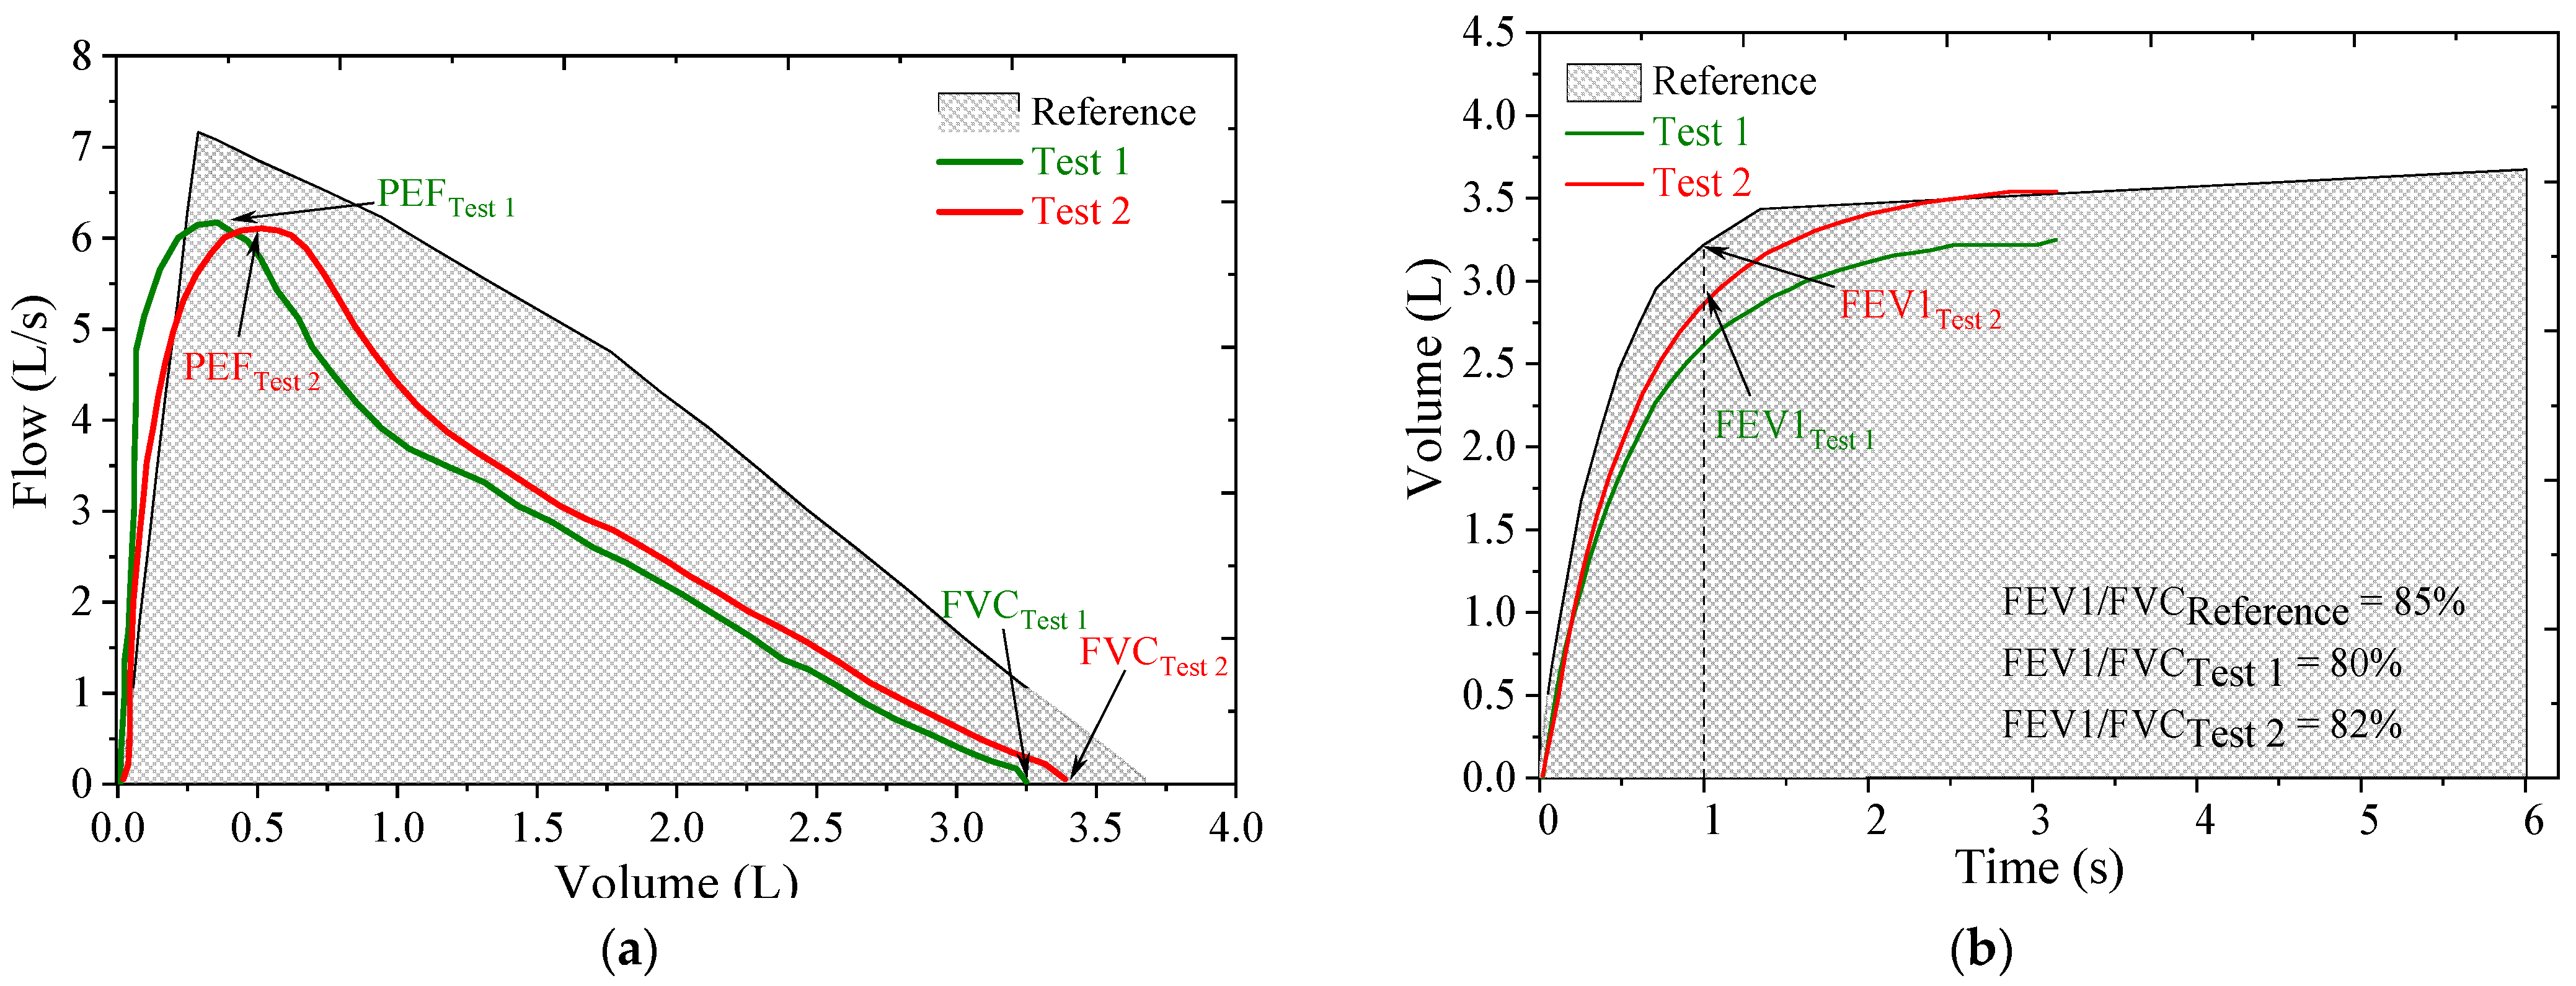
To provide a comparison of results, the same procedure used for the FPI-based spirometer was repeated using a commercial portable spirometer (Electronic Handheld, Digital Spirometer, Quiromed
®). The flow–volume and volume–time curves obtained in the tests with the commercial spirometer are displayed in
Figure 10a,b, respectively. Along with the empirical curves, represented as red and green lines, a shading area is also depicted, which represents the expected curve based on the ERS reference values [
4], provided by the electronic spirometer, and considers the age, gender, height, weight, and smoking habits of the subject.
By comparing the flow–volume and volume–time curves obtained from the different sensing systems—the commercial spirometer and the proposed one—it is apparent that the shape of the curves is in agreement and according to the expected behavior, as represented by the reference curve. The direct observation of the curves also enables the comparison between the respiratory function parameters, PEF, FVC, FEV1, and FEV1/FVC ratio, typically evaluated in a spirometry test.
The average FEV1 and FVC parameters for the two forced exhalations acquired from the proposed FPI system are 4.40 L and 6.46 L, respectively. Regarding the PEF, an average value of 5.35 L/s was found for the same two tests and a ratio of 68.5% was obtained for the average FEV1/FVC index. Correspondingly, the average FEV1 and FVC parameters determined for the two tests performed with the electronic spirometer are 2.83 L and 3.52 L, respectively. As for the PEF and FEV1/FVC ratio, using the commercial device, average values of 6.19 L/s and 81% were found.
Even though larger values were obtained with the FPI based spirometer than with the commercial one, especially for the FEV and FVC parameters, the FEV1/FVC ratios only differ by ~10%. The existing deviation may be due to a decreasing effort from the subject associated with fatigue, as the tests with the FPI-based device were performed before the ones with the commercial device, but sequentially. The results seem to be proportional and, therefore, a calibration constant (obtained by performing more tests with different volunteers) can answer this discrepancy. Presently, and due to the restrictions imposed by the SARS-CoV-2 pandemic, the recruitment of more volunteers for the sensor constant optimization was not possible.
One of the main advantages of the FPI-based spirometer is the reduced sensitivity to temperature variations [
24], which for a small range, such as the one expected between inhalation and exhalation moments (about 5 °C), can be disregarded. Contrarily, the FBG-based sensors require a temperature compensation method to solve their strong dependency with thermal variations [
15]. Furthermore, the increase in the strain sensitivity obtained for FPI-based sensors (3.51 ± 0.07 pm/µε for the FPI implemented) enables a better resolution and more accurate measurements when compared with the ones achieved with the FBG-based spirometer (around 1 pm/µε) [
15], which would be of greater importance when considering the monitoring of patients with lower respiratory capacity.
It is also important to consider that precise medical equipment, such as the laboratory spirometers, require a high financial investment only within the reach of established medical institutions. On the other hand, the proposed FPI-based spirometer can be implemented as a cost-effective solution, considering the method used for the FPI micro-cavity production. Furthermore, alternative interrogation techniques, as described in [
30,
31], may help reduce the cost even more.
5. Conclusions
In this work, an intrinsic optical fiber FPI-based sensor integrated in a 3D-printed case was developed and evaluated as a spirometry device to assess the respiratory health of individuals. To evaluate the air flow dynamics and the induced mechanical impact in the 3D-printed structure, a simulation study with Solidworks software was performed, validating the described theoretical approach.
To evaluate the suitability of the proposed system to perform spirometry, tests were executed using the proposed spirometer and, for comparison, a commercial unit. The shape of the flow–volume and volume–time curves obtained with the FPI-based system are as expected and show a good agreement with the ones obtained through the commercial spirometer. The pulmonary parameters obtained for the different tests can also be considered within the expected range, as the values of 4.40 L and 6.46 L, for the FEV1 and FVC parameters, respectively, with an FEV1/FVC index of 68.5%. Additionally, an average value of 5.35 L/s was found for the PEF.

 ,
, 
