Applications of THz Spectral Imaging in the Detection of Agricultural Products
by
 ,
,
Hongyi Ge
1,2,3, 
Ming Lv
1,2,3,
Xuejing Lu
4,
Yuying Jiang
1,2,5,*,
Guofang Wu
1,2,3,
Guangming Li
1,2,3,
Li Li
1,2,3,
Zhi Li
1,2 and
Yuan Zhang
1,2 1
Key Laboratory of Grain Information Processing and Control, Ministry of Education, Henan University of Technology, Zhengzhou 450001, China
2
Henan Provincial Key Laboratory of Grain Photoelectric Detection and Control, Zhengzhou 450001, China
3
College of Information Science and Engineering, Henan University of Technology, Zhengzhou 450001, China
4
PLA Strategic Support Force Information Engineering University, Zhengzhou 450001, China
5
School of Artificial Intelligence and Big Data, Henan University of Technology, Zhengzhou 450001, China
*
Author to whom correspondence should be addressed.
Photonics 2021, 8(11), 518; https://doi.org/10.3390/photonics8110518
Submission received: 19 October 2021
/
Revised: 5 November 2021
/
Accepted: 8 November 2021
/
Published: 17 November 2021
(This article belongs to the Special Issue Driving Spectroscopy and Laser Physics toward Biological, Agricultural, and Medical Applications)
Abstract
:Agricultural products need to be inspected for quality and safety, and the issue of safety of agricultural products caused by quality is frequently investigated. Safety testing should be carried out before agricultural products are consumed. The existing technologies for inspecting agricultural products are time-consuming and require complex operation, and there is motivation to develop a rapid, safe, and non-destructive inspection technology. In recent years, with the continuous progress of THz technology, THz spectral imaging, with the advantages of its unique characteristics, such as low energies, superior spatial resolution, and high sensitivity to water, has been recognized as an efficient and feasible identification tool, which has been widely used for the qualitative and quantitative analyses of agricultural production. In this paper, the current main performance achievements of the use of THz images are presented. In addition, recent advances in the application of THz spectral imaging technology for inspection of agricultural products are reviewed, including internal component detection, seed classification, pesticide residues detection, and foreign body and packaging inspection. Furthermore, machine learning methods applied in THz spectral imaging are discussed. Finally, the existing problems of THz spectral imaging technology are analyzed, and future research directions for THz spectral imaging technology are proposed. Recent rapid development of THz spectral imaging has demonstrated the advantages of THz radiation and its potential application in agricultural products. The rapid development of THz spectroscopic imaging combined with deep learning can be expected to have great potential for widespread application in the fields of agriculture and food engineering.
Keywords:
terahertz; spectrum; imaging; agricultural products; nondestructive testing; deep learning1. Introduction
The food and agriculture industries need fast and effective methods to inspect the quality and safety of agricultural products [1]. The THz region of the electromagnetic spectrum lies between the microwave (MW) and infrared (IR) regions with frequency range from 0.1 to 10 THz. THz radiation is used in nondestructive testing due to its unique position in the electromagnetic spectrum [2,3,4,5]. For example, intermolecular and intramolecular rotation and vibrational transitions at THz frequencies provide unique fingerprints for many materials. These patterns are specific to the molecular structure and arrangement of compounds, so the chemical composition of a sample can be analyzed through its THz spectral fingerprint [6,7]. Dry media such as paper, cloth, and plastic packaging are transparent to THz radiation, so it can be used to inspect packaging [8,9]. THz radiation is non-ionizing, and its photon energy is very low (~4.1 meV, 1 THz), which is much lower than X-rays. Therefore, THz radiation is safe for in vivo sensing [10,11,12]. However, THz radiation is highly sensitive to polar substances, such as water, which may be an advantage or disadvantage in certain applications [13].
Due to the lack of efficient THz sources and detectors, the THz region is the last unexplored band in the electromagnetic spectrum [14]. Although the THz-TDS is the earliest application of THz radiation [15], THz spectral imaging has great potential in nondestructive testing [16,17] and may provide more accurate information than conventional imaging. THz spectral imaging can be used for 3D imaging of a sample and analysis of its chemical composition by extracting its optical parameters in the THz region [18]. At present, THz spectral imaging is used in many fields, such as aerospace [19,20,21], biomedical [22,23,24], security detection [25,26,27], material performance analysis [28,29,30], and food quality [31,32,33]. In this paper, the application of THz spectral imaging in agriculture is reviewed, and the challenges and prospects of THz spectral imaging techniques are discussed.
2. THz Spectral Imaging Technique
2.1. Principle
THz time-domain spectroscopy (TDS) is one of the most effective and widely used powerful detection techniques. In this method, a fs laser is employed to generate THz radiation pulses for pump-probe measurements. THz images are obtained by a per-pixel scan. Details of the system was described in previous works. The THz imaging system can be divided into transmission imaging and reflection imaging from the imaging method of the sample [34,35,36,37]. This type of time-domain system can be used to measure both the frequency and electric field simultaneously, thus providing the phase and amplitude. Therefore, dispersion, absorption coefficient, and other material properties can be measured at THz frequencies [38,39,40]. Figure 1 shows a THz spectroscopy imaging system and the applications of agricultural products.
With the rapid development of THz science and technology, spectral imaging can be divided into pulsed and continuous THz radiation. As early as 1984, Auston et al. discovered an electromagnetic pulse with a pulse width of ps, which marked the birth of THz optoelectronics [41]. Since then, great progress has been made in the generation and detection of pulsed THz signals. Pulse THz spectral imaging systems usually generate and detect transient electromagnetic pulses. THz time-domain imaging (THz-TDI) is a basic pulse imaging method. On this basis, THz real-time imaging [42,43,44] and THz near-field imaging [45] were developed to improve imaging performance. Among them, a real-time imaging system based on THz quantum cascade laser (QCL) has good performance. A THz QCL provides adjustable frequency and compact structure. THz QCLs have attracted extensive attention in the field of THz imaging. In recent years, THz QCL performance has been continuously improved, making it the first choice for use in real-time THz imaging systems [46,47,48]. Continuous THz imaging is another common THz spectral imaging technique that eliminates the need to use a pulsed fs laser for THz spectral imaging [49,50,51]. Since Kleine-Ostmann et al. first proposed continuous-wave THz spectral imaging in 2001, CW imaging has developed rapidly and is widely used as it provides high spectral resolution. In general, THz radiation can be detected using coherent and incoherent methods [52,53]. Some common THz spectral imaging techniques and their characteristics are shown in Table 1.
2.2. Optical Parameter Extraction
The samples were placed on the moving platform at the focus of the THz beam, and then THz spectral was translated by THz control system. The transmitted or reflected THz waveform for each position of the object was measured. Once the scanning procedure was finished, the THz images of samples with a form of 3D were built by adding signals collected pixel by pixel.
Therefore, data processing and feature parameter extraction for a single pixel are basic steps in reconstructing THz images. The method for extracting parameters for a single pixel is briefly described as follows:
A time domain spectral signal is obtained by THz spectrum imaging system, and the amplitude and phase information of the sample is obtained with a Fourier transform [54]. THz pulses are absorbed and scattered by the sample, the sample’s complex refractive index comprises its macroscopic optical properties, where dispersion is quantified with the real refractive index and absorption is quantified with the extinction coefficient :
The sample is scanned to obtain and a reference spectrum [55,56]. Based on the Fresnel equation [57] and light propagation equation [58], the complex transmission function can be calculated as follows:
Ignoring the Fabry-Perot effect, the refractive index and absorption coefficient of the sample can be calculated as follows:
is the ratio of amplitudes for the sample and reference signals, is the phase difference between the sample and reference signals, is the angular frequency, is the speed of light in vacuum, and is the thickness of the sample. The time domain and frequency domain information for each pixel in the sample is obtained using the above calculation. Images can be formed using different potions parameters of data, which contain different information about the sample.
3. Application of THz Spectral Imaging for Detection of Agricultural Products
3.1. Internal Composition Detection
THz spectroscopic imaging can be used to detect the internal and intermolecular structure of samples. The spectral data contain information on the chemical, physical, and structural properties of the sample. Therefore, THz spectral imaging can be used to measure moisture content in crop leaves; maltose content, protein content, and fatty acid content in seeds; and from the state of seeds can be judged the seeds’ morphology.
May and Taday [61] used THz pulse imaging to detect sugar crystallization in confectionery products. THz technology was used to track phase transition from the aqueous phase into a glassy state, and it can be used to monitor the formation of a sugar coatings. THz spectral imaging technology can be used to non-destructively identify the morphology and structure of wheat seeds. Data processing software was used to obtain a large amount of information from THz images. The internal structure of healthy seeds was evenly distributed except for the embryonic area. Gua et al. [62] measured three seeds by THz reflection imaging technology, and the results show that the first seed was ungerminated, while the second seed was still in the germination stage. The third seed could not find its embryonic area in the THz image, and there was a large area of strong reflection in the upper right corner, which means that the internal structure of the area was destroyed and the third seed was necrotic. It is impossible to distinguish the state of seeds with the naked eye; THz reflection imaging allows the state of seeds to be identified non-destructively. Penkov et al. [63] first used THz-TDS to study the late blight and fusariosis in potatoes and cereals of different varieties. It was found that THz-TDS can clearly determine the presence or absence of phytopathogens, which can be used to assess the degree and depth of damage to plant tissues. Wei et al. [64] used THz spectroscopy to quickly and accurately determine the protein content in soybeans, and the results show that dimensionality reduction algorithms combined with THz spectroscopy for the quantitative determination of protein in soybeans is feasible.
Starch is converted into maltose during grain budding, and the degree of grain budding can be determined by measuring the content of maltose in grain. Jiang et al. [65] present PCA-SVM to detect maltose with different concentrations based on THz images. The results show that THz spectral imaging technology combined with chemometrics can be used to accurately measure the concentration of maltose, and the accuracy of their model exceeded 94%. Jiang et al. [66] proposed a method for quantitative analysis of wheat maltose using THz spectroscopy and THz spectroscopy imaging, which allows for the feature extraction on the THz image of the sample, and can be used to build information fusion models. In order to realize automatic optimization of LS-SVM, a Boosting enhanced iteration termination index was proposed to obtain the basic model parameters. Experimental results show that the prediction accuracy provided by the multivariate data fusion modeling algorithm is higher than that provided by LS-SVM modeling algorithm using THz spectrum and image feature data alone. Figure 2 and Figure 3 show the THz absorption spectroscopy and THz images of the maltose and polyethylene mixtures and the maltose and wheat starch mixtures, respectively. The multivariate data fusion method was used to quantitatively analyze four unknown maltose concentration wheat samples. The results show that the fusion modeling algorithm can effectively determine the maltose content in food and agricultural products.
THz radiation is strongly absorbed by water [67]. Therefore, one of the most obvious applications of THz spectroscopy is its application in measuring moisture content [68,69]. The moisture content in food affects its texture, taste, microbial growth, shelf life, and overall quality. Ogawa et al. [70] established two experimental systems with THz electromagnetic wave to evaluate the quality of tomato. The experimental results show that the internal damage was able to be detected, which was difficult with NIR. Nie et al. [71] investigated the THz spectra of rapeseed leaves with different water content, and used the partial least squares, kernel PLS, and Boosting-PLS to establish models for predicting water content based on the processed transmission and absorption spectra. The results show that the proposed three methods could effectively predict water content in leaves. Yasui [72] added a micro-structured light guide antenna to the system to measure the moisture content in coffee powder stored in glass bottles. After 3.5 h of forced humidity absorption, the transmission spectrum of instant coffee was found to have changed significantly. Plant leaves have heterogeneous structures containing spatial variations in liquid, solid, and gaseous substances [73]. The content and distribution of these substances are related to leaf vigor and phylogenetic traits. Zang et al. [74] proposed PSO algorithm to conduct one-off quantitative analysis of the spatial variability in the distribution of leaf components based on the extended Landau-Lifshitz Looyenga model and THz spectral imaging. The analysis results were verified experimentally using the leaves of Bougainvillea spectabilis leaves, and showed good sensitivity to fine-grained differences of leaf growth and development stages, indicating that the THz imaging method has the potential for applications in agricultural product disease diagnosis and farmland cultivation management. Song et al. [75] proposed a new method involving THz-TDS to estimate the water content in plant leaves. THz-TDS was used to detect the spatial distribution of THz wave transmission in xylem and vein flesh of three plants. An image was reconstructed using the transmission amplitude. Water loss in the basal leaf area was found to be greater than that in the distal leaf area of three plants during the natural drying process. THz imaging method and direct water gravimetric method are consistent. Song et al. also studied temporal and spatial variations of water content in the leaves of damaged Ginkgo biloba plants with incisions. The experimental results illustrated the feasibility of using THz technology to monitor temporal and spatial variations of water content in plant leaves.
3.2. Seed Classification
THz spectroscopy combined with chemometric methods can be used for seed classification, such as the identification of transgenic seeds [76] and seed variety classification [77]. As early as 2005, Lu et al. [78] used THz-TDS and THz spectral imaging to identify corn seeds and processed THz images of samples with spatial pattern analysis. The results show that the proposed method can be used for corn seed identification. Qin et al. [79] proposed a method that combined SVM and MPGA for identifying GM crops with THz spectra. PCA was utilized to reduce the dimensionality. When the dimensionality of MPGA-SVM was 12, the accuracy was 99%. Liu et al. [80] used THz spectral imaging combined with chemometric methods to study the feasibility of non-destructive discrimination of genetically modified rice seeds and non-transgenic seeds. PCA, LS-SVM, PCA-BPNN, and RF models were used to classify rice seeds. The results show that there are indeed differences between non-transgenic rice seeds and genetically modified rice seeds. The RF model combined with the first-order derivative pretreatment can be used for classification with 96.67% accuracy. THz spectral imaging can also be used to identify seeds in different stages and moldy seeds. Jiang et al. [81] used THz imaging to identify wheat particles at different germination stages. The experimental results show that THz imaging combined with chemometrics is an effective method for identifying early germination (about 6 h) of wheat seeds to ensure quality and quantity of seeds. Jiang et al. [82] established a new method for identifying mildew on wheat using THz spectral imaging. Spectral data from 0.2 to 1.6 THz were extracted from the regions of interest (ROIs) in the THz image. The models developed with SVM, PLS, and BPNN were based on the full frequency and optimal frequency range, where the first three principal components were used as input variables. The prediction accuracy provided by this method exceeds 95% and can be used with all pixels in an image. The results show that THz imaging combined with chemometrics is an effective method for identifying mildew on wheat. The physiological functions of different parts of seeds are different, and their nutritional value is also different. Li et al. [83] proposed a pretreatment method based on THz TDS imaging system combined with optical information extraction, which can be used to effectively enhance the visual representation of different tissues of corn seed. This method provides a basis for using THz spectral imaging to analyze the chemical composition and content of seeds. Figure 4A shows the extraction process of embryo region localization. Figure 4B shows the extraction process of endosperm region localization.
3.3. Pesticide Residues Detection
Pesticide residues are also a concern for consumers. Compared with conventional techniques used for pesticide detection, THz spectroscopy imaging enables qualitative, quantitative, and graphical analysis. In recent years, there has been a significant interest in employing THz imaging for detection of pesticides [1,84,85]. Lee et al. [86] proposed a novel high-sensitivity, selective method for detecting pesticide residues, where nano-scale metamaterials were used based on a THz-TDS system to detect methomyl. The enhanced THz near field strongly increases the absorption cross-section through the nanometer antenna material, and the detection sensitivity is still up to 1 ppb, even in the solution state of the pesticide sample. The THz signal reflected from the THz nano metamaterial can also be used to simply detect pesticide residues contained on the surface of an apple in a non-destructive manner without any treatment. The contaminated area with the residual methomyl (a green dashed circle) is located at a corner of the nano-slot-antenna array as marked in a white dashed square line (Figure 5a). The reflection image at 1.0 THz clearly shows different color distribution around the methomyl stain area (Figure 5b) [84].
Similar to other spectral imaging methods (such as hyperspectral imaging), THz spectral imaging has low sensitivity, and it is difficult to detect residues. However, metamaterials can be used to significantly increase sensitivity [87]. In addition, the size of metamaterials used in THz spectral imaging is larger than that of other metamaterials used in optical wavebands, so metamaterials used in THz spectral imaging are easier to manufacture.
3.4. Foreign Body Detection and Packaging Inspection
Detection of foreign bodies in food is a necessary means to ensure food safety and quality. Commercial X-ray imaging is widely used to monitor foreign objects that may be embedded in food. However, it is difficult for conventional detection methods to observe low-density foreign objects in optically opaque food substrates.
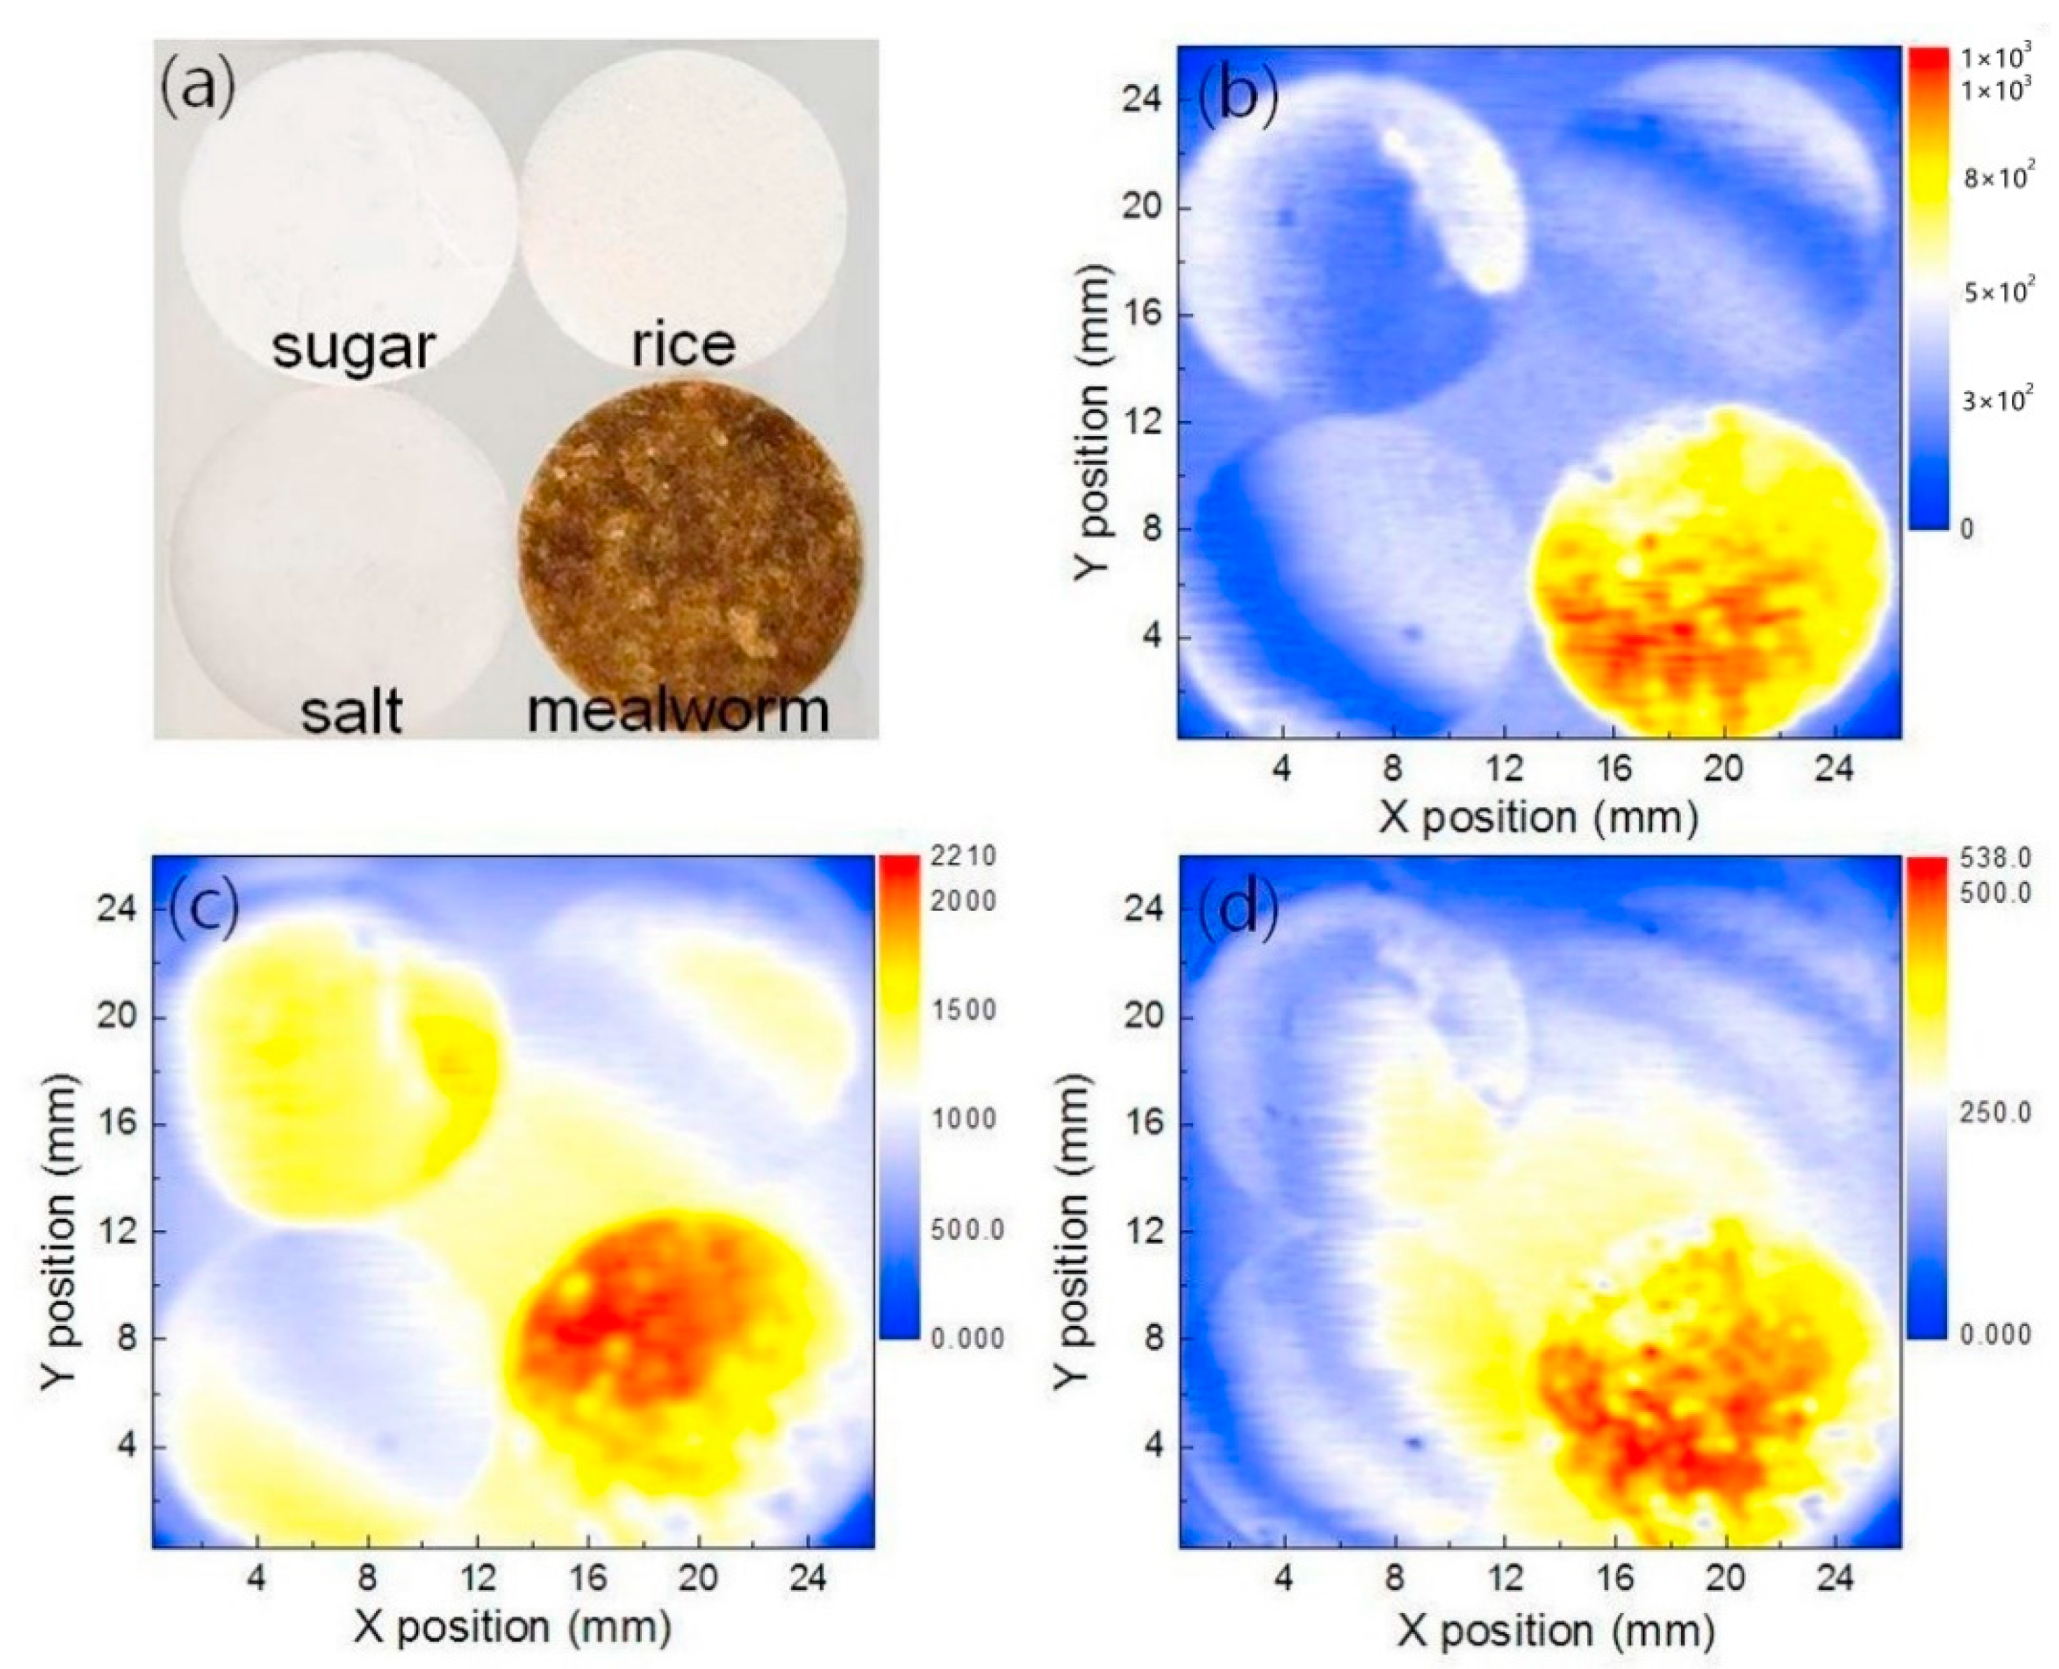
Jiang et al. [88] used THz reflection imaging to detect foreign bodies (FBs) in wheat grains and flour, and the results show that this method could successfully detect FBs like stones hidden in wheat particles. FBs at different depths hidden in flour could also be detected. Shen et al. [89] proposed a method for the detection of impurities in wheat, mainly including wheat husk, wheat straw, and weed. The method combined THz imaging technology with CNN. The wheat-V2 model can recognize the samples in wheats and the accuracy is 97.56%. Lee et al. [90] compared continuous wave THz spectroscopy imaging and X-ray imaging as techniques for detecting FBs in food. The maggots and crickets are used as a low-density FBs. Both THz and X-ray images can be used to detect aluminum and granite blocks in the sample, while maggots and crickets could only be detected by using THz imaging. The results show that continuous wave THz imaging has great potential for detecting high-density and low-density FBs embedded in food. Continuous sub-THz imaging can be used to identify low density foreign matter with non-ionizing radiation. Gyeongsik et al. [91] used a high-resolution raster scan imaging system to detect foreign matter hidden in dry food at 210 GHz. Test results show that the foreign material transmission image has higher contrast than the reflection mode image when continuous sub-THz imaging was used to detect insects in grain and dense materials like plastic. Gyeongsik [92] used 140 GHz radiation for transmission imaging of metal paper clips, insects, and other foreign bodies in chocolate. The results show that metal foreign objects in chocolate can be displayed, even without removing the wrapping paper. Therefore, the THz image technology can be used for non-destructive testing of food with high water content, and it is expected this technology will be used for non-destructive testing of agricultural products. Shin et al. [93] studied the feasibility of using complex refractive index mapping of food materials for qualitative analysis of food at THz frequencies. The THz reflection images of hidden defects in sugar and milk powder matrices were obtained, and the results shown that THz pulse imaging can be used to classify and detect foreign bodies in terms of the optical parameters of food and insects. Figure 6 shows the optical and reflective THz images of the food samples. The mealworm pellet sample is the bright yellow and red area at 1 THz. Yoneda et al. [94] developed a high-power, high-sensitivity THz imaging system with 100 dB dynamic range, which uses seed-injected THz parameter generation and detection. By improving the analysis method, the reagent was successfully identified in a thicker and more complex box with attenuation of more than 50 dB at 1.3 THz. Chen et al. [95] used THz spectral imaging combined with principal component analysis, typical spectral comparison, and discriminant analysis to successfully detect metal pollutants in sausage and locate metal pollutants. The results show that THz spectral imaging could be used to locate foreign bodies with non-ionizing radiation. Hee et al. [96] used THz reflection imaging and time-of-flight imaging to gather images of rice, sugar, salt, and mealworm particles from 0.2 to 1.3 THz, and the complex refractive index of food and insects was measured. The results show that THz spectroscopy imaging technology can be used to easily distinguish food and insects.
For low-density foreign body detection, X-ray imaging makes the object invisible due to the excessive penetration strength. However, the sample dielectric contrast of THz frequencies is more pronounced because of the lower penetration strength, which can be seen clearly. THz penetrates through many packaging materials and its low radiation energy properties make it more suitable for nondestructive inspections on agricultural products. According to the different characteristics of THz spectral imaging, foreign bodies in agricultural products can be distinguished.
4. Existing Problems
4.1. Water Absorption
THz radiation will be strongly absorbed by polar liquids (such as water, etc.), so the spectral signal will be attenuated to a certain extent when THz radiation is used to inspect agricultural products. The traditional method is to reduce water absorption by selecting a short optical path length [97] or to solve this problem by pre-processing the sample before inspection. Huang [98] proposed a THz-TDS method combined with multiple attenuated total reflection (MATR) to reduce the influence of water on the THz absorption. Guan et al. [99] designed and produced a 3D printed sample cell to solve the detection problem of high water-cut crude oil, and the results show that this can be used to determine water content in crude oil. The shape and thickness of the sample also affect the penetration of THz radiation. Cheon et al. [100] used freezing and penetration enhancers to increase the penetration depth of THz radiation into a sample. Water vapor in air will also absorb THz radiation. Mikhail et al. [101] used neural networks to remove data errors caused by water absorption. This method can be used to quickly remove water absorption lines from recorded data. There are four solutions to overcome water absorption and low penetration: (1) freezing or dehydrating the sample; (2) measuring at lower THz frequencies; (3) using THz technology combined with the attenuated total reflection method (ATR); (4) using deep learning or other methods to remove water vapor lines.
4.2. Scattering Effect
Scattering effects will occur when using THz radiation to inspect samples, especially when the samples are not uniform (e.g., with irregular shapes or varying particle sizes). Scattering will have a certain impact on measurements. To solve this problem, a sample can be finely ground before testing and pressed into a smooth, uniform sample, which can reduce scattering, and metamaterials can also be used. Ji et al. [102] used a double-negative material sheet with a plasma coating to reduce scattering, and the results shown that scattering was reduced greatly when the coating was on the outer layer. Algorithms can also be used to solve this problem, such as a wavelet transform or Karhunen Loeve transform. Malevicha et al. [103] proposed a THz pulse spectroscopy method based on the improved Monte Carlo algorithm to reduce the influence of scattering on reconstructed spectral information.
4.3. High Hardware Equipment Cost
Compared with infrared and ultraviolet spectroscopy, the cost of THz equipment is higher, and the cost of the equipment has become one of the obstacles to commercialization of THz techniques. Commercialization requires that the performance of the instrument remains unchanged when equipment is integrated and miniaturized. Using the CMOS fabrication process to produce THz spectral imaging systems may have lower costs [104]. Yeo et al. [105] used a nano-distributed feedback laser as an emitter instead of a traditional GaAs emitter and detector. A THz continuous wave system may cost less while ensuring high availability. Shin et al. [106] used dodecanoic acid particles and polyethylene to prepare a THz filter with low production cost, and the research results show that the filter could be used to effectively control the THz spectrum. Won et al. [107] used graphene-based crack lithography to make nano-antenna structures. Experimental results show that the nano-antenna structure provides glucose molecule detection with high sensitivity, low cost, and high production efficiency. Combining a low-cost frequency modulation continuous wave imaging system with a THz time-domain spectral imaging system provides a system low-cost solution. The system has spectral recognition and penetration capabilities, so it is cost-effective [108]. Gyeongsik et al. [109] used a sub-THz imaging system to evaluate food quality. This method provides 800 × 400 mm2 scanning area with low costs.
4.4. Low Detection Sensitivity
THz technology has developed into a non-destructive testing technique, but its sensitivity still needs to be increased compared with traditional techniques. Mou et al. [110] increased the sensitivity of THz technology to detect environmental pollutants by adjusting the geometric parameters of photonic crystal fibers. Suzuki et al. [111] proposed a THz spectral imaging system with single-walled carbon nanotubes and increased the sensitivity of the THz detector through optimization. The system can be used for drug quality detection, portable THz spectral imaging, and nondestructive testing of industrial products. Yan et al. [112] proposed a THz electromagnetically induced transparent metamaterial biosensor to study apoptosis of cancer cells. The experimental results show that the maximum experimental sensitivity of the sensor reached 900 kHz/cell mL cells/mL−1.
5. Outlook
In recent years, with the development of THz hardware technology, THz spectral imaging has made great progress so that THz spectral imaging can be applied in many fields. Many techniques and sample preparation methods have been employed with THz spectral imaging, making it a more powerful tool to identify materials. Applications of THz systems are beginning to shift from experimental studies to practical applications. The future research and development directions include:
5.1. THz Source and Detector Study
Because of the relatively high cost of THz technology, it has not been widely applied in actual production and real life. There are many types of continuous THz sources, such as optically pumped far-infrared gas lasers, THz vacuum electro devices, free electron lasers, THz quantum cascade laser, etc. Due to the limitation of current development, a THz source with large power, small size, room temperature operation, low cost, and continuous adjustability cannot be fully acquired. THz QCL is the most promising one, and it is likely to become the most ideal THz source in the future [113]. There are also some general problems with THz detectors. For example, room temperature THz detectors exhibited a large noise equivalent power and low sensitivity. This is in contrast to cooled THz detectors in the experiment setup. The study of low cost and high-efficiency THz source and detector can effectively reduce the cost of the THz system, which will make the THz technology more and more applied in various fields in the near future.
5.2. THz Technology Combined with Deep Learning Algorithm
At present, most of the agricultural products detected by THz wave have absorption peaks, which can be used to analyze the characteristics of agricultural products. However, some materials have no obvious absorption peaks in THz spectra, such as mixtures, which makes it impossible to intuitively analyze characteristics of the material. Deep learning algorithm was employed to analyze the spectral characteristics and the feature extraction and can obtain state-of-the-art performance on image classification and object detection. Deep learning algorithms can also be used to improve the resolution of THz images [114,115]. Therefore, deep learning and artificial intelligence can be considered to solve the problem of no absorption peak or no obvious absorption peak, and the hidden features of spectral data can be mined to achieve qualitative and quantitative analysis of samples. In the future, for the large amount of THz image data, we can consider introducing deep learning methods like convolutional neural networks (CNN) and deep belief networks (DBN) into the field of THz imaging process.
5.3. Establish THz Standard Database for Agricultural Products
Most applications of THz technology in agriculture involve qualitative and quantitative analysis of samples. The establishment of a THz agricultural product database can greatly simplify the analysis process. However, there are many types of agricultural products, and the workload involved in establishing a database for all agricultural products is very large. Therefore, a standard database containing the main components of agricultural products could be established, and different agricultural products could be identified based on the content of each component. The existence of differences in system errors and data processing methods leads to inconsistent THz spectral data. To establish THz standard database is the key point. At present, there have been studies on the standardization methods of THz spectral data [116]. It is necessary to further develop the standardization methods of THz image data to make the database more effective and reliable.
5.4. Application of Metamaterials to Increase Detection Sensitivity
When detecting harmful substances in agricultural products, the detection sensitivity and accuracy must be very high. Compared with traditional methods such as chemical detection, the sensitivity of THz technology still needs to be increased. The application of metamaterial sensors in the THz system will increase the detection sensitivity to a certain extent. Terahertz imaging technology with improved detection sensitivity is expected to become a supplementary verification method for industry detection standards in the future.
5.5. Optimization of the THz Software System
When analyzing and processing THz spectral imaging data, multiple processing methods are employed to find the best model. Therefore, several common modeling methods, such as PCA, SVM, PLS, BPNN, or RF, could be built into the software system, as could a built-in agricultural product standard database, design human-computer interaction and friendly visual interface, realize one-click processing, and analysis results of the measured spectral data. It can be developed into an independent analysis software system in the near future.
6. Conclusions
Recent rapid development of THz spectral imaging has demonstrated the advantages of THz radiation and its potential application in agricultural products, such as detecting ingredients, identifying seed varieties, measuring pesticide residues, and classifying detect foreign materials. However, it also has some drawbacks. The application of THz spectral imaging in agriculture and food engineering faces the main challenges of high water absorption, high cost, low source power, scattering effect, etc., which were also discussed. Methods for improving the performance of the THz technology are currently explored by many researchers.
Compared with THz spectral imaging applications in other industries, the targets detected in agriculture are generally uncontrollable and have diverse shape, size, structure, and composition. Therefore, higher requirements are put forward for the THz spectral imaging method and corresponding system. In recent years, some low-cost, high-efficiency THz systems have been developed, and some have incorporated metamaterial sensors to increase the sensitivity of the system. As well as the development of the fabrication technology and deep learning algorithms, THz spectroscopic imaging will become a potential efficient new tool for widespread application prospects in the fields of agriculture and food engineering.
Author Contributions
Conceptualization, H.G. and Y.J.; methodology, M.L.; validation, M.L., G.L. and G.W.; formal analysis, M.L.; investigation, M.L.; resources, M.L.; writing—original draft preparation, M.L. and L.L.; writing—review and editing, H.G. and Z.L.; visualization, X.L.; supervision, Y.J.; project administration, Y.Z.; funding acquisition, H.G. All authors have read and agreed to the published version of the manuscript.
Funding
This work is supported by the National Natural Science Foundation of China (Grant Nos. 61975053,61705061), Key Scientific and Research Project of Educational Committee of Henan Province of China (Grant No. 19B510001), Open Fund Project of Key Laboratory of Grain Information Processing & Control, Ministry of Education, Henan University of Technology (Grant No. KFJJ2020103, KFJJ2017107), Cultivation Programme for Young Backbone Teachers in Henan University of Technology, Natural Science Foundation of Henan Province (No. 202300410111), major public welfare projects of Henan Province (No.201300210100), and HASTIT(22HASTIT017).
Acknowledgments
We are deeply grateful to the reviewers and editors for their invaluable and constructive suggestions and comments that greatly improved the version of this article.
Conflicts of Interest
There is no conflict of interest in this article.
References
- Afsah-Hejri, L.; Akbari, E.; Toudeshki, A.; Homayouni, T.; Alizadeh, A.; Ehsani, R. Terahertz spectroscopy and imaging: A review on agricultural applications. Comput. Electron. Agric. 2020, 177, 105628. [Google Scholar] [CrossRef]
- Wang, K.Q.; Sun, D.W.; Pu, H.B. Emerging non-destructive terahertz spectroscopic imaging technique: Principle and applications in the agri-food industry. Trends Food Sci. Technol. 2017, 67, 93–105. [Google Scholar] [CrossRef]
- Luo, N.; Wang, D.; Wang, S.-F.; Han, P. Progress in Terahertz Technique for Quality Inspection of Agro-Food Products. Spectrosc. Spectr. Anal. 2019, 39, 349–356. [Google Scholar] [CrossRef]
- Tonouchi, M. Cutting-edge terahertz technology. Nat. Photonics 2007, 1, 97–105. [Google Scholar] [CrossRef]
- Ferguson, B.; Zhang, X.-C. Materials for terahertz science and technology. Nat. Mater. 2002, 1, 26–33. [Google Scholar] [CrossRef] [PubMed]
- Salén, P.; Basini, M.; Bonetti, S.; Hebling, J.; Krasilnikov, M.; Nikitin, A.Y.; Shamuilov, G.; Tibai, Z.; Zhaunerchyk, V.; Goryashko, V. Matter manipulation with extreme terahertz light: Progress in the enabling THz technology. Phys. Rep. 2019, 836–837, 1–74. [Google Scholar] [CrossRef]
- Funk, R.H.W. Biophysical mechanisms complementing classical cell biology. Front. Biosci. (Landmark Ed.) 2018, 23, 921–939. [Google Scholar] [CrossRef]
- Lee, S.Y.; Woo, S.Y.; Chun, H.S. Application of terahertz spectroscopy/imaging technology for food quality and safety management. Food Sci. Ind. 2018, 51, 26–36. [Google Scholar]
- Puc, U.; Abina, A.; Rutar, M.; Zidansek, A.; Jeglic, A.; Valusis, G. Terahertz spectroscopic identification of explosive and drug simulants concealed by various hiding techniques. Appl. Opt. 2015, 54, 4495–4502. [Google Scholar] [CrossRef]
- Gong, A.; Qiu, Y.; Chen, X.; Zhao, Z.; Xia, L.; Shao, Y. Biomedical applications of terahertz technology. Appl. Spectrosc. Rev. 2020, 55, 418–438. [Google Scholar] [CrossRef]
- Grootendorst, M.R.; Fitzgerald, A.J.; de Koning, S.G.B.; Santaolalla, A.; Portieri, A.; Van Hemelrijck, M.; Young, M.R.; Owen, J.; Cariati, M.; Pepper, M.; et al. Use of a handheld terahertz pulsed imaging device to differentiate benign and malignant breast tissue. Biomed. Opt. Express 2017, 8, 2932–2945. [Google Scholar] [CrossRef] [Green Version]
- Siegel, P.H. Terahertz technology in biology and medicine. In Proceedings of the 2004 IEEE MTT-S International Microwave Symposium Digest, Fort Worth, TX, USA, 8 October 2004. [Google Scholar]
- Browne, M.; Yardimci, N.T.; Scoffoni, C.; Jarrahi, M.; Sack, L. Prediction of leaf water potential and relative water content using terahertz radiation spectroscopy. Plant Direct. 2020, 4, e00197. [Google Scholar] [CrossRef]
- Zhang, Y.-P.; Tang, L.-B.; Liu, Y.-F.; Seng, T.K.; Wu, G.; Hu, W.-D.; Han, F.-Z. The research progress and application of novel terahertz detectors. J. Infrared Millim. Waves 2020, 39, 191–210. [Google Scholar] [CrossRef]
- Van Exter, M.; Fattinger, C.; Grischkowsky, D. Terahertz time-domain spectroscopy of water vapor. Opt. Lett. 1989, 14, 1128–1130. [Google Scholar] [CrossRef]
- Liu, K.; Huang, P.; Zhang, X.-C. Terahertz wave generation from ring-Airy beam induced plasmas and remote detection by terahertz-radiationenhanced- emission-of-fluorescence: A review. Front. Optoelectron. 2019, 12, 117–147. [Google Scholar] [CrossRef]
- Son, J.-H. Principle and applications of terahertz molecular imaging. Nanotechnology 2013, 24, 214001. [Google Scholar] [CrossRef] [PubMed]
- Fitzgerald, A.J.; Tie, X.; Hackmann, M.J.; Cense, B.; Gibson, A.P.; Wallace, V.P. Co-registered combined OCT and THz imaging to extract depth and refractive index of a tissue-equivalent test object. Biomed. Opt. Express 2020, 11, 1417–1431. [Google Scholar] [CrossRef]
- Zhong, M.; Liu, B.; Li, C.; Wang, Z.; Wei, D.; Zhou, B.; Dai, X.; Xu, Y. Terahertz Spectroscopy and Imaging Detection of Defects in Civil Aircraft Composites. J. Spectrosc. 2020, 2020, 2312936. [Google Scholar] [CrossRef]
- Wang, Q.; Li, X.-Y.; Chang, T.-Y.; Hu, Q.-P.; Bai, J.-P. Terahertz Time-Domain Spectroscopic Study of Aircraft Composite and Matrix Resins. Spectrosc. Spectr. Anal. 2018, 38, 2706–2712. [Google Scholar] [CrossRef]
- Wang, B.; Zhong, S.; Lee, T.-L.; Fancey, K.S.; Mi, J. Non-destructive testing and evaluation of composite materials/structures: A state-of-the-art review. Adv. Mech. Eng. 2020, 12. [Google Scholar] [CrossRef] [Green Version]
- Sun, Q.S.; He, Y.Z.; Liu, K.; Fan, S.T.; Parrott, E.P.J.; Pickwell-MacPherson, E. Recent advances in terahertz technology for biomedical applications. Quant. Imaging Med. Surg. 2017, 7, 345–355. [Google Scholar] [CrossRef] [PubMed] [Green Version]
- Zhuo-Yong, Z.; Xin, Z.; Chemistry, D.O.; University, C.N. Research and Application of Terahertz Spectroscopy and Imaging Techniques in the Biomedical Field. Spectrosc. Spectr. Anal. 2018, 38, 309–310. [Google Scholar]
- Li, D.; Yang, Z.; Fu, A.; Chen, T.; Wang, H. Detecting melanoma with a terahertz spectroscopy imaging technique. Spectrochim. Acta Part A Mol. Biomol. Spectrosc. 2020, 234, 118229. [Google Scholar] [CrossRef] [PubMed]
- Kaltenecker, K.; Zhou, B.; Tybussek, K.H.; Engelbrecht, S.; Fischer, B.M. Ultra-broadband THz spectroscopy for sensing and identification for security applications. In Proceedings of the 2018 43rd International Conference on Infrared, Millimeter, and Terahertz Waves (IRMMW-THz2018), Nagoya, Japan, 29 October 2018. [Google Scholar]
- Garcia-Rial, F.; Montesano, D.; Gomez, I.; Callejero, C.; Bazus, F.; Grajal, J. Combining Commercially Available Active and Passive Sensors Into a Millimeter-Wave Imager for Concealed Weapon Detection. IEEE Trans. Microw. Theory Tech. 2019, 67, 1167–1183. [Google Scholar] [CrossRef]
- Tzydynzhapov, G.; Gusikhin, P.; Muravev, V.; Dremin, A.; Nefyodov, Y.; Kukushkin, I. New Real-Time Sub-Terahertz Security Body Scanner. J. Infrared Millim. Terahertz Waves 2020, 41, 632–641. [Google Scholar] [CrossRef]
- Xu, F.; Mu, Q.D.D.; Li, L.J.; Yang, D.; Xia, B. Nondestructive Evaluation of Rubber Composites Using Terahertz Time Domain Spectroscopy. Fibres Text. East. Eur. 2018, 26, 67–72. [Google Scholar] [CrossRef]
- Hirakawa, Y.; Yasunnoto, Y.; Gondo, T. Evaluation of Rubber Products by Terahertz Time-domain Spectroscopy Carbon Black Dispersion and Vulcanization State. J. Infrared Millim. Terahertz Waves 2020, 41, 414–429. [Google Scholar] [CrossRef]
- Zhai, M.; Locquet, A.; Jung, M.; Woo, D.; Citrin, D.S. Nondestructive characterization of nanoporous alumina films using terahertz scattering imaging. Surf. Coat. Technol. 2021, 408, 126792. [Google Scholar] [CrossRef]
- Wang, C.; Qin, J.Y.; Xu, W.D.; Chen, M.; Xie, L.J.; Ying, Y.B. Terahertz Imaging Applications in Agriculture and Food Engineering: A Review. Trans. Asabe 2018, 61, 411–424. [Google Scholar] [CrossRef]
- Di Girolamo, F.V.; Pagano, M.; Tredicucci, A.; Bitossi, M.; Paoletti, R.; Barzanti, G.P.; Benvenuti, C.; Roversi, P.F.; Toncelli, A. Detection of fungal infections in chestnuts: A terahertz imaging-based approach. Food Control 2021, 123, 107700. [Google Scholar] [CrossRef]
- Hu, J.; Xu, Z.; Li, M.P.; He, Y.; Sun, X.D.; Liu, Y.D. Detection of Foreign-Body in Milk Powder Processing Based on Terahertz Imaging and Spectrum. J. Infrared Millim. Terahertz Waves 2021, 42, 878–892. [Google Scholar] [CrossRef]
- Ren, A.; Zahid, A.; Fan, D.; Yang, X.; Imran, M.A.; Alomainy, A.; Abbasi, Q.H. State-of-the-art in terahertz sensing for food and water security–A comprehensive review. Trends Food Sci. Technol. 2019, 85, 241–251. [Google Scholar] [CrossRef] [Green Version]
- Bowman, T.; El-Shenawee, M.; Campbell, L.K. Terahertz transmission vs reflection imaging and model-based characterization for excised breast carcinomas. Biomed. Opt. Express 2016, 7, 3756–3783. [Google Scholar] [CrossRef] [Green Version]
- Takashi, Y.; Yoichi, K.; Haruyoshi, T.; Hironori, T. Terahertz movie of internal transmission imaging. Opt. Express 2007, 15, 15583–15588. [Google Scholar]
- Shengyang, H.; Ashworth, P.C.; Kan, K.W.; Yang, C.; Wallace, V.P.; Yuan-Ting, Z.; Emma, P.-M. Improved sample characterization in terahertz reflection imaging and spectroscopy. Opt. Express 2009, 17, 3848–3854. [Google Scholar]
- Chen, L.-Q.; Gao, F.; Gong, X.-J.; Yang, J.; Lu, Y.-P.; Liu, W.-Q.; Feng, G.-Z.; Zhang, Y.-D.; Jin, L.; Yu, W.-L. Extraction of refractive indices of materials through transmission terahertz time-domain spectroscopy. J. Infrared Millim. Waves 2013, 32, 160–164. [Google Scholar] [CrossRef]
- Lian, F.Y.; Ge, H.Y.; Ju, X.J.; Zhang, Y.; Fu, M.X. Quantitative Analysis of Trans Fatty Acids in Cooked Soybean Oil Using Terahertz Spectrum. J. Appl. Spectrosc. 2019, 86, 917–924. [Google Scholar] [CrossRef]
- Mumtaz, M.; Mahmood, M.A.; Shahzad, A.; Khan, S.D.; Zia, M.A.; Ahmed, M.; Ahmad, I. Experimental Measurement of Temperature-Dependent Thermo-optical Parameters of Different Types of Olive Oil Using Terahertz Time-Domain Spectroscopy. J. Infrared Millim. Terahertz Waves 2020, 41, 1181–1188. [Google Scholar] [CrossRef]
- Auston, D.H.; Cheung, K.P.; Smith, P.R. Picosecond photoconducting Hertzian dipoles. Appl. Phys. Lett. 1984, 45, 284–286. [Google Scholar] [CrossRef]
- Hawecker, J.; Pistore, V.; Minasyan, A.; Maussang, K.; Palomo, J.; Sagnes, I.; Manceau, J.-M.; Colombelli, R.; Tignon, J.; Mangeney, J.; et al. Cavity-based photoconductive sources for real-time terahertz imaging. Photonics Res. 2020, 8, 858–863. [Google Scholar] [CrossRef]
- Guerboukha, H.; Nallappan, K.; Skorobogatiy, M. Toward real-time terahertz imaging. Adv. Opt. Photonics 2018, 10, 843–938. [Google Scholar] [CrossRef]
- Stantchev, R.I.; Yu, X.; Blu, T.; Pickwell-MacPherson, E. Real-time terahertz imaging with a single-pixel detector. Nat. Commun. 2020, 11, 1–8. [Google Scholar] [CrossRef] [PubMed]
- Okada, K.; Serita, K.; Zang, Z.; Murakami, H.; Kawayama, I.; Cassar, Q.; Macgrogan, G.; Guillet, J.-P.; Mounaix, P.; Tonouchi, M. Scanning laser terahertz near-field reflection imaging system. Appl. Phys. Express 2019, 12, 122005. [Google Scholar] [CrossRef]
- Zhi-yong, T.; Wen-jian, W. Progress in real-time imaging based on terahertz quantum-cascade lasers. Chin. Opt. 2017, 10, 68–76. [Google Scholar] [CrossRef]
- Fujita, K.; Jung, S.; Jiang, Y.; Kim, J.H.; Nakanishi, A.; Ito, A.; Hitaka, M.; Edamura, T.; Belkin, M.A. Recent progress in terahertz difference-frequency quantum cascade laser sources. Nanophotonics 2018, 7, 1795–1817. [Google Scholar] [CrossRef]
- Tan, Z.-Y.; Wan, W.-J.; Cao, J.-C. Research progress in terahertz quantum-cascade lasers and quantum-well photodetectors. Chin. Phys. B 2020, 29, 084212. [Google Scholar] [CrossRef]
- Wan, M.; Healy, J.J.; Sheridan, J.T. Terahertz phase imaging and biomedical applications. Opt. Laser Technol. 2020, 122, 105859. [Google Scholar] [CrossRef]
- Rahman, A.; Rahman, A.K. Nanoscale Metrology of Line Patterns on Semiconductor by Continuous Wave Terahertz Multispectral Reconstructive 3-D Imaging Overcoming the Abbe Diffraction Limit. IEEE Trans. Semicond. Manuf. 2019, 32, 7–13. [Google Scholar] [CrossRef]
- Costa, F.B.; Machado, M.A.; Bonfait, G.J.; Vieira, P.; Santos, T.G. Continuous wave terahertz imaging for NDT: Fundamentals and experimental validation. Measurement 2021, 172, 108904. [Google Scholar] [CrossRef]
- Kleine-Ostmann, T.; Knobloch, P.; Koch, M.; Hoffmann, S.; Pierz, K. Compact and Cost-Effective Continuous Wave THz Imaging System. In Proceedings of the Summaries of Papers Presented at the Lasers and Electro-Optics, CLEO’02, Long Beach, CA, USA, 24–24 May 2002. [Google Scholar]
- Wu, D.H.; Graber, B.; Kim, C.; Qadri, S.B.; Garzarella, A. Coherent and incoherent terahertz beams measured from a terahertz photoconductive antenna. Appl. Phys. Lett. 2014, 104, 051126. [Google Scholar] [CrossRef]
- Zhang, Y.; Peng, X.H.; Chen, Y.; Chen, J.; Curioni, A.; Andreoni, W.; Nayak, S.K.; Zhang, X.C. A first principle study of terahertz (THz) spectra of acephate. Chem. Phys. Lett. 2008, 452, 59–66. [Google Scholar] [CrossRef]
- Dorney, T.D.; Baraniuk, R.G.; Mittleman, D.M. Material parameter estimation with terahertz time-domain spectroscopy. J. Opt. Soc. Am. A Opt. Image Sci. Vis. 2001, 18, 1562–1571. [Google Scholar] [CrossRef] [Green Version]
- Duvillaret, L.; Garet, F.; Coutaz, J.L. A reliable method for extraction of material parameters in terahertz time-domain spectroscopy. IEEE J. Sel. Top. Quantum Electron. 2002, 2, 739–746. [Google Scholar] [CrossRef] [Green Version]
- Bassiri, S.; Papas, C.H.; Engheta, N. Electromagnetic wave propagation through a dielectric-chiral interface and through a chiral slab. J. Opt. Soc. Am. A 1988, 5, 1450–1459. [Google Scholar] [CrossRef] [Green Version]
- Zhang, J.-H.; Zhang, Y.; Shi, Z.-G. Enhancement of dim targets in a sea background based on long-wave infrared polarisation features. Image Process. Iet 2018, 12, 2042–2050. [Google Scholar] [CrossRef]
- Ge, H.-Y.; Jiang, Y.-Y.; Lian, F.-Y.; Zhang, Y.; Xia, S.-H. Nondestructive Evaluation of Wheat Quality Using Terahertz Time Domain Spectroscopy. Spectrosc. Spectr. Anal. 2014, 34, 2897–2900. [Google Scholar]
- Cao, Y.; Huang, P.; Chen, J.; Ge, W.; Zhang, G. Qualitative and quantitative detection of liverinjury with terahertz time-domain spectroscopy. Biomed. Opt. Express 2020, 11, 982–993. [Google Scholar] [CrossRef]
- May, R.; Taday, P.F. Crystallization of sucrose monitored by terahertz pulsed spectroscopy. In Proceedings of the 2013 38th International Conference on Infrared, Millimeter, and Terahertz Waves (IRMMW-THz), Mainz, Germany, 1–6 September 2013. [Google Scholar]
- Gua, T.; Ding, Z.; Zhang, D.; Zhou, J.; Chen, X. Evaluation of wheat seeds by terahertz imaging. In Proceedings of the Millimeter Waves & Thz Technology Workshop, Rome, Italy, 9–11 September 2013. [Google Scholar]
- Penkov, N.V.; Goltyaev, M.V.; Astashev, M.E.; Serov, D.A.; Moskovskiy, M.N.; Khort, D.O.; Gudkov, S.V. The Application of Terahertz Time-Domain Spectroscopy to Identification of Potato Late Blight and Fusariosis. Pathogens 2021, 10, 1336. [Google Scholar] [CrossRef] [PubMed]
- Wei, X.; Li, S.; Zhu, S.P.; Zheng, W.Q.; Xie, Y.; Zhou, S.L.; Hu, M.D.; Miao, Y.J.; Ma, L.K.; Wu, W.J.; et al. Terahertz spectroscopy combined with data dimensionality reduction algorithms for quantitative analysis of protein content in soybeans. Spectrochim. Acta Part A-Mol. Biomol. Spectrosc. 2021, 253, 119571. [Google Scholar] [CrossRef] [PubMed]
- Jiang, Y.-Y.; Ge, H.-y.; Zhang, Y. Quantitative Determination of Maltose Concentration in Wheat by Using Terahertz Imaging. Spectrosc. Spectr. Anal. 2018, 38, 3017–3022. [Google Scholar] [CrossRef]
- Jiang, Y.Y.; Ge, H.Y.; Zhang, Y. Quantitative analysis of wheat maltose by combined terahertz spectroscopy and imaging based on Boosting ensemble learning. Food Chem. 2020, 307, 125533. [Google Scholar] [CrossRef]
- Qin, J.; Xie, L.; Ying, Y. Feasibility of Terahertz Time-Domain Spectroscopyto Detect Tetracyclines Hydrochloride in Infant Milk Powder. Anal. Chem. 2014, 86, 11750–11757. [Google Scholar] [CrossRef]
- Afsah-Hejri, L.; Hajeb, P.; Ara, P.; Ehsani, R.J. A Comprehensive Review on Food Applications of Terahertz Spectroscopy and Imaging. Compr. Rev. Food Sci. Food Saf. 2019, 18, 1563–1621. [Google Scholar] [CrossRef] [PubMed]
- Federici, J.F. Review of Moisture and Liquid Detection and Mapping using Terahertz Imaging. J. Infrared Millim. Terahertz Waves 2012, 33, 97–126. [Google Scholar] [CrossRef]
- Ogawa, Y.; Hayashi, S.i.; Kondo, N.; Ninomiya, K.; Otani, C.; Kawase, K. Feasibility on the Quality Evaluation of Agricultural Products with Terahertz Electromagnetic Wave. In Proceedings of the 2006 ASAE Annual Meeting, Portland, OR, USA, 9–12 July 2006. [Google Scholar]
- Nie, P.C.; Qu, F.F.; Lin, L.; Dong, T.; He, Y.; Shao, Y.N.; Zhang, Y. Detection of Water Content in Rapeseed Leaves Using Terahertz Spectroscopy. Sensors 2017, 17, 2830. [Google Scholar] [CrossRef] [Green Version]
- Yasui, T.; Araki, T. Sensitive Measurement of Water Content in dry Material Using Low-Frequency Terahertz Time-Domain Spectroscopy System Equipped with Micro-Structured Photoconductive Antennas. In Proceedings of the European Optical Society: 1st EOS Topical Meeting on Micro and Nano-Optoeletronic Systems, Bremen, Germany, 7–9 December 2011. [Google Scholar]
- Shchepetilnikov, A.V.; Zarezin, A.M.; Muravev, V.M.; Gusikhin, P.A.; Kukushkin, I.V. Quantitative analysis of water content and distribution in plants using terahertz imaging. Opt. Eng. 2020, 59, 061617. [Google Scholar] [CrossRef]
- Zang, Z.; Wang, J.; Cui, H.-L.; Yan, S. Terahertz spectral imaging based quantitative determination of spatial distribution of plant leaf constituents. Plant Methods 2019, 15, 1–11. [Google Scholar] [CrossRef] [PubMed] [Green Version]
- Song, Z.; Yan, S.; Zang, Z.; Fu, Y.; Wei, D.; Cui, H.; Lai, P. Temporal and spatial variability of water status in plant leaves by terahertz imaging. IEEE Trans. Terahertz Ence Technol. 2018, 8, 520–527. [Google Scholar] [CrossRef]
- Wei, X.; Zheng, W.; Zhu, S.; Zhou, S.; Wu, W.; Xie, Z. Application of terahertz spectrum and interval partial least squares method in the identification of genetically modified soybeans. Spectrochim. Acta Part A-Mol. Biomol. Spectrosc. 2020, 238, 118453. [Google Scholar] [CrossRef]
- Luo, H.; Zhu, J.; Xu, W.; Cui, M. Identification of soybean varieties by terahertz spectroscopy and integrated learning method. Optik 2019, 184, 177–184. [Google Scholar] [CrossRef]
- Lu, M.-h.; Shen, J.-l. Identification of maize seeds using terahertz transmitted spectral imaging. Opt. Tech. 2006. [Google Scholar] [CrossRef]
- Qin, B.Y.; Li, Z.; Chen, T.; Chen, Y. Identification of genetically modified cotton seeds by terahertz spectroscopy with MPGA-SVM. Optik 2017, 142, 576–582. [Google Scholar] [CrossRef]
- Liu, W.; Liu, C.; Hu, X.; Yang, J.; Zheng, L. Application of terahertz spectroscopy imaging for discrimination of transgenic rice seeds with chemometrics. Food Chem. 2016, 210, 415–421. [Google Scholar] [CrossRef]
- Jiang, Y.; Ge, H.; Lian, F.; Zhang, Y.; Xia, S. Early detection of germinated wheat grains using terahertz image and chemometrics. Sci. Rep. 2016, 6, 1299. [Google Scholar] [CrossRef] [Green Version]
- Jiang, Y.; Ge, H.; Lian, F.; Zhang, Y.; Xia, S. Discrimination of moldy wheat using terahertz imaging combined with multivariate classification. Rsc Adv. 2015, 5, 93979–93986. [Google Scholar] [CrossRef]
- Li, H.; Wu, J.; Liu, C.; Sun, X.; Yu, L. Study on Pretreatment Methods of Terahertz Time Domain Spectral Image for Maize Seeds. IFAC-PapersOnLine 2018, 51, 206–210. [Google Scholar] [CrossRef]
- Lee, D.K.; Kim, G.; Kim, C.; Jhon, Y.M.; Kim, J.H.; Lee, T.; Son, J.H.; Seo, M. Ultrasensitive Detection of Residual Pesticides Using THz Near-Field Enhancement. IEEE Trans. Terahertz Sci. Technol. 2016, 6, 389–395. [Google Scholar] [CrossRef]
- Nie, P.C.; Qu, F.F.; Lin, L.; He, Y.; Feng, X.P.; Yang, L.; Gao, H.Q.; Zhao, L.H.; Huang, L.X. Trace Identification and Visualization of Multiple Benzimidazole Pesticide Residues on Toona sinensis Leaves Using Terahertz Imaging Combined with Deep Learning. Int. J. Mol. Sci. 2021, 22, 3425. [Google Scholar] [CrossRef]
- Lee, D.-K.; Kim, G.; Son, J.-H.; Seo, M. Highly sensitive terahertz spectroscopy of residual pesticide using nano-antenna. In Proceedings of the Terahertz, RF, Millimeter, and Submillimeter-Wave Technology and Applications IX, International Society for Optics and Photonics, San Francisco, CA, USA, 25 February 2016. [Google Scholar]
- Xu, W.; Xie, L.; Ying, Y. Mechanisms and applications of terahertz metamaterial sensing: A review. Nanoscale 2017, 9, 13864. [Google Scholar] [CrossRef] [PubMed]
- Jiang, Y.; Ge, H.; Zhang, Y. Detection of foreign bodies in grain with terahertz reflection imaging. Optik 2019, 181, 1130–1138. [Google Scholar] [CrossRef]
- Shen, Y.; Yin, Y.X.; Li, B.; Zhao, C.J.; Li, G.L. Detection of impurities in wheat using terahertz spectral imaging and convolutional neural networks. Comput. Electron. Agric. 2021, 181, 105931. [Google Scholar] [CrossRef]
- Lee, Y.K.; Choi, S.W.; Han, S.T.; Woo, D.H.; Chun, H.S. Detection of Foreign Bodies in Foods Using Continuous Wave Terahertz Imaging. J. Food Prot. 2012, 75, 179–183. [Google Scholar] [CrossRef]
- Ok, G.; Kim, H.J.; Chun, H.S.; Choi, S.W. Foreign-body detection in dry food using continuous sub-terahertz wave imaging. Food Control 2014, 42, 284–289. [Google Scholar] [CrossRef]
- Ok, G.; Park, K.; Lim, M.-C.; Jang, H.-J.; Choi, S.-W. 140-GHz subwavelength transmission imaging for foreign body inspection in food products. J. Food Eng. 2018, 221, 124–131. [Google Scholar] [CrossRef]
- Shin, H.J.; Choi, S.W.; Ok, G. Qualitative identification of food materials by complex refractive index mapping in the terahertz range. Food Chem. 2018, 245, 282–288. [Google Scholar] [CrossRef]
- Yoneda, S.; Kato, M.; Murate, K.; Kawase, K. THz spectroscopic imaging of reagents hidden in a 56 dB attenuated cardboard box using is-TPG. In Proceedings of the 2017 42nd International Conference on Infrared, Millimeter, and Terahertz Waves (IRMMW-THz), Cancun, Mexico, 27 August–1 September 2017. [Google Scholar]
- Wang, C.; Zhou, R.; Huang, Y.; Xie, L.; Ying, Y. Terahertz spectroscopic imaging with discriminant analysis for detecting foreign materials among sausages. Food Control 2018, 97, 100–104. [Google Scholar] [CrossRef]
- Shin, H.J.; Oh, S.J.; Lim, M.C.; Choi, S.W.; Ok, G. Dielectric traces of food materials in the terahertz region. Infrared Phys. Technol. 2018, 92, 128–133. [Google Scholar] [CrossRef]
- Kondoh, M.; Ohshima, Y.; Tsubouchi, M. Ion effects on the structure of water studied by terahertz time-domain spectroscopy. Chem. Phys. Lett. 2014, 591, 317–322. [Google Scholar] [CrossRef]
- Huang, Y.; Xu, W.; Qin, J.; Xie, L.; Ying, Y. Monitoring High-Absorption Aqueous Solution with Multiple Attenuated Total Reflection Terahertz Time-Domain Spectroscopy. In Proceedings of the 2018 ASABE Annual International Meeting, Detroit, MI, USA, 29 July–1 August 2018. [Google Scholar]
- Limei, G.; Honglei, Z.; Jing, Z.; Kun, Z. Applications and prospect of 3D printing for oil-gas resources evaluation. Phys. Eng. 2017, 27, 77–83. [Google Scholar]
- Cheon, H.; Yang, H.-J.; Son, J.-H. Toward Clinical Cancer Imaging Using Terahertz Spectroscopy. IEEE J. Sel. Top. Quantum Electron. 2017, 23, 1–9. [Google Scholar] [CrossRef]
- Mikerov, M.; Ornik, J.; Koch, M. Removing Water Vapor Lines from THz TDS Data Using Neural Networks. IEEE Trans. Terahertz Sci. Technol. 2020, 10, 397–403. [Google Scholar] [CrossRef]
- Ji, J.; Jiang, J.; Chen, J.; Du, F.; Huang, P. Scattering reduction of perfectly electric conductive cylinder by coating plasma and metamaterial. Optik 2018, 161, 98–105. [Google Scholar] [CrossRef]
- Malevich, V.L.; Sinitsyn, G.V.; Sochilin, G.B.; Rosanov, N.N. Manifestations of Radiation Scattering in the Method of Pulsed Terahertz Spectroscopy. Opt. Spectrosc. 2018, 124, 889–894. [Google Scholar] [CrossRef]
- Marczewski, J.; Coquillat, D.; Knap, W.; Kolacinski, C.; Kopyt, P.; Kucharski, K.; Lusakowski, J.; Obrebski, D.; Tomaszewski, D.; Yavorskiy, D.; et al. THz detectors based on Si-CMOS technology field effect transistors–advantages, limitations and perspectives for THz imaging and spectroscopy. Opto-Electron. Rev. 2018, 26, 261–269. [Google Scholar] [CrossRef]
- Yeo, W.G.; Nahar, N.K. Characterization of a THz CW spectrometer pumped at 1550 nm. Infrared Phys. Technol. 2015, 71, 70–76. [Google Scholar] [CrossRef]
- Shin, H.J.; Lim, M.-C.; Kim, S.-H.; Park, K.; Choi, S.-W.; Ok, G. Thermally controllable filter at terahertz region. Infrared Phys. Technol. 2018, 88, 139–143. [Google Scholar] [CrossRef]
- Won, S.; Jung, H.-J.; Kim, D.; Lee, S.-H.; Kim, J.-H. Graphene-based crack lithography for high-throughput fabrication of terahertz metamaterials. Carbon 2019, 158, 505–512. [Google Scholar] [CrossRef]
- Shen, Y.C.; Yang, X.Y.; Zhang, Z.J. Broadband terahertz time-domain spectroscopy and fast FMCW imaging: Principle and applications. Chin. Phys. B 2020, 29, 078705. [Google Scholar] [CrossRef]
- Ok, G.; Shin, H.J.; Lim, M.-C.; Choi, S.-W. Large-scan-area sub-terahertz imaging system for nondestructive food quality inspection. Food Control 2019, 96, 383–389. [Google Scholar] [CrossRef]
- Mou, F.A.; Rahman, M.M.; Islam, M.R.; Bhuiyan, M.I.H. Development of a photonic crystal fiber for THz wave guidance and environmental pollutants detection. Sens. Bio-Sens. Res. 2020, 29, 100346. [Google Scholar] [CrossRef]
- Suzuki, D.; Kawano, Y. Flexible terahertz imaging systems with single-walled carbon nanotube films. Carbon 2020, 162, 13–24. [Google Scholar] [CrossRef]
- Yan, X.; Yang, M.; Zhang, Z.; Liang, L.; Wei, D.; Wang, M.; Zhang, M.; Wang, T.; Liu, L.; Xie, J.; et al. The terahertz electromagnetically induced transparency-like metamaterials for sensitive biosensors in the detection of cancer cells. Biosens. Bioelectron. 2018, 126, 485–492. [Google Scholar] [CrossRef]
- Khalatpour, A.; Paulsen, A.K.; Deimert, C.; Wasilewski, Z.R.; Hu, Q. High-power portable terahertz laser systems. Nat. Photonics 2021, 15, 16–20. [Google Scholar] [CrossRef]
- Lei, T.; Tobin, B.; Liu, Z.H.; Yang, S.Y.; Sun, D.W. A terahertz time-domain super-resolution imaging method using a local-pixel graph neural network for biological products. Anal. Chim. Acta. 2021, 1181, 338898. [Google Scholar] [CrossRef]
- Wang, Y.; Qi, F.; Wang, J.K. Terahertz image super-resolution based on a complex convolutional neural network. Opt. Lett. 2021, 46, 3123–3126. [Google Scholar] [CrossRef] [PubMed]
- Shi, C.J.; Zhu, J.; Xu, M.Q.; Wu, X.; Peng, Y. An Approach of Spectra Standardization and Qualitative Identification for Biomedical Materials Based on Terahertz Spectroscopy. Sci. Program. 2020, 2020, 8841565. [Google Scholar] [CrossRef]
Figure 1.
THz spectral imaging system and applications.
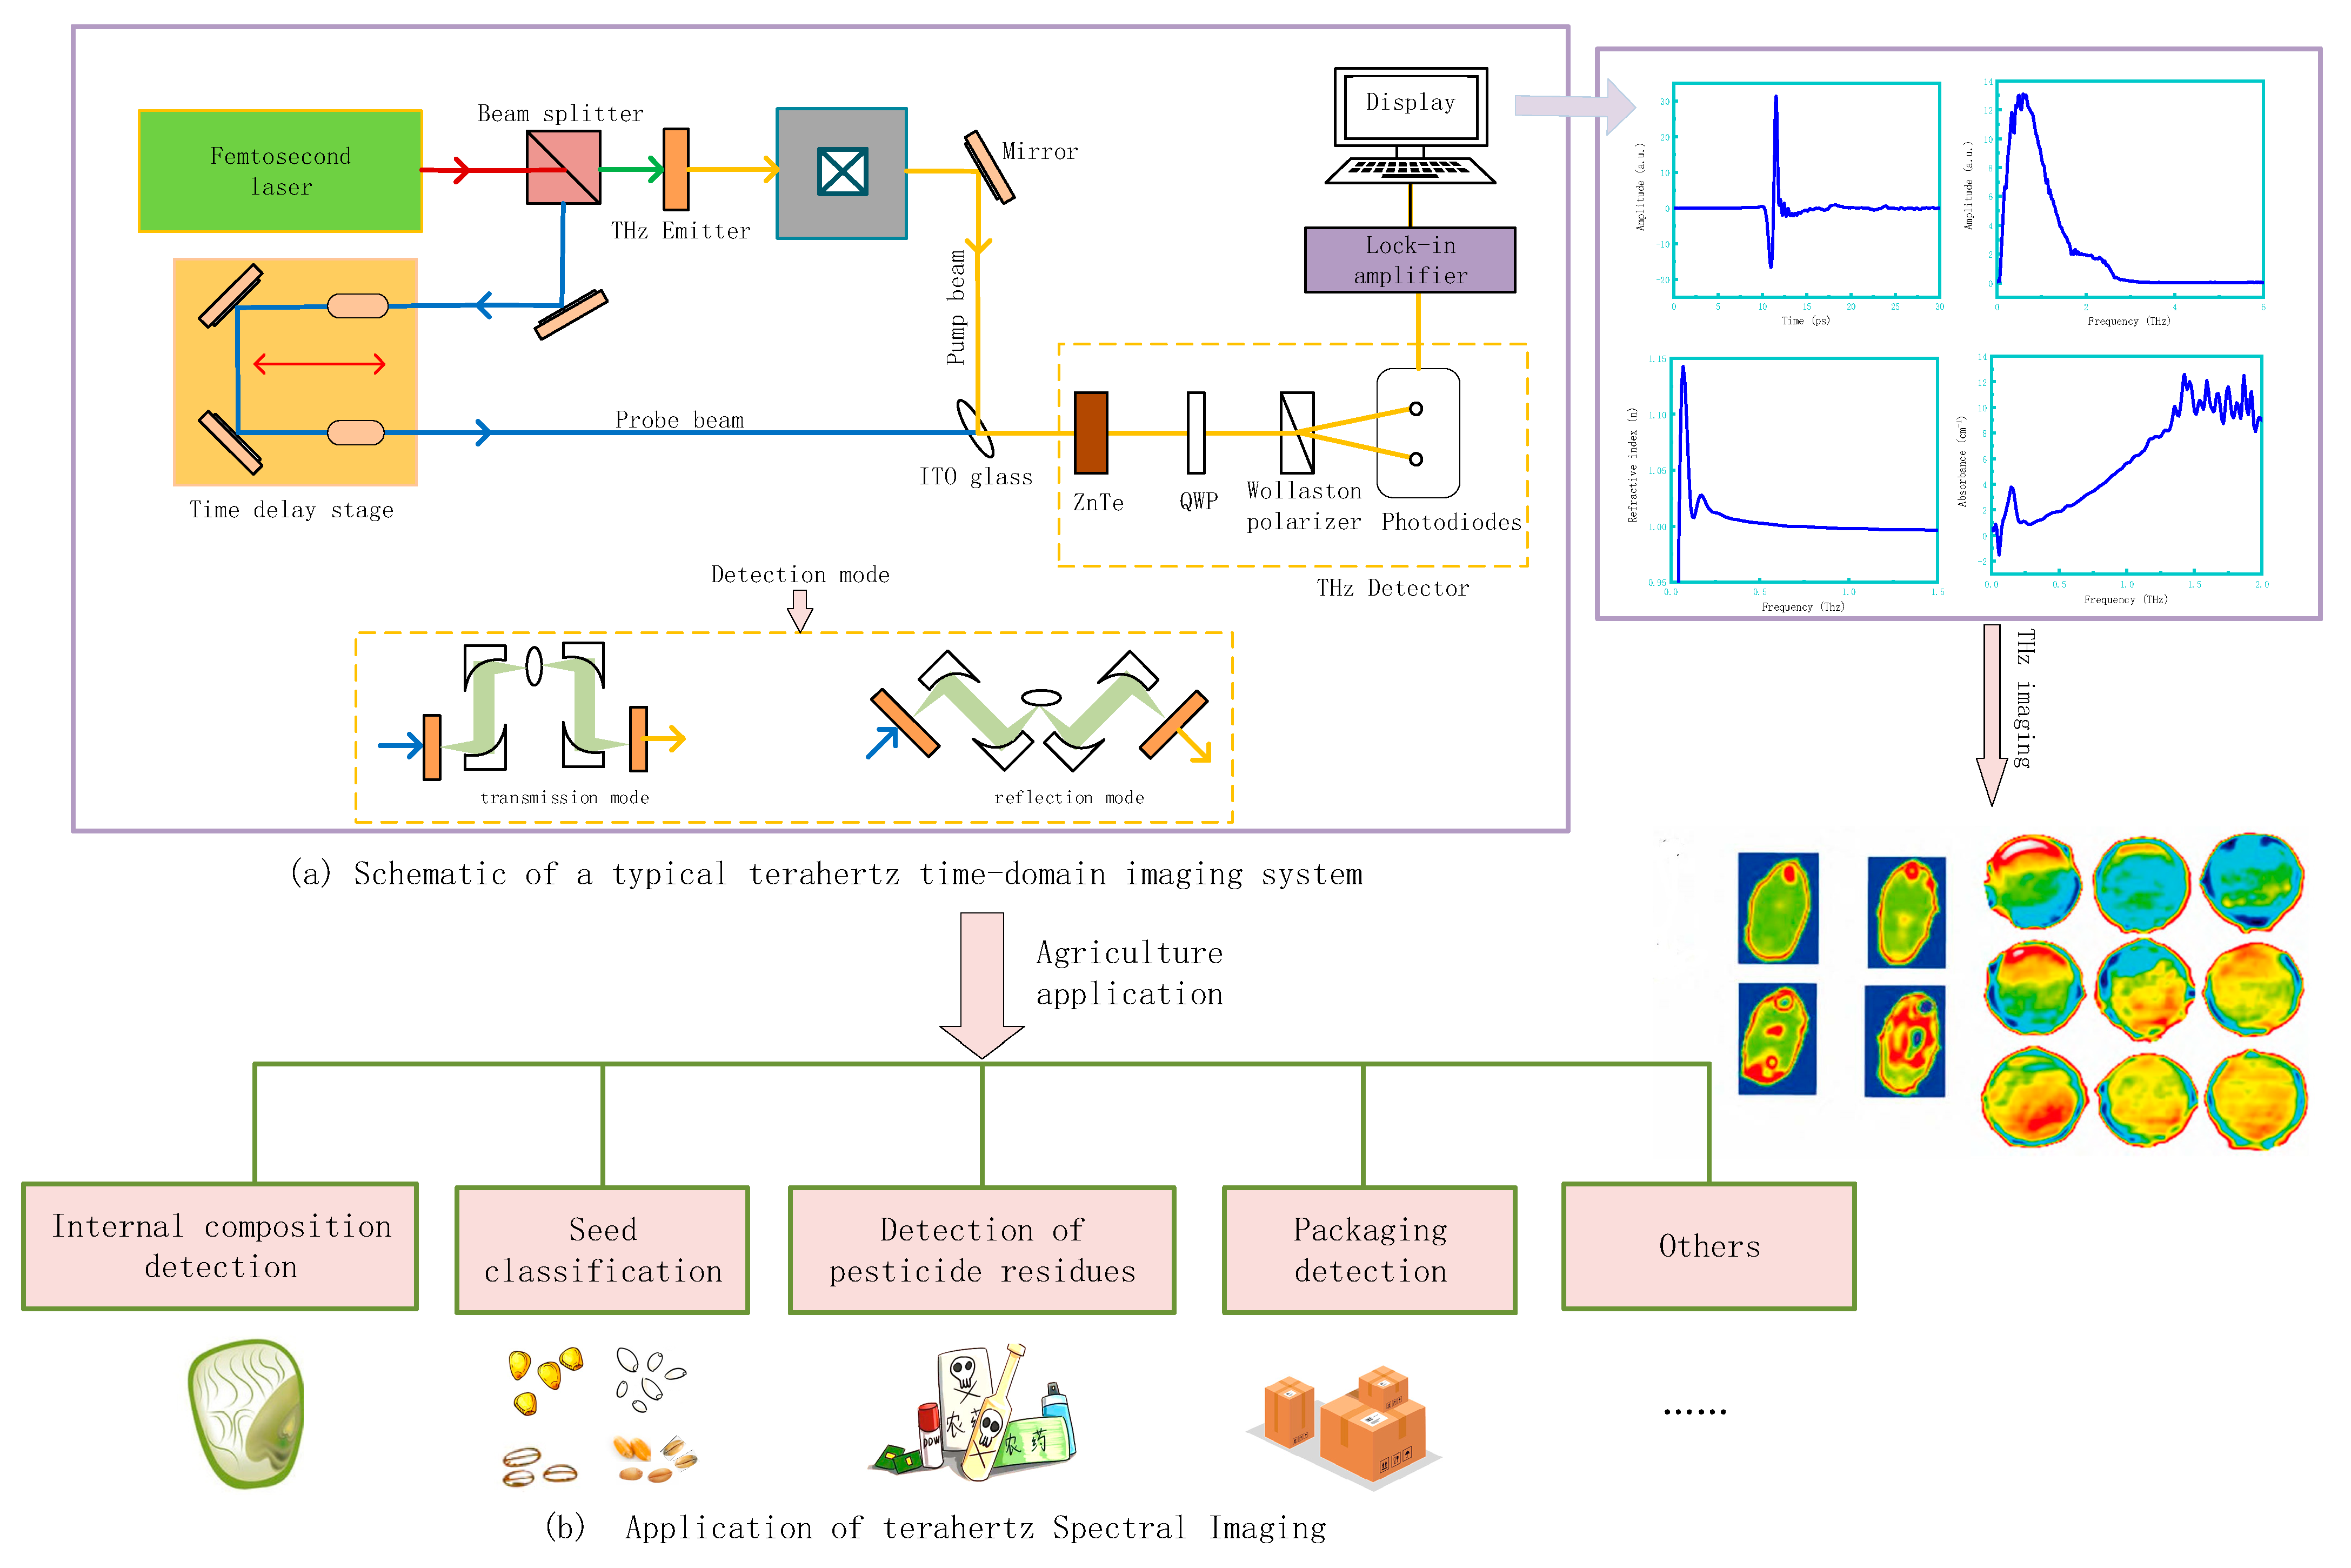
Figure 2.
THz absorption spectra of maltose mixtures: (a) the maltose and polyethylene mixtures; (b) the maltose and wheat starch mixtures [66].
Figure 2.
THz absorption spectra of maltose mixtures: (a) the maltose and polyethylene mixtures; (b) the maltose and wheat starch mixtures [66].

Figure 3.
THz images of maltose mixtures: (a) the maltose and polyethylene mixtures; (b) the maltose and wheat starch mixtures [66].
Figure 3.
THz images of maltose mixtures: (a) the maltose and polyethylene mixtures; (b) the maltose and wheat starch mixtures [66].
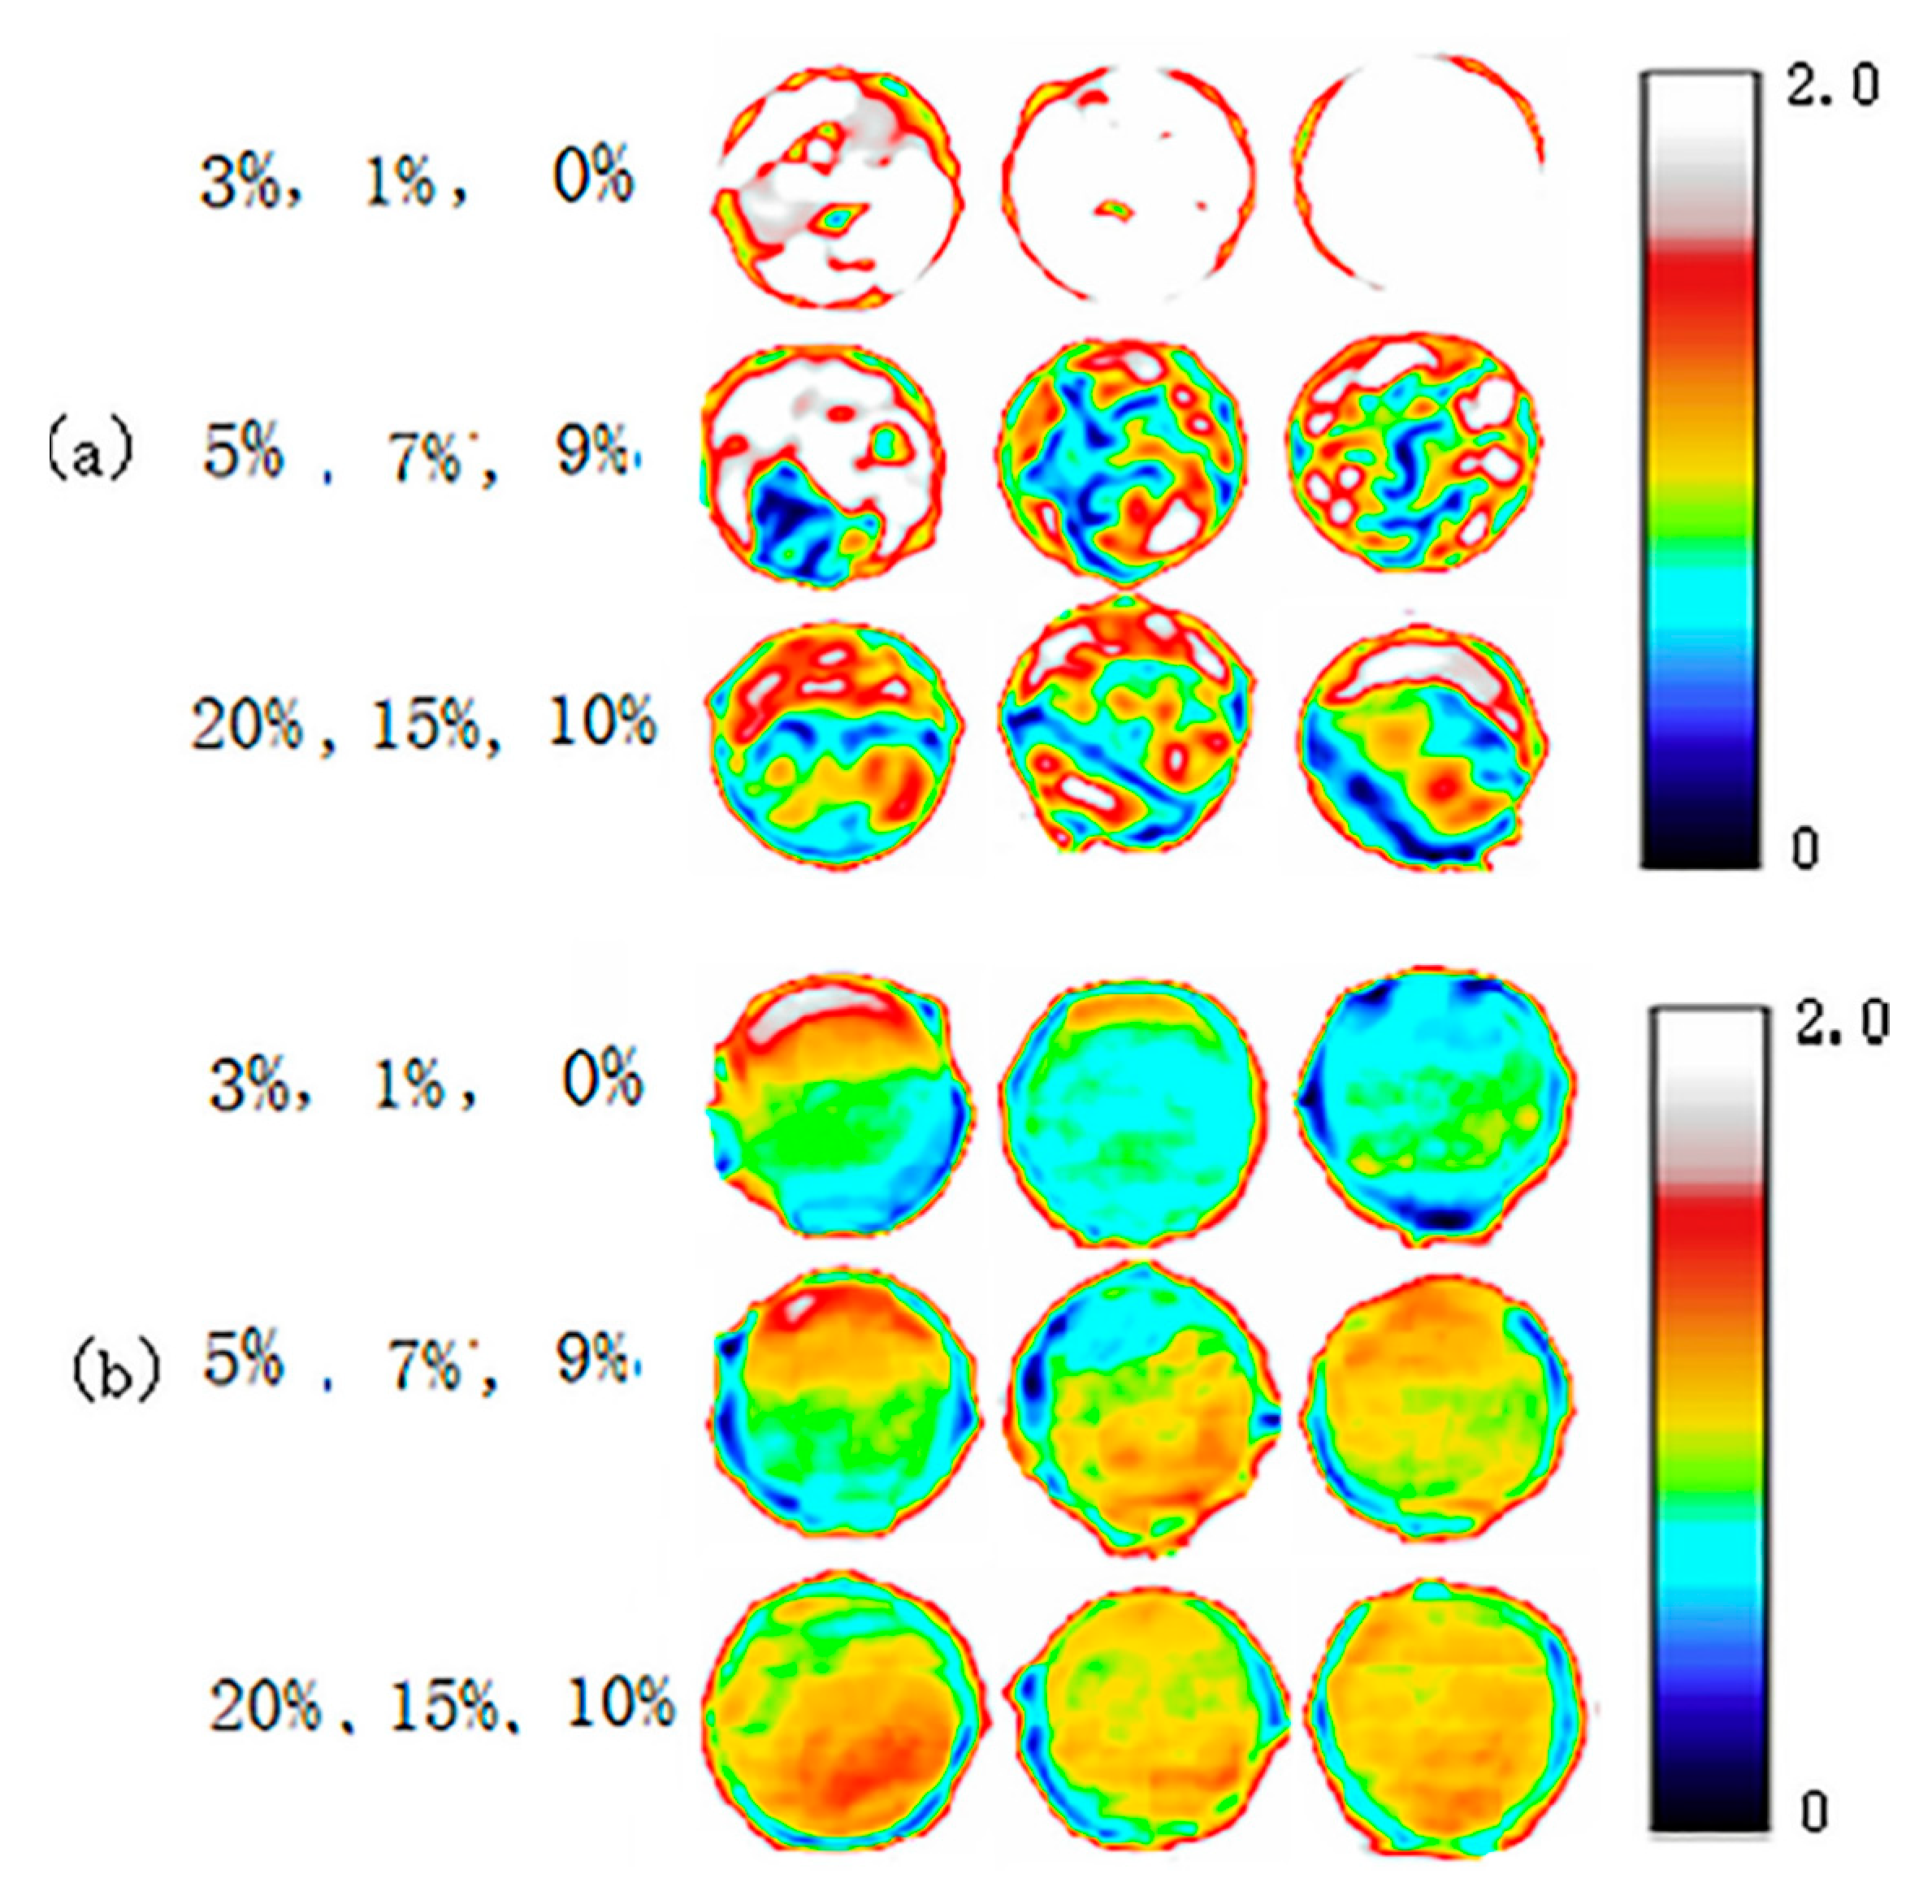
Figure 4.
(A) Embryo region location extraction process; (B) endosperm region location extraction process. (Reprinted/Adapted) with permission from [83] © 2016, IFAC Hosting by Elsevier Ltd.
Figure 4.
(A) Embryo region location extraction process; (B) endosperm region location extraction process. (Reprinted/Adapted) with permission from [83] © 2016, IFAC Hosting by Elsevier Ltd.

Figure 5.
(a) Photograph of the apple peel with methomyl stain (green dashed circle). The white dashed line is the positioned nano-slot-antenna region. (b) Normalized THz reflection image taken through the nano-slot-antenna attached to the apple peel sample with a residual methomyl stain. (Reprinted/Adapted) with permission from [84] © 2016, IEEE.
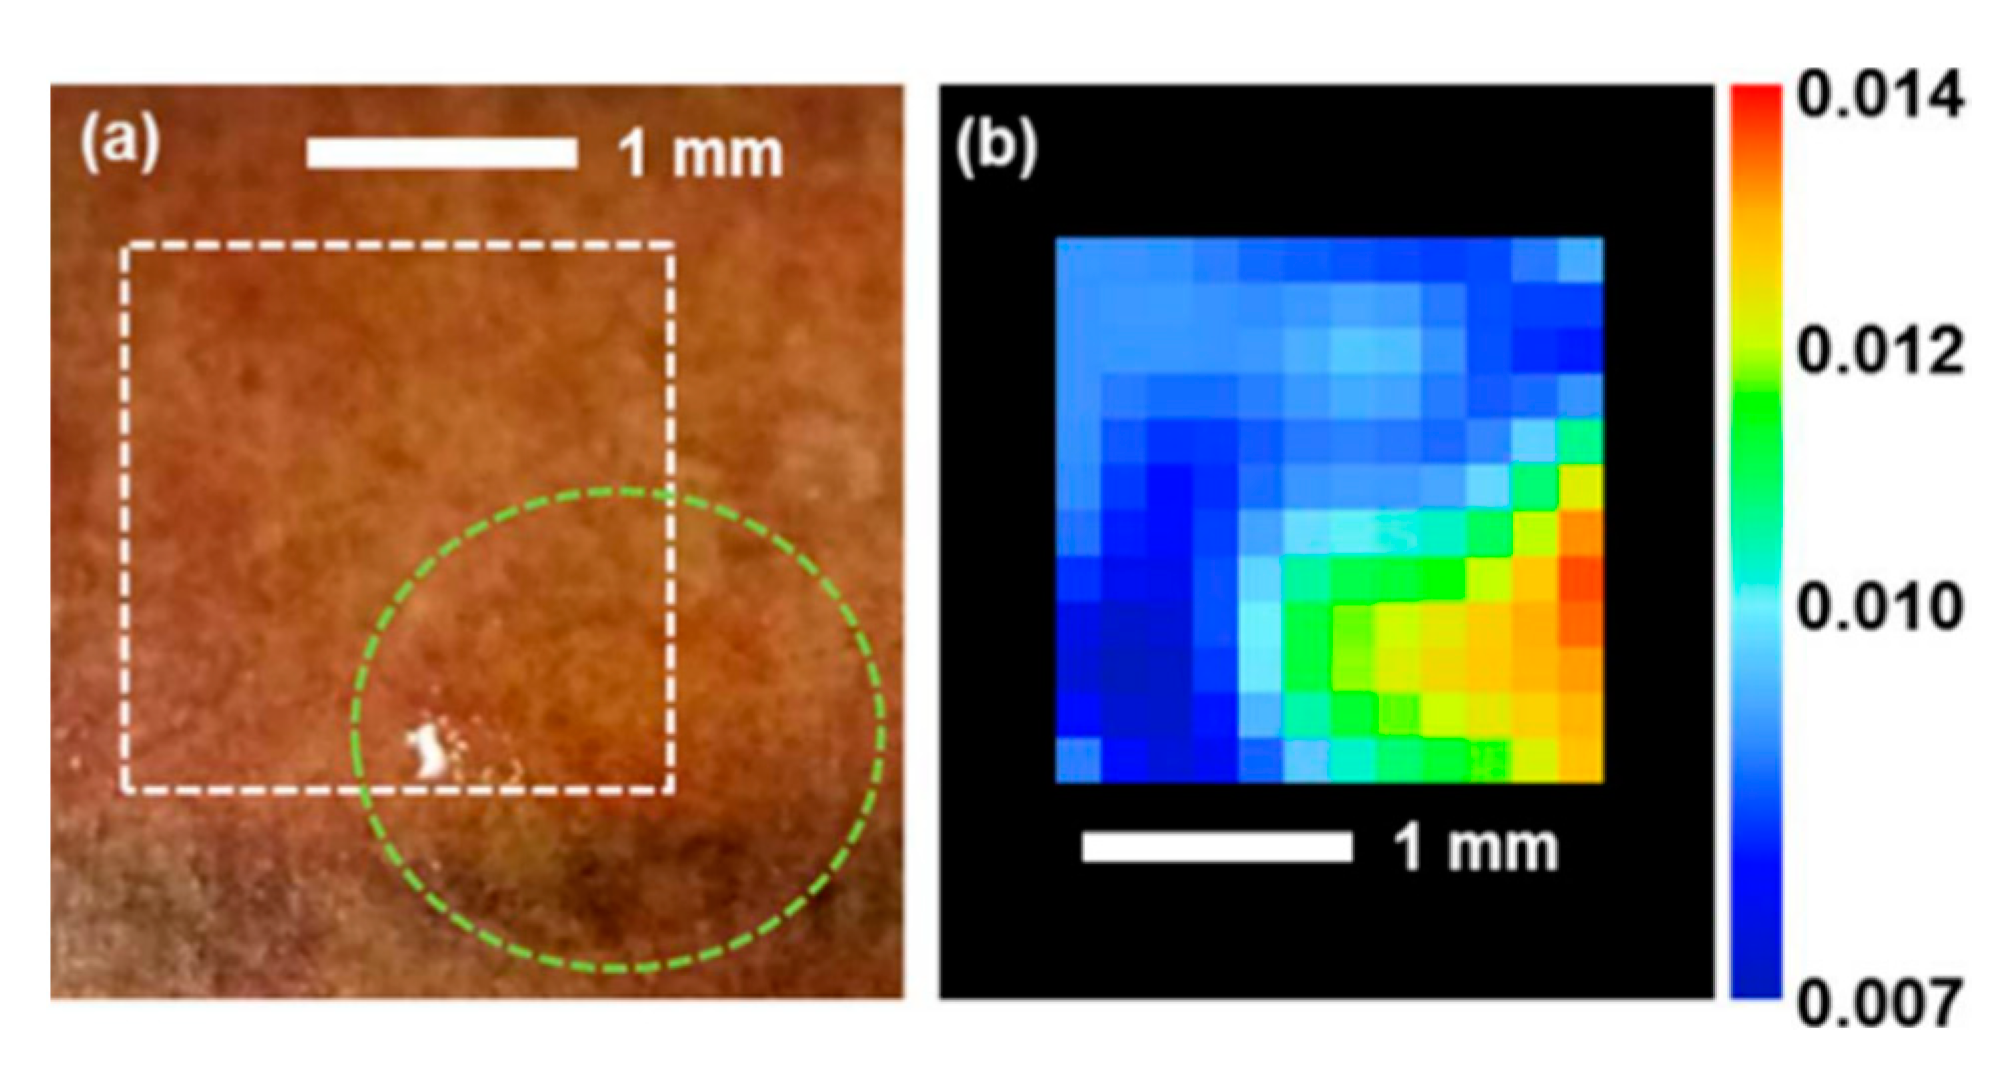
Figure 6.
(a) The optical image of rice, sugar, salt, and mealworm pellet samples and their reflective THz images at THz frequency of (b) 1 THz, (c) 0.5 THz, and (d) 1.2 THz. (Reprinted/Adapted) with permission from [93] © 2017, Elsevier Ltd.
Figure 6.
(a) The optical image of rice, sugar, salt, and mealworm pellet samples and their reflective THz images at THz frequency of (b) 1 THz, (c) 0.5 THz, and (d) 1.2 THz. (Reprinted/Adapted) with permission from [93] © 2017, Elsevier Ltd.

Table 1.
Common THz spectral imaging techniques and their characteristics.
| Source Type | Imaging Technology | Time Domain | Frequency Domain | Spectral Resolution | System Complexity | Imaging Speed |
|---|---|---|---|---|---|---|
| Pulse THz | Time-domain imaging | Yes | Yes | low | high | slow |
| Real-time imaging | Yes | Yes | low | high | fast | |
| Near field imaging | Yes | Yes | low | high | slow | |
| Continuous THz | Coherent detection | Yes | Yes | high | low | fast |
| Incoherent detection | No | No | high | low | fast |
Publisher’s Note: MDPI stays neutral with regard to jurisdictional claims in published maps and institutional affiliations. |
© 2021 by the authors. Licensee MDPI, Basel, Switzerland. This article is an open access article distributed under the terms and conditions of the Creative Commons Attribution (CC BY) license (https://creativecommons.org/licenses/by/4.0/).
Share and Cite
MDPI and ACS Style
Ge, H.; Lv, M.; Lu, X.; Jiang, Y.; Wu, G.; Li, G.; Li, L.; Li, Z.; Zhang, Y. Applications of THz Spectral Imaging in the Detection of Agricultural Products. Photonics 2021, 8, 518. https://doi.org/10.3390/photonics8110518
AMA Style
Ge H, Lv M, Lu X, Jiang Y, Wu G, Li G, Li L, Li Z, Zhang Y. Applications of THz Spectral Imaging in the Detection of Agricultural Products. Photonics. 2021; 8(11):518. https://doi.org/10.3390/photonics8110518
Chicago/Turabian StyleGe, Hongyi, Ming Lv, Xuejing Lu, Yuying Jiang, Guofang Wu, Guangming Li, Li Li, Zhi Li, and Yuan Zhang. 2021. "Applications of THz Spectral Imaging in the Detection of Agricultural Products" Photonics 8, no. 11: 518. https://doi.org/10.3390/photonics8110518
Note that from the first issue of 2016, this journal uses article numbers instead of page numbers. See further details here.