Pulse Length Monitor for Breakdown Diagnostics in THz and Mm-Wave Accelerators
by
 , ,
, ,
Sergey V. Kutsaev
1,* ,
,
Vladimir Goncharik
2,
Alex Murokh
1,
Ilya Rezanov
1,
Dmitry Shchegolkov
1 and
Alexander Y. Smirnov
1 1
RadiaBeam Technologies LLC, 1717 Stewart St., Santa Monica, CA 90403, USA
2
Logicware Inc., New York, NY 11235, USA
*
Author to whom correspondence should be addressed.
Photonics 2021, 8(10), 442; https://doi.org/10.3390/photonics8100442
Submission received: 9 September 2021
/
Revised: 9 October 2021
/
Accepted: 11 October 2021
/
Published: 14 October 2021
(This article belongs to the Special Issue Frontiers in Terahertz Technology and Applications)
Abstract
:The development of novel high-gradient accelerating structures operating at THz frequencies is critical for future free-electron lasers and TeV scale linear colliders. To reach high energies with reasonable length requires high accelerating gradients of ~100 MV/m. The main limitation to reaching these high-energy gradients is the vacuum RF breakdown phenomenon, which disrupts normal accelerator operations. For stable operations and to understand the breakdown microscopic dynamics, a new device capable of detecting the breakdown occurrences is required. In this paper, we provide the design of a pulse length monitor based on an analog to digital converter for fast signal digitization without the need to use high-speed digitizers to be used in a commercial mm-wave heterodyne spectrometer.
1. Introduction
Novel high gradient accelerating structures operating in the THz frequency range are a key aspect for infrared free-electron lasers (FEL) and TeV scale linear colliders. These facilities will open new horizons in high-energy physics, and chemical and biological imaging [1]. To reach high energy with reasonable length requires high accelerating gradients of ~100 MV/m [2]. The main limitation to reaching these high-energy gradients is the vacuum RF breakdown (RFBD) phenomena, which disrupts normal accelerator operations [3]. For stable operations and to understand the RFBD microscopic dynamics, a new device capable of detecting breakdown occurrences is required.
Recently there has been a significant effort at SLAC National Accelerator Laboratory to push the accelerator operating frequency into W-band and beyond [4,5,6,7]. The advantage of higher frequencies is the potential to reach very high accelerating gradients (>200 MV/m). However, conditioning such structures is very difficult, as the conventional detection methods do not suffice. Suitable detectors must be able to resolve the actual RF breakdown in an accelerating structure from the RF signal fluctuations caused by jitter in the driving electron bunch, which in the case of mm waves masks the ns long RF signal. When RFBD occurs, abrupt changes in the RF signal are expected that reduce pulse width down to ~1 ns (or increase the frequency bandwidth by up to 10 GHz). Therefore, a shot-to-shot pulse-length monitor with a high resolution is required [8].
To solve this problem, we have developed a heterodyne spectrometer, shown in Figure 1 [9], which consists of mixing the pulsed signal from the accelerating structure with a local oscillator (f), operating at the reference frequency (f0), followed by digitization of two quadrature signals with a frequency (f–f0) and the pulse envelope, and Fourier Transformations to obtain the signal spectrum. Quadrature decomposition is required to understand whether the source frequency is higher or lower than the reference frequency, and the envelope signal allows observing the physical pulse shortening due to RFBD.
The RF-breakdown spectrometer, presented in Figure 1, consists of three main parts: the envelope detector, the IQ-mixer (or downconverter) and the digitizing electronics (fast scope). The incoming signal from the accelerating structure has a pulsed RF structure with a central frequency around 110 GHz and pulse length of 1–10 ns. In the designed spectrometer, the down-conversion heterodyne is formed with an input horn antenna, 100–120 GHz band-pass WR-08 filter, 6 dB directional coupler, IQ-mixer and a local oscillator with a fixed frequency of 110.08 GHz, corresponding to the expected frequency of the source [10]. The design also incorporates a Schottky amplitude detector to observe the pulse shortening visually. The three signals (envelope, I and Q) are then digitized and Fourier-analyzed.
Although the developed spectrometer was successfully tested and demonstrated pulse shortening capabilities in mm-wave accelerating structures, this system had some limitations. First, to detect sub-ns pulses, the bandwidth of all mm-wave Schottky-based components must be increased to the level of 10 GHz, and second, the ability to digitize the output IQ and envelop signals at a rate that is a fraction of the expected rise time (several 10 s of GS/s). The direct way to do this, by using extremely fast analog-to-digital converters (ADC), is inapplicable due to the extreme cost of such electronics and its unavailability due to military applications. Importantly, the dimensions of the spectrometer were larger than those of the accelerating structure [11,12], since we used large off-the-shelf waveguide-based W-band components.
In order to solve these problems, we proposed two modifications to the system design. First, we adapted the initial downconverter design to a printed circuit board (PCB) based solution, similar to those used in radars [13], to make the design more compact. Second, we developed electronics to measure pulse shortening during the RF breakdown that does not require fast signal digitization techniques, but at the same time can perform signal length measurements with sub-ns resolution. In the following section we will discuss the design of each spectrometer part.
2. Pulse Envelope Detector
Figure 2a shows the initial design of the microwave rectifier based on a microstrip architecture, utilizing a 125 μm thick Rogers Duroid PCB board with copper cladding. The Duroid laminates have the lowest electrical loss of any reinforced polymer material, low moisture absorption, are isotropic, and have uniform electrical properties over the wide frequency range. The width of the microstrip was chosen to be 0.4 mm, which corresponds to approximately 50 Ω wave impedance. The microstrip patch antenna for 110 GHz has dimensions of 2.064 × 0.779 mm and is matched to the microstrip line with a quarter wave long transformer section. The antenna has a gain of 9 dBi and a corresponding effective area of 4.7 mm2.
Simulations of the amplitude detector were performed in CST Microwave Studio software separately from the antenna. A microstrip port was used to supply microwave power to the diode. Most of the field in the input port is localized between the top metal strip and the bottom metal plane. The expected detector response for a 50 Ω detector load and 0.5 mW input microwave power ranges from 63 mV at 110 GHz to 56 mV ±6 GHz off the frequency.
A full system simulation of detection of a 110 GHz plane wave has also been performed. The plane wave had linear polarization oriented in accordance with the patch antenna electric field coupling direction and was incident on the detector board at a normal angle. These simulations show that the plane wave with electric field amplitude of 500 V/m, excited in a 1 ns square input pulse, results in 1.5 mW power applied to the detector. As can be seen from Figure 2b, the detector has fast-enough response to resolve sub-ns pulses.
The PCB was fabricated at San Francisco Circuits. The W-band GaAs Schottky diodes were purchased from Virginia Diodes and Keysight. For the first experiment, a Keysight diode was used. The soldering, assembly, and testing were performed at RadiaBeam. A low temperature (165 °C) soldering paste and a temperature-controlled oven were used to solder the diode to the PCB. A high conductivity silver epoxy was used to connect the coaxial cable to the detector output terminals after the diode was soldered.
A commercial WR8 waveguide oscillator from ELVA-1, capable of producing 16 dBm (40 mW) cw power at 110 GHz, and a 25 dBi horn antenna was used for testing the detector sensitivity. The power density of the microwave radiation incident on the detector was adjusted by changing the distance from the transmitting horn to the detector. The power received by the detector (Pr) can be calculated from the following formula:
Here Pt is the source power, Gh and Gp are the linear power gains of the horn and of the patch antennas, λ is the wavelength, and L is the distance between the antennas. The power coming to the detector was modulated with a chopper in the form of a metal rotating disk with a cut through sector openings. For the purpose of comparison, the same type of measurements were repeated using a commercial WR8 waveguide detector with another horn antenna in place of the RadiaBeam detector.
The measurements were performed for both 50 Ω and 1 MΩ oscilloscope port resistances. The results are presented in Figure 3. The achieved differential sensitivity of the detector is 2700 V/W at 1 MΩ, which is comparable to the state-of-the-art results reported [14,15]. However, to resolve the short pulses, a 50 Ω load must be used, and the corresponding sensitivity is 180 V/W, which is also high. For comparison, the detector from SAGE Millimeter demonstrated lower sensitivity. Note that this commercial detector was tested at higher power because for the same set of distances between the transmitter and the receiver the power received by the commercial detector was higher due to the larger effective aperture of the horn antenna compared to the much smaller aperture of the microstrip patch antenna. At 0.5 mW, where the tested power values overlap, the RadiaBeam detector produced twice the output voltage of the SAGE device.
To characterize the frequency bandwidth of the new detector, a frequency tunable (from 107 GHz to 113 GHz) microwave source from ELVA-1 was used. A series of measurements were done with both the commercial detector and the RadiaBeam detector placed at a fixed distance from the transmitting horn antenna. The detector readings were taken for different values of frequency of the input radiation. The microwave source had an uncalibrated nonlinear dependence of the output power on frequency, so the bandwidth of the RadiaBeam detector was estimated from the comparison data with the wide band commercial detector. As can be seen from the experimental comparison plots (Figure 4), the microstrip detector response is near flat from 108 to 110 GHz with the relative sensitivity decreasing on both sides of this interval. The performance of our detector can be further improved by using higher performance Schottky diodes from Virginia Diodes, which have lower parasitic capacitance [16].
3. Quadrature Mixer
Our first intention was to perform a direct adaptation of the initial design, based on mixing the incoming signal from the accelerating structure with the local oscillator (LO) signal of nearly the same frequency. To mix two signals, they need to be combined in space and a nonlinear element has to be introduced. GaAs Shottky diodes are widely used as nonlinear elements in W-band [17]. There are different ways to combine signals in space. In particular, for a popular single-balanced mixer configuration that allows isolating the LO port from the RF signal and vice versa, a branch line coupler can be used (Figure 5). The input microwave power is split equally between two opposite side outputs with a 90° phase difference.
Two diodes are required for the balanced mixer configuration to work. The diodes’ currents induced by the LO or RF waves must be either in phase or in the anti-phase. A quarter wavelength longer upper microstrip line to the diode provides additional 90° phase difference to the existing 90° phase difference imposed by the branch line coupler between the two lines at the point where they are coupled to the mixer diodes. A resonating semi-ring microstrip section of a proper length connects to the diodes on the other side. The matching is achieved by adjusting the length of the top and bottom bar sections. The intermediate frequency (IF) output is connected in the place where the standing wave in the semi-ring has zero electric field. A couple of microstrip sections with alternating widths are used to further reduce the high frequency signal followed by a Butterworth low pass filter. With the branch coupler being susceptible to detuning, the grounding needed to close the loop for the IF currents is placed on the incoming signal side before the coupler.
In order to realize this mixer, a 110 GHz LO source is needed. Traditionally for applications like LO requiring good phase stability, solid state sources based on Gunn diodes are used [18]. There are commercial waveguide based Gunn oscillators for 110 GHz, however no single supplier was found who would sell the W-band Gunn diodes separately. To make all the components of our detector on a single board we had to develop a sub-harmonically pumped mixer on the microstrip technology [19], which could be fed by a 55 GHz LO. There are several suppliers of Gunn diodes rated for 55 GHz. There is also an option to use a commercial voltage-controlled oscillator (VCO) with multipliers to produce 55 GHz.
Therefore, a full quadrature (IQ) down conversion sub-harmonically pumped mixer as a part of a heterodyne spectrometer and an improved envelope detector were developed for 110 GHz ~10 ns microwave pulses. Both devices are based on PCB boards made of 125 μm thick Rogers Duroid 5880 material with copper cladding utilizing a microstrip line architecture. For RF mixing and rectification GaAs W-band Schottky diodes from Virginia Diodes were chosen. The width of the main microstrip line was selected to be 0.4 mm, which corresponds to near 50 Ω line impedance. Microstrip patch antennas were optimized to act as microwave receivers. To produce a differential signal of the form (f–2f0), an anti-parallel diode pair was employed in the design for mixing [20].
Figure 6 shows the schematics of the designed quadrature mixer. The input LO signal is split equally between two mixer sections and comes to the mixers in the same phase. The ~110 GHz signal is also split equally, but due to the difference in length of the microstrip lines connecting the splitter to the mixer sections, a 90° phase difference at 110 GHz is produced at the mixers. Two low pass filters in the center with ground connections (two chosen for symmetry) form a return pass for the intermediate frequency (IF) signals, which are sampled through another set of microstrip type low pass filters together with an additional 2 GHz lowpass Butterworth filter consisting of two serial inductive elements (6 nH and 2 nH) and one grounded capacitor (2.1 pF) in between. Two 55 GHz band pass filters are used to prevent the IF signals from being grounded through the LO source or the other IF port.
In order to verify the simulation, we updated the SPICE model [21] of the W-band diode pair with the experimental results. We measured its volt-ampere curve and used Matlab to find the parameters values (series resistance Rs, saturation current Is, and emission coefficient N) that give the best fit with the measurements. The three curves are plotted in Figure 7a. It appeared that the LO power is captured by the mixer circuit through a patch antenna, which introduces excessive loss of useful signal, and therefore the diodes did not open, given the limited Gunn diode output power.
In order to solve this problem, we readjusted the 112 GHz (RF input) patch antenna. We kept the same anti-parallel diode pair model (VDI-W by Virginia Diodes) as the main mixing element but improved the RF matching on all three ports. To minimize RF-IF conversion losses, it is necessary to select the optimal LO power level. This is done by finding a point on the volt-ampere characteristic of the diode at a given signal power at the RF port with an unmatched diode pair and changing the power of the local oscillator signal. As can be seen from the simulation results, shown in Figure 7b, the optimal LO level is +15 dBm (32 mW).
In contrast to mixers of close frequencies, there is an optimum value for the LO power of the sub-harmonically pumped mixer. Increasing the LO power above the optimum results in smaller amplitude of the IF output signal. The set-up shown in Figure 6 was simulated in CST Microwave Studio in time domain. The input signals were 3-ns-long pulses with the major frequencies of 55 GHz and 109 GHz. The amplitudes were chosen at a ratio of 1:4 for optimal performance. Figure 8 shows the output signals for both IF quadrature outputs. The major output frequency is 1 GHz. There is a nearly 90° offset between the oscillations in the I and Q outputs. The sign of the phase offset indicates whether the input signal frequency (109 GHz in this example) is lower or higher than the second harmonic of the LO (110 GHz). Figure 9 shows the fabricated PCB board. The board contains the quadrature mixer and antenna inputs for the 55 GHz LO and ~110 GHz signals. The low frequency terminals are compatible with commercially available SMA connectors. The W-band detector was made by using a zero-bias detector diode from Virginia Diodes.
Figure 10a shows the fabricated 55 GHz LO signal source, based on Microsemi GaAs Gunn diode, soldered, and mounted into the aluminum heatsink underneath the PCB. This device was tested with a vector network analyzer (VNA) with a 40–60 GHz frequency extender, as shown in Figure 10b. The Gunn diode operating voltage is 3.5–4.0 V, current 0.4–0.8 A, output power up to 50 mW. We measured a center frequency of 55.002 GHz. After validation of the LO source, we assembled the IQ-mixer measurement stand. It consists of a W-band (108–112 GHz) voltage-controlled oscillator and amplifier, 55 GHz LO source, and the IQ-mixer itself. The distances between the RF sources and the mixer PCB are adjustable.
4. Electronics System
In order to measure the downconverted signal we designed the detector electronics board. The circuit design is based on a frequency counter and pulse width meter subsystems as shown in Figure 11. The frequency counter is used to measure the output frequency I and Q signals. The pulse width meter uses a time-to-digital converter TDC7201 with resolution of 55 ps, which satisfies the project goal of <100 ps. This is a low-cost solution for detecting RF breakdown without the use of fast ADCs or complex electronics.
The amplitude-modulated quadrature signal I or Q from the heterodyne receiver goes to the input of the envelope detector board. The signal’s envelope is equivalent to its outline, and an envelope detector connects all the peaks in this signal. The envelope signal from the detector board is digitized using the two time-to-digital converters (TDC) operating in combined mode and amplified by a high-speed digitally controlled variable gain amplifier with a bandwidth of 2.4 GHz. Two chips are used in order not to miss an event when capturing without a trigger, at an arbitrary time. In the next step, the voltage threshold comparators detect rising and falling edges. Then the FPGA generates “start” and “stop” pulses for the time-to-digital converters. Each converter acts as a stopwatch and measures the elapsed time between the “start” pulse and the “stop” pulse, which corresponds to the pulse width. The measured pulse width value is transmitted to the personal computer via the Ethernet interface.
The frequency counter is used to measure the carrier frequency of the I and Q signals. The current version of the device uses an inexpensive FPGA chip with a low clock frequency, so the frequency divider was used to expand the limits of frequency measurement. This submodule is based on the 12-bit ADC from Texas Instruments with a speed of 250 MS/s. The functioning of the boards in the laboratory was checked using a test system, similar to the one described in [9].
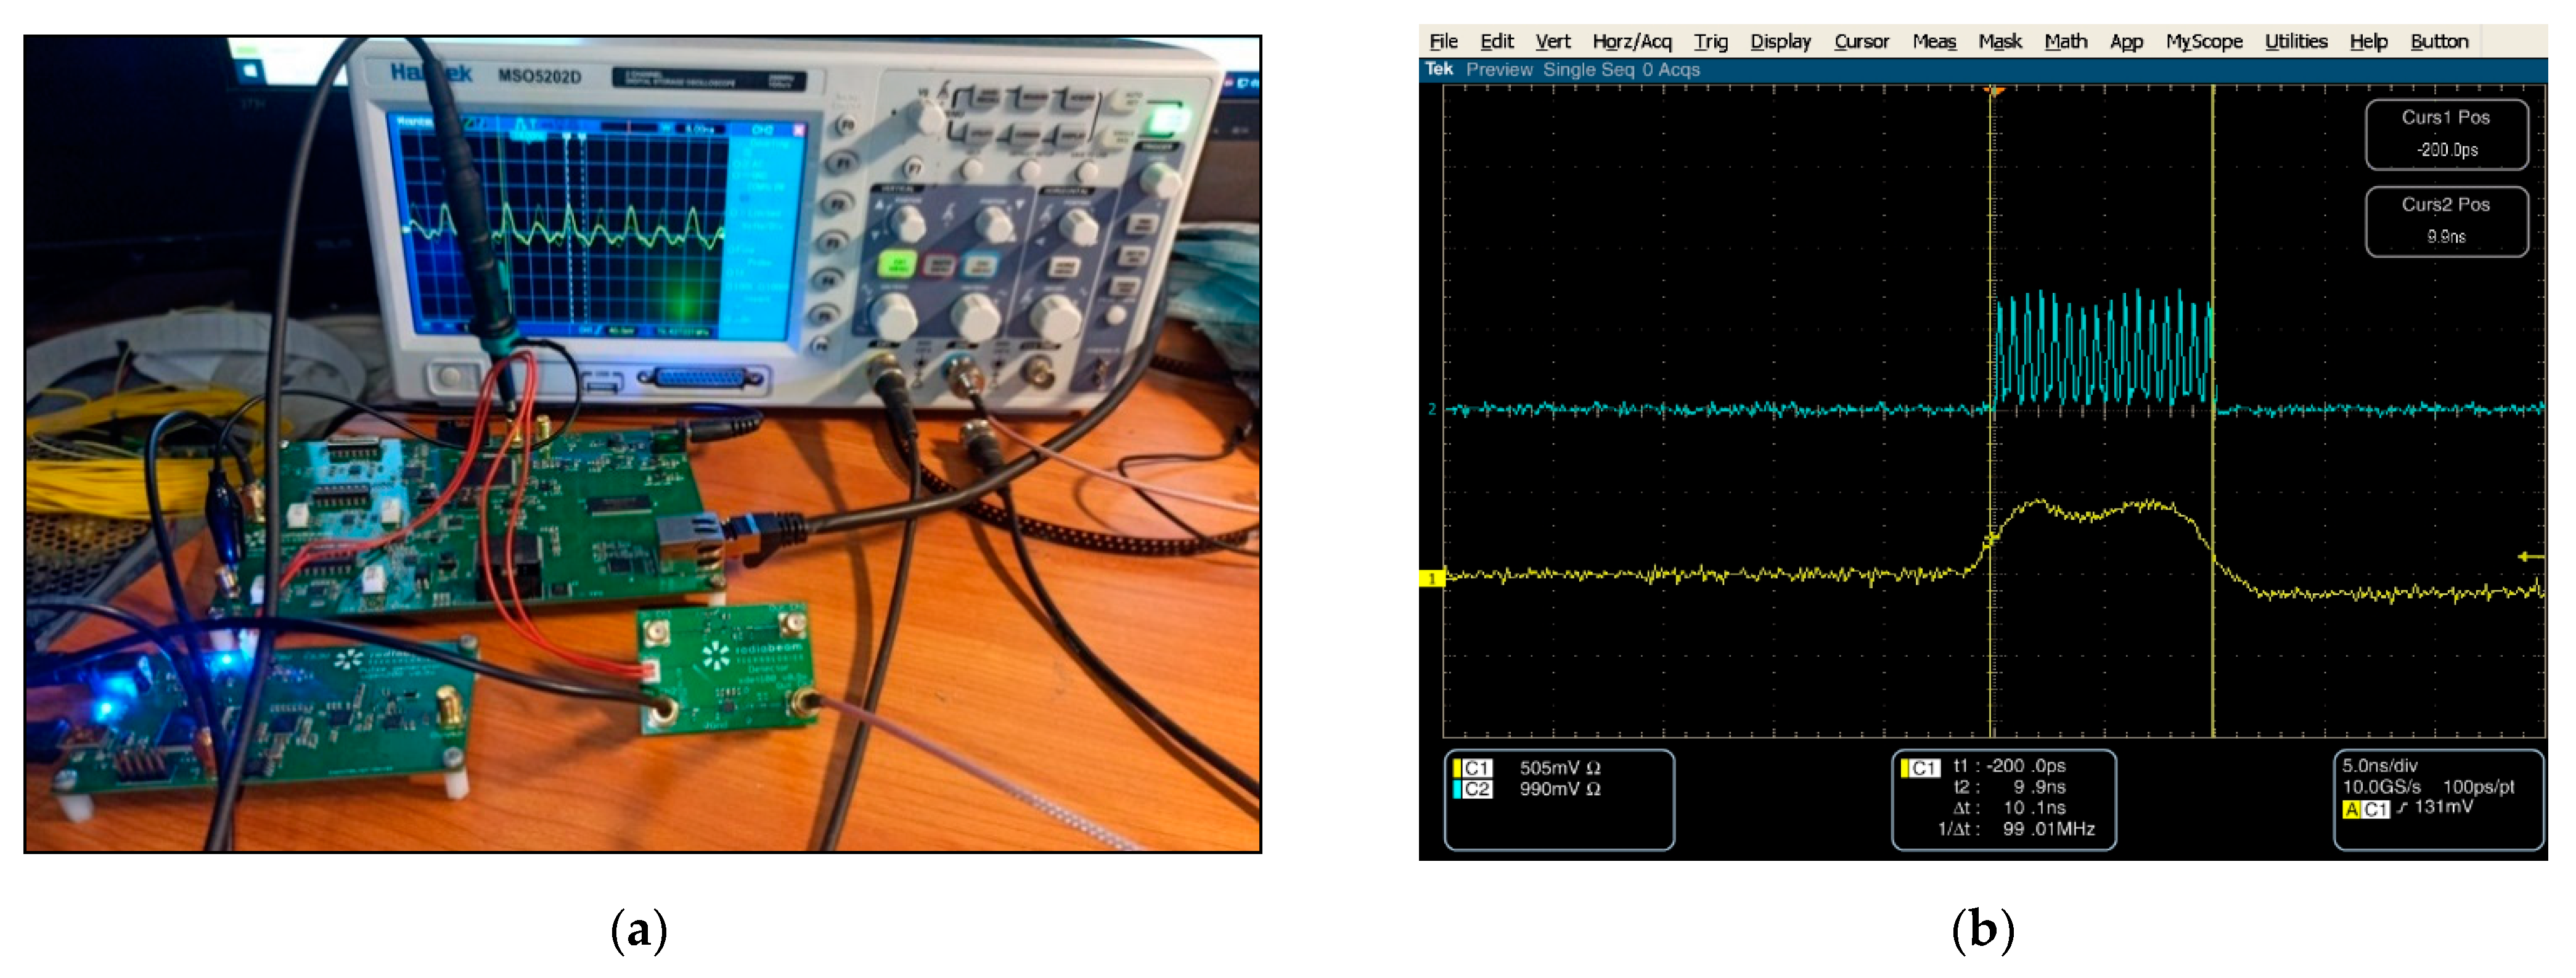
The experimental results are presented in Figure 12. The blue trace is the down-converted IF signal, and the yellow is the pulse envelope. The measured values were rounded to an integer, since in laboratory measurements there are fluctuations. To increase the noise protection, it is necessary to place the boards in shielded boxes and redesign the PCBs. To increase the measurement accuracy, we plan to use more advanced TDC chips (such as AS6501 from Sciosense). In addition, in order to improve the frequency measurement accuracy, a faster FPGA should be used.
5. Discussion
In this paper we have discussed the development of the next generation pulse length measurement/spectrometer system for shot-to-shot breakdown detection in mm-wave accelerating structures. This development is based on a proof-of-principle prototype that was successfully tested at MIT with a SLAC 110 GHz accelerating structure in 2018. The described improvements include the transition from waveguide components to PCB striplines, utilization of a sub-harmonic IQ mixer based on anti-parallel diode pairs, and simple and inexpensive detector electronics, capable of pulse shortening detection with sub-ns resolution. The paper presents both the design considerations and the results of the produced components. We believe that our experience will be interesting to accelerator and microwave scientists working on similar problems.
6. Conclusions
The ability to monitor RF breakdowns is of paramount importance in the development of mm-wave high gradient accelerators. While there are prohibitively expensive down-converter-based vector-network analyzers and fast-oscilloscopes that can be used for W-band diagnostics, there are virtually no commercial devices that can perform shot-to-shot pulse measurements. By using heterodyne mixing along with a frequency counter and pulse length measurement electronics, we were able to develop a reasonably simple and inexpensive design that can fill a much-needed niche for THz accelerator diagnostics. This approach can be used in other applications where low-power single-shot measurements of ultra-high frequency signals are required, such as THz pump-probe experiments, and short electron bunch measurements for free electron lasers.
Author Contributions
Conceptualization, S.V.K., A.M.; methodology, S.V.K., V.G.; software, V.G.; validation, V.G., D.S. and A.Y.S.; formal analysis and investigation V.G., I.R., D.S. and A.Y.S.; writing—original draft preparation, S.V.K., D.S.; supervision, S.V.K.; project administration, A.M.; funding acquisition, S.V.K. All authors have read and agreed to the published version of the manuscript.
Funding
This work was funded by the U.S. Department of Energy, Office of High Energy Physics, under SBIR grant DE-SC0013684.
Institutional Review Board Statement
Not applicable.
Informed Consent Statement
Not applicable.
Data Availability Statement
The datasets generated during and/or analysed during the current study are available from the corresponding author on reasonable request.
Acknowledgments
The authors would like to thank Valery Dolgashev from SLAC for the valuable discussions on the RF breakdown phenomenon, as well as Oleg Adonyev for his participation in the experimental work.
Conflicts of Interest
The authors declare no conflict of interest.
References
- Kutsaev, S.V. Advanced Technologies for Applied Particle Accelerators and Examples of Their Use (Review). Tech. Phys. 2021, 66, 161–195. [Google Scholar] [CrossRef]
- Kutsaev, S. Novel technologies for compact electron linear accelerators (Review). Instruments Exp. Tech. 2021, 64, 641–656. [Google Scholar] [CrossRef]
- Simakov, E.I.; Dolgashev, V.A.; Tantawi, S.G. Advances in high gradient normal conducting accelerator structures. Nucl. Instrum. Meth. Phys. Res. A 2018, 907, 221–230. [Google Scholar] [CrossRef]
- Dal Forno, M.; Dolgashev, V.; Bowden, G.; Clarke, C.; Hogan, M.; McCormick, D.; Novokhatski, A.; Spataro, B.; Weathersby, S.; Tantawi, S.G. RF breakdown tests of mm-wave metallic accelerating structures. Phys. Rev. Accel. Beams 2016, 19, 011301. [Google Scholar] [CrossRef] [Green Version]
- Othman, M.A.K.; Picard, J.; Schaub, S.; Dolgashev, V.A.; Lewis, S.M.; Neilson, J.; Haase, A.; Jawla, S.; Spataro, B.; Temkin, R.J.; et al. Experimental demonstration of externally driven millimeter-wave particle accelerator structure. Appl. Phys. Lett. 2020, 117, 073502. [Google Scholar] [CrossRef]
- Dal Forno, M.; Dolgashev, V.; Bowden, G.; Clarke, C.; Hogan, M.; McCormick, D.; Novokhatski, A.; O’Shea, B.; Spataro, B.; Weathersby, S.; et al. RF breakdown measurements in electron beam driven 200 GHz copper and copper-silver accelerating structures. Phys. Rev. Accel. Beams 2016, 19. [Google Scholar] [CrossRef] [Green Version]
- Dolgashev, V.A. Progress on high-gradient structures. AIP Conf. Proc. 2012, 1507, 76–84. [Google Scholar] [CrossRef]
- Kutsaev, S.V.; Ruelas, M.; Goncharik, V.; To, H.; Murokh, A. Optical Spectrometer with a Pulse-to-Pulse Resolution for Terahertz and mm-Wave Signals. IEEE Trans. Terahertz Sci. Technol. 2021, 11, 287–296. [Google Scholar] [CrossRef]
- Kutsaev, S.V.; Jacobson, B.; Smirnov, A.Y.; Campese, T.; Dolgashev, V.A.; Goncharik, V.; Harrison, M.; Murokh, A.; Nanni, E.; Picard, J.; et al. Nanosecond rf-Power Switch for Gyrotron-Driven Millimeter-Wave Accelerators. Phys. Rev. Appl. 2019, 11, 034052. [Google Scholar] [CrossRef] [Green Version]
- Othman, M.A.K.; Picard, J.; Schaub, S.; Dolgashev, V.A.; Jawla, S.; Spataro, B.; Temkin, R.J.; Tantawi, S.; Nanni, E.A. High-Gradient Test Results of W-Band Accelerator Structures. In Proceedings of the 44th International Conference on Infrared, Millimeter, and Terahertz Waves (IRMMW-THz), Paris, France, 1–6 September 2019. [Google Scholar] [CrossRef]
- Kutsaev, S.V.; Murokh, A.; Ruelas, M.; To, H.; Goncharik, V. Single-shot THz spectrometer for bunch length measurements. In Proceedings of the 5th International Beam Instrumentation Conference (IBIC 2016), Barcelona, Spain, 11–15 September 2016; pp. 782–784. [Google Scholar]
- Kutsaev, S.; Dal Forno, M.; Dolgashev, V.; Goncharik, V.; Murokh, A.; Ruelas, M.; Savin, E.; To, H. Single-shot thz spectrometer for measurement of RF breakdown in MM-wave accelerators. In Proceedings of the 7th International Particle Accelerator Conference (IPAC 2016), Busan, Korea, 8–13 May 2016; pp. 374–376. [Google Scholar]
- Anderson, A.J.; Genschow, D. Adaption of a Low Power 122 GHz Radar Transceiver for Long Range Communications. In Proceedings of the 2020 German Microwave Conference (GeMiC), Cottbus, Germany, 9–11 March 2020; pp. 148–151. [Google Scholar]
- Hesler, J.L.; Crowe, T.W. Responsivity and Noise Measurements of Zero-Bias Schottky Diode Detectors. In Proceedings of the 18th International Symposium on Space Terahertz Technology, Pasadena, CA, USA, 21–23 March 2007; pp. 89–92. [Google Scholar]
- Xu, W.; Xu, H.; Liu, F.; Wang, X. Millimeter-wave detector for gyrotron power monitoring. AIP Conf. Proc. 2020, 2254, 090002. [Google Scholar] [CrossRef]
- Gutiérrez, J.; Zeljami, K.; Pascual, J.P.; Fernández, T.; Tazón, A. Comparison of Microstrip W-Band Detectors Based on Zero Bias Schottky-Diodes. Electronics 2019, 8, 1450. [Google Scholar] [CrossRef] [Green Version]
- Dyadyuk, V.; Archer, J.W.; Stokes, L. W-band GaAs schottky diode MMIC mixers for multi-gigabit wireless communications. In Proceedings of the 2nd International Conference on Wireless Broadband and Ultra Wideband Communications (AusWireless 2007), Sydney, NSW, Australia, 27–30 August 2007; p. 70. [Google Scholar] [CrossRef]
- Khalid, A.; Pilgrim, N.J.; Dunn, G.M.; Holland, M.C.; Stanley, C.R.; Thayne, I.G.; Cumming, D.R.S. A planar Gunn diode operating above 100 GHz. IEEE Electron Device Lett. 2007, 28, 849–851. [Google Scholar] [CrossRef]
- Carlson, E.R.; Schneider, M.V.; McMaster, T.F. Subharmonically pumped millimeter-wave mixers. IEEE Trans. Microw. Theory Tech. 1978, 26, 706–715. [Google Scholar] [CrossRef] [Green Version]
- Cohn, M.; Degenford, J.E.; Newman, B.A. Harmonic Mixing with an Antiparallel Diode Pair. IEEE Trans. Microw. Theory Tech. 1975, 23, 667–673. [Google Scholar] [CrossRef]
- Luan, S.; Selli, G.; Fan, J.; Lai, M.; Knighten, J.L.; Smith, N.W.; Alexander, R.; Antonini, G.; Ciccomancini, A.; Orlandi, A.; et al. SPICE model libraries for via transitions. In Proceedings of the IEEE Symposium on Electromagnetic Compatibility, Boston, MA, USA, 18–22 August 2003; pp. 859–864. [Google Scholar] [CrossRef]
Figure 1.
Mm-wavelength heterodyne spectrometer scheme (a) and the prototype developed by RadiaBeam (b). 1–30 dB horn antenna, 2—Band-pass filter, 3—Directional coupler, 4—IQ-mixer, 5—Local oscillator, 6—Schottky amplitude detector.
Figure 1.
Mm-wavelength heterodyne spectrometer scheme (a) and the prototype developed by RadiaBeam (b). 1–30 dB horn antenna, 2—Band-pass filter, 3—Directional coupler, 4—IQ-mixer, 5—Local oscillator, 6—Schottky amplitude detector.
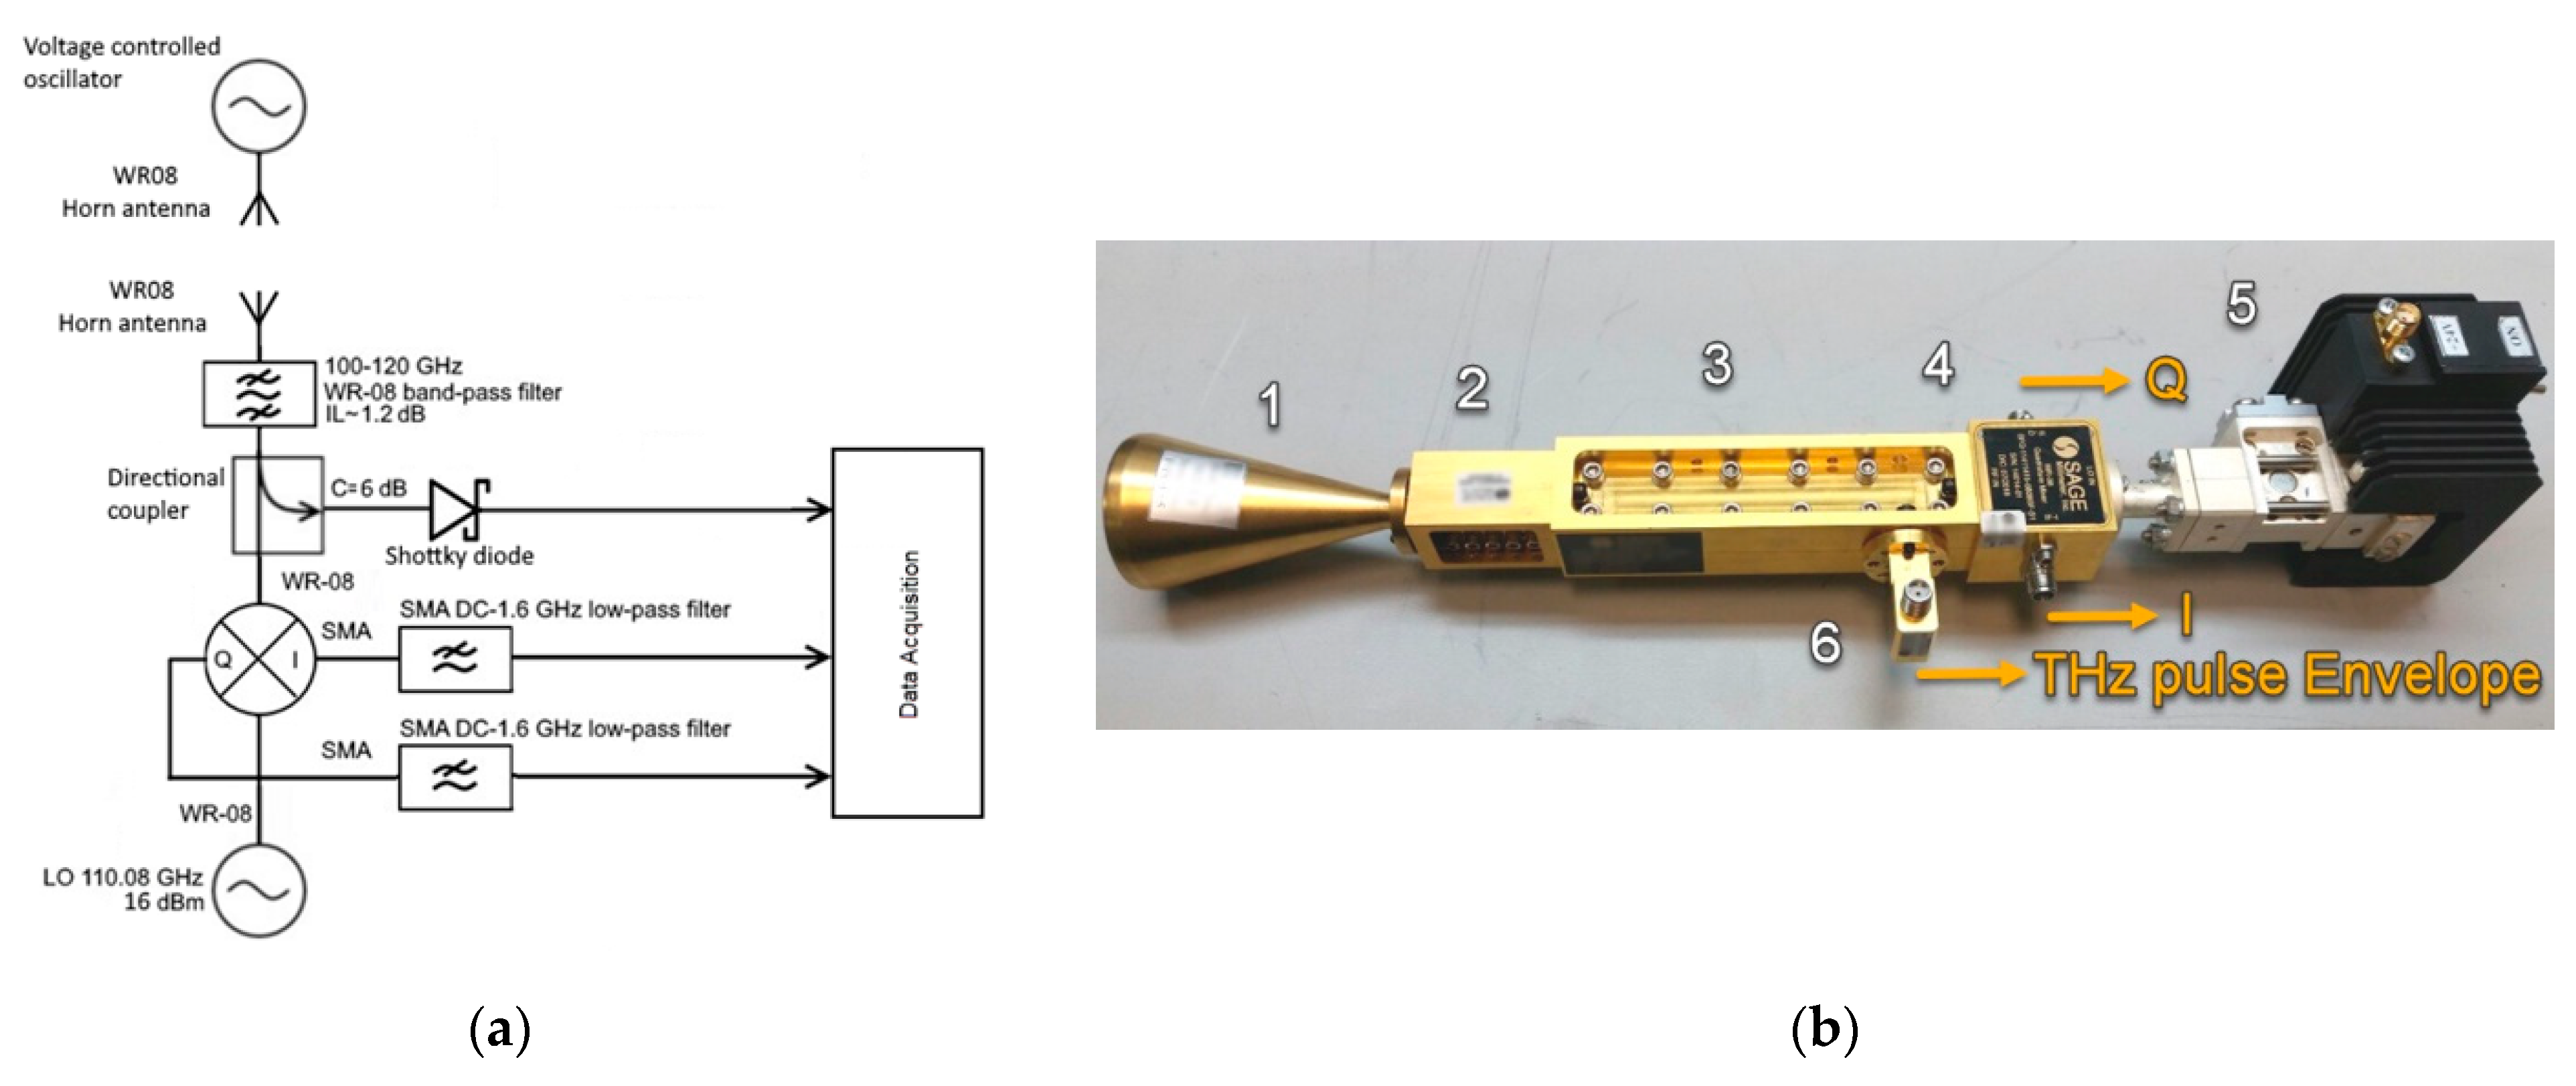
Figure 2.
Front view of the PCB microwave detector and its components (a). The pattern is fabricated by applying a photomask and copper etching followed by ENIG or silver plating/dipping. The simulated envelope signal on the detector is shown in (b).
Figure 2.
Front view of the PCB microwave detector and its components (a). The pattern is fabricated by applying a photomask and copper etching followed by ENIG or silver plating/dipping. The simulated envelope signal on the detector is shown in (b).
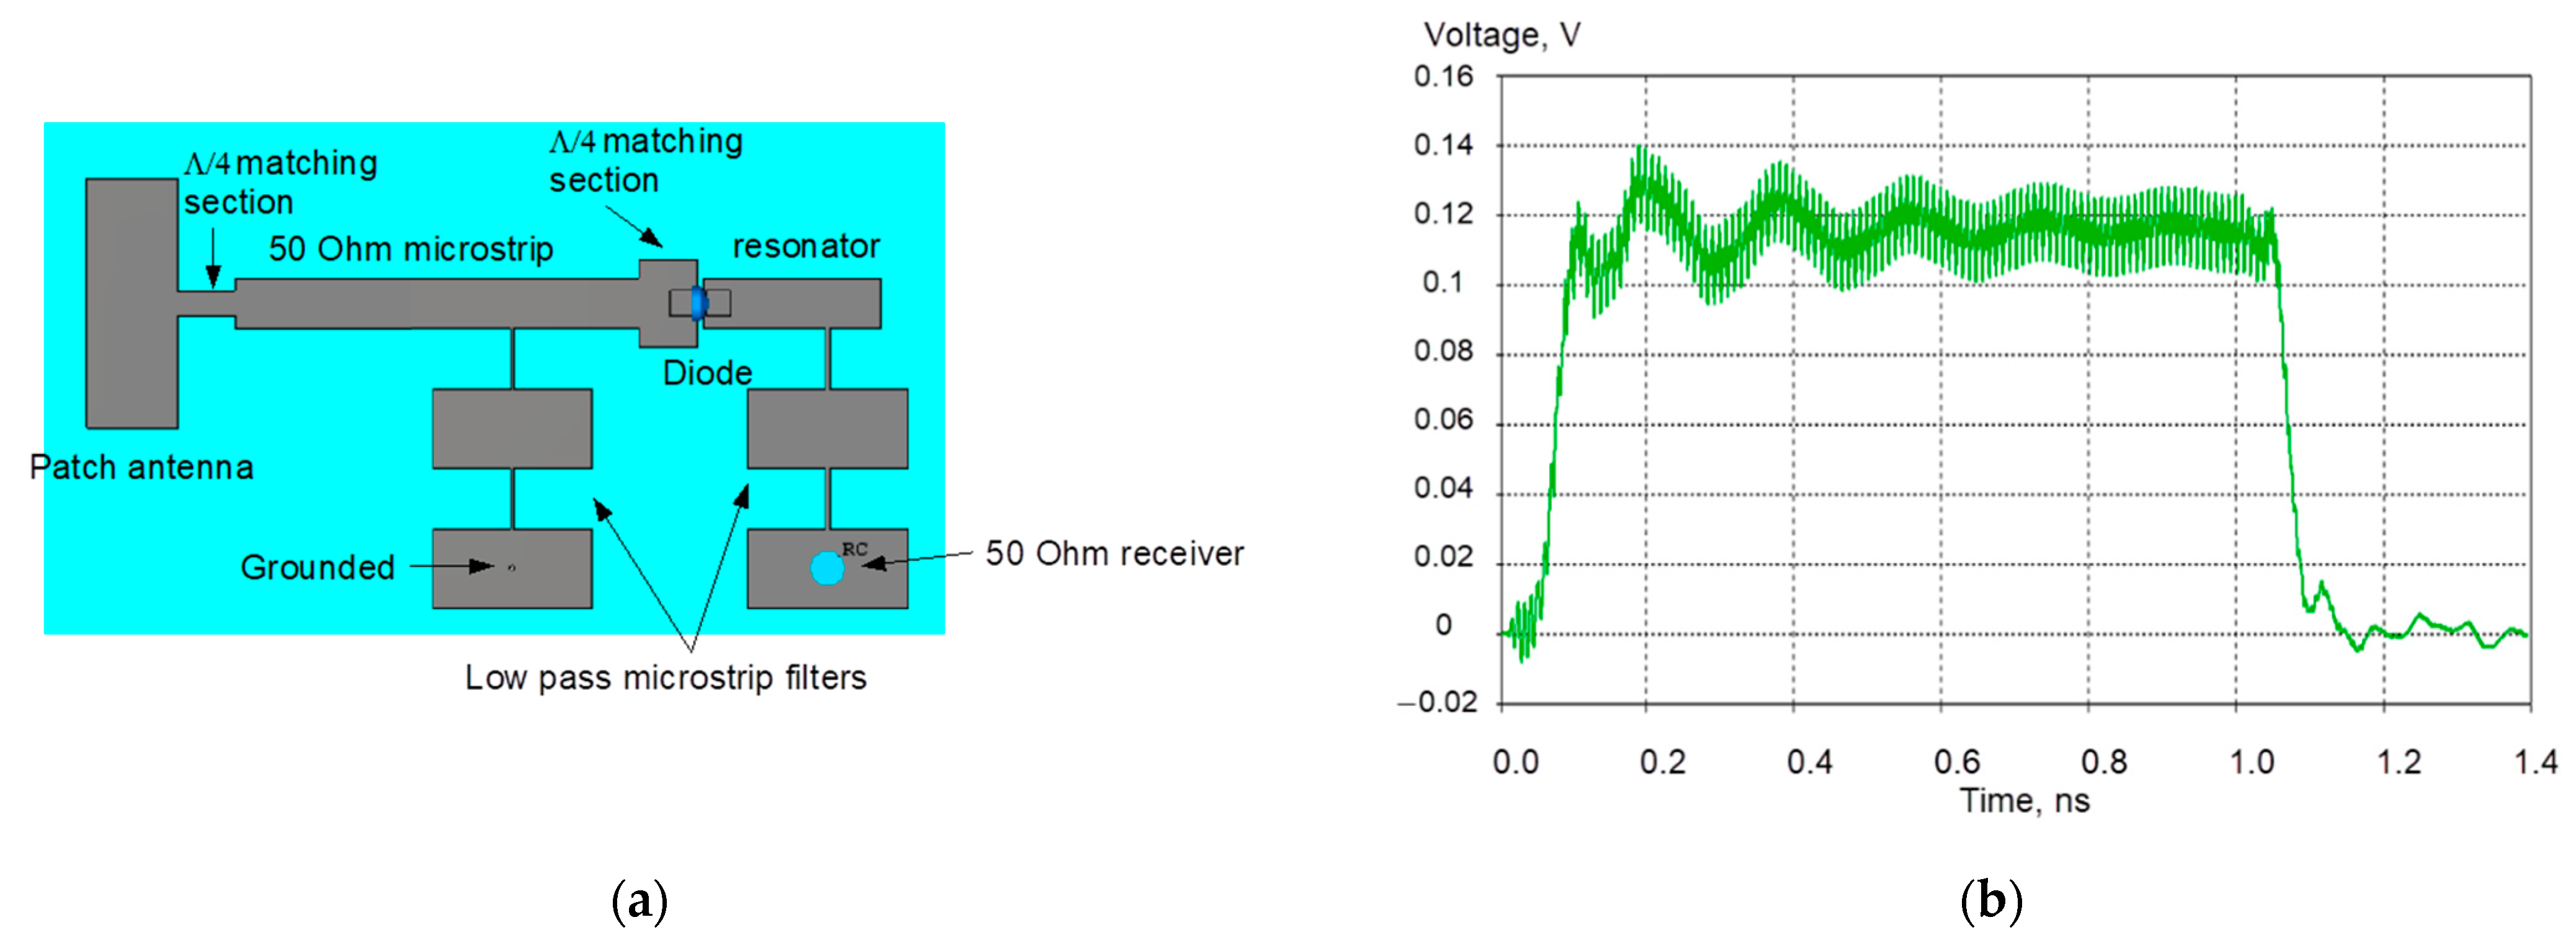
Figure 3.
Detector signal voltage as a function microwave power produced by RadiaBeam microstrip detector (a). Sensitivity comparison of RadiaBeam detector with a commercial WR8 waveguide detector from SAGE Millimeter (b). Two times higher voltage is produced by RadiaBeam detector for the same input power at 0.5 mW.
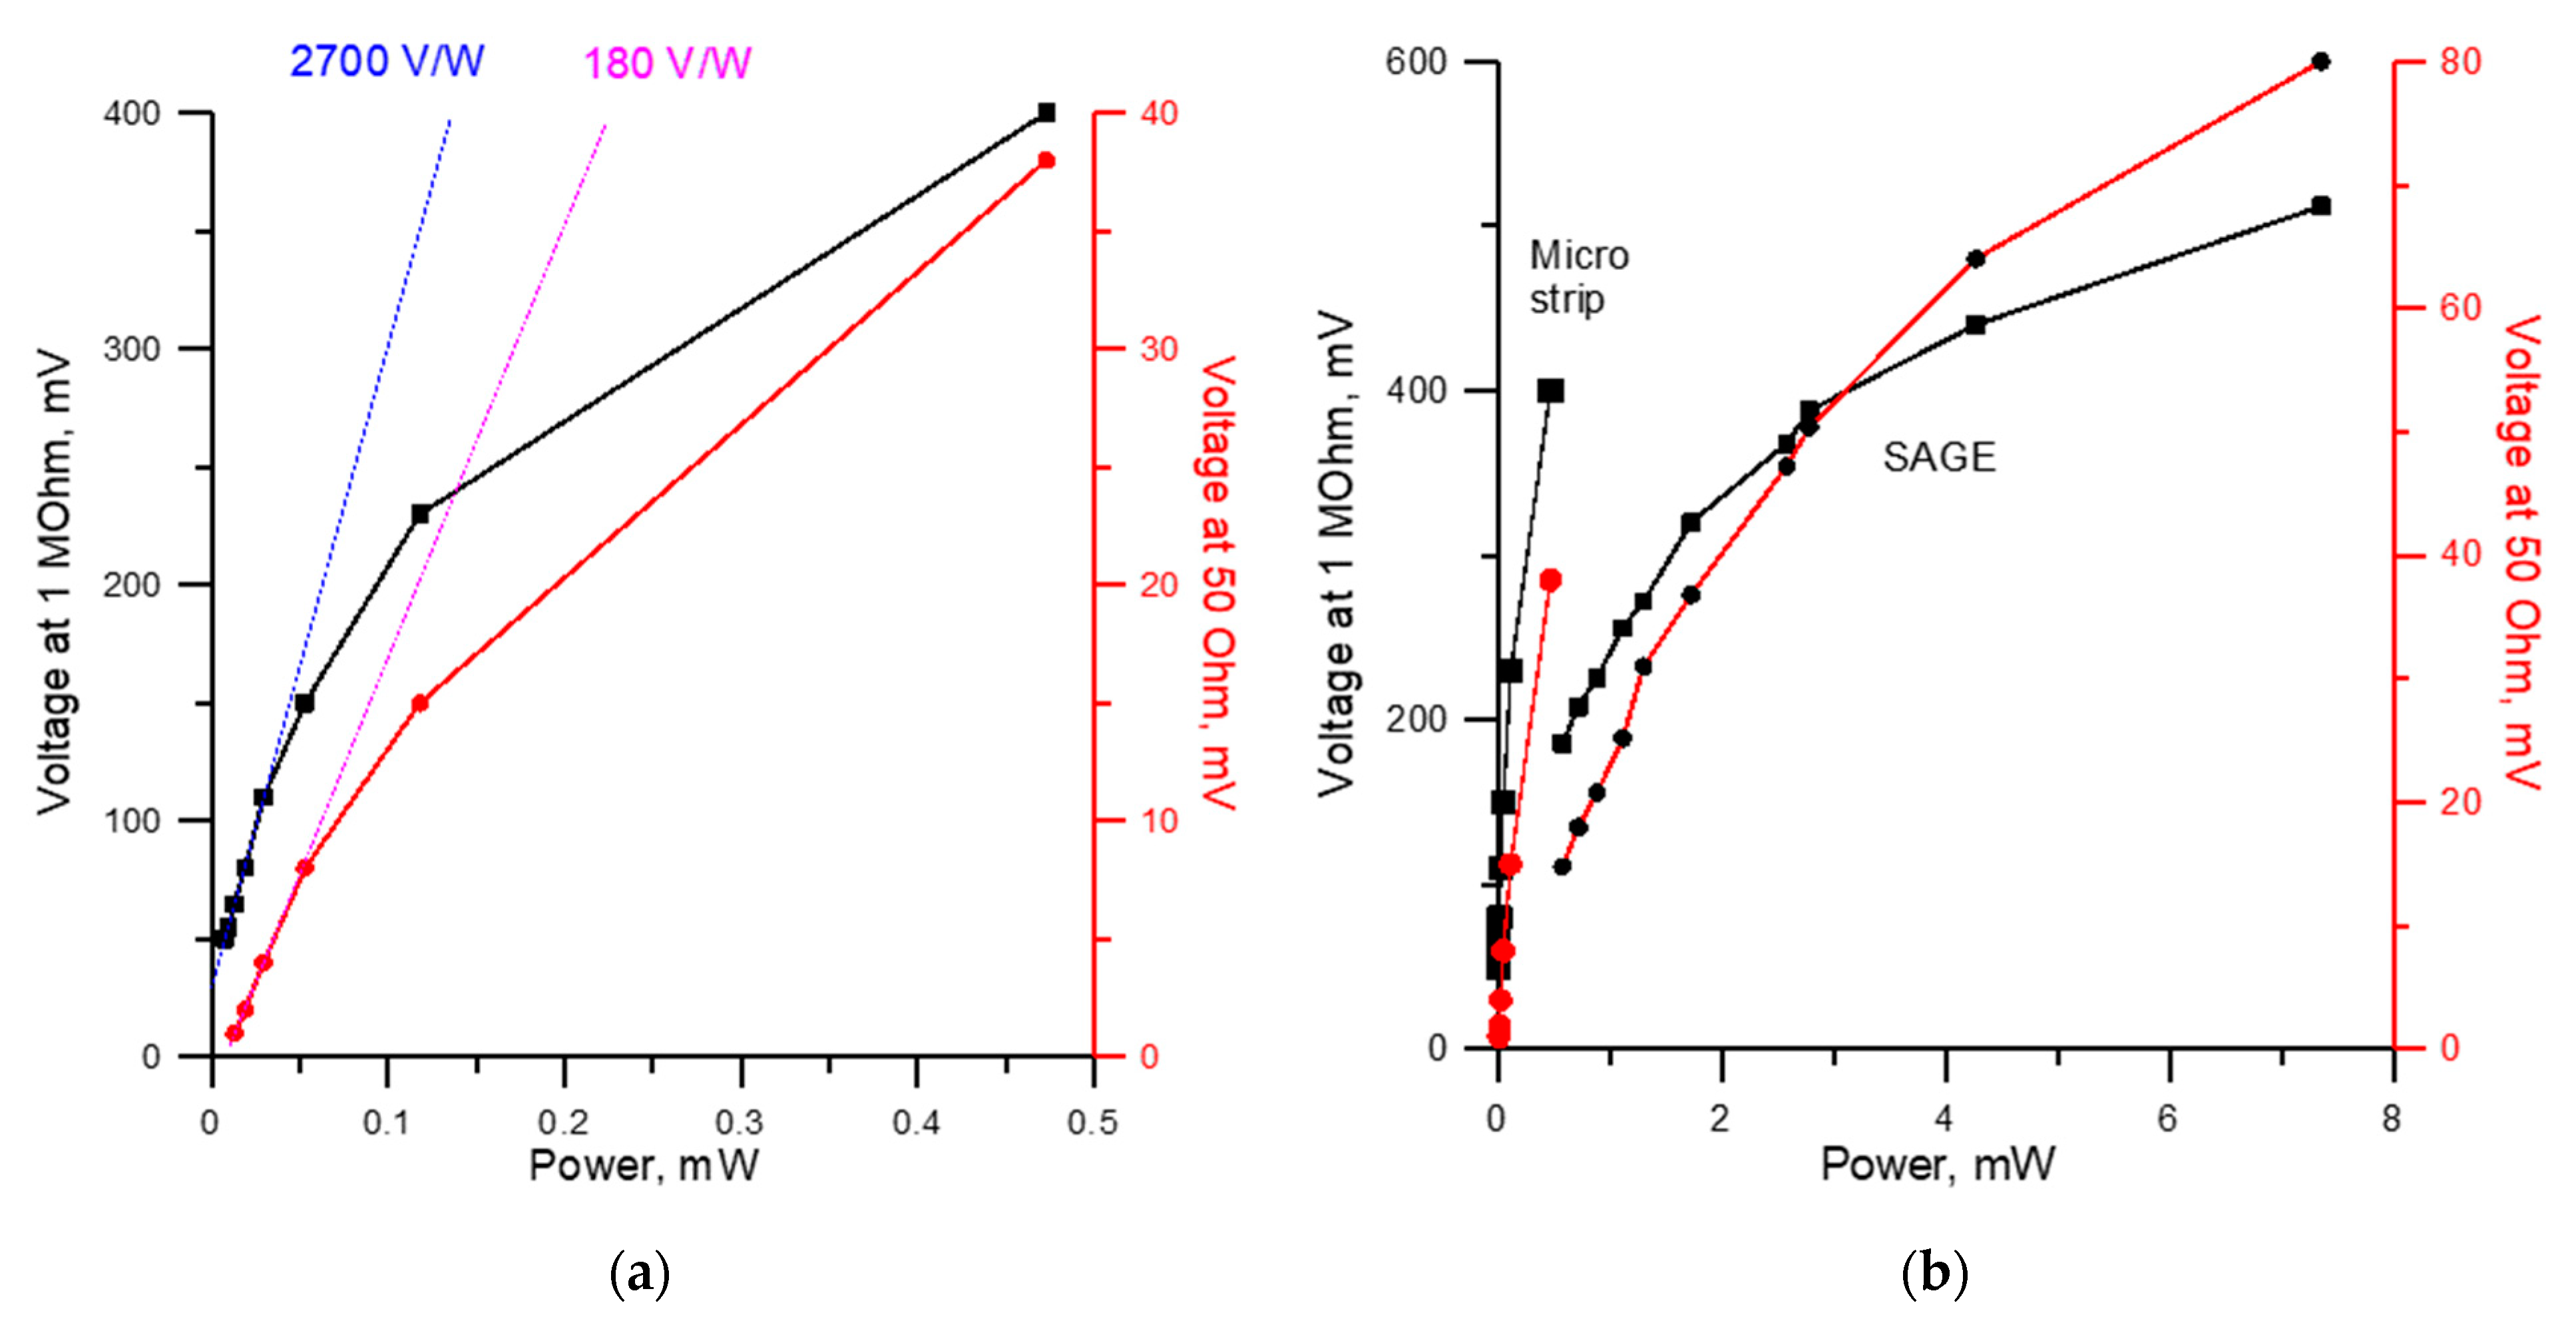
Figure 4.
Readings of the SAGE Millimeter detector connected to the horn and of the patch antenna coupled to RadiaBeam’s microstrip detector versus frequency of the source with an uncalibrated power characteristic. The ratio of readings indicates that the RadiaBeam detector together with the patch antenna is narrower band compared to the SAGE detector with the horn antenna.
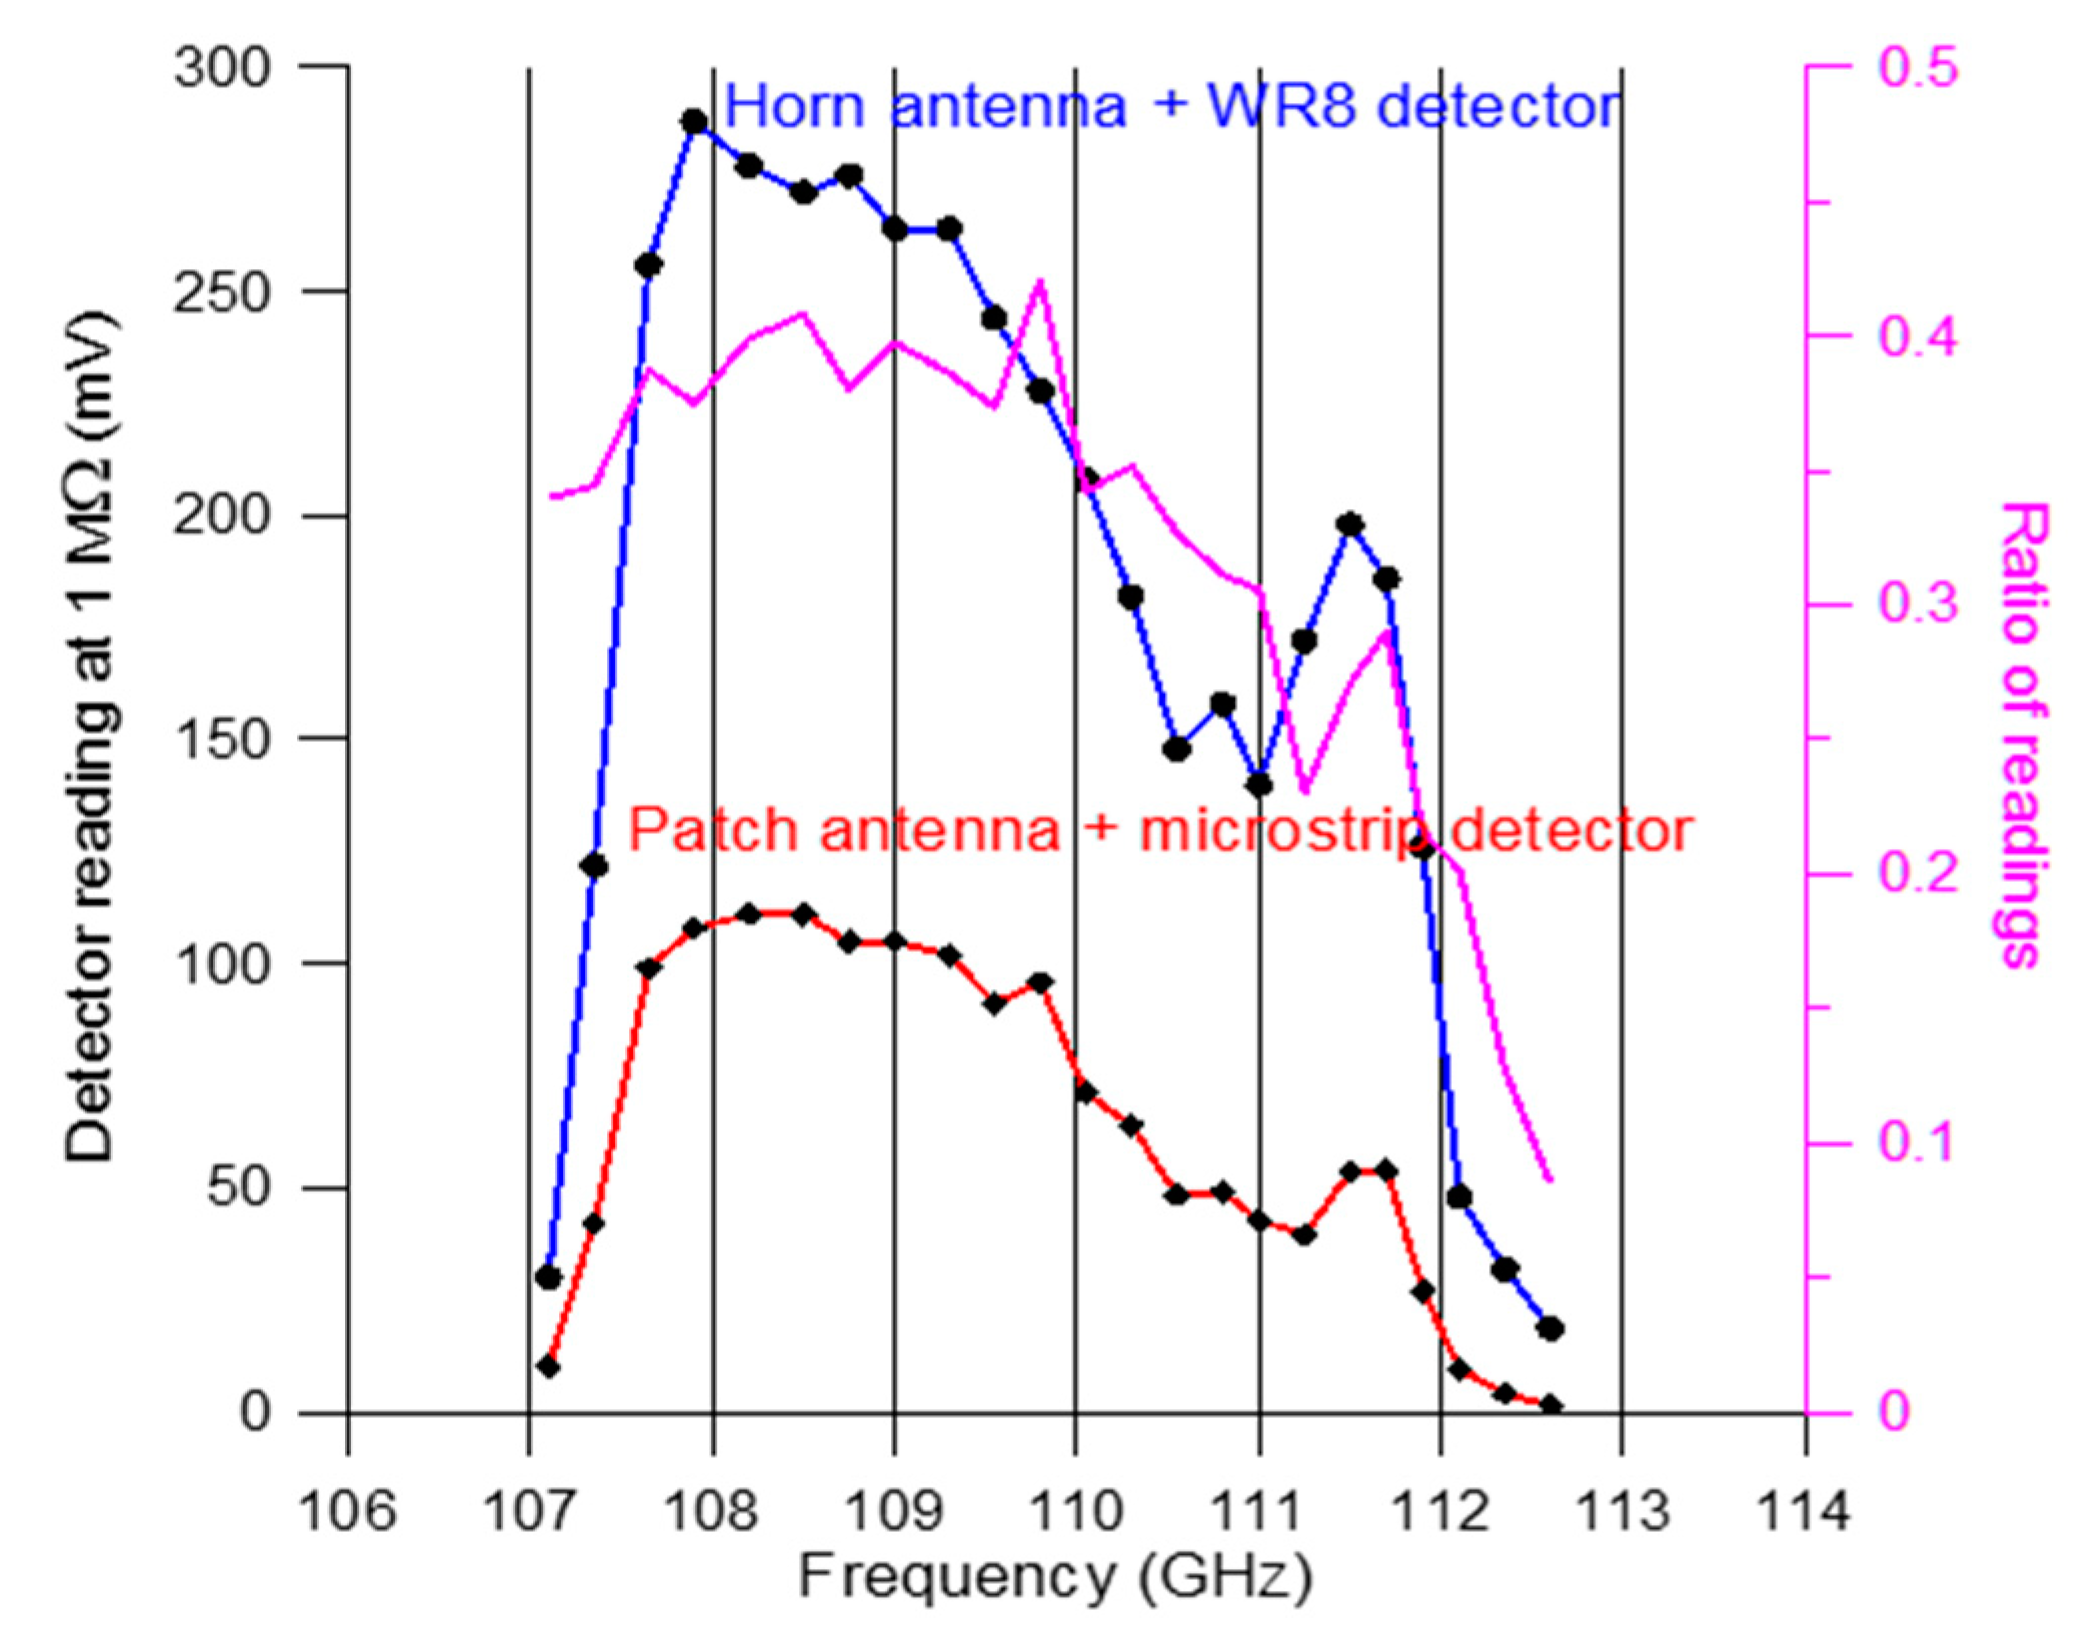
Figure 5.
W-band mixer of the RF and LO signals with close frequencies around 110 GHz. The picture shows a PCB layout of the mixer with the IF, ground, and output port. Also shown are the diode currents induced by the 110 GHz LO signal, which are perfectly in the anti-phase. The IF output is attached to the area of zero electric field, so that it does not pick up the high frequency radiation.
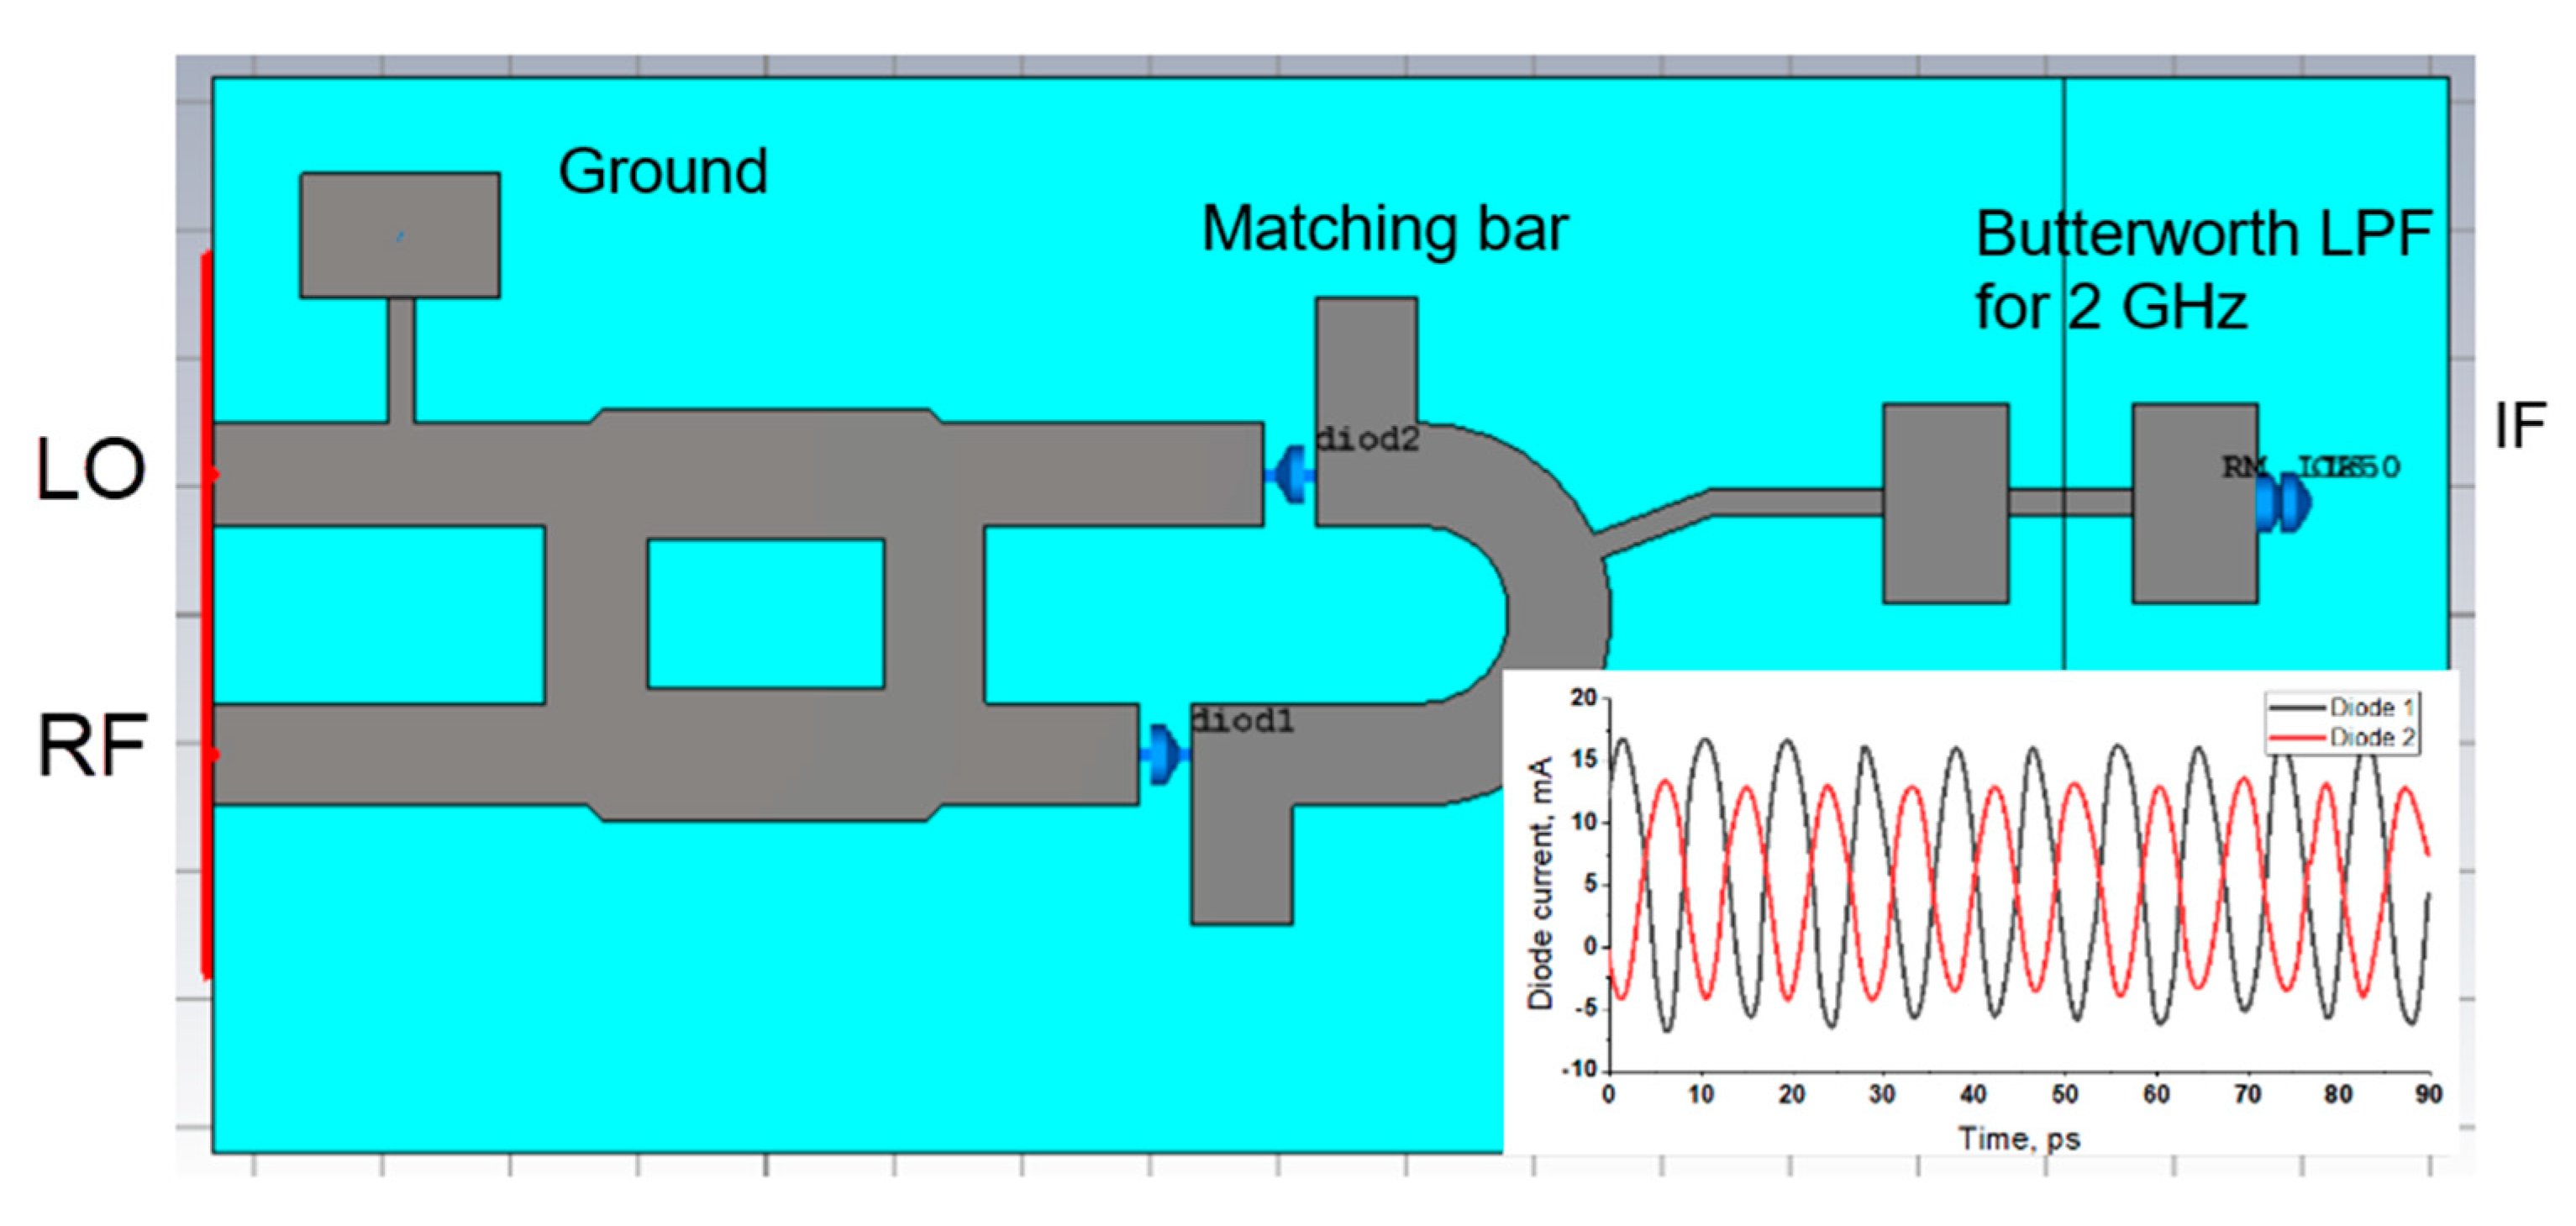
Figure 6.
Quadrature mixer layout. Top microstrip port is for 55 GHz input from a local oscillator, bottom microstrip is for signal input at around 110 GHz. At 110 GHz the difference in length of the left and right microstrip transmission lines from the splitter to the mixer diodes results in a 90-degree relative phase difference at the mixers.
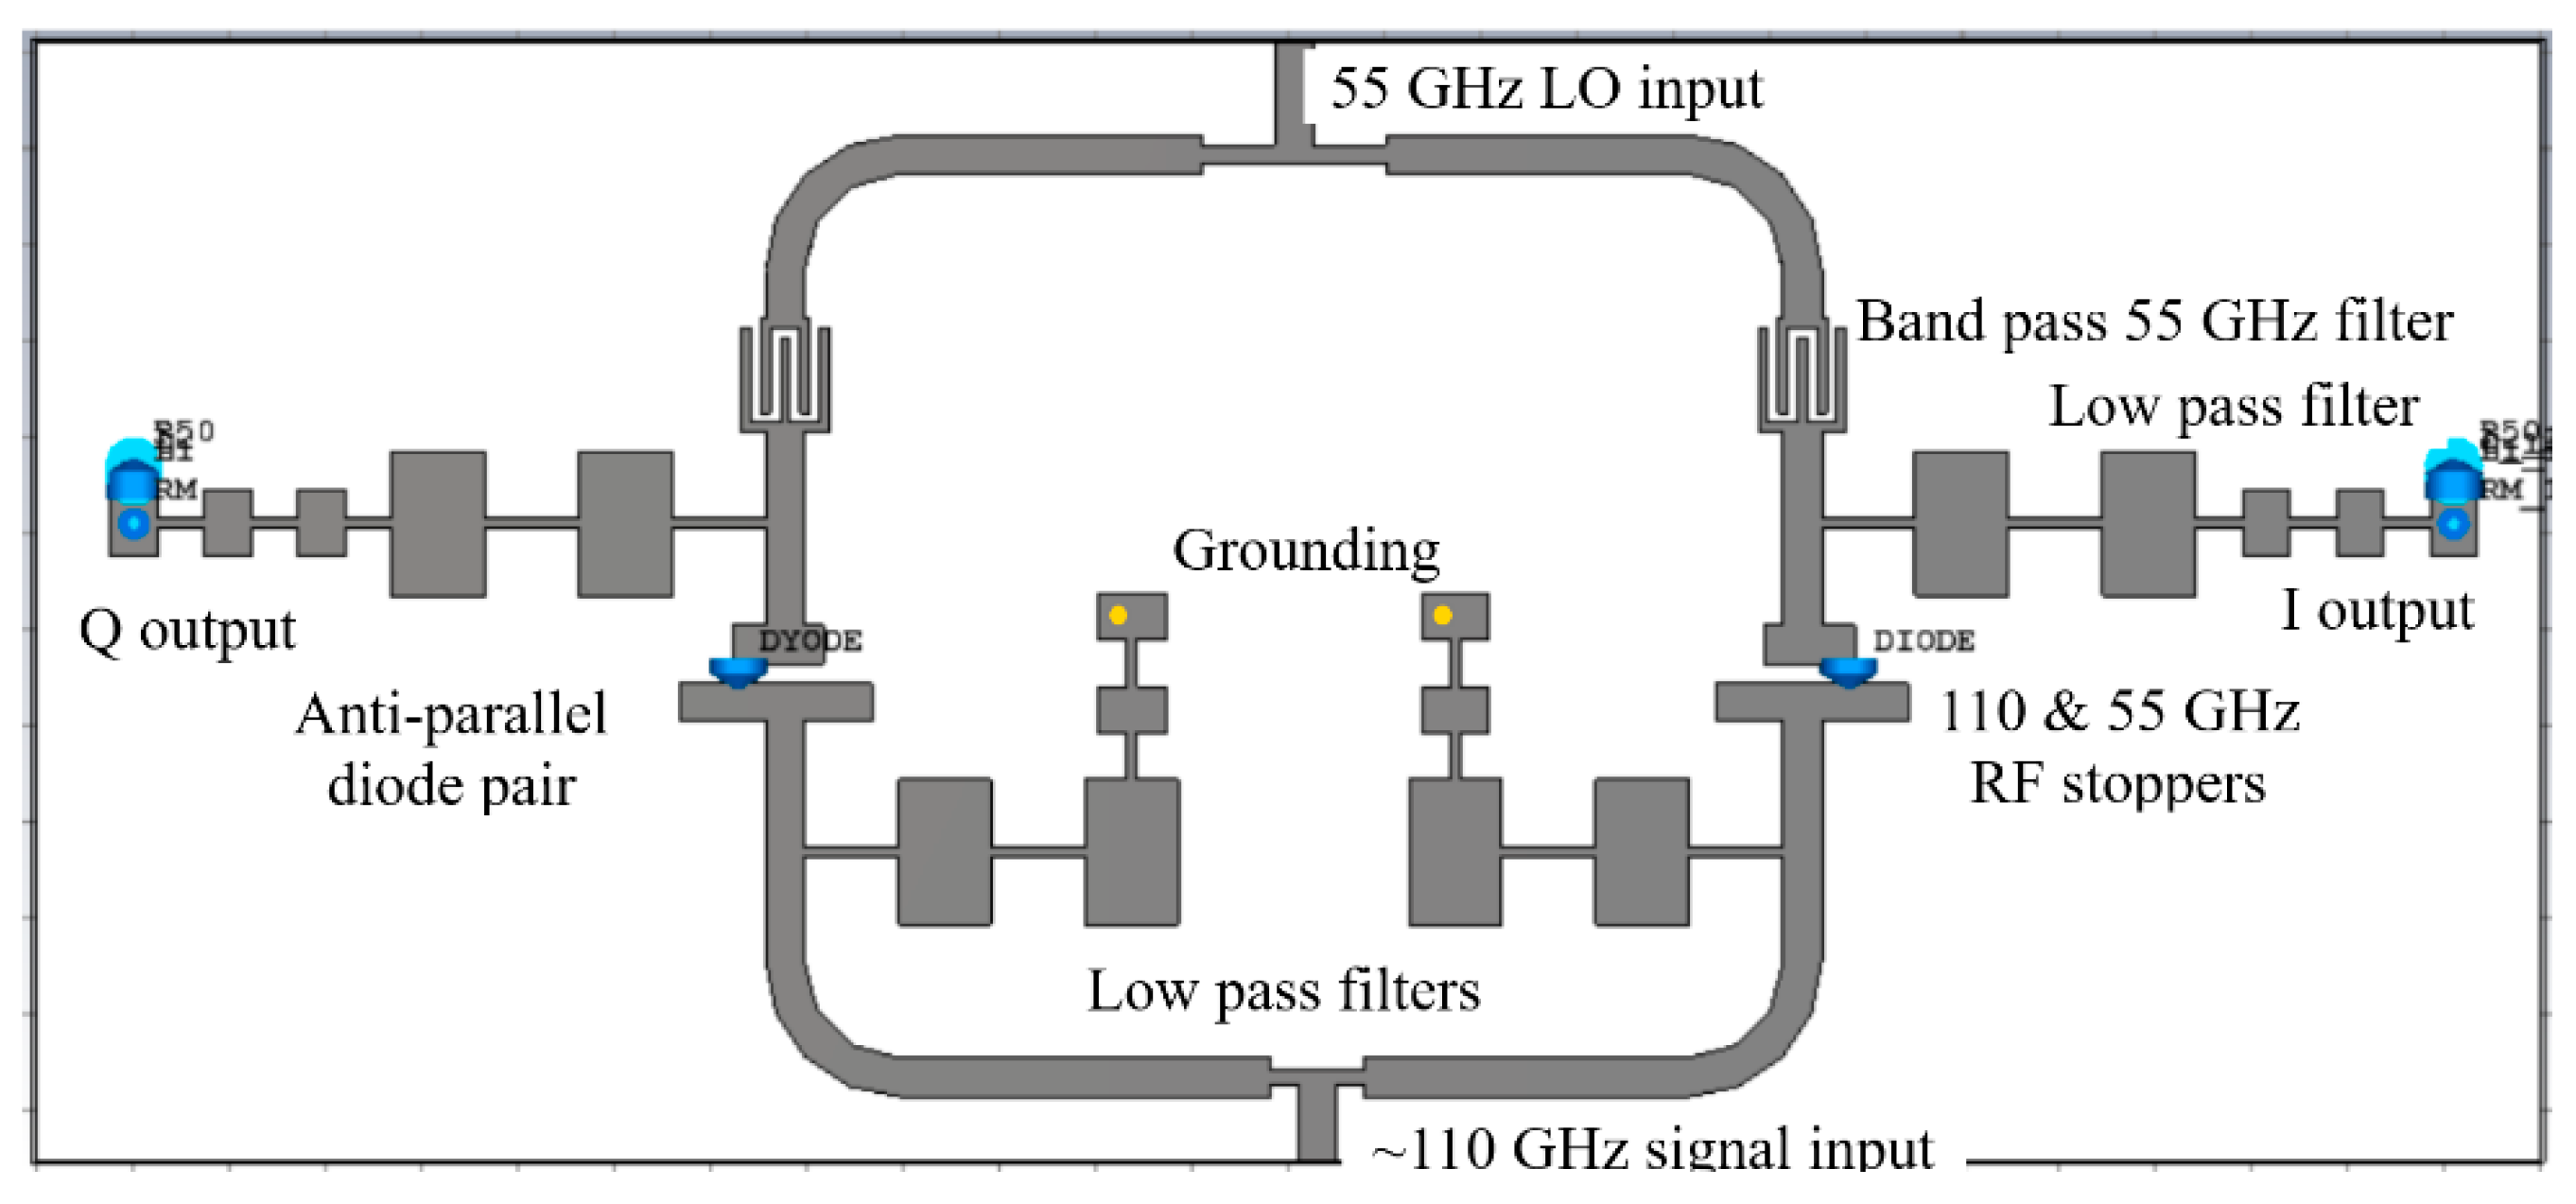
Figure 7.
Comparison of volt-ampere (I-V) curves of the measured and simulated parameters of anti-parallel diode pair, used in the design (a) and the detector signal (I or Q) as a function of LO power (b).
Figure 7.
Comparison of volt-ampere (I-V) curves of the measured and simulated parameters of anti-parallel diode pair, used in the design (a) and the detector signal (I or Q) as a function of LO power (b).
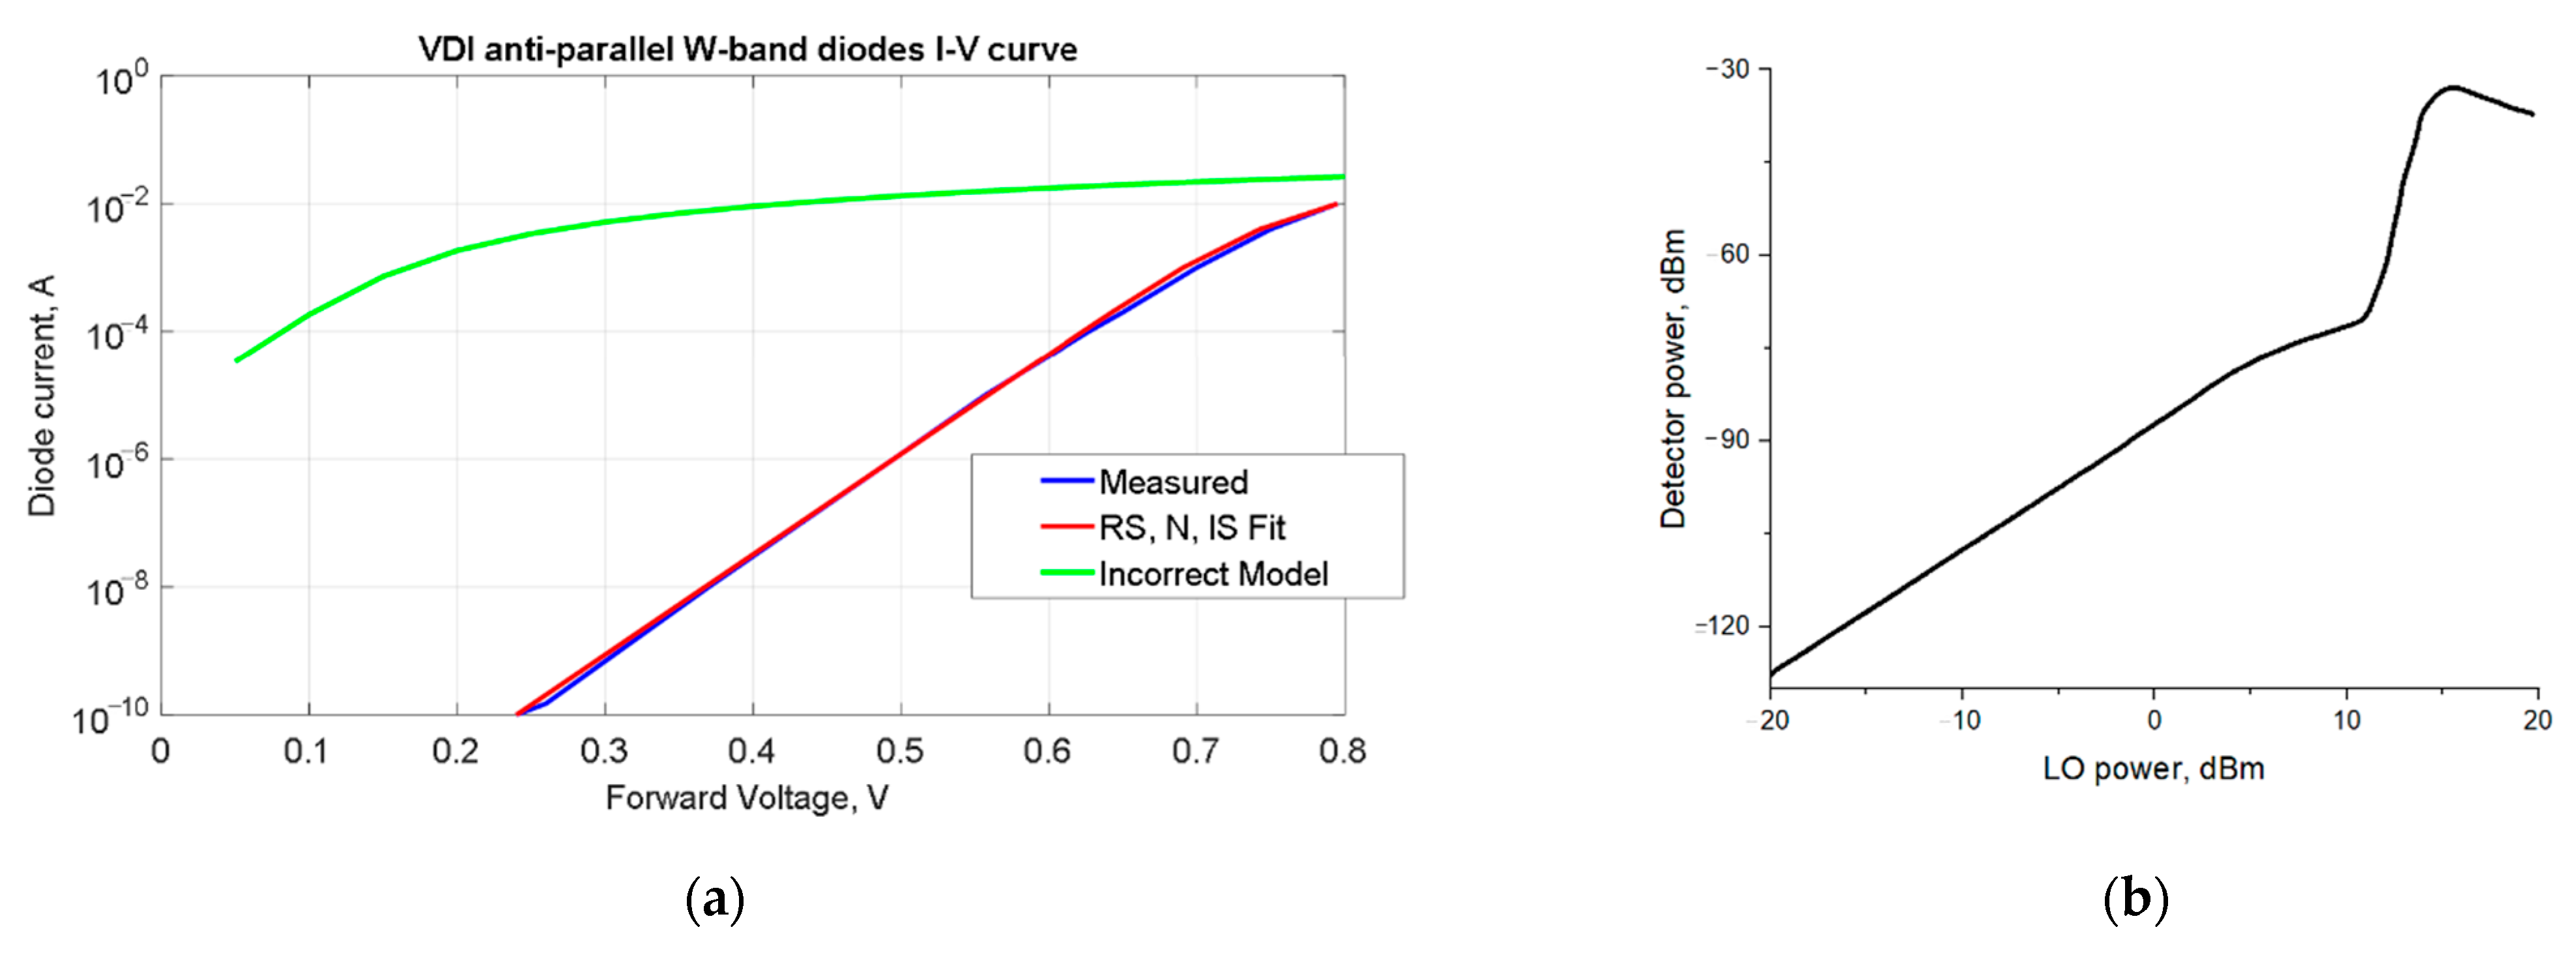
Figure 8.
Simulated signals at the I and Q outputs of the designed quadrature mixer.
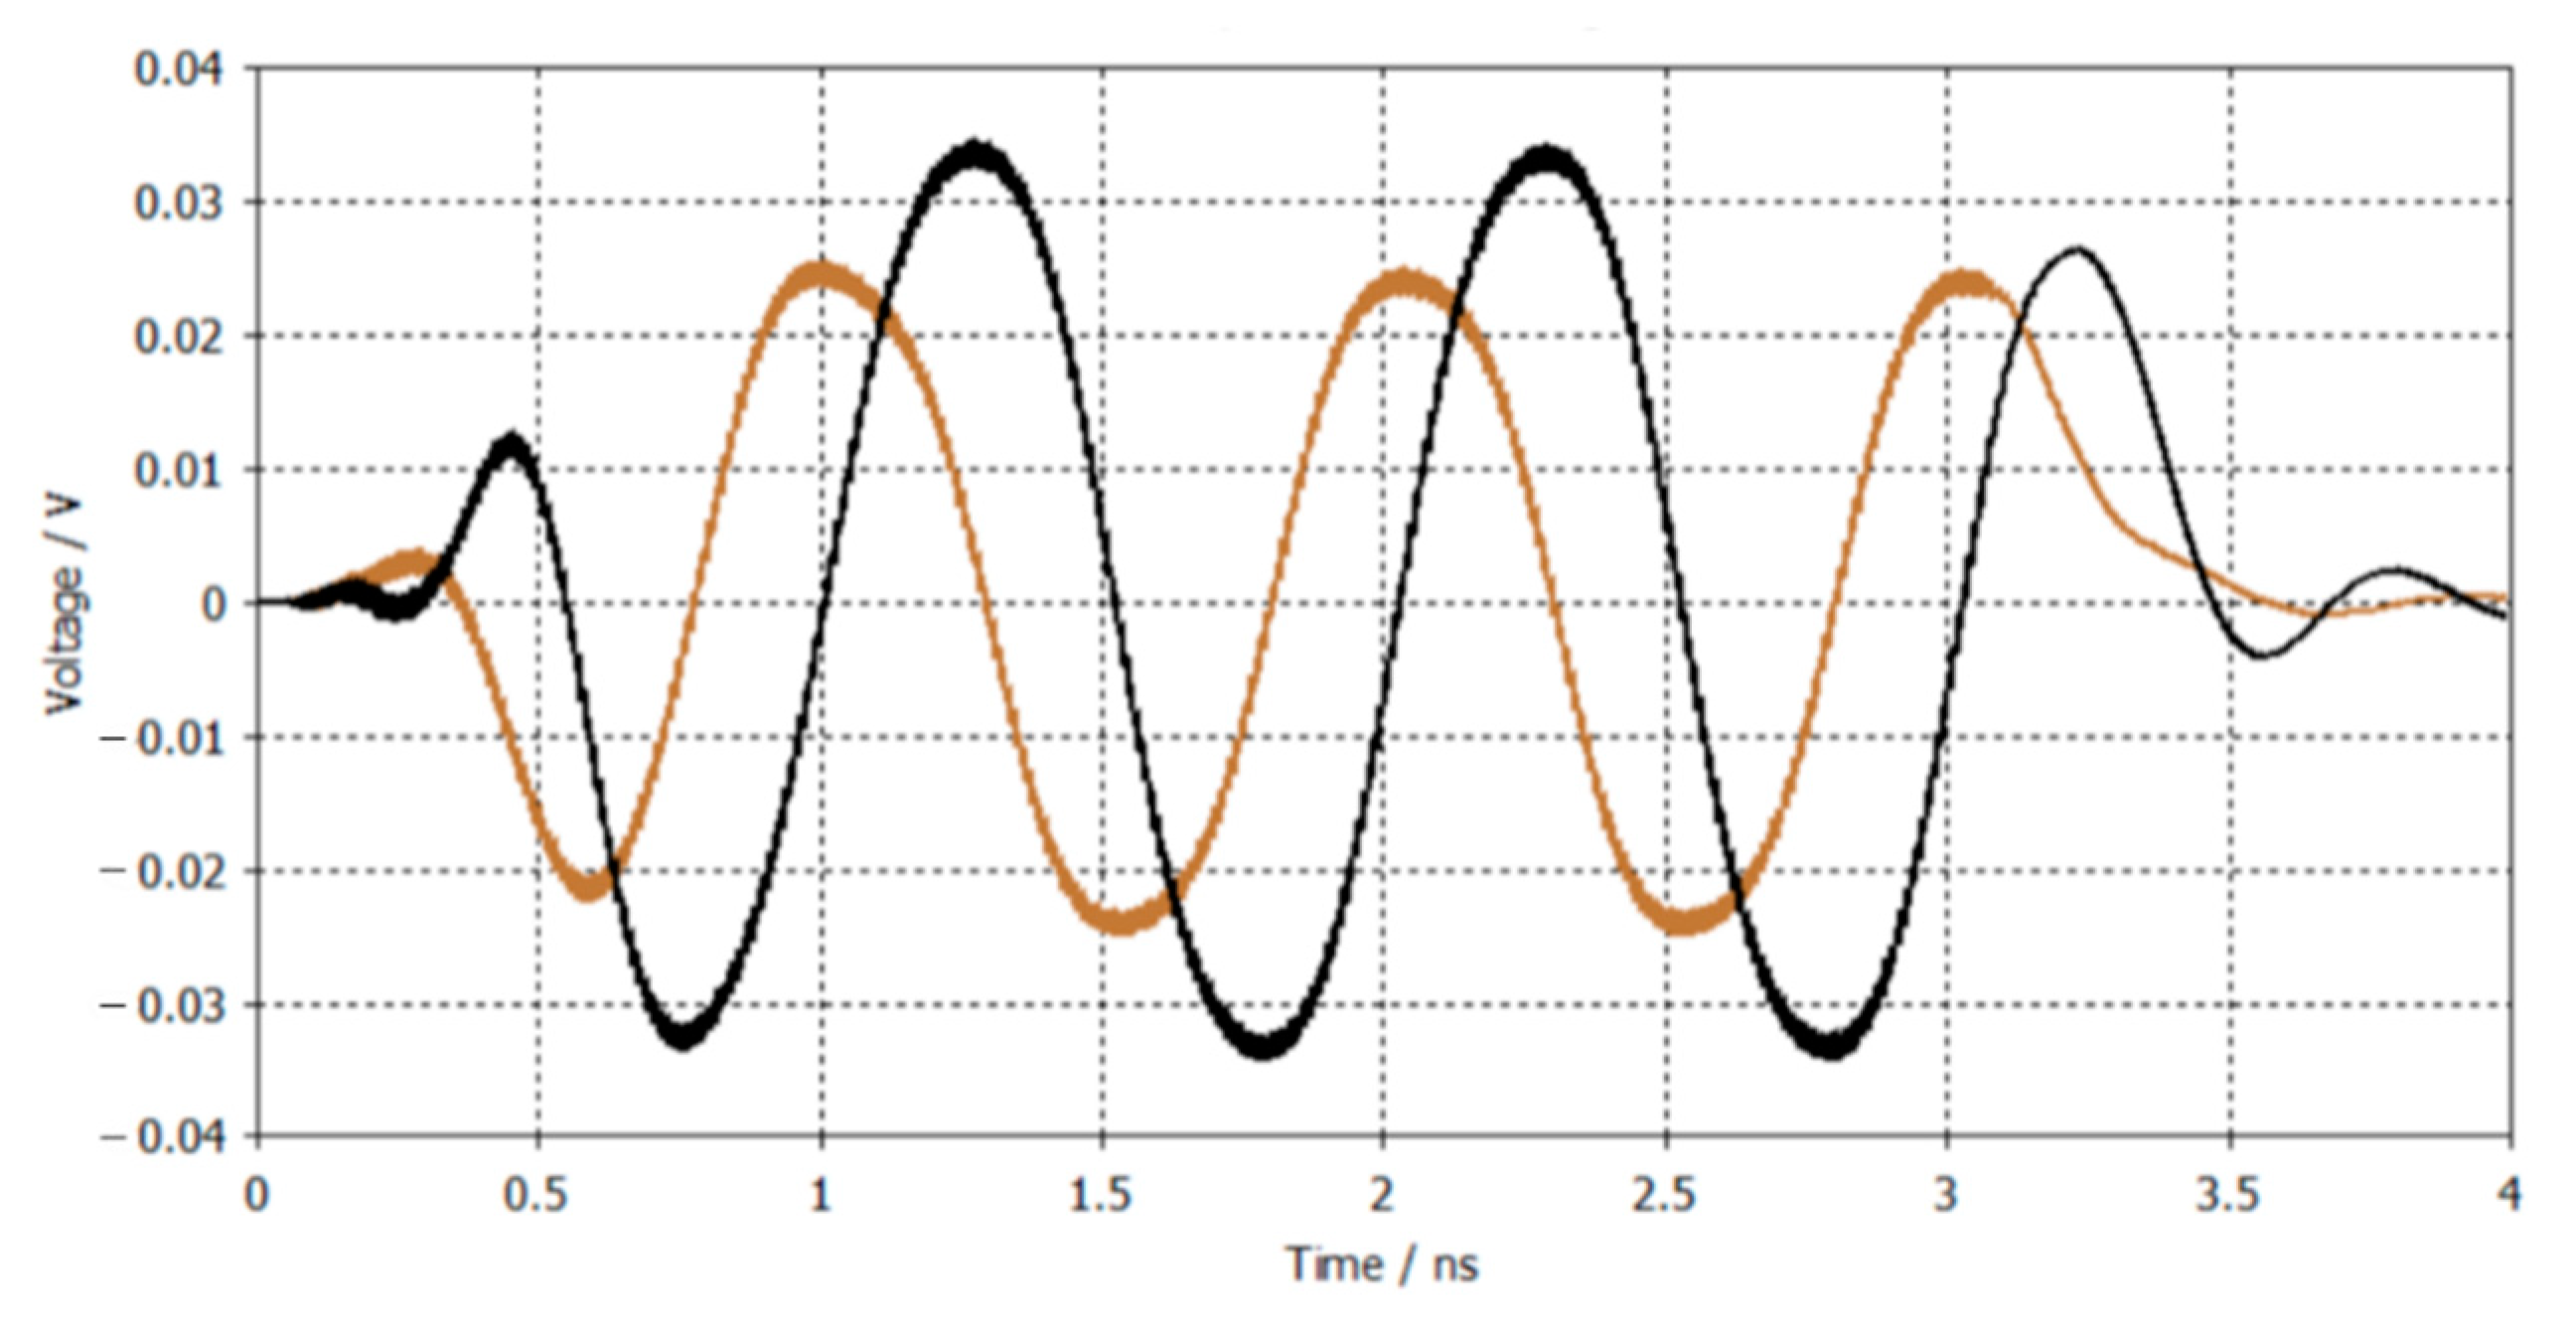
Figure 9.
Schematics (a) and fabricated PCB board (b), containing IQ subharmonic mixer for 110 GHz with antennas for 55 GHz LO oscillator and ~110 GHz input signal with output patch antennas.
Figure 9.
Schematics (a) and fabricated PCB board (b), containing IQ subharmonic mixer for 110 GHz with antennas for 55 GHz LO oscillator and ~110 GHz input signal with output patch antennas.
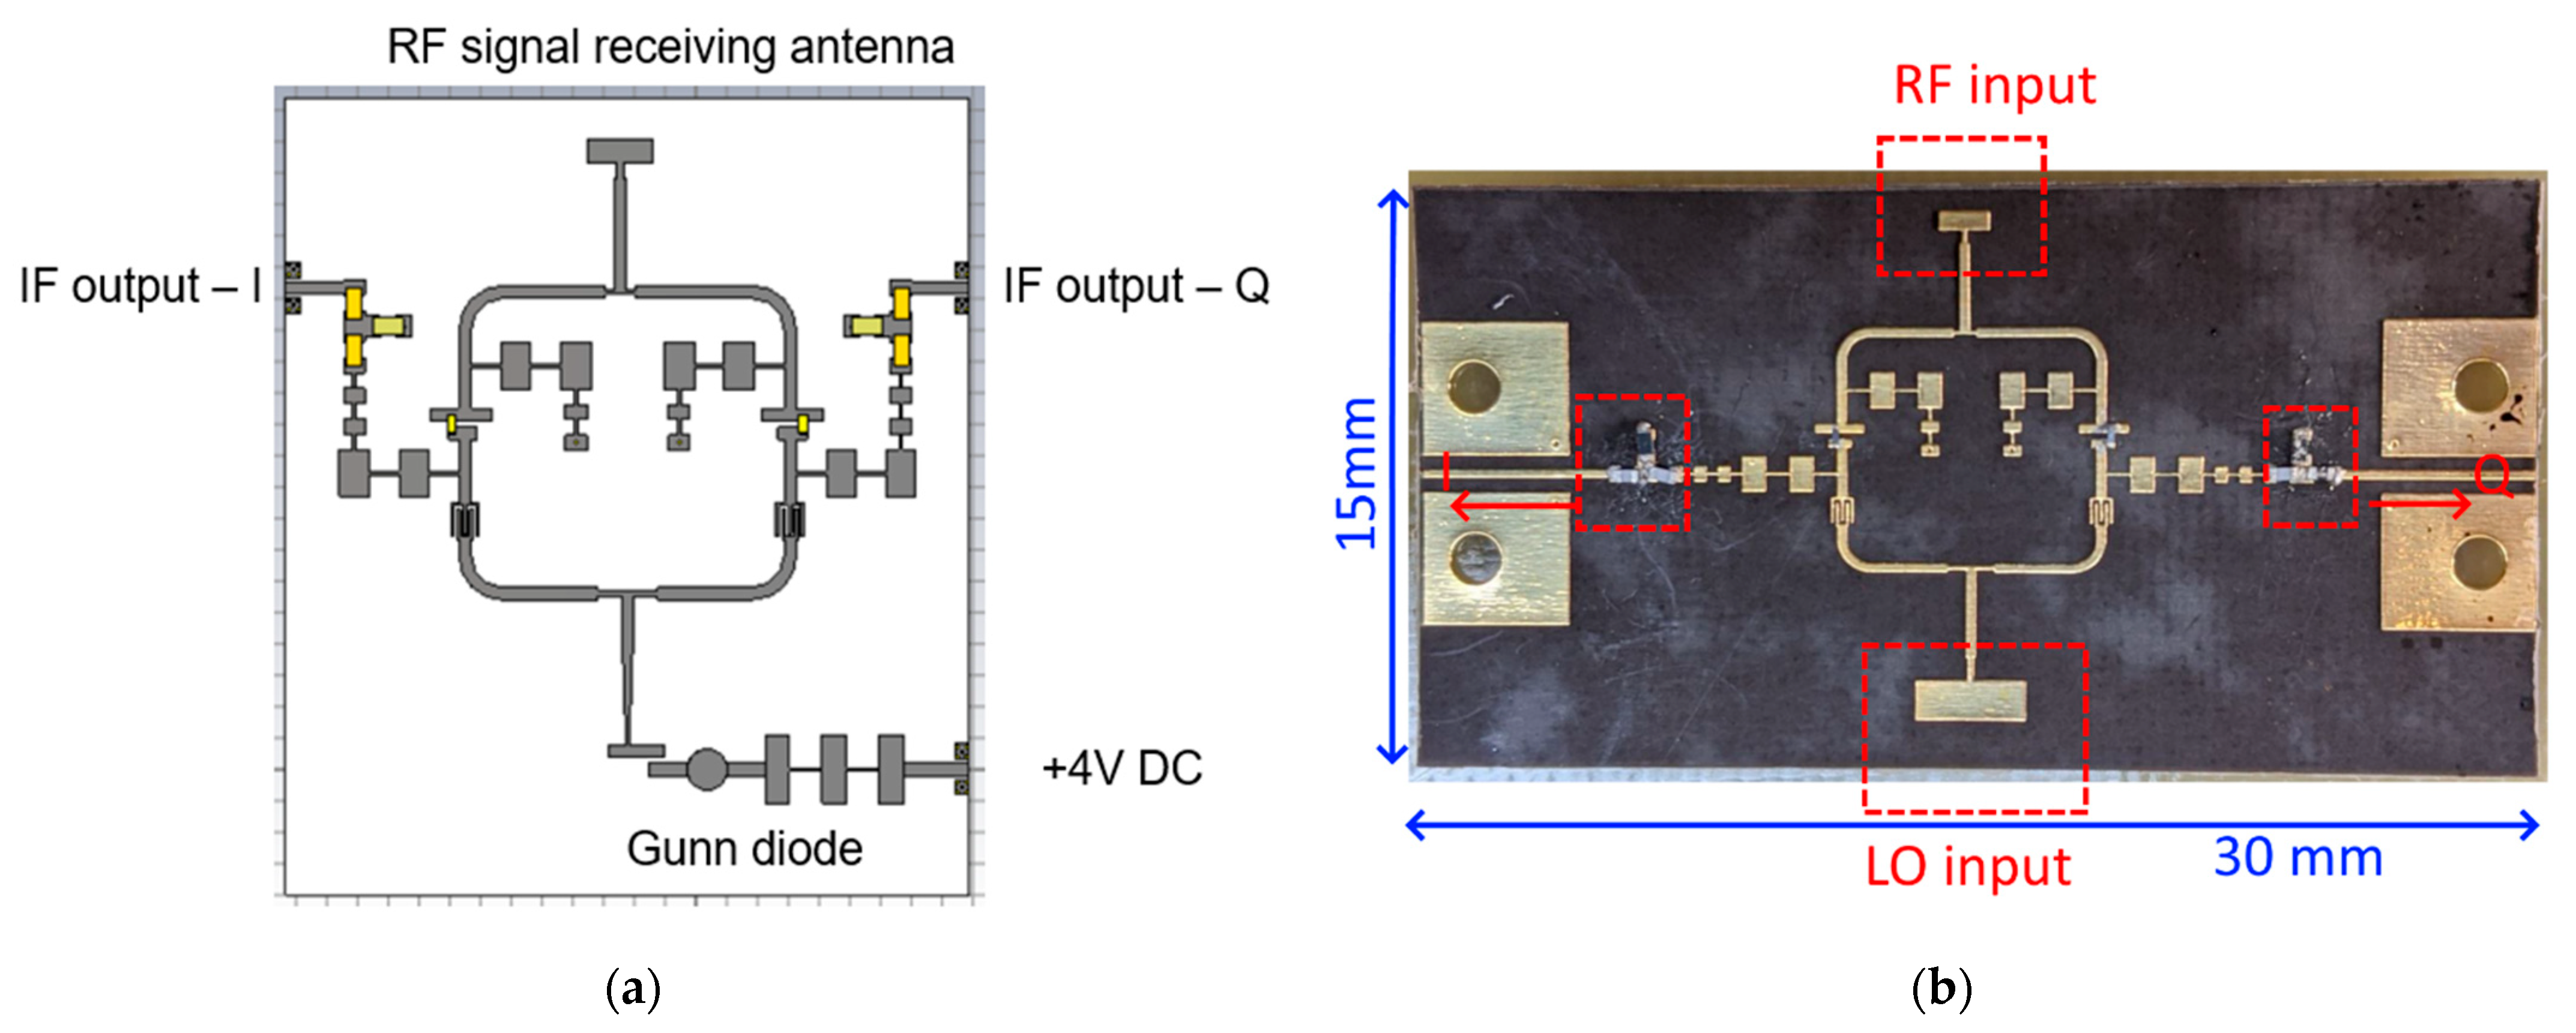
Figure 10.
LO signal source PCB (a) based on 55 GHz Microsemi GaAs Gunn and source measurement stand with the measured 3.002 GHz peak, corresponding to 13.0 GHz × 4 + 3.002 GHz = 55.002 GHz source frequency (b).
Figure 10.
LO signal source PCB (a) based on 55 GHz Microsemi GaAs Gunn and source measurement stand with the measured 3.002 GHz peak, corresponding to 13.0 GHz × 4 + 3.002 GHz = 55.002 GHz source frequency (b).
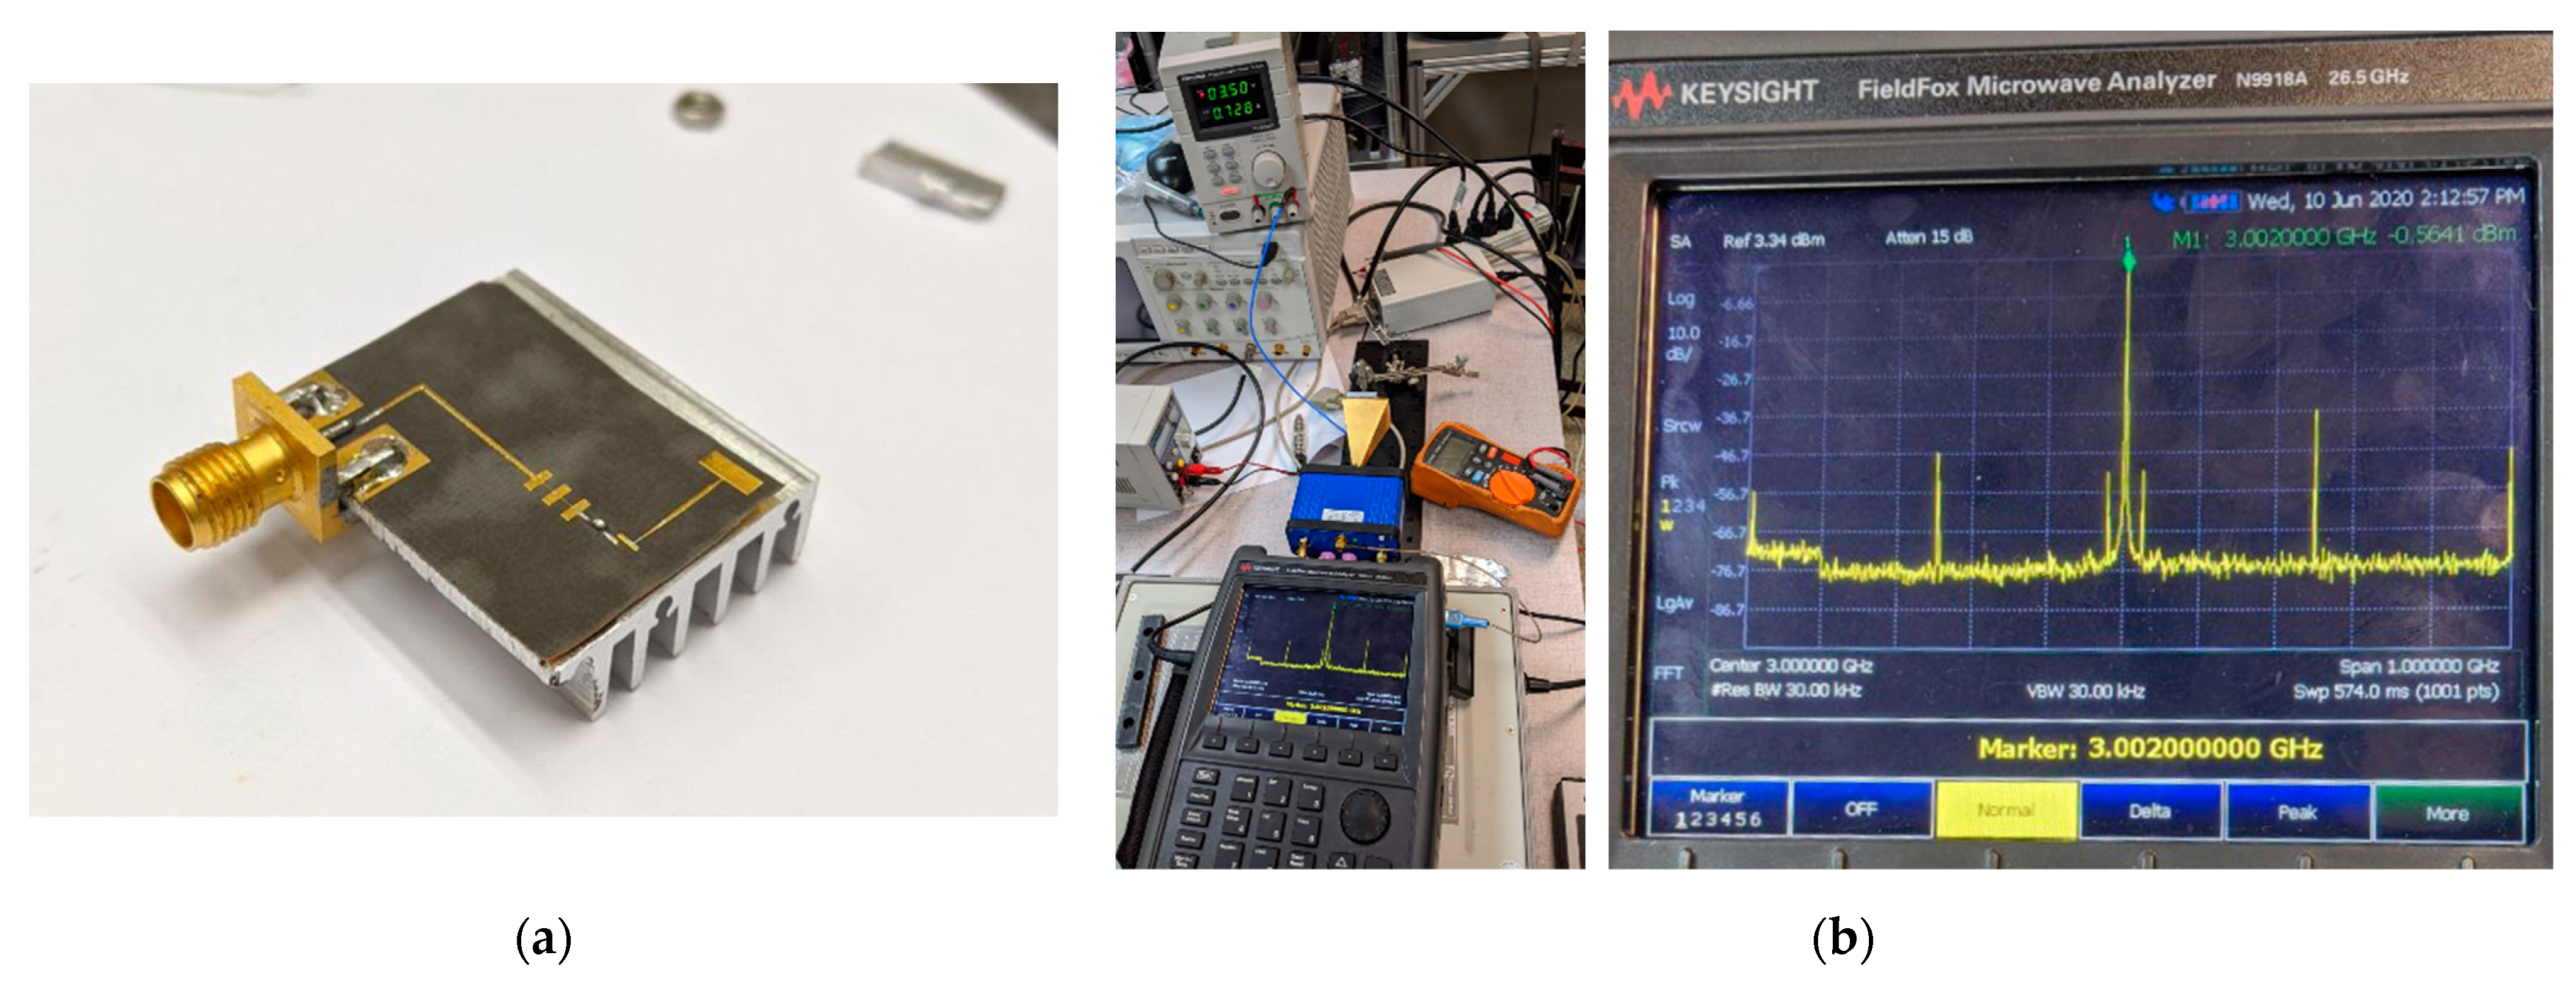
Figure 11.
Block diagram of the updated capture module (a): SMA—coaxial RF connector, VGA—variable gain amplifier, Comp—high-speed comparator, HMC988—frequency divider, TDC7201—time-to-digital converter, DAC—digital-to-analog converter, ADC—analog-to-digital converter, MCU—microcontroller unit, FPGA—field-programmable gate array. Pulse-signal digitizer module (b).
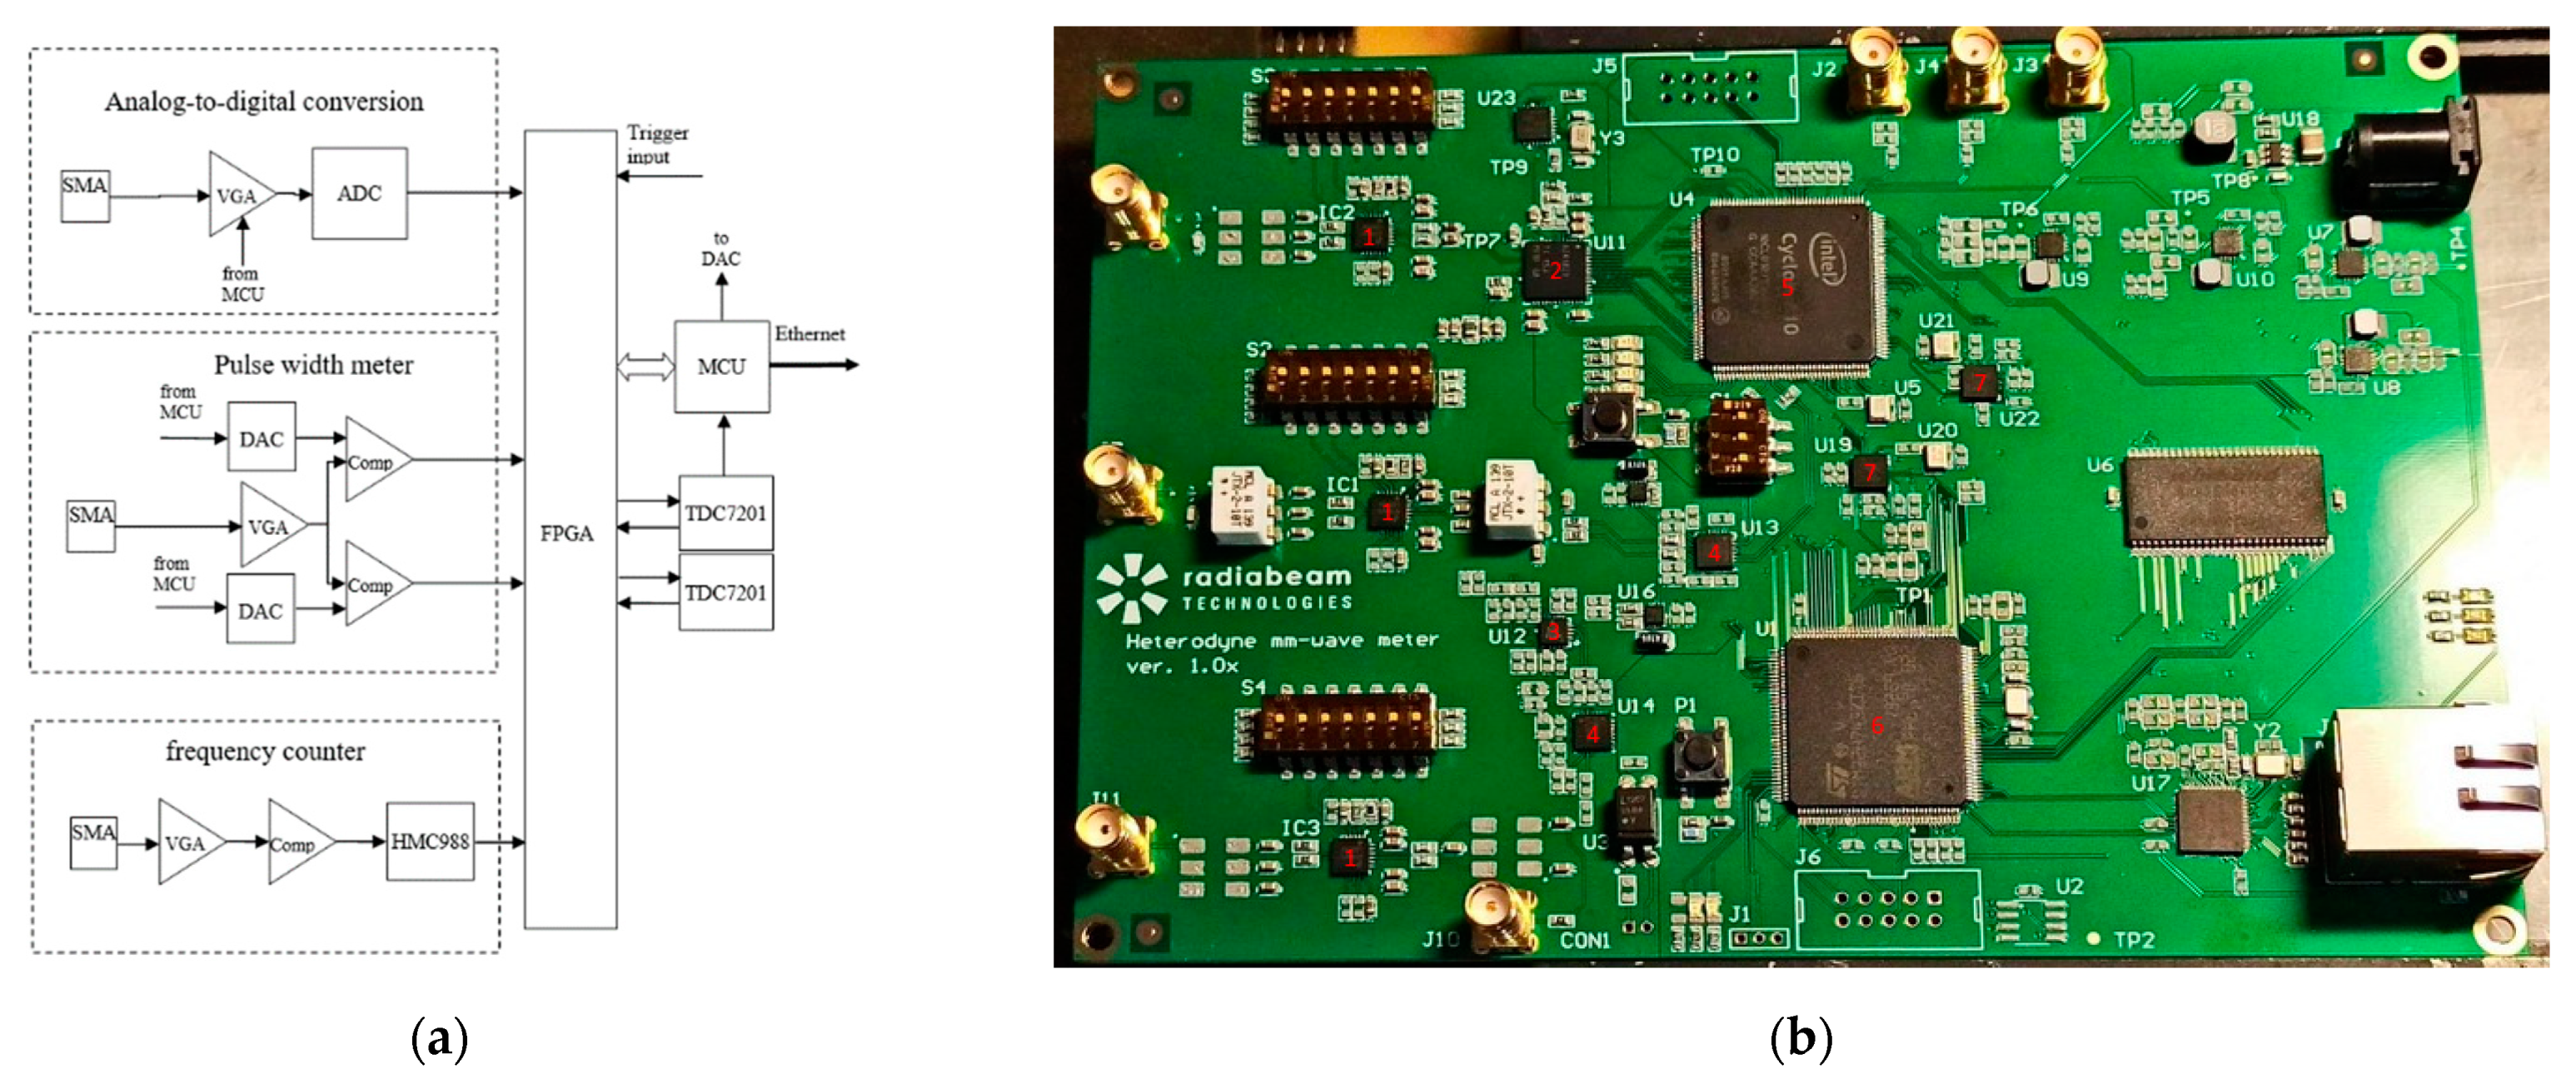
Figure 12.
Pulse length measurement boards during the debugging (a) and the measured signal of a 10 ns-long pulse filled with a 1.6 GHz IF signal (b).
Figure 12.
Pulse length measurement boards during the debugging (a) and the measured signal of a 10 ns-long pulse filled with a 1.6 GHz IF signal (b).
Publisher’s Note: MDPI stays neutral with regard to jurisdictional claims in published maps and institutional affiliations. |
© 2021 by the authors. Licensee MDPI, Basel, Switzerland. This article is an open access article distributed under the terms and conditions of the Creative Commons Attribution (CC BY) license (https://creativecommons.org/licenses/by/4.0/).
Share and Cite
MDPI and ACS Style
Kutsaev, S.V.; Goncharik, V.; Murokh, A.; Rezanov, I.; Shchegolkov, D.; Smirnov, A.Y. Pulse Length Monitor for Breakdown Diagnostics in THz and Mm-Wave Accelerators. Photonics 2021, 8, 442. https://doi.org/10.3390/photonics8100442
AMA Style
Kutsaev SV, Goncharik V, Murokh A, Rezanov I, Shchegolkov D, Smirnov AY. Pulse Length Monitor for Breakdown Diagnostics in THz and Mm-Wave Accelerators. Photonics. 2021; 8(10):442. https://doi.org/10.3390/photonics8100442
Chicago/Turabian StyleKutsaev, Sergey V., Vladimir Goncharik, Alex Murokh, Ilya Rezanov, Dmitry Shchegolkov, and Alexander Y. Smirnov. 2021. "Pulse Length Monitor for Breakdown Diagnostics in THz and Mm-Wave Accelerators" Photonics 8, no. 10: 442. https://doi.org/10.3390/photonics8100442
Note that from the first issue of 2016, this journal uses article numbers instead of page numbers. See further details here.