Numerical Investigation on a Hyperlens with a Large Radius Inner-Surface for Super-Resolution Imaging


1
School of Control Engineering, Northeastern University at Qinhuangdao, Qinhuangdao 066004, China
2
College of Information Science and Engineering, Northeastern University, Shenyang 110004, China
3
College of Information & Control Engineering, Shenyang Jianzhu University, Shenyang 110168, China
*
Author to whom correspondence should be addressed.
Photonics 2020, 7(4), 107; https://doi.org/10.3390/photonics7040107
Submission received: 16 October 2020
/
Revised: 3 November 2020
/
Accepted: 4 November 2020
/
Published: 10 November 2020
(This article belongs to the Special Issue Advanced Metamaterials and Metadevices)
Abstract
:Hyperlensing devices have drawn great attention in recent years due to their ability to amplify the subwavelength image of objects with more detail and information. In this work, a hyperlens with a radian inner surface is designed and demonstrated. The proposed hyperlens is capable of imaging different types of sub-wavelength objects efficiently. Plasmonic resonant cavity is also employed in order to achieve a super-resolution imaging effect. Different objects are investigated to test the performance of the proposed hyperlens. As expected, our hyperlens shows better tolerance than the conventional hyperlensing designs and can achieve imaging resolution down to 60 nm for different types of objects.
1. Introduction
The resolution of a conventional optical imaging system is generally constrained by the diffraction limit, which denotes that high spatial frequency information carried by evanescent waves cannot be captured by a normal object lens. To overcome this limit, many methods have been proposed, such as stimulated emission depletion (STED) [1], structured illumination microscopy (SIM) [2], and near-field scanning optical microscopy (NSOM) [3]. These methods, also known as super-resolution imaging technologies, possess the ability to achieve high resolution below the diffraction limit. However, despite the improvement in resolution, they require scanning of the objects or reconstructing of the image, which has greatly hindered the real-time imaging ability. On the other hand, the perfect lens was first proposed by Pendry [4] and then the concept of overcoming the diffraction limit (superlens) [5,6,7,8] was demonstrated. An optical superlens can achieve super-resolution imaging by enhancing the evanescent waves. However, the evanescent waves enhanced by a superlens still decay, which can cause problems for far-field imaging. In order to solve this problem, an optical hyperlens was proposed and investigated [9,10,11,12,13,14,15,16,17,18,19,20,21,22,23,24]. Firstly, a cylindrical hyperlens was experimentally demonstrated by Liu and coworkers in 2007 [25]. Moreover, with the progress of nanoprocessing technologies, hyperlensing devices with spherical geometries have been fabricated and examined for biomolecular imaging [13,14,15,16]. Due to the tiny size of a single hyperlens, hyperlens-array was also employed in biomolecular imaging experiments [13]. A hyperlens can amplify the subwavelength image of objects with detailed information. The images obtained by a hyperlens can be detected by a conventional optical lens in the far-field [25,26]. Both spherical and cylindrical geometries have a strict restriction for objects [26,27,28,29,30]. Evanescent waves emitted from objects decay exponentially in air, which means that the distance between the inner surface of a hyperlens and the objects must be close enough. When the inner-surface and objects are separated by more than one hundred nanometers, the imaging resolution will decrease drastically. Even for a novel device for which an extra hyperlens is employed to make the inner-surface of a hyperlens flat, the inner-surface must be positioned adjacent to the objects [11,23], which still limits the practical applications of the hyperlens.
In this paper, we propose an elegant design of hyperlens with a radian inner surface, which is suitable for more types of objects. Slits with tiny scale have always been employed as objects to explain the imaging ability of a hyperlens [31,32,33]. These slits are normally employed as a stable source to simulate the fluorescence imaging. Here, we exchange the medium of slits and layers in constrained objects to simulate none-fluorescent imaging. The replaced objects are called unconstrained objects. The proposed hyperlens also shows great potential in imaging unconstrained objects in the sub-diffraction range with a relatively high imaging resolution by employing a plasmonic resonant cavity around the objects [26]. Simultaneously, the large radian part of the proposed hyperlens has a slightly magnifying ability, which is additionally beneficial for final imaging resolution. Calculation results with different wavelengths are also demonstrated.
2. Materials and Methods
A hyperlens consists of alternative stacked sub-wavelength metal (for instance, silver) and dielectric (for instance, alumina and titanium oxide) layers. According to the effective medium approximation, alternative stacked metal and dielectric layers can be approximated as one homogenous material with anisotropic permittivity, if the characteristic thickness of the layers is much smaller than the wavelength. The anisotropic permittivity is given as follows:
where is the filling ratio of the metal/dielectric structure (in this case, = 0.5), and are the radial permittivity and tangential permittivity of the structure, respectively. Here, we employ silver ([23]) as metal and alumina ([24]) as dielectric to compose the hyperlens (incident wavelength is set to 365 nm), so the permittivity of the hyperlens can be calculated as 0.4079 + 0.1244i and −16.7786 + 7.0793i. The dispersion relation of hyperlens can be expressed as (3):
where and are the wave components along radial and tangential directions, is the angular frequency of the incident wave, and is the speed of light in vacuum. A conventional optical lens is restricted by in imaging, which means only information with wavevectors below can be detected. One of the methods to promote detecting range is to increase . Many efforts have been tried to expand of a lens [1,2], as the red dashed circle shows in Figure 1a. Another method to promote imaging resolution is by changing the shape of dispersion relation. When we employ the material permittivity calculated by (1) and (2), the dispersion relationship of our hyperlens, calculated by Equation (3), is hyperbolic shaped as shown in Figure 1a (blue lines). With the same incident wave, the hyperbolic curve is flatter when is getting lower. Generally, a flatter dispersion relation is expected.
Figure 1b illustrates the working principle of a traditional hyperlens which only involves cylindrical shaped periodic layers. A chromium layer is normally placed on the inner surface of a hyperlens and the slits in the chromium layer are employed as objects and illuminated by the incident light. For comparison, Figure 1c shows the schematic structure of our hyperlens with a large radian inner surface. The proposed hyperlens is divided into two parts, inner lens and outer lens. The outer lens is a conventional hyperlens which is composed of cylindrical shaped periodic stacked silver-alumina multilayers. The inner radius and outer radius of the outer lens are set to 100 nm and 260 nm, respectively. Each silver or alumina layer is set to 10 nm. The inner lens is part of hyperlens with larger radius compared with the outer lens. The radius of inner lens determines the imaging space of the hyperlens. Here, we set the radius of inner lens to 260 nm. The distance between the vertex of the arc and the inner-surface of outer lens along the vertical direction is 80 nm, silver-alumina alternative stacked layers with 10 nm thickness are employed to fill in this space which can also provide an extra magnifying effect.
Considering the conditions of bioimaging, we employ two kinds of objects here, as shown in Figure 2. The first kind of object is filled into the cavity of hyperlens, as shown in Figure 2a. Two sub-wavelength slits in chromium are employed as objects and both slits have 20 nm width. The innermost silver and alumina layer need to be employed as an object layer. The center-to-center distance between the two slits is changed to explore the imaging resolution limits of our hyperlens. When we employ hyperlens for bioimaging applications, specimens that need to be imaged are not as stable as the objects mentioned above. This means that practical imaging conditions are quite different with the above-mentioned objects. Thus, new objects need to be employed and considered in order to make our calculation conditions similar to the real bioimaging experiments. Two chromium cuboids are employed as objects, as shown in Figure 2b. The cross section of these cuboids has 30 nm width. In order to realize free objects imaging, a silver layer is employed to form a plasmonic resonant cavity with the innermost space of our hyperlens. Polymethyl methacrylate (PMMA) is filled into the rest area of the plasmonic resonant cavity. This plasmonic resonant cavity enhanced hyperlens can be used to achieve phase contrast imaging, which has higher image contrast than a conventional hyperlens [20].
3. Results and Discussion
COMSOL Multiphysics was used to simulate the imaging results of this device. We employed a 2D model to illustrate the cross section of our hyperlens. Scattering boundary conditions with nonincident field were used and physics-controlled meshes with ultra-fine size were employed. Different wavelengths and geometric parameters have been considered. Figure 3a shows curves of and when the wavelength changes. Red and blue curves represent and , respectively. The wavelength of 365 nm shows a great negative value of and a relatively large positive value of . When the wavelength is below 365 nm, a sharply increased and slowly increased will cause a worse performance of the hyperlens. Figure 3b shows how the transmission is influenced by thickness of each layer of hyperlens. Transmission decreases when the thickness is increased, but a smaller thickness also causes a decreasing resolution.
Figure 4 shows the calculated results with different distances above the hyperlens. Figure 4a is the schematic diagram and Figure 4b shows the electric field intensity with different distances (distance between the objects are set to 60 nm). The red line, dark blue line, and blue dashed line represent 300 nm, 100 nm, and 50 nm distances, respectively. As shown in Figure 4b, when a 100 nm detecting distance is employed, two peaks of the curve are just resolvable. Only one peak is founded in the curve for the 300 nm distance. A closer detecting distance means higher resolution, as shown by the blue dashed line in Figure 4b. If one can detect electric intensity at the surface of a hyperlens, ultrahigh resolution could be realized. In order to make our simulations more practical, we employ 100 nm detecting distance to illustrate the resolution of our hyperlens.
Figure 5 shows the calculated results of our hyperlens. The hyperlens is illuminated by a transverse magnetic (TM) polarized light source with 365 nm wavelength. Line graphs are also plotted to further illustrate the resolution of our hyperlens. The original data of line graphs is the electric field intensity distribution along the horizontal line which is 100 nm above the hyperlens. Figure 5a–c shows the line graphs with 60 nm, 70 nm and 80 nm center-to-center distances between objects, respectively. According to these line graphs, we sort out that the electric field at the edges is rising when the center-to-center distance between objects is increasing, which is harmful to the final imaging quality. Therefore, we find out that our hyperlens has an optimal imaging interval which should be less than 80 percent of the inner-lens diameter. Note that the rising of electric field intensity at edges would pull down the quality of imaging. Besides, the magnification of our hyperlens is fluctuating within the imaging interval. This is because the electric field can be scattered at the interface between the inner-lens and outer-lens, which may cause a relatively decentralized electric field outside the hyperlens. Figure 5d shows the electric field distribution inside the hyperlens with filled objects under 60 nm, 70 nm, and 80 nm center-to-center distance.
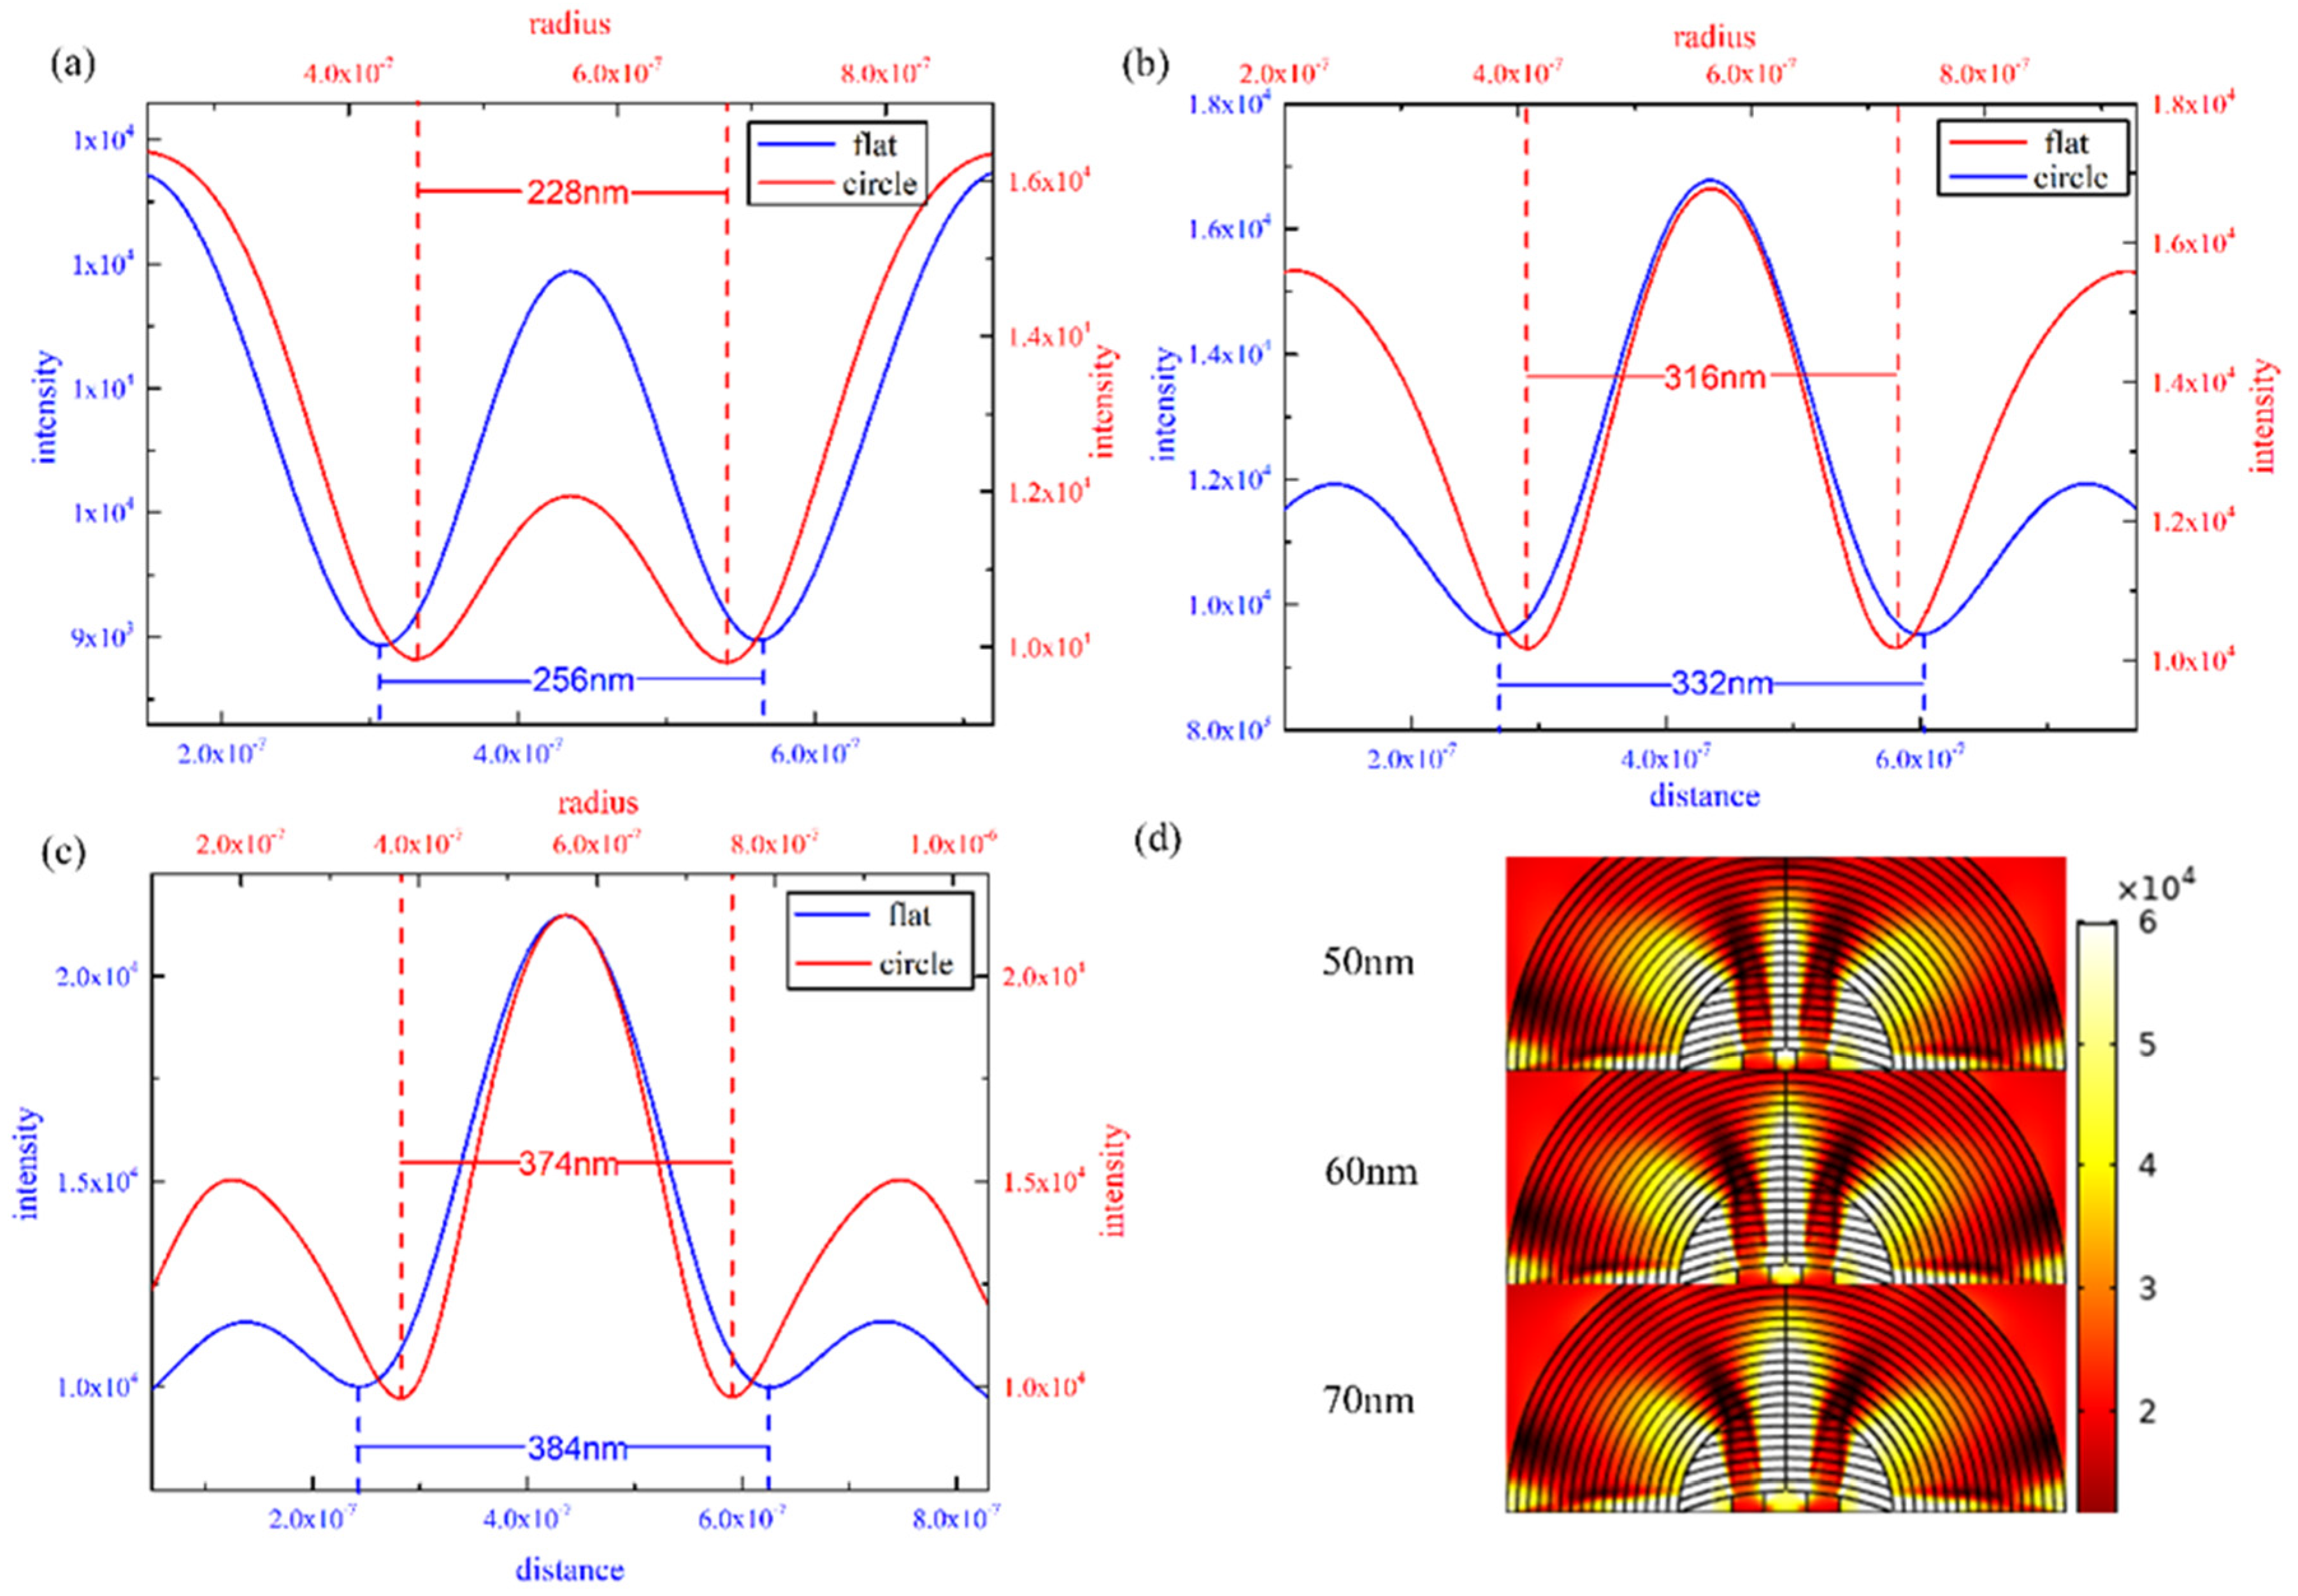
Figure 6 shows the imaging performance for unconstrained objects by using our hyperlens. Figure 6a–c shows the electric field intensity distribution by line graphs when the distance between objects is 50 nm, 60 nm, and 70 nm, respectively. We employed two methods to simulate the data collection process. The flat source represents a flat surface above the hyperlens with 100 nm distance and the circle source represents a spherical surface with 100 nm radius. The circle source was employed for the purpose of an expanded detecting range. The side peaks expressed by a flat source decrease sharply with increasing distances. The employment of a circle source has confirmed this phenomenon that a relatively high side peak is contained. As shown by red lines (circle source) and blue lines (flat source), data supported by the flat source only shows better performance at 50 nm distance, and data supported by the circle source still has higher intensity. For objects with 50 nm distance, there are two clear troughs which denote that objects are clearly resolved, as shown in Figure 6a. But when objects are placed more than 60 nm distance apart, the imaging effect shown by the blue line is not as predicted. The intensity distribution curve has a relatively low value at both sides, which should be higher than 50 nm as predicted. This is because our hyperlens has a special structure, in which the top of the plasmonic resonant cavity is an arc. When the objects are placed with a relatively large distance, edges of the cavity have a higher angle, which restricts the imaging performance by the flat source. However, this restriction plays a relatively small role when the circle source is employed. As shown in Figure 6b,c, red lines have much higher intensity at edges than blue lines, which means red lines show better imaging performance. In Figure 6a–c, curves represented by flat source and circle source only show slight differences. The main reason is that curves represented by circle source have a closer distance to the outer surface of the hyperlens than the flat source (flat source is placed only 100 nm horizontally above the hyperlens).
4. Conclusions
To conclude, a novel hyperlensing device with a radian inner surface is proposed for super-resolution imaging applications. Different objects are employed to test the performance of our hyperlens. Both conventional slits objects and unconstrained objects are imaged with resolution below 60 nm at 365 nm wavelength and 100 nm above the hyperlens, which is in the sub-diffraction-limit scale. Better results can be realized with detecting distances lower than 100 nm. A reasonable layer thickness should be taken into consideration as well to ensure the best resolution and transmittance. For unconstrained objects, a plasmonic resonant cavity is employed for imaging. In order to achieve better imaging performance, a semicircular arc is also employed to replace the conventional line as a circle source. Resolution, represented by a circle source, shows a higher upper limit than a flat source. Our hyperlens has great potential of pushing imaging conditions of hyperlens closer to bioimaging. Simultaneously, a hyperlens with different radian inner surfaces has the ability to satisfy different practical conditions when it is applied to nanolithography techniques involving demagnifying, enabling new potential applications.
Author Contributions
Conceptualization, J.Y. and G.S.; methodology, J.L.; software, Q.G.; validation, Y.Y. and G.S.; formal analysis, X.J.; investigation, J.Y. and G.S.; resources, G.S.; writing—original draft preparation, J.Y.; writing—review and editing, G.S.; supervision, G.S.; project administration, X.J.; funding acquisition, X.J. All authors have read and agreed to the published version of the manuscript.
Funding
This research was funded by Natural Science Foundation of Hebei Province (Grant No. F2018501063), the National Natural Science Foundation of China (Grant No. 11704263), the Fundamental Research Funds for the Central Universities Key Scientific Research Guidance Project (Grant No. N2023005), and Hebei Province Science and Technology Plan Key Research Development Project Funds (Grant No. 18273902D).
Conflicts of Interest
The authors declare no conflict of interest.
References
- Kohei, O.; Terumasa, H.; Yuichi, K.; Tomomi, N. STED microscopy—Super-resolution bio-imaging utilizing a stimulated emission depletion. Microscopy 2015, 64, 227–236. [Google Scholar]
- Chen, H.K.; Wei, S.B.; Wu, X.J.; Yang, Y.; Zhang, Y.Q.; Du, L.P.; Liu, J.; Zhu, S.W.; Yuan, X.C. Improved interference configuration for structured illumination microscopy. Opt. Commun. 2017, 384, 59–64. [Google Scholar] [CrossRef]
- Zhang, W.; Chen, Y. Visibility of subsurface nanostructures in scattering-type scanning near-field optical microscopy imaging. Opt. Express 2020, 28, 6696–6707. [Google Scholar] [CrossRef]
- Pendry, J.B. Negative refraction makes a perfect lens. Phys. Rev. Lett. 2000, 85, 3966–3969. [Google Scholar] [CrossRef] [PubMed]
- Mang, M.M.; Lloyd, D.T.; Anderson, P.N.; Treacher, D.; Wyatt, A.S.; Hooker, S.M.; Walmsley, I.A.; O’Keeffe, K. Spatially resolved common-path high-order harmonic interferometry. Opt. Lett. 2018, 43, 5275–5278. [Google Scholar] [CrossRef]
- Zhao, C.; Zhou, Y.S.; Gao, Q.; Zhang, Y. The imaging properties of the curved superlens. Opt. Commun. 2018, 407, 41–45. [Google Scholar] [CrossRef]
- Wang, J.; Sheng, Y.L. Thin metal superlens imaging in nanolithography. Int. J. Opt. 2019, 2019, 6513836. [Google Scholar] [CrossRef]
- Du, W.J.; Kong, W.J.; Liu, H.C.; Liu, K.P.; Wang, C.T.; Luo, X.G. Design of a structured bulk plasmon illumination source for enhancing plasmonic cavity superlens imaging. Plasmonics 2017, 13, 1387–1392. [Google Scholar] [CrossRef]
- Aronovich, D.; Bartal, G. Nonlinear hyperlens. Opt. Lett. 2013, 38, 413–415. [Google Scholar] [CrossRef]
- Sun, J.B.; Shalaev, M.I.; Litchinitser, N.M. Experimental demonstration of a non-resonant hyperlens in the visible spectral range. Nat. Commun. 2015, 6, 7201. [Google Scholar] [CrossRef] [Green Version]
- So, S.; Rho, J. Geometrically flat hyperlens designed by transformation optics. J. Phys. D Appl. Phys. 2019, 52, 194003. [Google Scholar] [CrossRef]
- Wang, J.X.; Xu, Y.; Chen, H.S.; Zhang, B.L. Ultraviolet dielectric hyperlens with layered graphene and boron nitride. J. Mater. Chem. 2012, 22, 15863–15868. [Google Scholar] [CrossRef] [Green Version]
- Lee, D.; Kim, Y.D.; Kim, M.; So, S.; Choi, H.J.; Mun, J.; Nguyen, D.M.; Badloe, T.; Ok, J.G.; Kim, K.; et al. Realization of wafer-scale hyperlens device for sub-diffractional biomolecular imaging. ACS Photonics 2017, 5, 2549–2554. [Google Scholar] [CrossRef]
- Si, G.Y.; Zhao, Y.H.; Lv, J.T.; Wang, F.W.; Liu, H.L.; Teng, J.H.; Liu, Y.J. Direct and accurate patterning of plasmonic nanostructures with ultrasmall gaps. Nanoscale 2013, 5, 4309–4313. [Google Scholar] [CrossRef]
- Jiang, X.X.; Gu, Q.C.; Wang, F.W.; Lv, J.T.; Ma, Z.H.; Si, G.Y. Fabrication of coaxial plasmonic crystals by focused ion beam milling and electron-beam lithography. Mater. Lett. 2013, 100, 192–194. [Google Scholar] [CrossRef]
- Si, G.Y.; Jiang, X.X.; Lv, J.T.; Gu, Q.C.; Wang, F.W. Fabrication and characterization of well-aligned plasmonic nanopillars with ultrasmall separations. Nanoscale Res. Lett. 2014, 9, 299. [Google Scholar] [CrossRef] [PubMed] [Green Version]
- Su, D.; Zhang, X.Y.; Ma, Y.L.; Shan, F.; Wu, J.Y.; Fu, X.C.; Zhang, L.J.; Yuan, K.Q.; Zhang, T. Real-time electro-optical tunable hyperlens under subwavelength scale. IEEE Photonics J. 2017, 10, 1–9. [Google Scholar] [CrossRef]
- Chen, Y.A.; Chang, I.L.; Chen, L.W. Spiral hyperlens with enhancements of image resolution and magnification. J. Mod. Opt. 2015, 63, 1029–1034. [Google Scholar] [CrossRef]
- Si, G.Y.; Zhao, Y.H.; Lv, J.T.; Lu, M.Q.; Wang, F.W.; Liu, H.L.; Xiang, N.; Huang, T.J.; Danner, A.J.; Teng, J.H.; et al. Reflective plasmonic color filters based on lithographically patterned silver nanorod arrays. Nanoscale 2013, 5, 6243–6248. [Google Scholar] [CrossRef] [Green Version]
- Novitsky, A.; Repan, T.; Zhukovsky, S.V.; Lavrinenko, A.V. Subwavelength hyperlens resolution with perfect contrast function. Ann. Phys. 2018, 530, 1700300. [Google Scholar] [CrossRef]
- Otomori, M.; Yamada, T.; Izui, K.; Nishiwaki, S.; Andkjaer, J. Topology optimization of hyperbolic metamaterials for an optical hyperlens. Struct. Multidiscip. Optim. 2016, 55, 913–923. [Google Scholar] [CrossRef]
- Si, G.Y.; Zhao, Y.H.; Leong, E.S.P.; Lv, J.T.; Liu, Y.J. Incident-angle dependent color tuning from a single plasmonic chip. Nanotechnology 2014, 25, 455203. [Google Scholar] [CrossRef]
- Wang, W.Z.; Yadav, N.P.; Shen, Z.; Cao, Y.; Liu, J.; Liu, X.F. Two-stage magnifying hyperlens structure based on metamaterials for super-resolution imaging. Optik 2018, 174, 199–206. [Google Scholar] [CrossRef]
- Si, G.Y.; Zhao, Y.H.; Liu, H.; Teo, S.; Zhang, M.S.; Huang, T.J.; Danner, A.J.; Teng, J.H. Annular aperture array based color filter. Appl. Phys. Lett. 2011, 99, 033105. [Google Scholar] [CrossRef]
- Liu, Z.W.; Lee, H.; Xiong, Y.; Sun, C.; Zhang, X. Far-Field optical hyperlens magnifying sub-diffraction-limited objects. Science 2007, 315, 1686. [Google Scholar] [CrossRef] [Green Version]
- Yan, K.; Liu, L.; Yao, N.; Liu, K.P.; Du, W.J.; Zhang, W.; Yan, W.; Wang, C.T.; Luo, X.G. Far-field super-resolution imaging of nano-transparent objects by hyperlens with plasmonic resonant cavity. Plasmonics 2015, 11, 475–481. [Google Scholar] [CrossRef]
- Cheng, L.; Cao, P.F.; Meng, Q.Q.; Zhang, X.P. Semi-cylindrical hyperlens made of Al/MgO for 20nm lithography node. Adv. Mater. Res. 2011, 179–180, 1047–1052. [Google Scholar] [CrossRef]
- Zhang, W.B.; Chen, H.S.; Moser, H.O. Subwavelength imaging in a cylindrical hyperlens based on S-string resonators. Appl. Phys. Lett. 2011, 98, 073501. [Google Scholar]
- Liang, G.F.; Zhao, Z.Y.; Yao, N.; Wang, C.T.; Jiang, B.; Zhao, Q.; Luo, X.G. Plane demagnifying nanolithography by hybrid hyperlens–superlens structure. J. Nanophotonics 2014, 8, 083080. [Google Scholar] [CrossRef]
- Lee, H.; Liu, Z.; Xiong, Y.; Sun, C.; Zhang, X. Development of optical hyperlens for imaging below the diffraction limit. Opt. Express 2007, 15, 15886–15891. [Google Scholar] [CrossRef]
- Tao, C.-W.; Yen, T.-J.; Huang, T.-Y. Achieving sub-wavelength imaging through a flat hyperlens in a modified anodic aluminum oxide template. Sci. Rep. 2020, 10, 5296. [Google Scholar] [CrossRef] [PubMed] [Green Version]
- Deel, A.J.; Alighanbari, A. Planar cascaded triangular hyperlens structures. Appl. Opt. 2020, 59, 2050–2056. [Google Scholar] [CrossRef]
- Zhang, H.; Jiao, Z.; Mcleod, E. Tunable terahertz hyperbolic metamaterial slabs and super-resolving hyperlenses. Appl. Opt. 2020, 59, G64–G70. [Google Scholar] [CrossRef]
Figure 1.
(a) Dispersion relation of a conventional optical lens (red solid circle), an expanded optical lens (red dashed circle) and a hyperlens (blue lines). Note that and are normalized with and represents the wavelength. (b) Schematic illustration of the imaging process of sub-wavelength slits by a hyperlens. (c) Schematic illustration of our hyperlensing design.
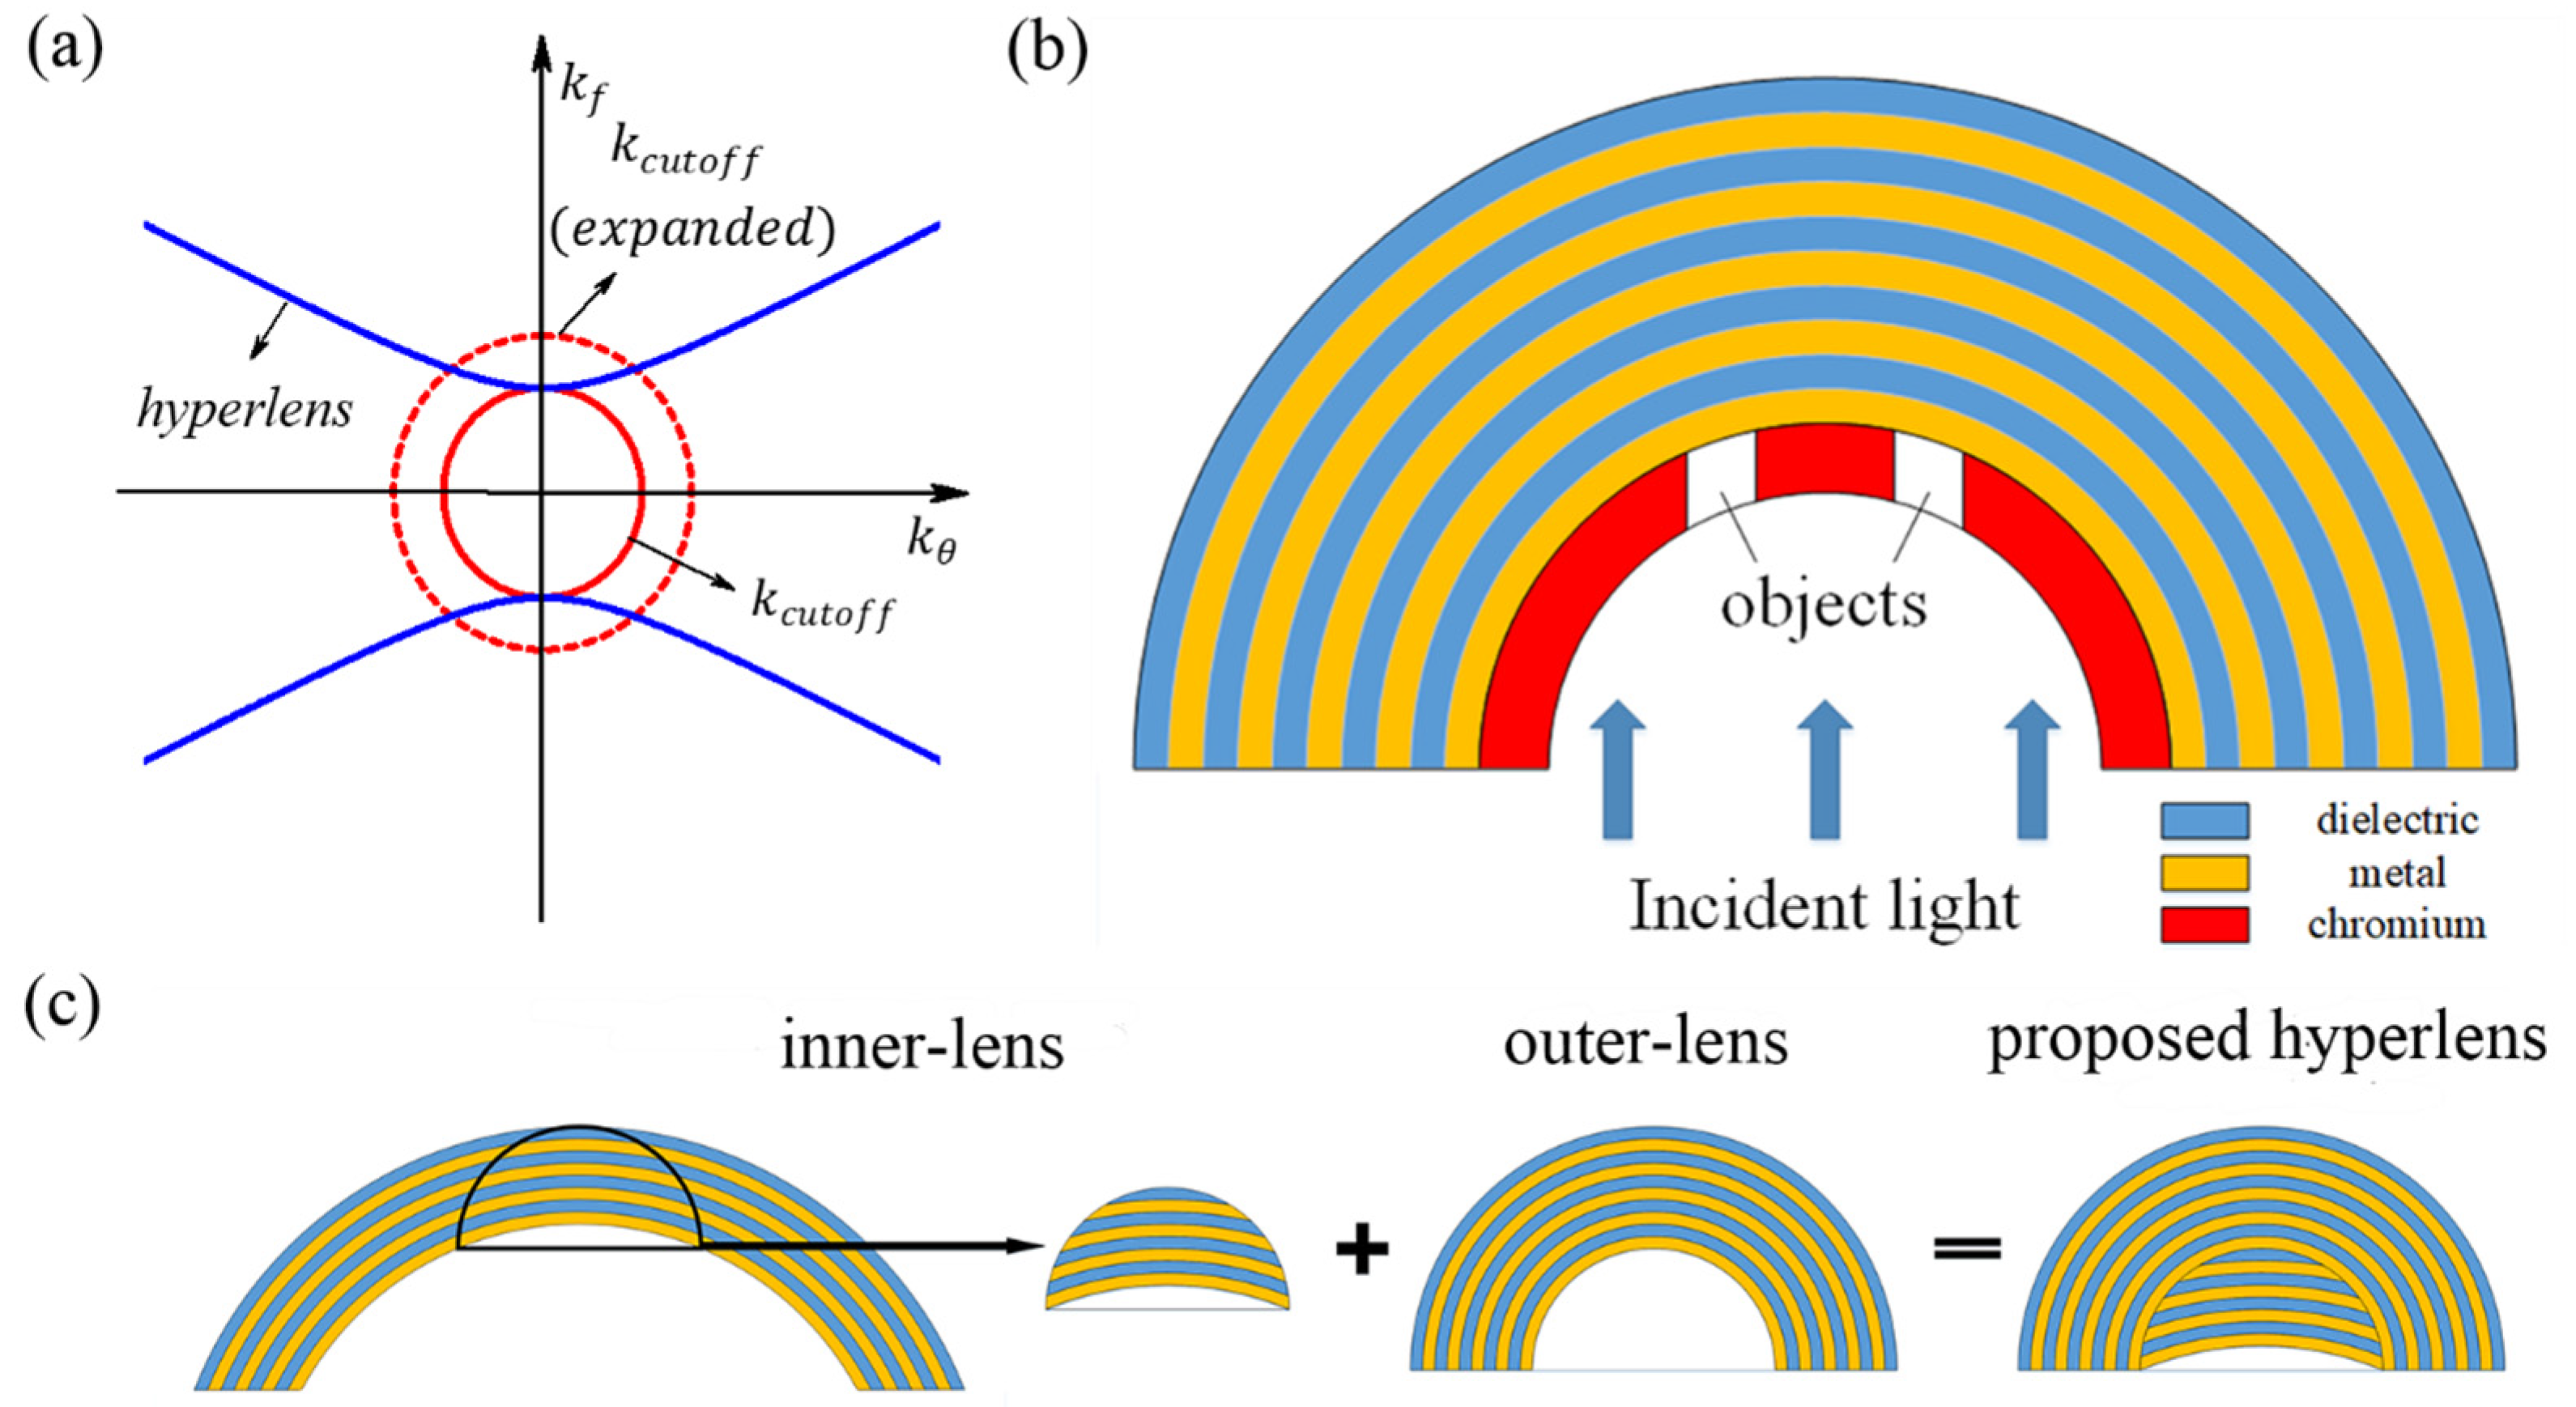
Figure 2.
(a) Chromium is filled into the radian space of the hyperlens. Two nano-slits are set as objects and the center-to-center distance is set as a variable to investigate the imaging resolution. (b) Two chromium cuboids are placed into a plasmonic resonant cavity of our hyperlens and the rest space of the cavity is filled with PMMA. The center-to-center distance between the two cuboids is also set as a variable to explore the imaging resolution.
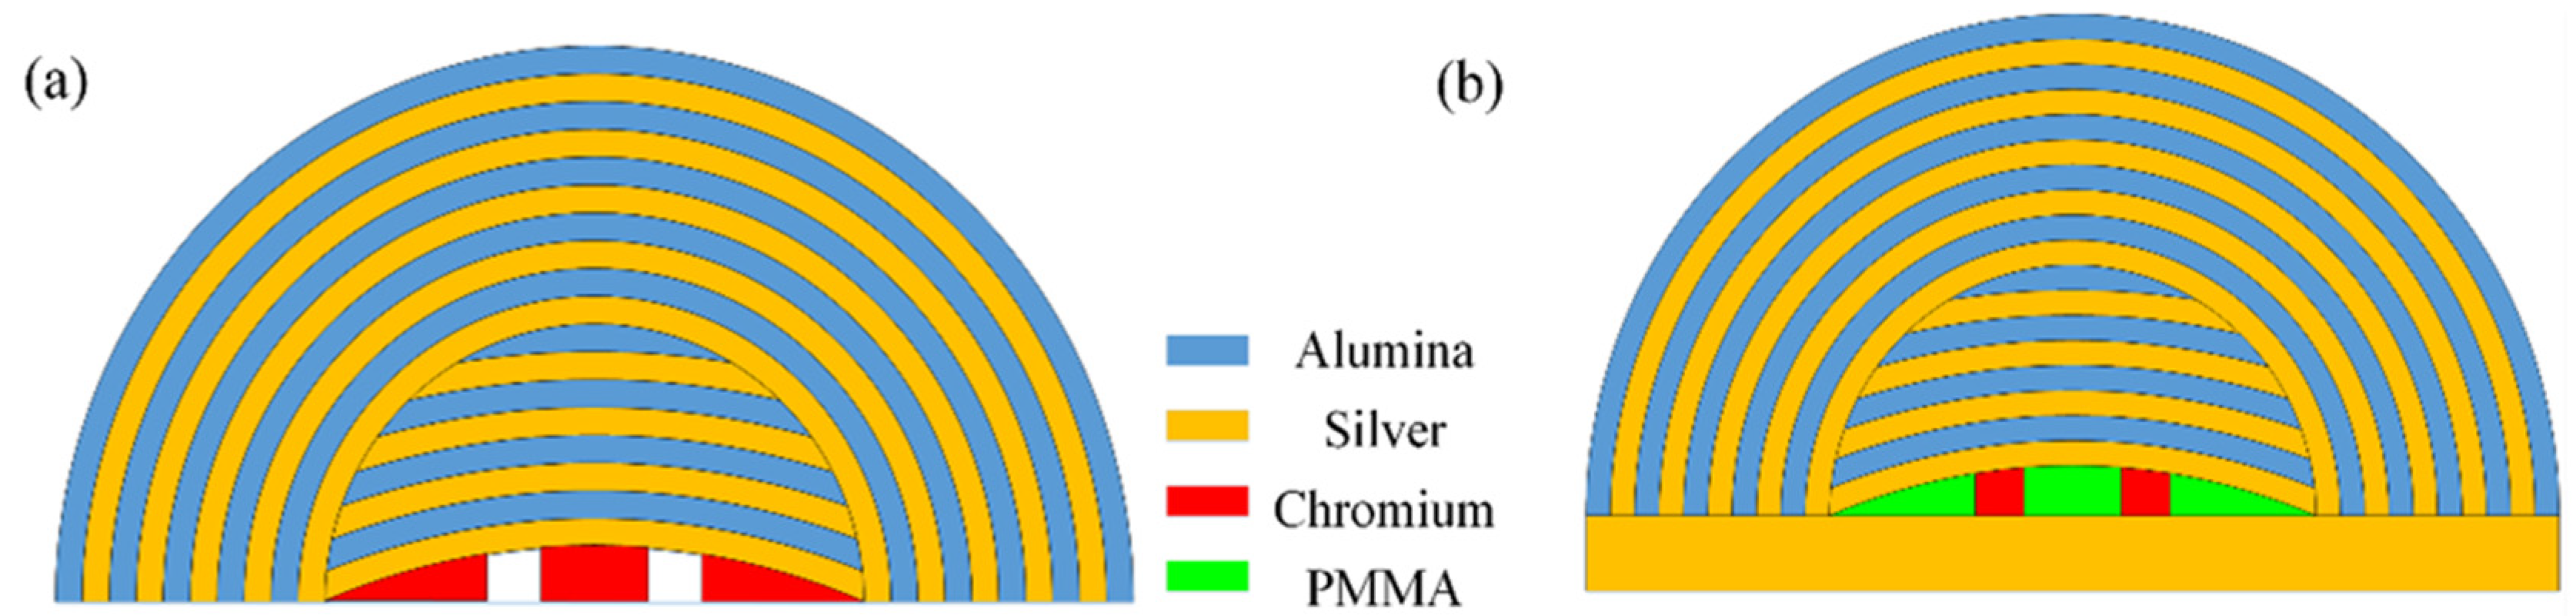
Figure 3.
(a) Calculated and as a function of wavelength. (b) Different transmittances as a function of stacked-layer thickness.
Figure 3.
(a) Calculated and as a function of wavelength. (b) Different transmittances as a function of stacked-layer thickness.
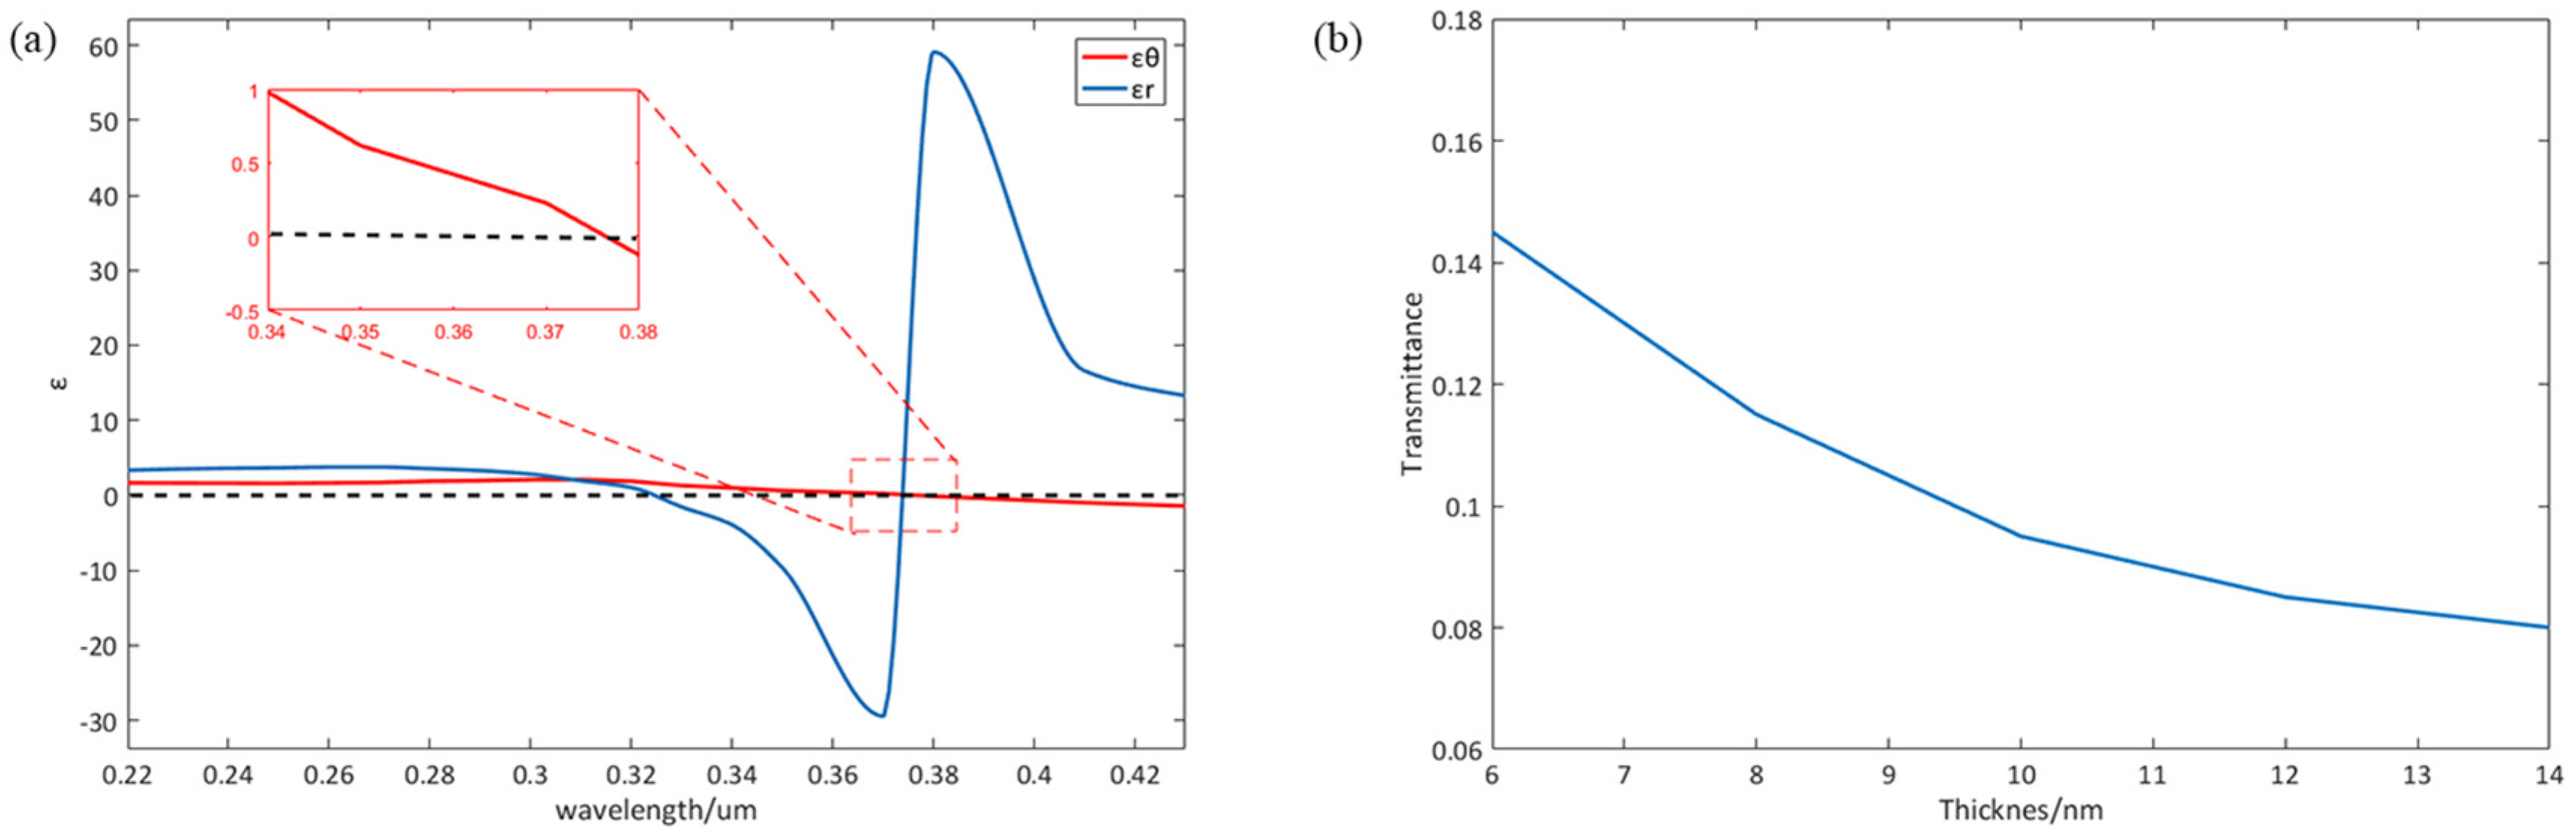
Figure 4.
(a) Schematic diagram of different detecting distances. (b) Intensity distribution detected with different distances. Red line, dark blue line and blue dashed line represent 300 nm, 100 nm, and 50 nm detecting distance, respectively.
Figure 4.
(a) Schematic diagram of different detecting distances. (b) Intensity distribution detected with different distances. Red line, dark blue line and blue dashed line represent 300 nm, 100 nm, and 50 nm detecting distance, respectively.
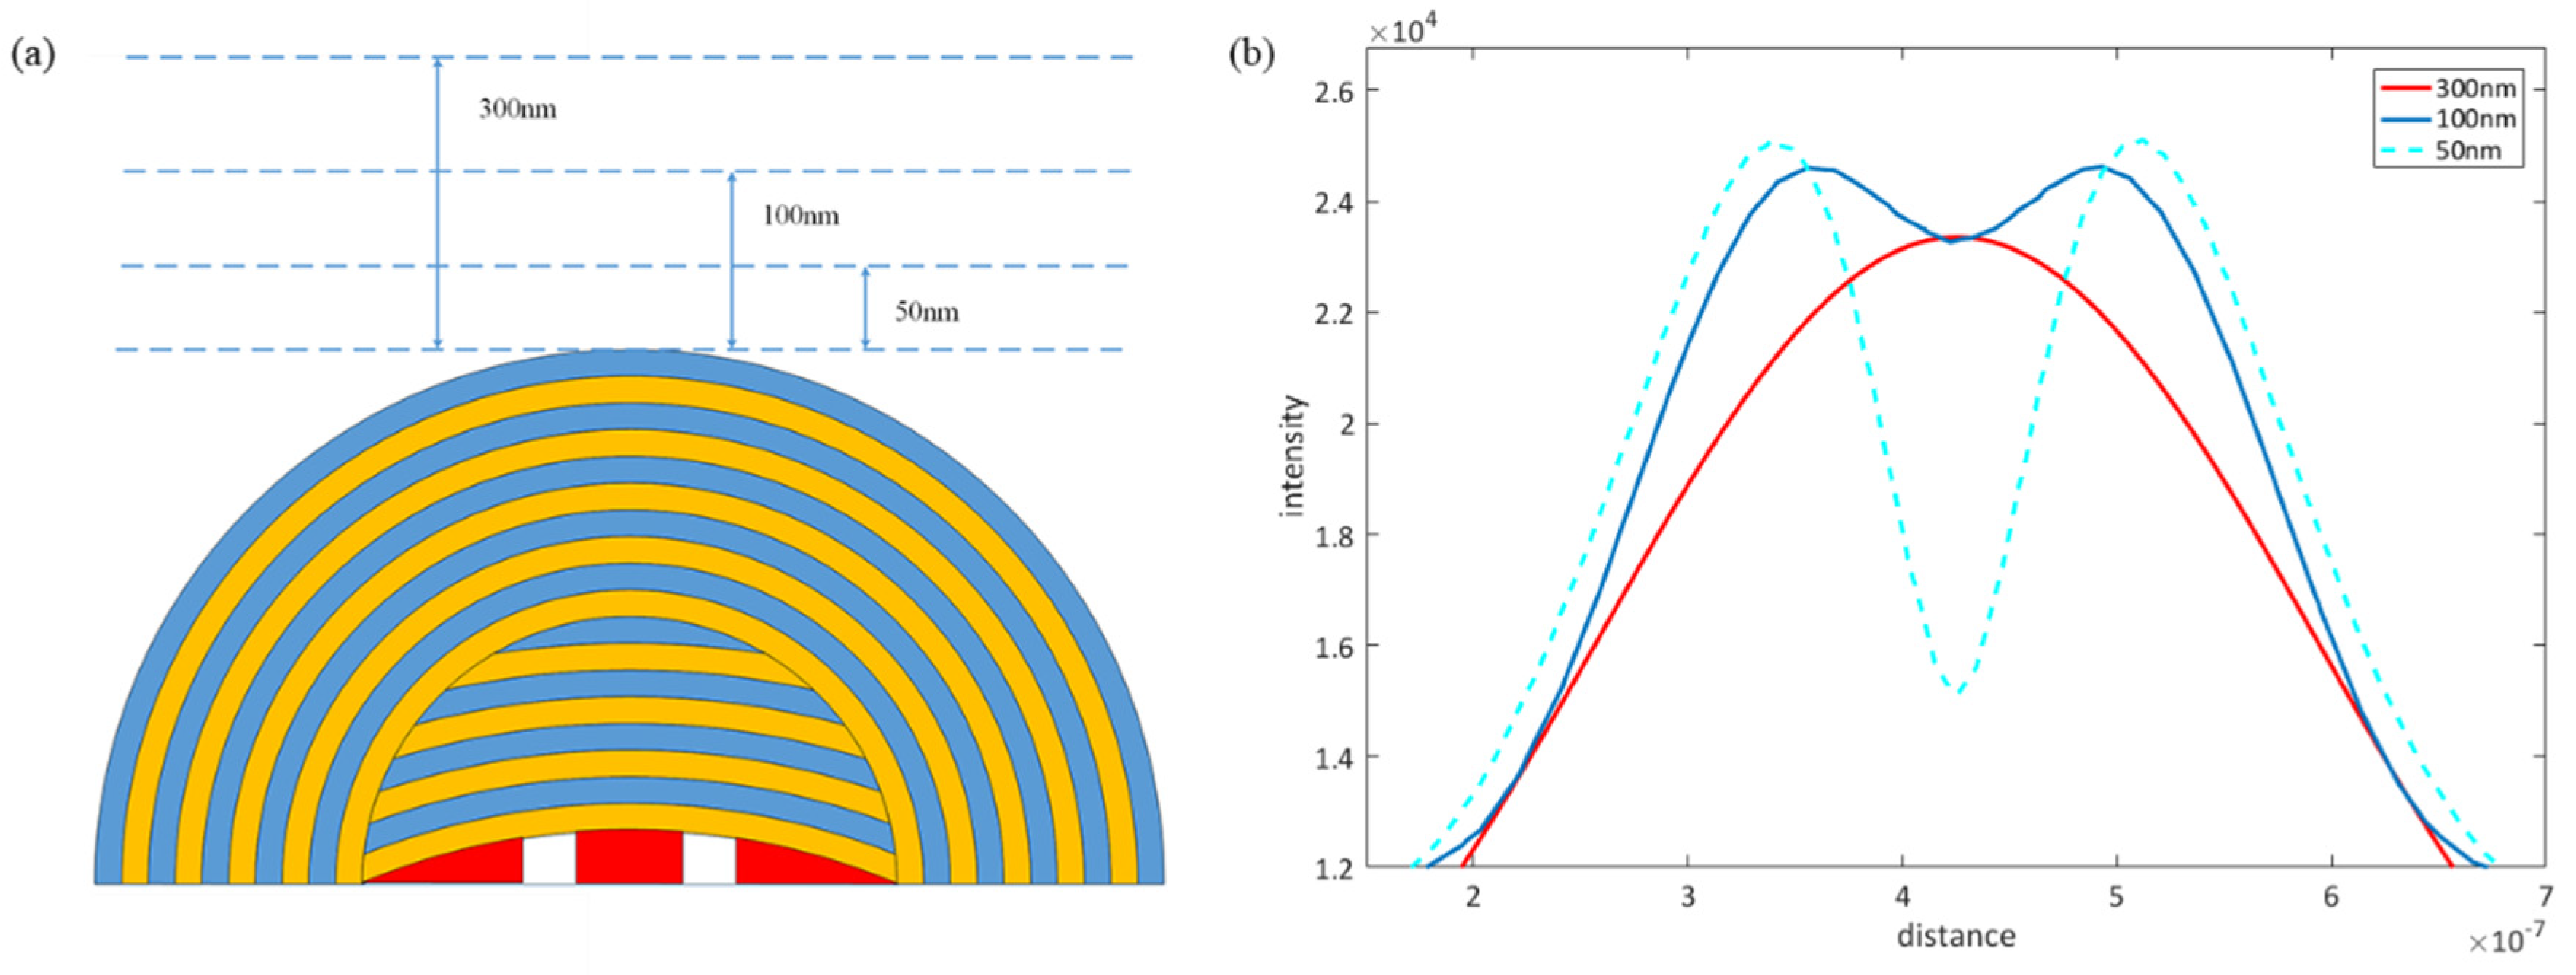
Figure 5.
(a), (b) and (c) Electric field intensity distribution with 100 nm distance above the hyperlens expressed by line graphs. The center-to-center distance between slits is 60 nm (a), 70 nm (b), and 80 nm (c), respectively. (d) Electric field intensity distribution in the hyperlens with different center-to-center distances between the objects.

Figure 6.
(a), (b), and (c) Electric field intensity distribution along line with 100 nm distance above the hyperlens (blue lines) and semicircular arc with 100 nm distance above the hyperlens (red lines) expressed by line graphs. The center-to-center distance is 50 nm (a), 60 nm (b), and 70 nm (c), respectively. (d) Electric field intensity distribution in the hyperlens with different center-to-center distances between the objects.
Publisher’s Note: MDPI stays neutral with regard to jurisdictional claims in published maps and institutional affiliations. |
© 2020 by the authors. Licensee MDPI, Basel, Switzerland. This article is an open access article distributed under the terms and conditions of the Creative Commons Attribution (CC BY) license (http://creativecommons.org/licenses/by/4.0/).
Share and Cite
MDPI and ACS Style
Yang, J.; Lv, J.; Gu, Q.; Ying, Y.; Jiang, X.; Si, G. Numerical Investigation on a Hyperlens with a Large Radius Inner-Surface for Super-Resolution Imaging. Photonics 2020, 7, 107. https://doi.org/10.3390/photonics7040107
AMA Style
Yang J, Lv J, Gu Q, Ying Y, Jiang X, Si G. Numerical Investigation on a Hyperlens with a Large Radius Inner-Surface for Super-Resolution Imaging. Photonics. 2020; 7(4):107. https://doi.org/10.3390/photonics7040107
Chicago/Turabian StyleYang, Jiming, Jiangtao Lv, Qiongchan Gu, Yu Ying, Xiaoxiao Jiang, and Guangyuan Si. 2020. "Numerical Investigation on a Hyperlens with a Large Radius Inner-Surface for Super-Resolution Imaging" Photonics 7, no. 4: 107. https://doi.org/10.3390/photonics7040107
Note that from the first issue of 2016, this journal uses article numbers instead of page numbers. See further details here.