Ultrahigh-Resolution Optical Vector Analyzers
by
 , , and
Oleg Morozov
1,* ,
,
Ilnur Nureev
1,
Airat Sakhabutdinov
1 ,
,
Artem Kuznetsov
1,
Gennady Morozov
1,
German Il’in
1,
Samvel Papazyan
1,
Alexander Ivanov
1 and
Roman Ponomarev
2 1
Department of Radiophotonics and Microwave Technologies, Kazan National Research Technical University named after A.N. Tupolev-KAI, 10, Karl Marx st., 420111 Kazan, Tatarstan, Russia
2
Department of Nanotechnology and Microsystems Engineering, Perm State University, 15 Bukireva st., 614990 Perm, Russia
*
Author to whom correspondence should be addressed.
Photonics 2020, 7(1), 14; https://doi.org/10.3390/photonics7010014
Submission received: 11 December 2019
/
Revised: 15 January 2020
/
Accepted: 18 January 2020
/
Published: 20 January 2020
Abstract
:The optical vector analyzer is a device used to measure the magnitude, phase responses, and other parameters of optical devices. There have been increasingly higher demands placed on optical vector analyzers during the development of optical technologies, which are satisfied by the creation of new devices and their operating principles. For further development in this area, it is necessary to generalize the experience gained during the development of optical vector analyzers. Thus, in this report, we provide an overview of all the basic types of approaches used for the realization of optical vector analyzers, including the advanced ones with the best performances. The principles of their working, as well as their associated advantages, disadvantages, and existing solutions to the identified problems, are examined in detail. The presented approaches could be of value and interest to those working in the field of laser dynamics and optical devices, as we propose one use of the optical vector analyzer as being the characterization of Fano resonance structures.
1. Introduction
The development of optical technologies leads to the use of increasingly narrow-band optical elements. For example, microdisk resonators and phase-shift fiber Bragg gratings (PS-FBG) may have spectral components which have bandwidths of less than 100 MHz. When using such structures, it is necessary to accurately measure their magnitude and phase responses, a role usually performed by optical vector analyzers (OVAs).
Optical vector analyzers are used to determine the magnitude and phase responses of optical components with unknown parameters. To solve this problem, the deterministic optical signal passes through the device under test (DUT). The spectral components of this signal sequentially change their position on the frequency scale, thereby performing frequency scanning. Since the parameters of the input signal are completely known (determined during calibration of the measurement system), the frequency responses of the DUT can be obtained from the output signal with changed parameters to their spectral components.
It should be noted that OVAs have greatly improved since the creation of the first model—new operating principles have been proposed and the accuracy of the measurements has significantly increased. The essence of these improvements lies in the fact that the scanning signal may be of several types: A single-frequency signal from a tunable laser source, or signals with optical single-sideband modulation (OSSB-modulation), or with double-sideband modulation (ODSB-modulation) from the electro-optic modulator. Any type of input signal goes to the photodetector, which converts it into an electrical one. This electrical signal is then used to obtain information about frequency responses of the DUT.
The first optical vector analyzers were implemented based on the modulation phase-shift [1] and the interferometry method [2]. In practice, the popular commercial version of the OVA based on the interferometry method is the LUNA OVA 5000, which is based on the principle of scanning the studied spectral response with a single-frequency radiation from a tunable laser source. This approach allows measurements with a spectral resolution about 200 MHz, which in some cases is unacceptably low.
2. OVA Based on Optical Single-sideband Modulation
To increase the spectral resolution, OVAs based on optical single-sideband (OSSB) modulation were proposed [3,4,5,6,7,8,9,10,11,12,13,14,15,16], which theoretically allows the obtaining of an ultrahigh-resolution in units of hertz. In [3], a resolution of 78 kHz was obtained in practice. Such devices have a wide frequency range of measurements, which is limited by the bandwidth of photodetectors and the maximum operating frequency of electro-optical modulators, which depends on the material of their manufacture—the maximum operating frequency for lithium niobate, for example, is 40 GHz. Despite the advantages listed above, the method has several disadvantages, including limitation of the dynamic range and measurement errors caused by the presence of higher order sidebands of the OSSB-signal, as well as the limited potential frequency range of measurements, since they are held on one side of the optical carrier.
2.1. Principle
The operation principle of these devices can be considered using a generalized block diagram, shown in Figure 1 [4].
Single-frequency radiation from a laser source is applied to the OSSB-modulator, which modulates the input signal into an OSSB-signal. The signal at the modulator output ideally has a spectrum consisting of two components: A frequency-fixed optical carrier (ω0), and a linearly scanning first-order sideband (ω0 + ωm), which moves along the frequency scale under the control of the modulation signal. Figure 2 clearly illustrates the principle of scanning the spectral characteristics of an ideal OSSB-signal. Such a signal passes through the optical device under test (DUT), in which the sideband undergoes changes in accordance with the magnitude response and phase response of the DUT, while the carrier is outside the measured spectrum. Then the changed signal is fed to the photodetector, which converts the optical signal into an electric one. An electric signal is a beating of two frequencies—a carrier and the first-order sideband—and contains information about the magnitude response and phase response of the device under test, which is isolated in an amplitude-phase detector.
The key element in the presented scheme is the OSSB-modulator, which is realized according to the classical scheme using a dual-port Mach–Zehnder modulator (DPMZM) and a 90-degree hybrid coupler, which allows one to obtain a signal with an OSSB-modulation from a signal with an optical double-sideband (ODSB) modulation by removing one of the first-order sidebands [6]. Another implementation option is to use an optical filter that passes only the carrier and sidebands on one side of it [3].
However, in practice, the spectrum of the OSSB-signal is not ideal, as it contains high-order sidebands that introduce errors into the measurement results, which increase with the value of modulation index. Therefore, it limits the dynamic range of the OVA too [7].
Thus, for accurate measurements, one should strive to suppress all sidebands in the spectrum of the scanning signal, with the exception of one of the first-order sidebands. In addition, the artificially-limited scanning range should be attributed to the main disadvantages of OSSB-based OVAs, as because the measurements are only carried out in one direction from the carrier, it is impossible to investigate the notch structures and the limited dynamic range of measurements due to the presence of an incompletely suppressed first-order sideband. However, these problems did not go unnoticed by previous researchers, who proposed a number of solutions that partially or completely eliminate the specific shortcomings of OSSB-based OVAs.
2.2. Reducing Measurement Error
To eliminate measurement errors caused by beats between high-order sidebands in [8], it was proposed that a 120-degree hybrid coupler should be used in the classical OSSB-scheme to suppress the positive second-order sideband, which makes the largest contribution to the measurement error. In the OVA based on an optical filter, it was proposed that a phase modulator with a low modulation index [3] was used, so that the signal spectrum would contain only first-order sidebands. In [9], it was proposed that a dual-port Mach–Zehnder modulator (DPMZM) should be used, as in the upper arm of which the even sidebands of higher-order are suppressed, and the lower arm operates at the maximum transmission point and forms only the carrier at the output. However, in [8] and [9] not all high-order sidebands are suppressed, and in [3] a low modulation index limits the dynamic range of measurements.
Measurement errors caused by the presence of higher-order sidebands were completely eliminated in [10,11,12,13]. In [10], it was proposed to take the measurements twice. At the first step, a normal OSSB-signal containing both the useful component and the error component, was passed through the DUT, and then received at the photodetector. In the second step, an OSSB-signal without carrier, which is suppressed by a tunable optical filter, was passed through the DUT. At the same time, a signal containing only the error component was received at the photodetector. Next, in the data processing unit, the difference of these signals was found and a pure useful component was obtained.
This approach was improved in [11], where the principle of balanced photodetection was applied (Figure 3). The signal from the output of the device under test was divided into two parts—one that traveled directly to the photodetector, and the other that was passed through an optical bandstop filter, which suppressed the carrier. Both signals were fed to a balanced photodetector, the output signal of which was equal to the difference of the input signals, and is a useful signal in its pure form. Using a balanced photodetector allows one to take the measurements once.
In order to speed up the measurement process, the use of both balanced photodetection and a linearly frequency-modulated (LFM) waveform was proposed [12]. The LFM signal is achieved by modulating an electrical LFM signal on an optical carrier via carrier-suppressed OSSB-modulation. The dechirp processing of a LFM signal is carried out by a balanced photodetector, which receives the LFM signal passing through the DUT as the first input, and the LFM signal from the reference path as the second input. This approach results in the ultrafast operation of this device.
Another approach was implemented in [13] and [14], where the method of fixed low-frequency detection in a phase–magnitude detector (PMD) was proposed. The signals of the measuring (with DUT) and reference (without DUT) channels interact on the photodetector (PD). The modulation frequencies of these signals differ by some small fixed value. The PMD processes signals only at this fixed frequency, whereas for higher sidebands this value is a multiple of their order. Thus, the PMD output signal does not contain measurement errors. In addition, this approach results in the high speed of measurements, since the phase–magnitude detector operates at a fixed low frequency.
2.3. Improving Dynamic Range
To increase the dynamic range in [15], it was proposed that the optical paths of the carrier and scanning sideband were separated. The carrier passes through the reference path without passing through the device under test, and the sideband passes through the DUT. In [16] it was proposed to improve the scheme based on balanced photodetection by replacing the optical filter with a Hilbert transformer, which changes the phase of the scanning sideband by 180 degrees. Therefore, the corresponding components of the beats in the upper and lower arms were added as a result of subtraction of the two signals in the balanced photodetector, while the others were subtracted, (resulting in they compensating each other), and the influence of the unwanted sideband on the measurement results was eliminated.
2.4. Broadening the Measurement Range
The measurement frequency range of the OSSB-modulation-based OVA is limited by the passband of the photodetectors (up to 70 GHz) and the maximum operation frequency of electro-optical modulators, which depends on the fabrication material: For gallium arsenide (GaAs) this frequency is 35 GHz, while for lithium niobate (LiNbO3) the frequency is 40 GHz, and for indium phosphide (InP) it is 60 GHz. The measurement range can be increased by changing the wavelength of the tunable laser, however, in this case, the resolution of the measurements will be severely affected due to the low accuracy of the tuning of the wavelength and the low radiation stability.
To increase the frequency range of measurements at a consistently high resolution, the use of an optical frequency comb (OFC) generator was proposed in [17] (Figure 4).
In this OVA, the measurement range is divided into separated segments by the number of carriers formed by the frequency comb generator. The optical bandpass filter in turn selects each of the optical carriers in order to carry out measurements in the corresponding segment of the frequency range. After measurements in one segment have been performed, the band-pass filter selects a new carrier to study the next segment, etc. An important condition for the accuracy of measurements is the accuracy of the equality of carrier amplitudes.
3. OVA based on Optical Double-sideband Modulation
To simultaneously solve the problems described above, OVAs based on optical dual-sideband (ODSB) modulation were created [18,19,20,21,22,23,24,25,26,27,28,29,30,31,32,33,34,35]. They have the following advantages: A doubled measurement frequency range up to 80 GHz with an element base based on lithium niobate (LiNbO3), and an ultrahigh resolution of about 667 kHz, which depends on the quantity of control points of measurements of the electrical vector network analyzer, and which can be increased. In addition, in some cases there are no measurement errors caused by beats of high-order sidebands, which removes restrictions on the magnitude of the modulation index and, therefore, on the dynamic range.
3.1. Principle
ODSB-based OVAs come in two forms—with symmetric ODSB, and with asymmetric ODSB. Figure 5 shows the spectra of the corresponding scanning signals. In ODSB-based OVAs, the carrier is located in the center of the spectrum under study and scanning is carried out on both sides of it by first-order sidebands. For OVAs with symmetric ODSB, it is easy to obtain a scanning signal, but it is necessary to carry out two measurements at each modulation frequency. It is difficult to obtain a scanning signal for OVAs with asymmetric ODSB, but then the measurements are performed once and there are no guaranteed measurement errors caused by the presence of higher order sidebands. Thus, both approaches, which each have their own advantages and disadvantages, were equally developed, and this continues to this day.
3.2. OVA Based on Symmetric ODSB
The measurements in OVA with symmetric ODSB can be realized by twice changing a parameter (amplitude or phase) of one of the spectral components—the carrier or a sideband. In some OVAs the variable parameter is the amplitude, while in others it is the phase. Measurements are carried out in two stages, with different modulation schemes and different values of the variable parameter, respectively. The frequency characteristics of the device under test are obtained through post-processing of measurement results.
In [18], a programmable optical filter at each scanning frequency introduces two different attenuations into the amplitude of one of the sidebands. Based on the measurement results, a matrix equation is compiled from which the transfer function of the device under test can be determined. This approach allows one to get rid of the measurement error caused by the unwanted first-order sideband, which is typical for OSSB-based OVA. However, practical implementation of OVAs with a programmable optical filter is difficult.
A simple practical implementation of the device was proposed in [19], where phase imbalance was introduced (Figure 6).
To obtain a scanning signal, the use of a dual-parallel MZM (DPMZM) was proposed, the upper arm of which was biased at the null transmission point (by V1), and the lower arm of which was biased at the maximum transmission point (by V2). So, in the signal of the upper arm all even-order sidebands were suppressed, including the carrier, while the lower arm passed the input signal through unchanged. The output of the modulator produced a symmetric ODSB-signal. By changing the bias voltage of the lower modulator twice, two fixed values of the phase of the carrier were set, which were used in the post-processing of the data to determine the transfer function of the DUT.
The simplest scheme implemented at one MZM was proposed in [20]. The modulator generated a symmetric ODSB-signal. By changing the bias voltage of the modulator, the phase relationship between the carrier and the scanning sidebands was changed. So, by setting two phase relations at each scanning frequency, the desired transfer function of the DUT could be obtained.
For such schemes, measurement errors caused by the presence of high-order sidebands were not considered. This occurred in [21], where a new dual-drive MZM (DDMZM)-based OVA was proposed, in which the upper arm was biased at the quadrature transmission point and the lower one at the maximum transmission point, without a modulation signal. So, at the output of the upper arm there was a symmetric ODSB-signal, and the carrier was in the lower arm. To eliminate errors, three stages of measurements were carried out, changing the transmission point of the upper arm of the DDMZM, which was set at two different quadrature points and once at the null point. Post-processing of the data allowed one to receive the exact frequency responses of the DUT.
Another approach was proposed in [22], where two different schemes, of intensity modulation and phase modulation, were used for two-stage measurements (Figure 7).
The first-order sidebands of the ODSB-signals in this case had opposite phases, which changed by 180 degrees when changing the modulation scheme. So, when corresponding signals at the output of the photodetector were added, we received information carried by the positive first-order sideband, and with the difference of the signals, the information of the negative first-order sideband.
In [23], a similar approach was proposed using a polarization modulator. The signal at the modulator output is a combination of a signal with intensity modulation and a signal with phase modulation. By changing the angle of rotation of the plane of polarization using a polarizer, which is located at the output of the modulator, it received signals with different modulation coefficients. By post-processing the measurements, the frequency responses of the DUT were obtained.
3.3. OVA Based on Asymmetric ODSB
The main objective of this method was to find effective ways of forming a spectrum with a frequency-shifted carrier. A characteristic feature of the method is its ability to carry out one-step measurements, and the beats of the negative first and positive first sidebands with the carrier form different radio-frequency components of the photocurrent on the photodetector, which were analyzed simultaneously. Due to this, two main advantages of the method are provided: A high measurement speed, and a guaranteed absence of measurement errors caused by beats between high-order sidebands, since the beat frequencies of the scanning sidebands and the frequency-shifted carrier are not multiples of the modulation frequency.
The carrier shift problem was solved in [24] by separating the carrier and scanning sidebands along parallel channels (Figure 8).
In the upper arm, the signal was converted to a two-frequency signal by means of MZM biasing at the null transmission point, and was then passed through the DUT. In the lower arm, an acousto-optical modulator shifts the frequency of the input signal. In front of the photodetector, the signals add up, forming a signal with a shifted carrier. The disadvantage of this approach is that the sidebands and the carrier are separated physically, which causes significant phase noise, due to which it is impossible to obtain the phase response of the device under test. However, the application of this method together with the method described in [17] made it possible to create an OVA with attometer resolution and a bandwidth of the order of THz [25]. Therefore, high resolution is possible due to the use of an advanced element base such as a laser with a linewidth of 300 Hz.
The approach described in [24] was improved in [26], the main advantage of which is a self-calibration of measurement results. The difference between this scheme and the previous one is that in the measuring channel the signal after the modulator was divided into two parts. The first one was passed through the DUT, while the second one was shifted in frequency and reflected the transmission response of the modulator, i.e., measuring system. So, on a photodetector, two pairs of frequencies were analyzed. One was a calibration frequencies (beats of the shifted carrier of the lower channel, and the signal with the transmission response of the modulator), and the other had the desired characteristics (beats of the shifted carrier of the lower channel and the signal passed through the DUT).
Another application of this principle was the device described in [27]. Here, one ODSB-signal passes through the DUT, while the other signal is shifted in frequency and modulated so that the scanning sidebands of the two signals were separated from each other by the fixed frequencies, which were their own for each frequency pair (left and right). Signal processing from the photodetector was carried out at these fixed low frequencies, which allowed for increasing of the speed of processing of measurement results, and, consequently, the speed of the measurement system itself.
A fundamentally new approach based on this method was proposed in [28]. The schematic diagram of this device is similar to the schematic diagram in [24], however, a different measurement principle was implemented. It was proposed here to analyze not only the beats of the shifted carrier and the first-order sidebands, but also the beats between the carrier and second-order sidebands. In addition, it was proposed that the phase response curve was determined mathematically, using the Wiener–Lee transform. This made it possible to obtain a measurement frequency range of 80 GHz using a modulator with a maximum operating frequency of 20 GHz. This is the first of the above schemes, which allows one to determine the phase response by forming a shifted carrier. Of course, this affects the measurement speed.
To obtain the phase response without mathematical transformations, a dual-drive dual-parallel MZM (DD-DPMZM) is used to obtain a signal with a shifted carrier. In [29], the obtaining of an ODSB-signal with a shifted carrier was proposed by adding the ODSB and OSSB-signals together with a suppressed carrier, which are formed in the upper and lower arms of the DD-DPMZM, which has biased sub-modulators at the null transmission point. The disadvantage of this method is that there are measurement errors caused by the incompletely suppressed first-order sideband in the OSSB-signal (Figure 9).
A similar approach was implemented in [30]; at the output of the DD-DPMZM, a four-frequency signal was obtained, which interacted with the absorption and gain contours caused by the stimulated Brillouin scattering (SBS) effect. One of the sidebands was suppressed, while the other was amplified and became a shifted carrier. However, the high sensitivity of the SBS effect to external conditions is a drawback that complicates any practical implementation (Figure 10).
3.4. OVA Based on Suppressed Carrier ODSB
Another approach based on a suppressed carrier ODSB involves two-frequency scanning of symmetric structures and the analysis of measurement results at a double modulation frequency [31,32]. In these articles, the laser radiation stabilization method based on the Pound–Drever–Hall technique (PDH technique) was additionally applied. Maximum resolution could be received, because PDH stabilization provided long-term measurement accuracy. That is, it was possible to measure within 90 minutes without sacrificing measurement accuracy.
4. OVA Based on Phase-shift Fiber Bragg Grating
After analyzing the development of OVA using the example of the devices described above, we found that the main direction of development of the asymmetric ODSB-based OVA was to simplify the practical implementation of such devices and to obtain the ability to measure the frequency response and phase response simultaneously without further processing of the measurements. As a device with these advantages, we proposed an optical vector analyzer based on asymmetric double-sideband modulation and a phase-shift fiber Bragg grating [33,34]. A key element of the OVA is a phase-shift fiber Bragg grating (PS-FBG), which is used to form an asymmetric ODSB-signal. The proposed analyzer is shown in Figure 11.
Single-frequency radiation from a tunable laser source (TLS) is fed to the input of a dual-drive dual-parallel Mach–Zehnder modulator (DD-DPMZM), where it is divided into two equal parts, which are in turn fed to the corresponding sub-modulators MZM1 and MZM2. In the upper sub-modulator, ODSB-modulation with carrier suppression occurs through electrical radio frequency signal of the RF2. In the lower sub-modulator, the same modulation occurs, except it is generated through a fixed radio frequency signal of the RF1. The spectra at the output of the sub-modulators correspond to the spectra at points A and B. At the output of the modulator, the signals of the lower and upper arms are added (point C). The resulting signal consists of two pairs of sidebands: Fixed in frequency, and linearly scanning. The radiation through the circulator then enters the PS-FBG. The PS-FBG is manufactured with the bandwidth of its reflection spectrum equal to 80 GHz, which corresponds to the maximum possible measurement range. The central frequency of its transparency notch coincides with the frequency of frequency-fixed sidebands. Thus, three spectral components—two scanning sidebands and one frequency-fixed sideband—are reflected from the grating, and the other frequency-fixed sideband passes to the exit and is absorbed in a special compound. Thus, radiation reflected from the grating is formed at the second output of the circulator, the spectrum of which corresponds to an asymmetric ODSB-signal (point E). The received radiation is divided into two paths—the measurement path with DUT and the reference path without DUT—which are “loaded” onto the photodetectors PD1 and PD2. Passing through the DUT, the scanning signal changes in accordance with the magnitude and phase responses of the DUT. After detection in the photodetector PD1, an electrical signal is obtained at the output, which contains the beat frequencies of the shifted carrier and the corresponding sidebands (point F). This signal carries information about the magnitude and phase response of the DUT. The same thing happens in the reference path on the photodetector PD2. The spectral components of interest are isolated using a bandpass filter (BPF), and used together with the signal from the photodetector PD1 in the phase–magnitude detector (PMD) to construct the magnitude and phase responses of the device under test (Figure 12).
Thus, when scanning with the frequency of the RF2, information regarding the magnitude and phase responses from both scanning frequencies (on both sides of the carrier) is obtained at the same time. In this device, the beatings between the high-order sidebands do not affect the accuracy of measurements, because information is extracted from frequencies not equal to the modulation frequency. It should be noted that the dynamic range of the magnitude response measured by the proposed OVA is higher than the same measured by the optical spectrum analyzer.
The used PS-FBG was recorded at the recording FBG station fabricated in the Novosibirsk State University and working in KNRTU-KAI. The optical responses of the PS-FBG were measured with an optical spectrum analyzer Yokogawa AQ6370AC and its transparency notch was measured with the electrical vector analyzer (EVA), the R&S®FSH8, shown in Figure 13a,b, respectively.
5. OVA for Characterization of Fano Resonance
To date, not a single OVA based on symmetric ODSB, which allows one to run single-step measurements, has been proposed. We therefore proposed the optical vector analyzer for the characterization of Fano resonance structures based on unbalanced double-sideband modulation [35], which, unlike existing analogs, allows one to study asymmetric and ultra-narrow-band structures, such as Fano resonance, and to carry out one-step measurements (Figure 14).
Tunable laser source (TLS) radiation is fed to a modulator (ODSB-SC) operating at the null transmission point, the output signal of which (point A) corresponds to ODSB-modulation with a suppressed carrier. Optical band-pass filter (OBPF) passes one of the sidebands of the input signal, thus realizing a single-frequency signal output controlled by the RF1 generator in the mode of units of hertz (point B). Such a signal is fed to the OSSB-modulator (OSSB), implemented according to the classical scheme with a 90-degree hybrid coupler (90° HC). The output OSSB-signal retains an incompletely suppressed sideband (point C) and is a signal that is unbalanced in amplitude. The modulation frequency of such a signal is constant throughout the entire measurement process and is selected so that the closeness of the sidebands to the carrier means that the transmission coefficient of the DUT could be considered the same for all three spectral components with a sufficient degree of accuracy. By changing the frequency of the RF1 generator, the carrier frequency of the ODSB-signal is changed, thereby linearly transferring the spectrum of the ODSB-signal on a frequency scale. Hence, it is capable to conduct a scan of the investigated resonant structure. The signal changed in accordance with the magnitude and phase responses of the structure is fed to a photodetector (PD), which converts the optical signal into an electrical one. The spectrum of such a signal consists of a constant component (D0), a component at the modulation frequency (DΩ) and a component at a double modulation frequency (D2Ω). These components are distinguished by the corresponding frequency filters (electrical low-pass filter (ELPF) and electrical band-pass filter (EBPF)) and are used to mathematically process the measurement results and obtain the magnitude and phase responses of the DUT.
The proposed method made it possible to create a criterion for the scanning signal to fall within the limits of the studied circuit, which became the basis of the measurement technique of this device. The criterion allows one to first determine—with high accuracy—the frequency range in which the spectrum under study is located, and then scan the found resonance structure with ultrahigh resolution and obtain its frequency responses. This principle is clearly illustrated in Figure 15 and Figure 16.
In Figure 15, an even plot corresponds to the fulfillment of the criterion, i.e., the desired spectral characteristic is located in this frequency interval. This section is already being investigated with ultra-high resolution, which allows one to obtain the magnitude and phase responses of the resonance structure (Figure 16).
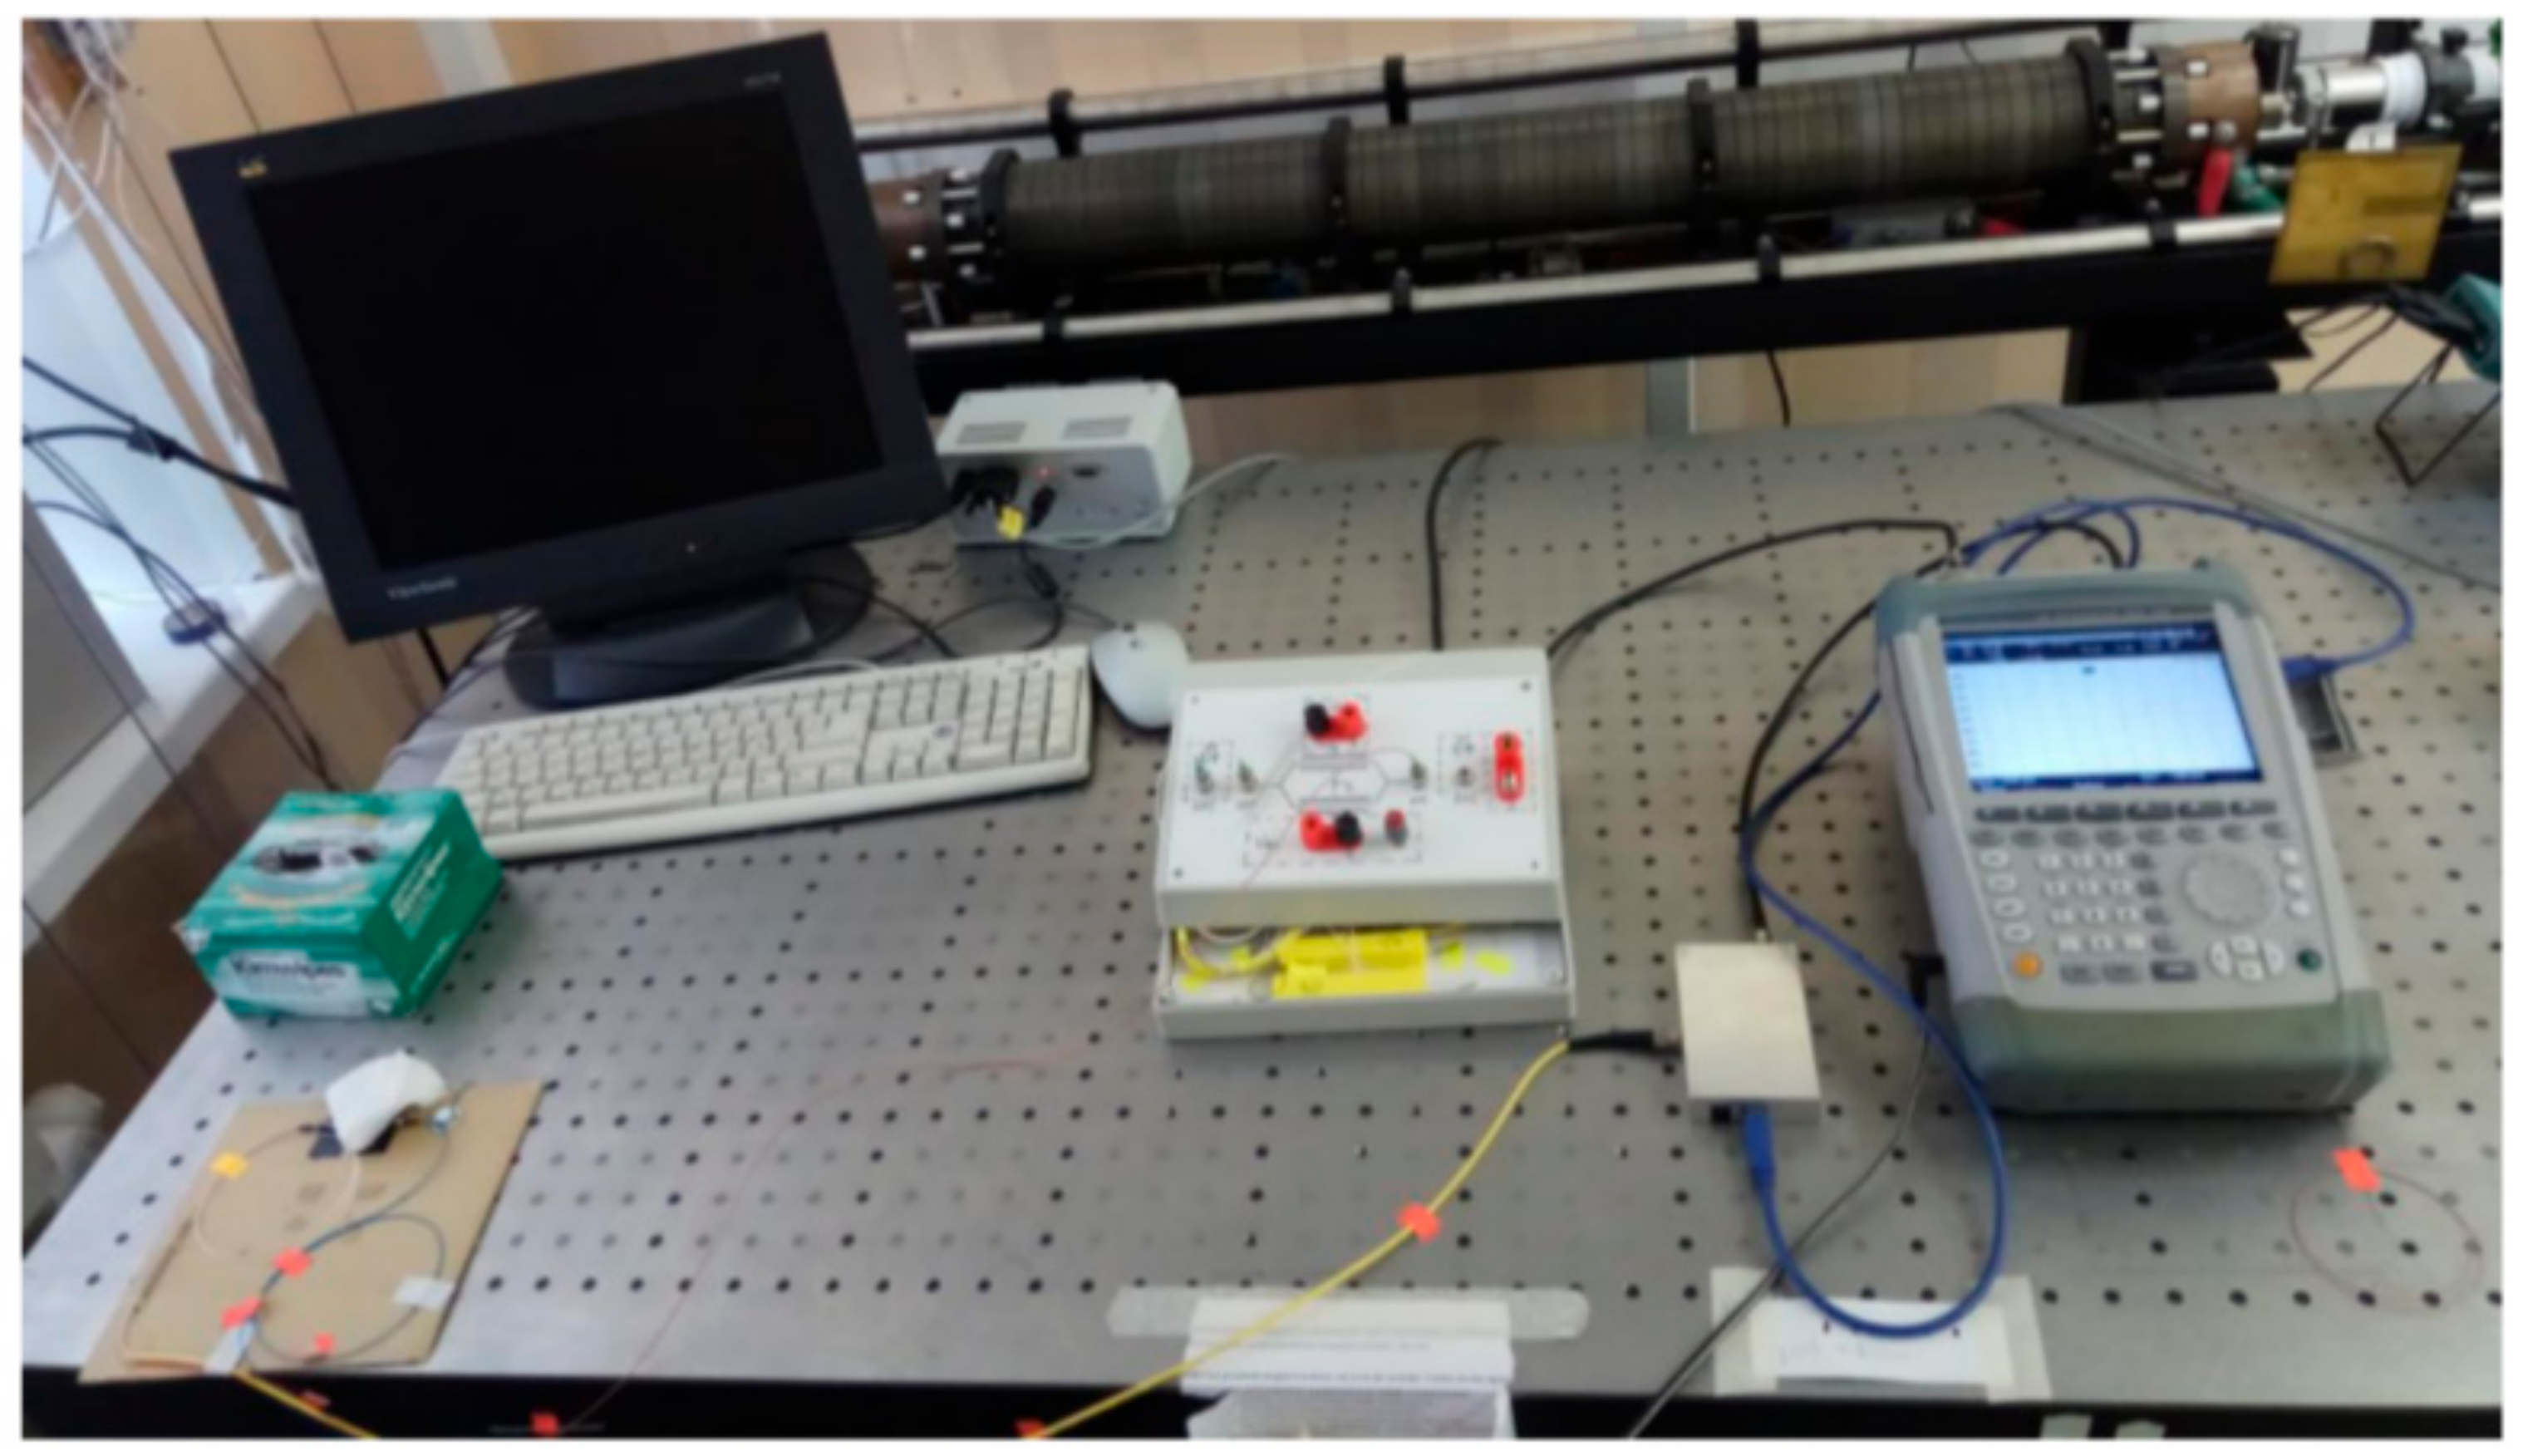
To verify the developed theoretical principles, a universal model of both schemes was assembled, as shown in Figure 17.
The model in Figure 17 consists of a fiber laser DFB-1550-14BF with a wavelength of 1546.55 nm, controlled by the driver Pilot 4AC; Mach–Zehnder electro-optic modulators with a half-wave voltage of 3.2 V and a bandwidth of 13 GHz manufactured by PNPPK; Finisar WaveShaper 4000S programmable optical bandpass filter with an independently tunable center wavelength, bandwidth and gain; electrical vector analyzer R&S® FSH8; photodetector PR-20-D with a bandwidth of 20 GHz; Personal Computer.
6. Conclusions
In summary, a review of the main types of OVAs was presented. It was found that OSSB-based OVAs have a number of disadvantages, such as measurement errors caused by the presence of high-order sidebands, a limited frequency range of measurements, and a limited dynamic range of measurements. A number of methods have been proposed to solve these problems. However, these methods complicate the construction of OVA, and none eliminate all of the above disadvantages at the same time.
To eliminate all of the disadvantages inherent in OVAs based on OSSB-modulation, OVAs based on symmetric ODSB-modulation and OVAs based on asymmetric ODSB-modulation were created. The main direction of the development of OVAs based on symmetric ODSB is the maximum simplification of the practical implementation of such devices and the elimination of measurement errors associated with the structure of the spectrum of the ODSB-modulated signal. However, not one single device has been proposed that allows one to run one-step measurements and to measure the asymmetric ultra-narrow-band spectral structures. We have proposed an OVA for the characterization of Fano resonance structures based on unbalanced ODSB-modulation with these advantages.
The main direction of future development of OVAs based on asymmetric ODSB-modulation is to simplify the practical implementation of such devices and to be able to measure the magnitude and phase responses simultaneously without further post-processing of the data. As a device with these advantages, we have proposed an OVA based on asymmetric ODSB-modulation and phase-shift fiber Bragg grating, which has the listed advantages, and unlike analogs, it combines the simplicity of practical implementation, high performance, and cost-effectiveness.
Thus, the capabilities of the proposed OVAs meet the main development trends in this area, but also require further improvement and simplification.
Author Contributions
O.M. and S.P. drafted the manuscript. A.S., A.K., A.I., and I.N. performed the experiments. O.M. supervised the work. G.M., G.I., and R.P. commented, edited, and reviewed the manuscript. All authors have read and agreed to the published version of the manuscript.
Funding
This research was funded by Ministry of Science and Higher Education of Russian Federation, state task 8.6872.2017/8.9, program “Asymmetry”.
Conflicts of Interest
The authors declare no conflict of interest.
References
- Niemi, T.; Uusimaa, M.; Ludvigsen, H. Limitations of phase-shift method in measuring dense group delay ripple of fiber Bragg gratings. IEEE Photon. Technol. Lett. 2001, 13, 1334–1336. [Google Scholar] [CrossRef]
- VanWiggeren, G.; Motamedi, A.; Barley, D. Single-scan interferometric component analyzer. IEEE Photon. Technol. Lett. 2003, 15, 263–265. [Google Scholar] [CrossRef]
- Tang, Z.; Pan, S.; Yao, J. A high resolution optical vector network analyzer based on a wideband and wavelength-tunable optical single-sideband modulator. Opt. Express 2012, 20, 6555–6560. [Google Scholar] [CrossRef]
- Xue, M.; Pan, S.L. Influence of Unwanted First-Order Sideband on Optical Vector Analysis Based on Optical Single-Sideband Modulation. J. Lightw. Technol. 2017, 35, 2580–2586. [Google Scholar] [CrossRef]
- Herna´ndez, R.; Loayssa, A.; Benito, D. Optical vector network analysis based on single-sideband modulation. Opt. Eng. 2004, 43, 2418. [Google Scholar] [CrossRef]
- Román, J.E.; Frankel, M.Y.; Esman, R.D. Spectral characterization of fiber gratings with high resolution. Opt. Lett. 1998, 23, 939–941. [Google Scholar] [CrossRef]
- Xue, M.; Zhao, Y.; Gu, X.; Pan, S. Performance analysis of optical vector analyzer based on optical single-sideband modulation. J. Opt. Soc. Am. B 2013, 30, 928. [Google Scholar] [CrossRef]
- Xue, M.; Pan, S.L.; Gu, X.W.; Zhao, Y.J. Optical single-sideband modulation based on a dual-drive MZM and a 120-degree hybrid coupler. J. Lightw. Technol. 2014, 32, 3317–3323. [Google Scholar] [CrossRef]
- Li, W.; Sun, W.H.; Wang, W.T.; Wang, L.X.; Liu, J.G.; Zhu, N.H. Reduction of Measurement Error of Optical Vector Network Analyzer Based on DPMZM. IEEE Photon. Technol. Lett. 2014, 26, 866–869. [Google Scholar] [CrossRef]
- Xue, M.; Pan, S.; Zhao, Y. Accuracy improvement of optical vector network analyzer based on single-sideband modulation. Opt. Lett. 2014, 39, 3595–3598. [Google Scholar] [CrossRef] [Green Version]
- Xue, M.; Pan, S.; Zhao, Y. Accurate optical vector network analyzer based on optical single-sideband modulation and balanced photodetection. Opt. Lett. 2015, 40, 569–572. [Google Scholar] [CrossRef] [PubMed]
- Li, S.; Xue, M.; Qing, T.; Yu, C.; Wu, L.; Pan, S. Ultrafast and ultrahigh-resolution optical vector analysis using linearly frequency-modulated waveform and dechirp processing. Opt. Lett. 2019, 44, 3322–3325. [Google Scholar] [CrossRef] [PubMed]
- Xue, M.; Chen, W.; Zhu, B.; Pan, S. Ultrahigh-Resolution Optical Vector Analysis for Arbitrary Responses Using Low-Frequency Detection. IEEE Photon. Technol. Lett. 2018, 30, 1523–1526. [Google Scholar] [CrossRef]
- Xue, M.; Chen, W.; Heng, Y.; Qing, T.; Pan, S. Ultrahigh-resolution optical vector analysis using fixed low-frequency electrical phase-magnitude detection. Opt. Lett. 2018, 43, 3041–3044. [Google Scholar] [CrossRef]
- Tang, Z.; Pan, S. A high-resolution optical vector network analyzer with the capability of measuring bandpass devices. In Proceedings of the IEEE International Topical Meeting on Microwave Photonics (MWP), Alexandria, VA, USA, 28–31 October 2013; pp. 225–228. [Google Scholar]
- Xue, M.; Pan, S.; Zhao, Y. Large dynamic range optical vector analyzer based on optical single-sideband modulation and Hilbert transform. Appl. Phys. A 2016, 122, 197. [Google Scholar] [CrossRef]
- Xue, M.; Pan, S.; He, C.; Guo, R.; Zhao, Y. Wideband optical vector network analyzer based on optical single-sideband modulation and optical frequency comb. Opt. Lett. 2013, 38, 4900–4902. [Google Scholar] [CrossRef] [Green Version]
- Wang, M.; Yao, J. Optical Vector Network Analyzer Based on Unbalanced Double-Sideband Modulation. IEEE Photon. Technol. Lett. 2013, 25, 753–756. [Google Scholar] [CrossRef]
- Jun, W.; Wang, L.; Yang, C.; Li, M.; Zhu, N.H.; Guo, J.; Xiong, L.; Li, W. Optical vector network analyzer based on double-sideband modulation. Opt. Lett. 2017, 42, 4426. [Google Scholar] [CrossRef]
- Liu, S.; Xue, M.; Fu, J.; Wu, L.; Pan, S. Ultrahigh-resolution and wideband optical vector analysis for arbitrary responses. Opt. Lett. 2018, 43, 727–730. [Google Scholar] [CrossRef]
- Wen, J.; Shi, D.; Jia, Z.; Shi, Z.; Li, M.; Zhu, N.H.; Li, W. Accuracy-Enhanced Wideband Optical Vector Network Analyzer Based on Double-Sideband Modulation. J. Light. Technol. 2019, 37, 2920–2926. [Google Scholar] [CrossRef]
- Xue, M.; Liu, S.; Pan, S. High-Resolution Optical Vector Analysis Based on Symmetric Double-Sideband Modulation. IEEE Photon. Technol. Lett. 2018, 30, 491–494. [Google Scholar] [CrossRef]
- Su, T.; Wen, J.; Shi, Z.; Li, M.; Chen, W.; Zhu, N.; Li, W. Wideband optical vector network analyzer based on polarization modulation. Opt. Commun. 2019, 437, 67–70. [Google Scholar] [CrossRef]
- Qing, T.; Xue, M.; Huang, M.; Pan, S. Measurement of optical magnitude response based on double-sideband modulation. Opt. Lett. 2014, 39, 6174–6176. [Google Scholar] [CrossRef] [PubMed] [Green Version]
- Qing, T.; Li, S.; Tang, Z.; Gao, B.; Pan, S. Optical vector analysis with attometer resolution, 90-dB dynamic range and THz bandwidth. Nat. Commun. 2019, 10, 1–9. [Google Scholar] [CrossRef] [Green Version]
- Zou, X.; Zhang, S.; Wang, H.; Liu, J.; Zhang, Y.; Lu, R.; Liu, Y. Self-calibrated electrical measurement of magnitude response of optical filters based on dual-frequency-shifted heterodyne. Opt. Eng. 2016, 55, 56105. [Google Scholar] [CrossRef]
- Zou, X.; Zhang, S.; Wang, H.; Zhang, Z.; Li, J.; Zhang, Y.; Liu, S.; Liu, Y. Wide-band and high-resolution measurement of magnitude-frequency response for optical filters based on fixed-low-frequency heterodyne detection. IEEE Photon. J. 2017, 9, 1–9. [Google Scholar]
- Zou, X.; Zhang, S.; Zhang, Z.; Ye, Z.J.; Lu, R.; Chen, D.; Liu, S.; Li, H.; Liu, Y. Hyperfine Intrinsic Magnitude and Phase Response Measurement of Optical Filters Based on Electro-Optical Harmonics Heterodyne and Wiener-Lee Transformation. J. Light. Technol. 2018, 37, 2654–2660. [Google Scholar] [CrossRef]
- Qing, T.; Li, S.; Xue, M.; Zhu, N.; Pan, S. Optical vector analysis based on asymmetrical optical double-sideband modulation using a dual-drive dual-parallel Mach-Zehnder modulator. Opt. Express 2017, 25, 4665. [Google Scholar] [CrossRef] [Green Version]
- Qing, T.; Li, S.; Pan, S.; Xue, M. Optical vector analysis based on double-sideband modulation and stimulated Brillouin scattering. Opt. Lett. 2016, 41, 3671. [Google Scholar] [CrossRef]
- Chen, Z.; Ye, L.; Dai, J.; Zhang, T.; Yin, F.; Zhou, Y.; Xu, K. Long-term measurement of high Q optical resonators based on optical vector network analysis with Pound Drever Hall technique. Opt. Express 2018, 26, 26888–26895. [Google Scholar] [CrossRef]
- Dai, J.; Chen, Z.; Wang, X.; Ye, L.; Zhang, T.; Xu, K. Accurate optical vector network analyzer based on optical double-sideband suppressed carrier modulation. Opt. Commun. 2019, 447, 61–66. [Google Scholar] [CrossRef]
- Morozov, O.G.; Nureev, I.I.; Sakhabutdinov, A.Z.; Misbakhov, R.S.S.; Sakhbiev, T.R.; Nurullin, R.; Papazyan, S.; Sarvarova, L.M. Optical vector analyzer based on carrier-suppressed double-sideband modulation and phase-shift fiber Bragg grating. In Proceedings of the Optical Technologies for Telecommunications 2018; SPIE: Bellingham, DC, USA, 2019; Volume 11146, p. 111460R. [Google Scholar]
- Morozov, O.G.; Nureev, I.I.; Sakhabutdinov, A.Z.; Misbakhov, R.S.; Papazyan, S. Optical Vector Analyzer Based on Double-Side Modulation with a Suppressed Carrier and Phase-Shift FBG. In Proceedings of the Systems of Signals Generating and Processing in the Field of on Board Communications, Moscow, Russia, 20–21 March 2019; pp. 1–6. [Google Scholar]
- Morozov, O.; Sakhabutdinov, A.; Nureev, I.; Papazyan, S. Optical vector analyzer for characterization of Fano resonance structures based on unbalanced double-sideband modulation. ITM Web Conf. 2019, 30, 14003. [Google Scholar] [CrossRef]
Figure 1.
Block diagram of the optical vector analyzer (OVA) based on optical single-sideband (OSSB)-modulation: RF—radio frequency; OSSB—OSSB modulator; DUT—device under test; PD—photodetector (adapted from [4]).
Figure 1.
Block diagram of the optical vector analyzer (OVA) based on optical single-sideband (OSSB)-modulation: RF—radio frequency; OSSB—OSSB modulator; DUT—device under test; PD—photodetector (adapted from [4]).
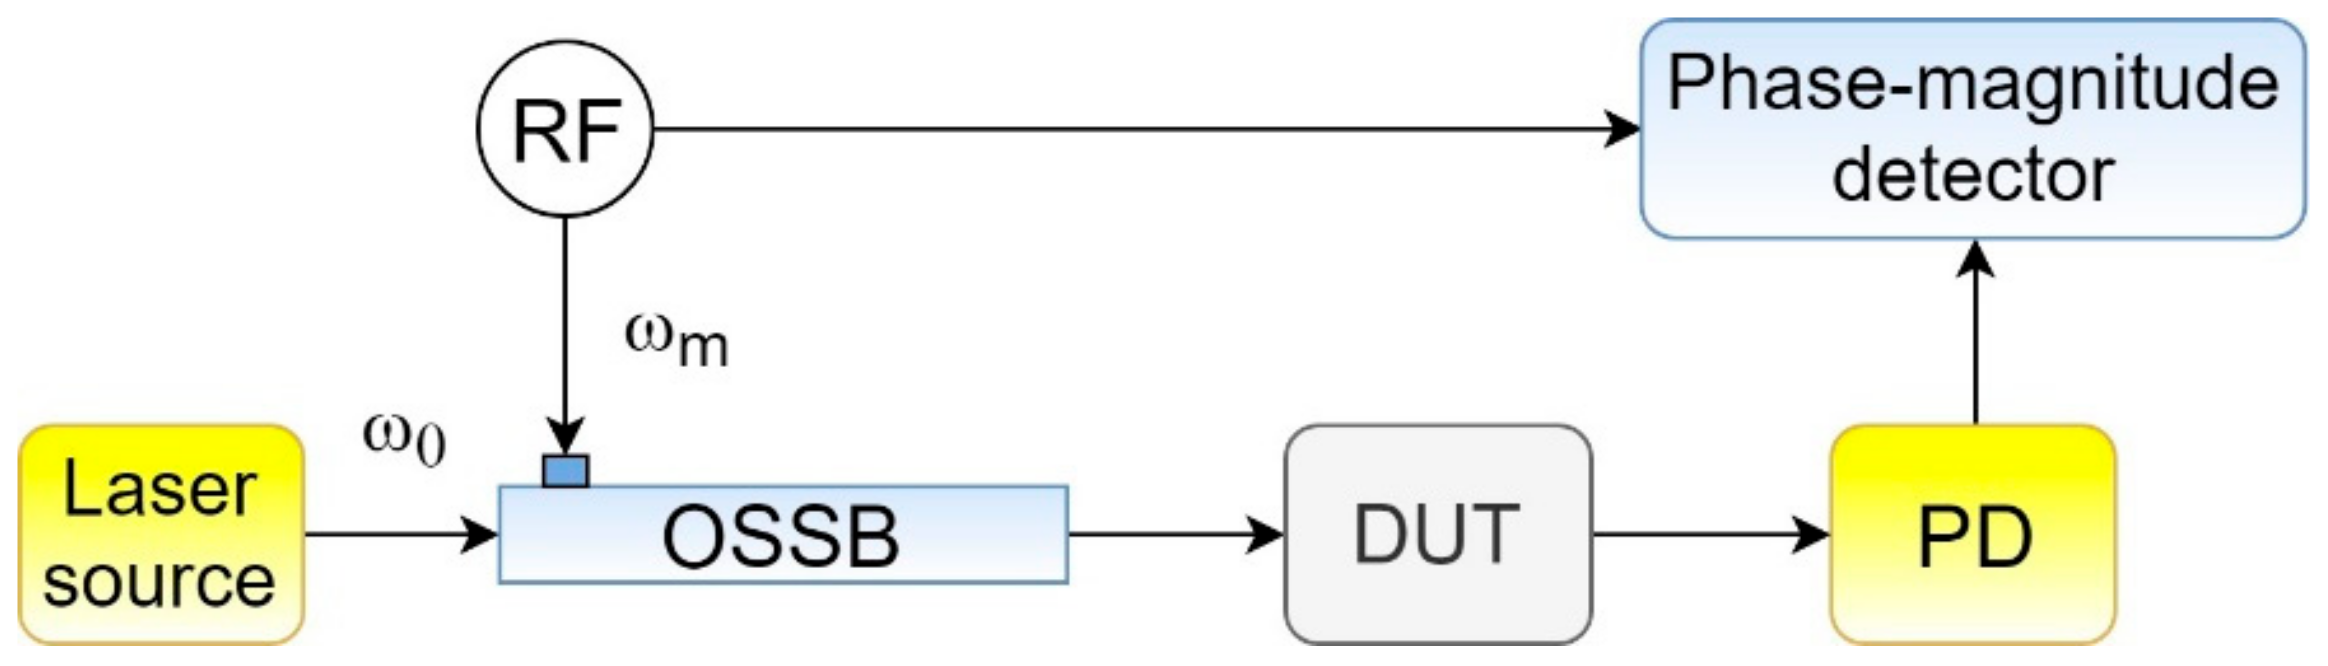
Figure 2.
The principle of scanning the frequency response H(ω) by radiation of an ideal OSSB-signal: ω0—frequency of optical carrier; ωm—modulation frequency (adapted from [5]).
Figure 2.
The principle of scanning the frequency response H(ω) by radiation of an ideal OSSB-signal: ω0—frequency of optical carrier; ωm—modulation frequency (adapted from [5]).
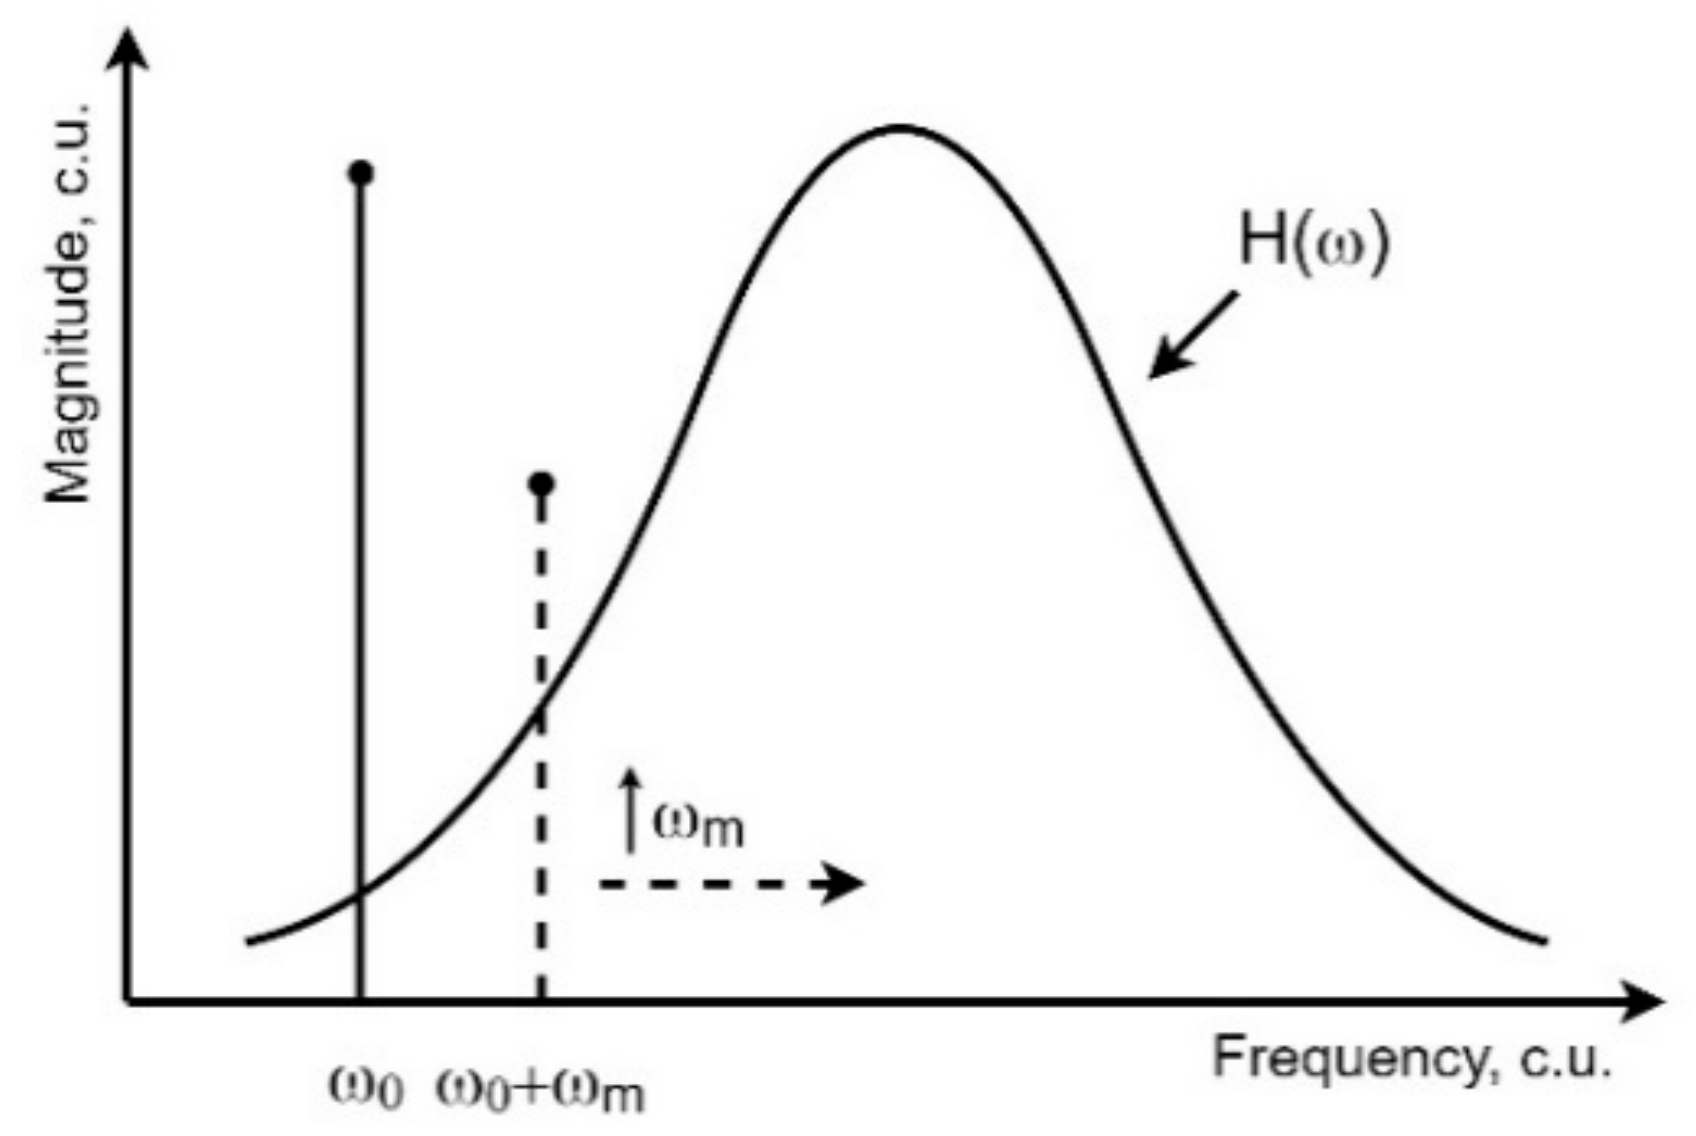
Figure 3.
The principle of balanced photodetection: DUT—device under test; BPD—balanced photodetector; red lines—optical signal; blue line—electrical signal (adapted from [11]).
Figure 3.
The principle of balanced photodetection: DUT—device under test; BPD—balanced photodetector; red lines—optical signal; blue line—electrical signal (adapted from [11]).
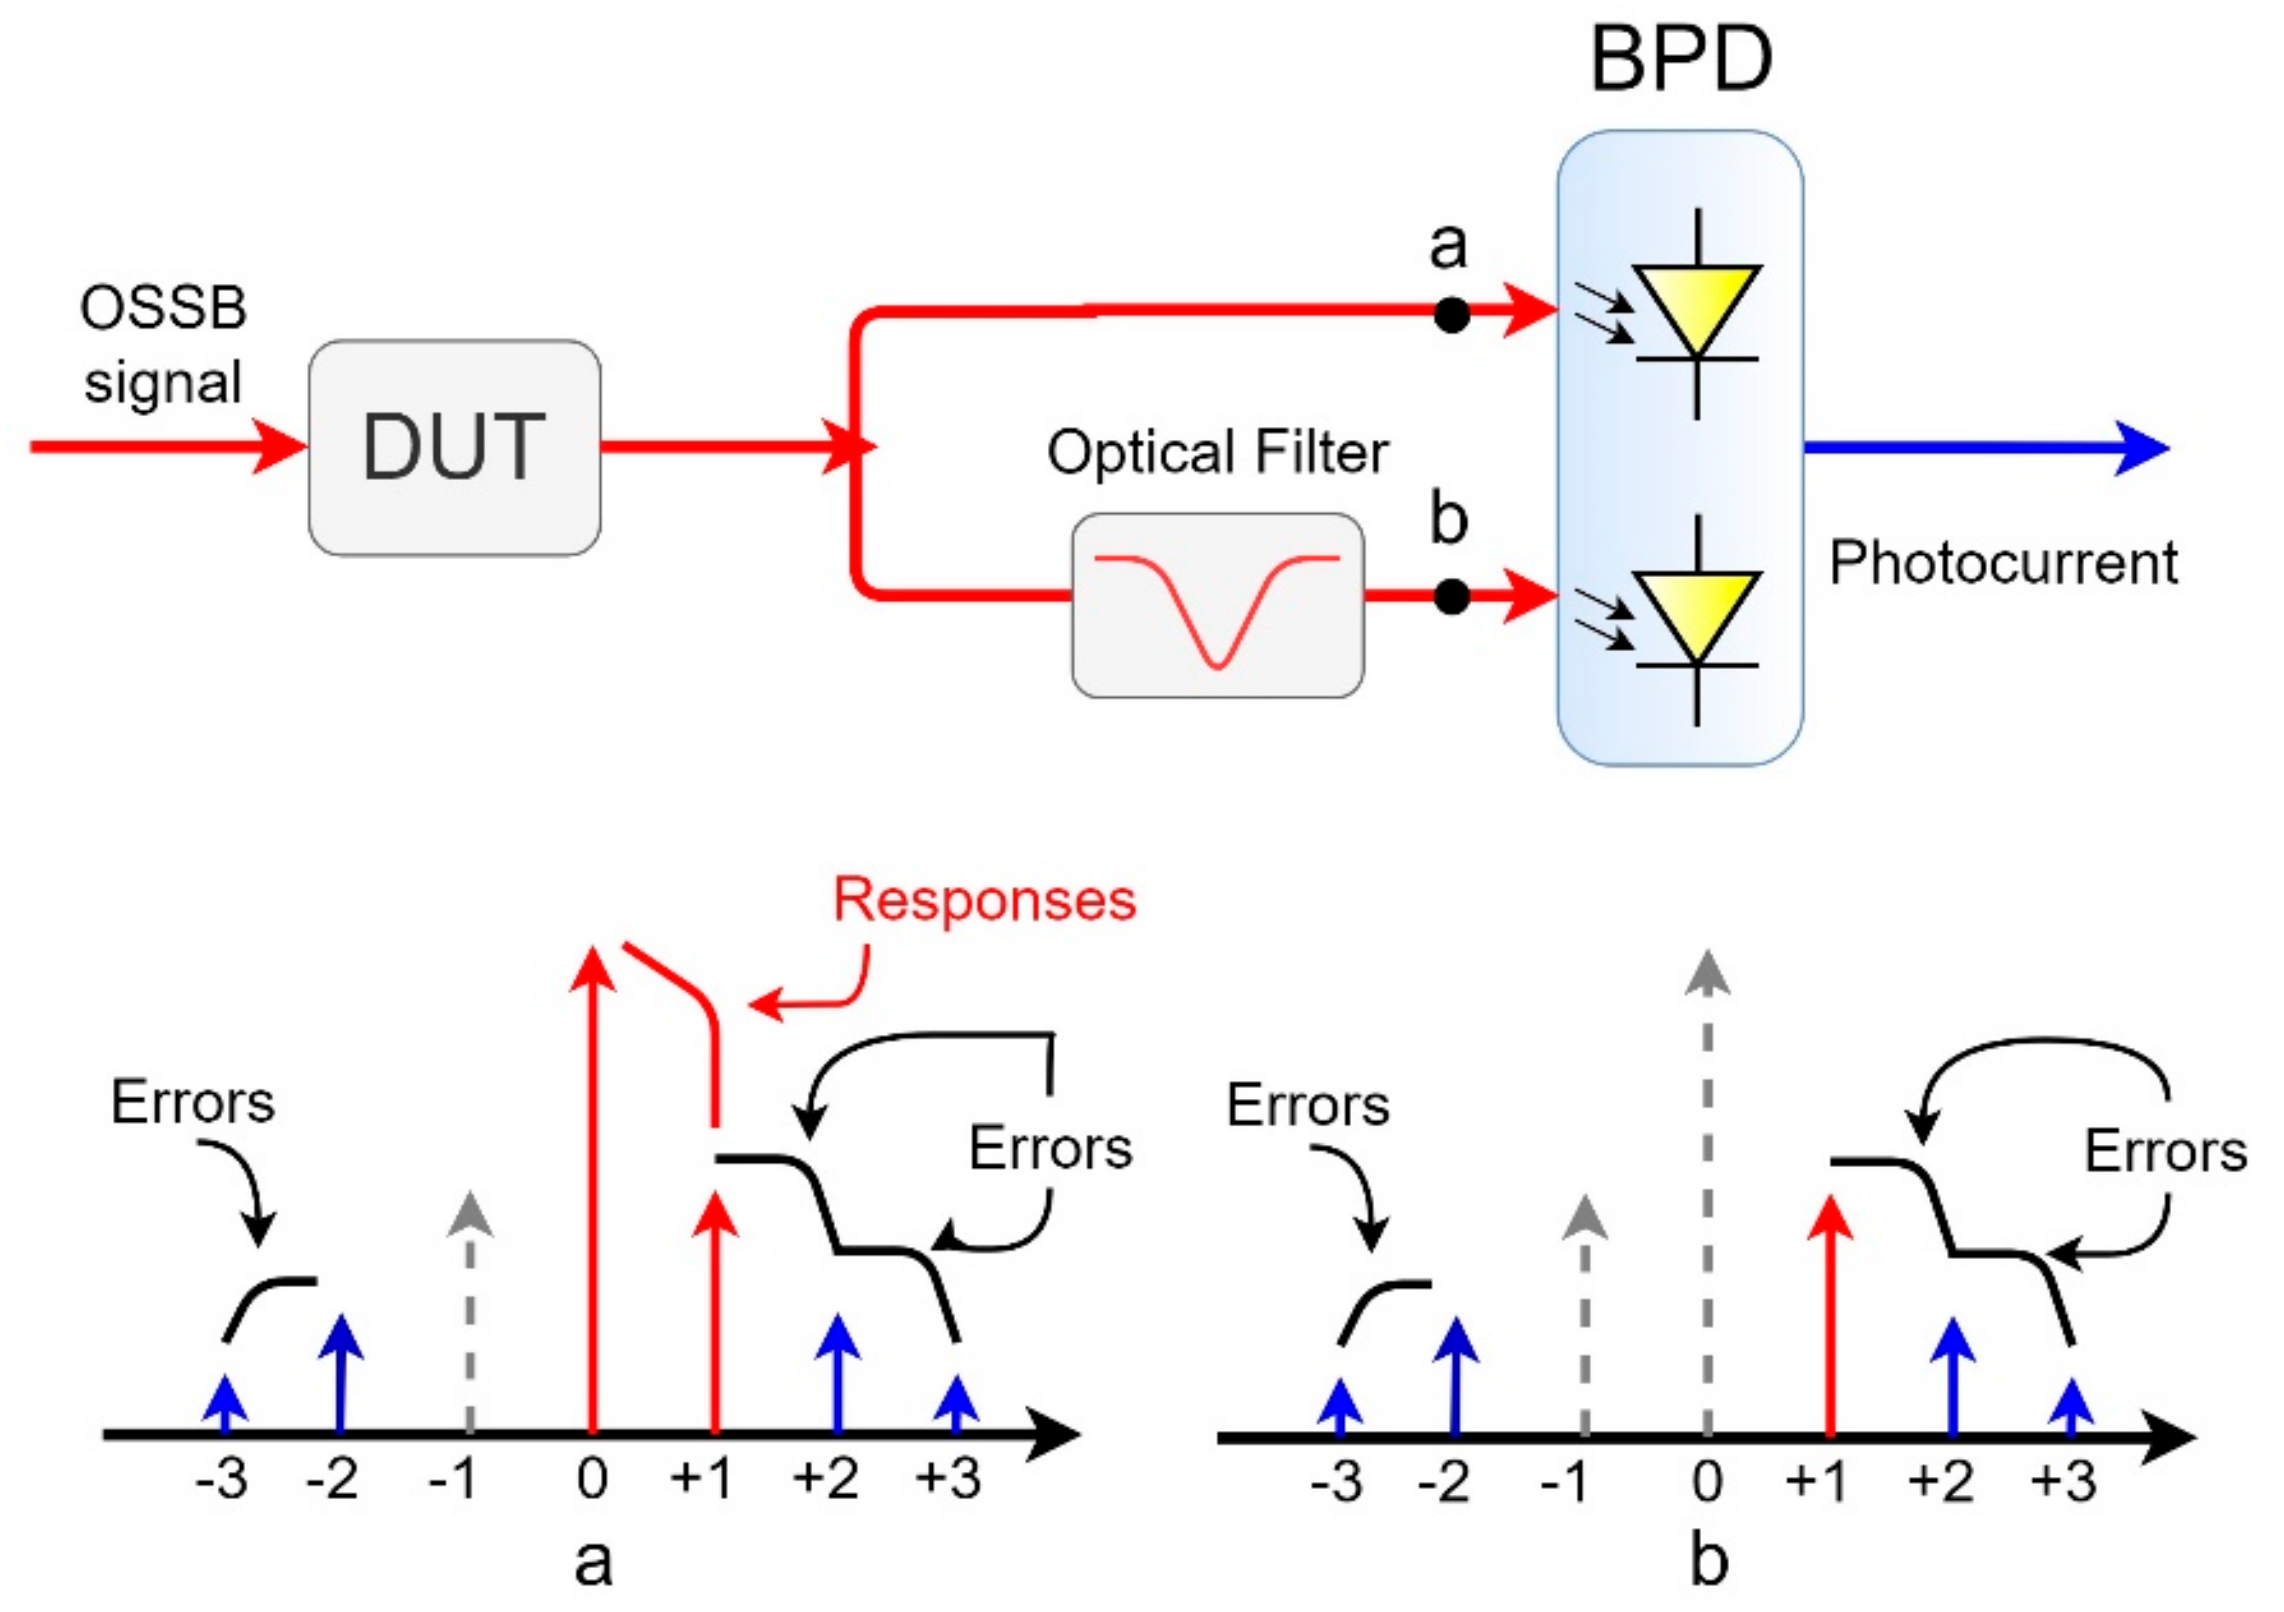
Figure 4.
The schematic diagram of the OVA based on OSSB-modulation and optical frequency comb: OFC Generator—optical frequency comb generator; TOBPF—tunable optical bandpass filter; DUT—device under test; PD—photodetector; PMD—phase–magnitude detector; RF—radiofrequency; ω0—frequency of the optical carrier; ωm—modulation frequency; red lines—optical signal; blue lines—electrical signal; dotted line—data path (adapted from [17]).
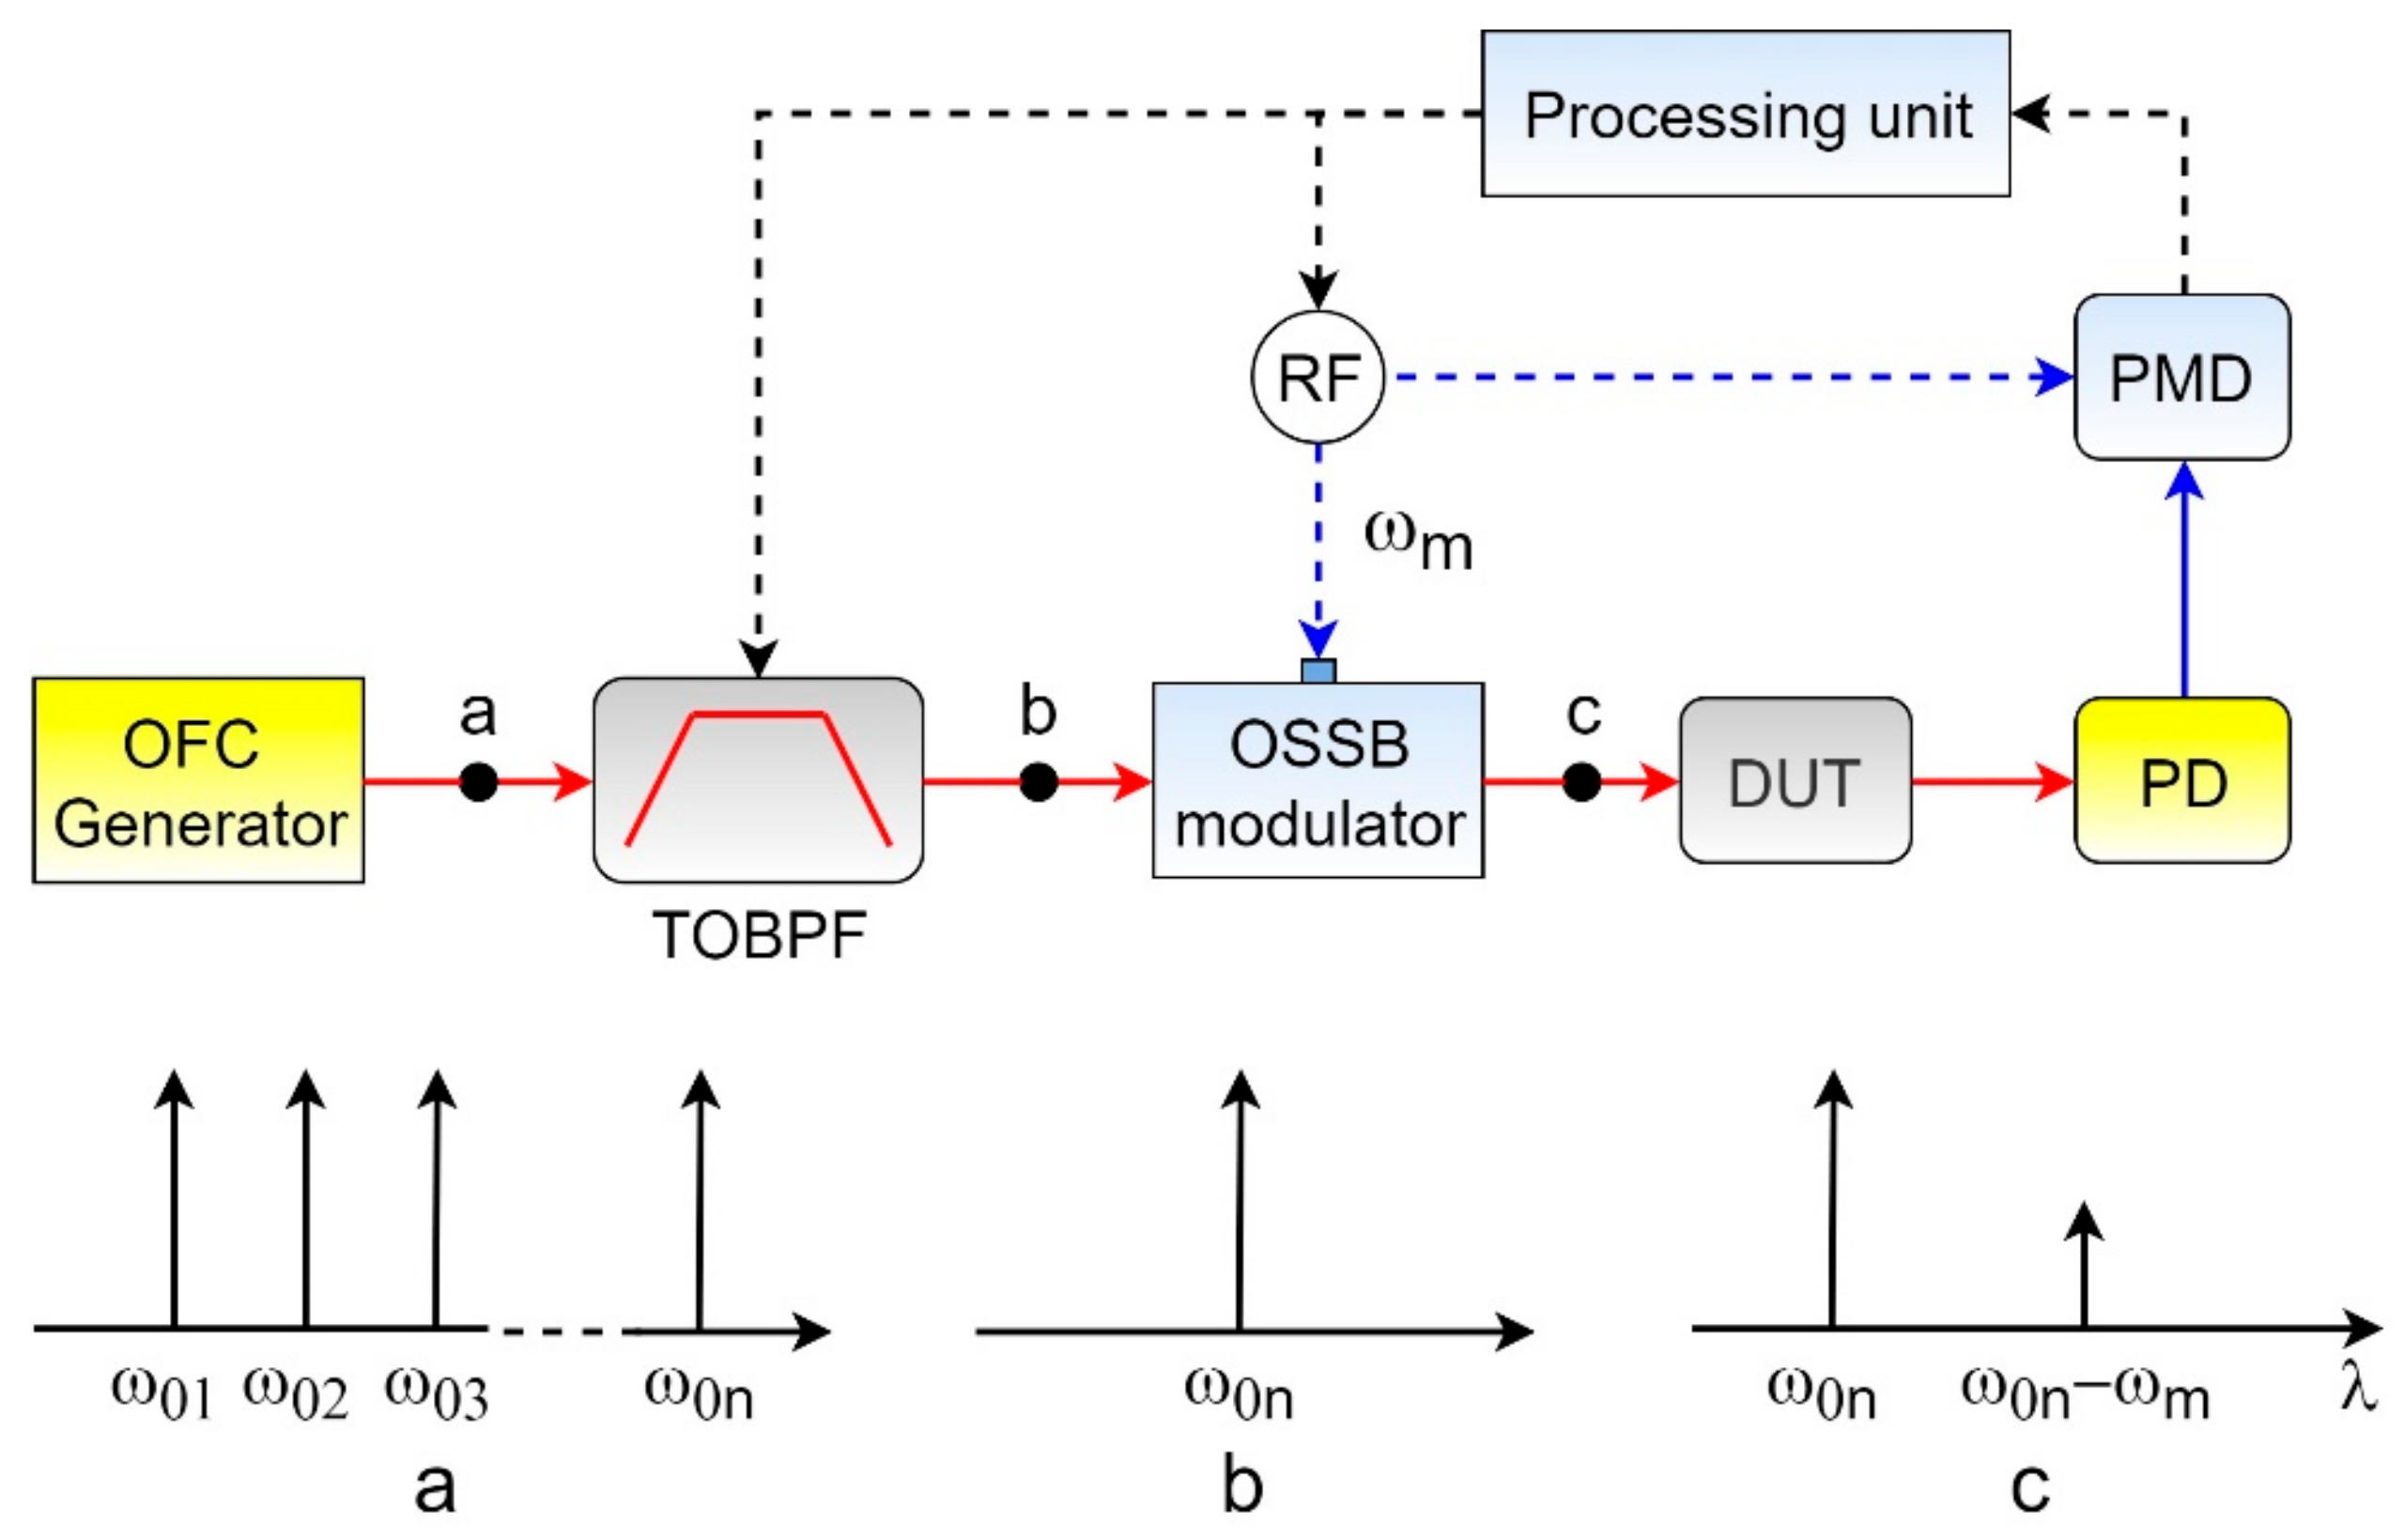
Figure 5.
Spectra of scanning optical double-sideband (ODSB)-signals: (a) With symmetric ODSB, (b) with asymmetric ODSB. ω0—the frequency of optical carrier; Ω—the modulation frequency; Δω—a fixed frequency shift.
Figure 5.
Spectra of scanning optical double-sideband (ODSB)-signals: (a) With symmetric ODSB, (b) with asymmetric ODSB. ω0—the frequency of optical carrier; Ω—the modulation frequency; Δω—a fixed frequency shift.
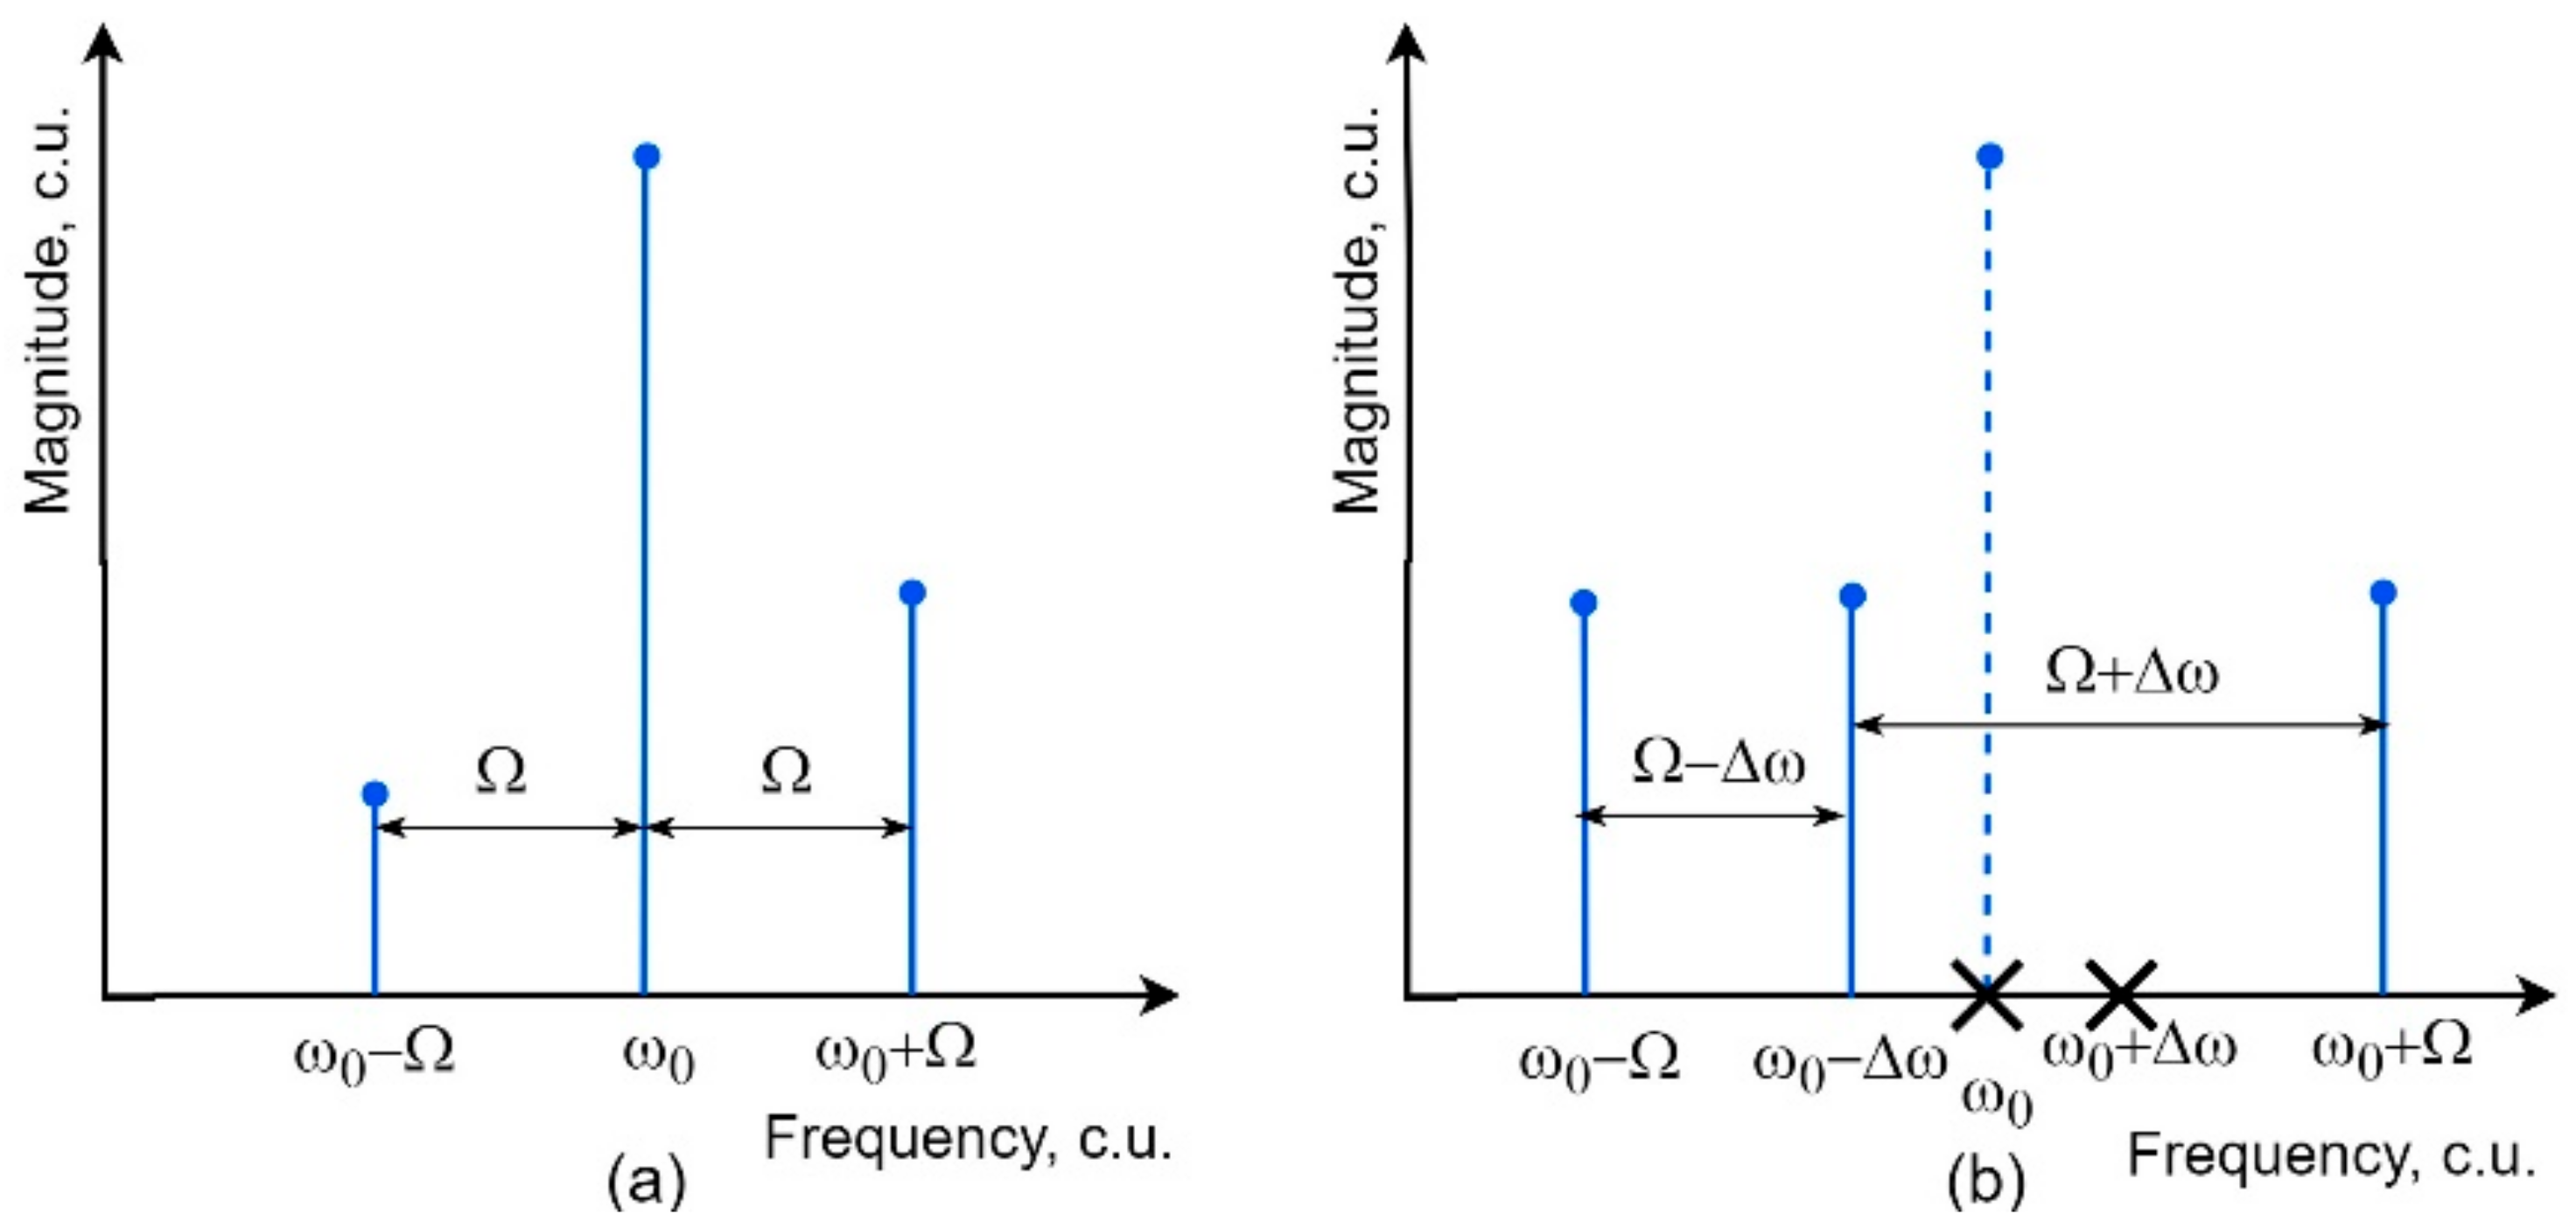
Figure 6.
The schematic diagram of the OVA based on symmetric ODSB and DPMZM: TLS—tunable laser source; MZM—Mach–Zehnder modulator; DPMZM—dual-parallel MZM; RF—radiofrequency; DUT—device under test; PD—photodetector; PMD—phase-magnitude detector; red lines—optical signal; blue lines—electrical signal; dotted line—data path (adapted from [19]).
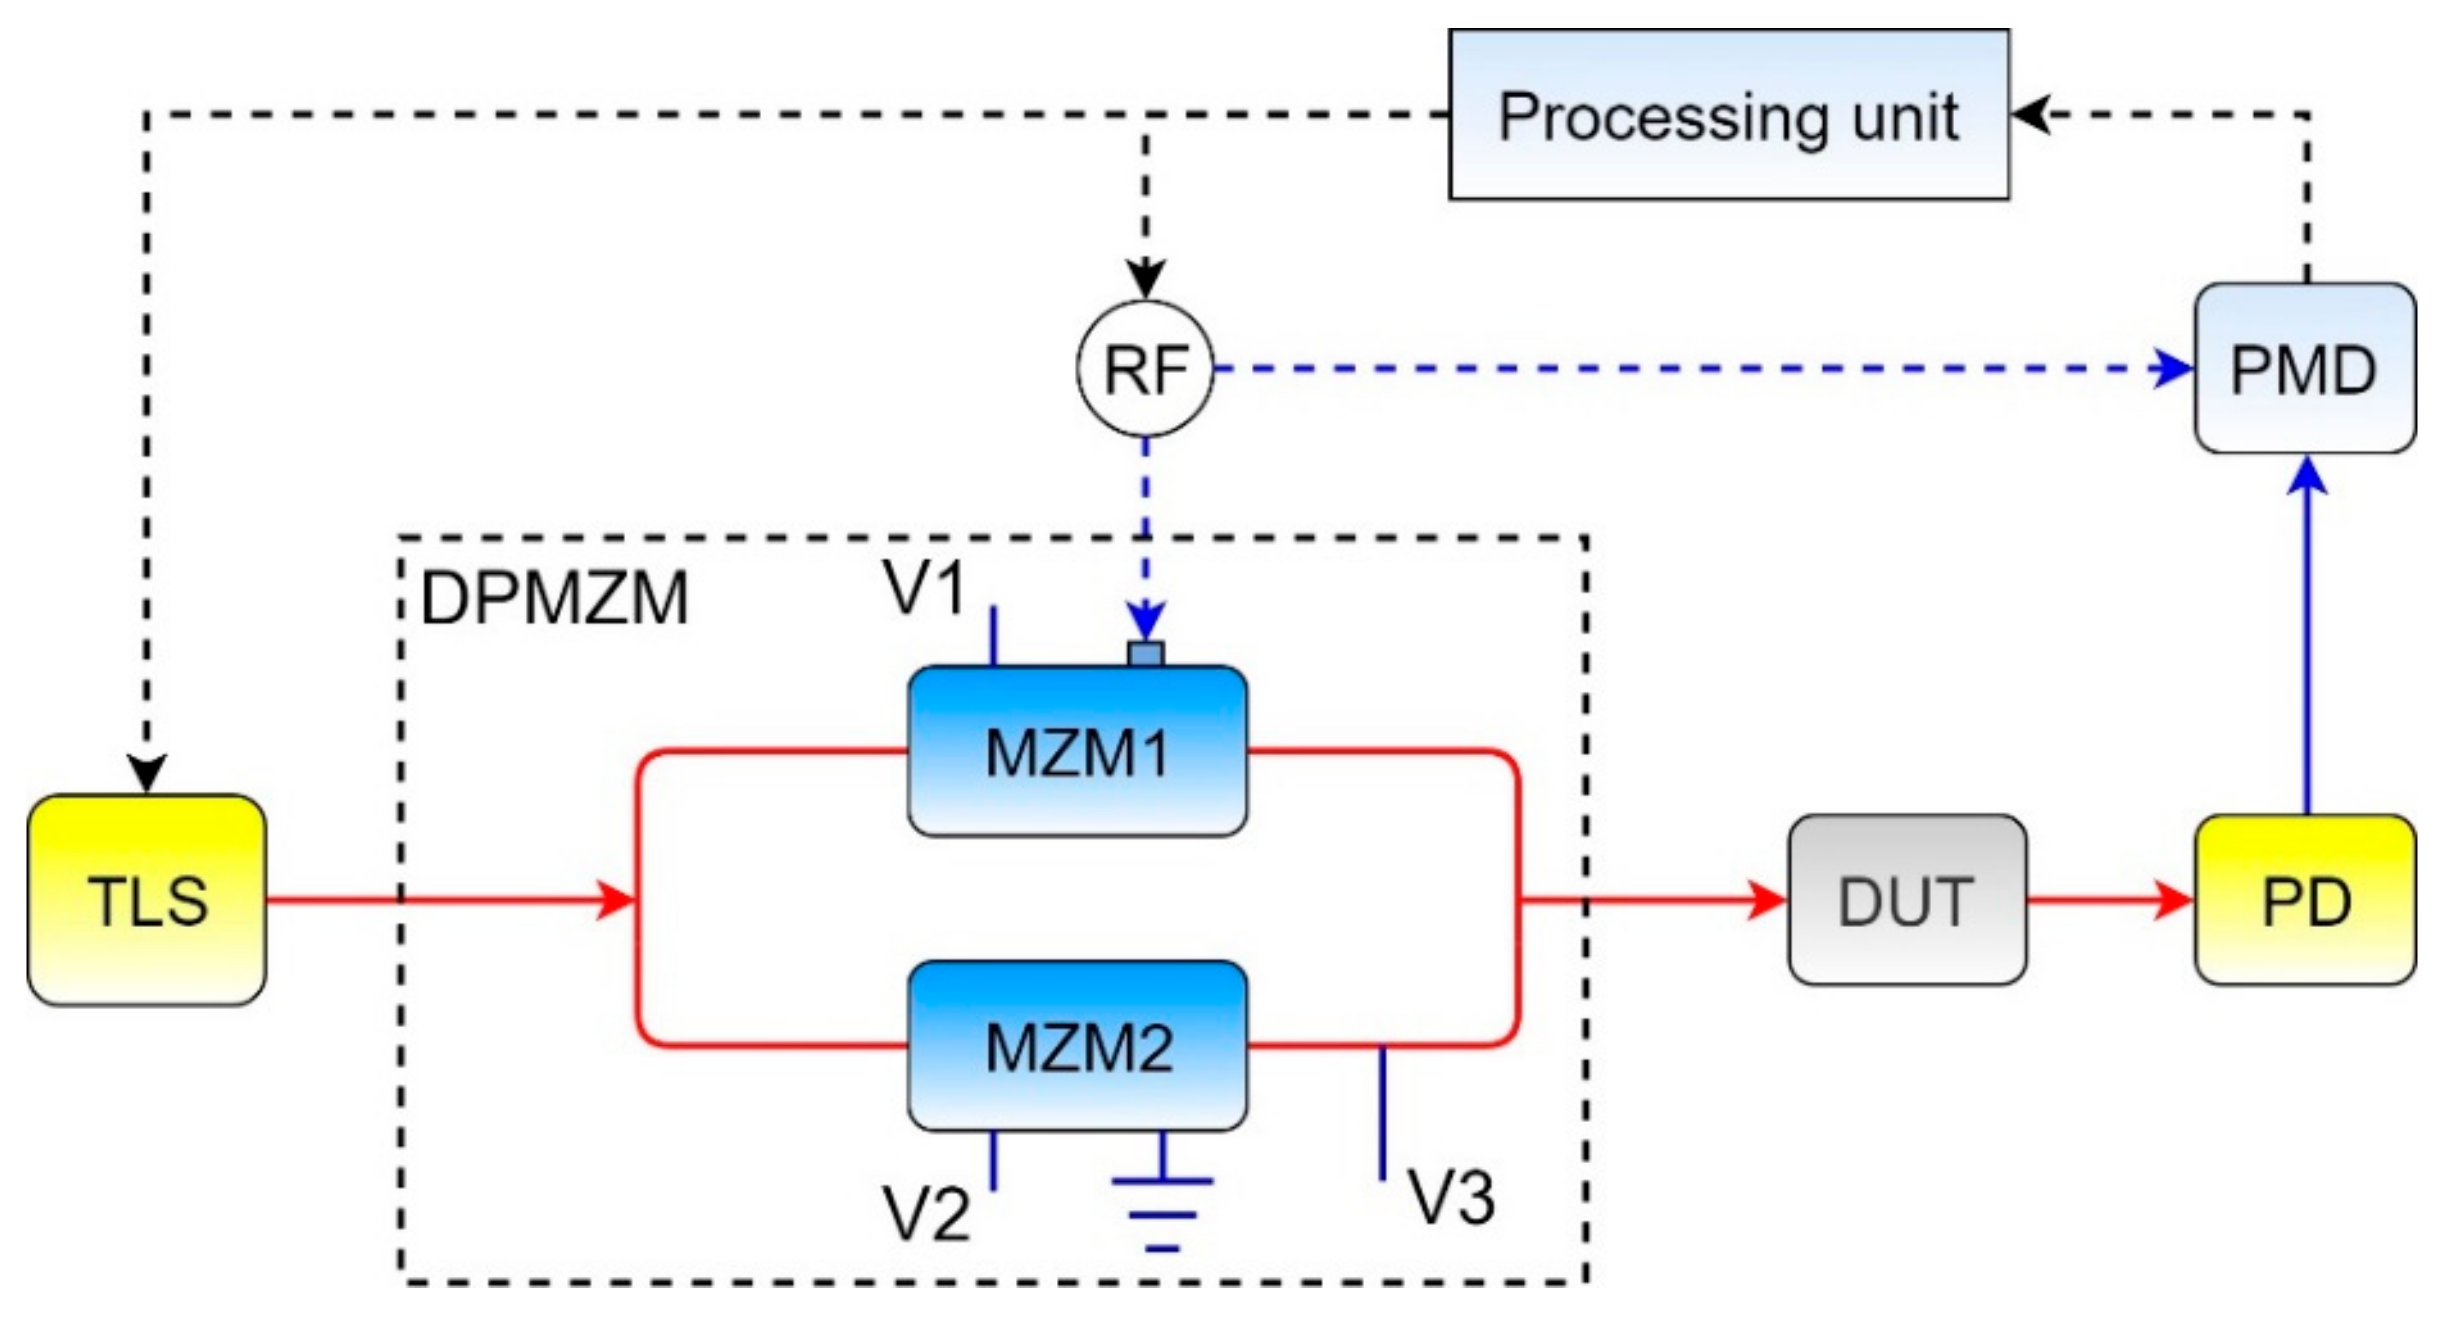
Figure 7.
The schematic diagram of the OVA based on symmetric ODSB and different modulation schemes: TLS—tunable laser source; MZM—Mach–Zehnder modulator; PM—phase-modulator; RF—radio frequency; DUT—device under test; PD—photodetector; PMD—phase-magnitude detector; red lines—optical signal; blue lines—electrical signal; dotted line—data path (adapted from [22]).
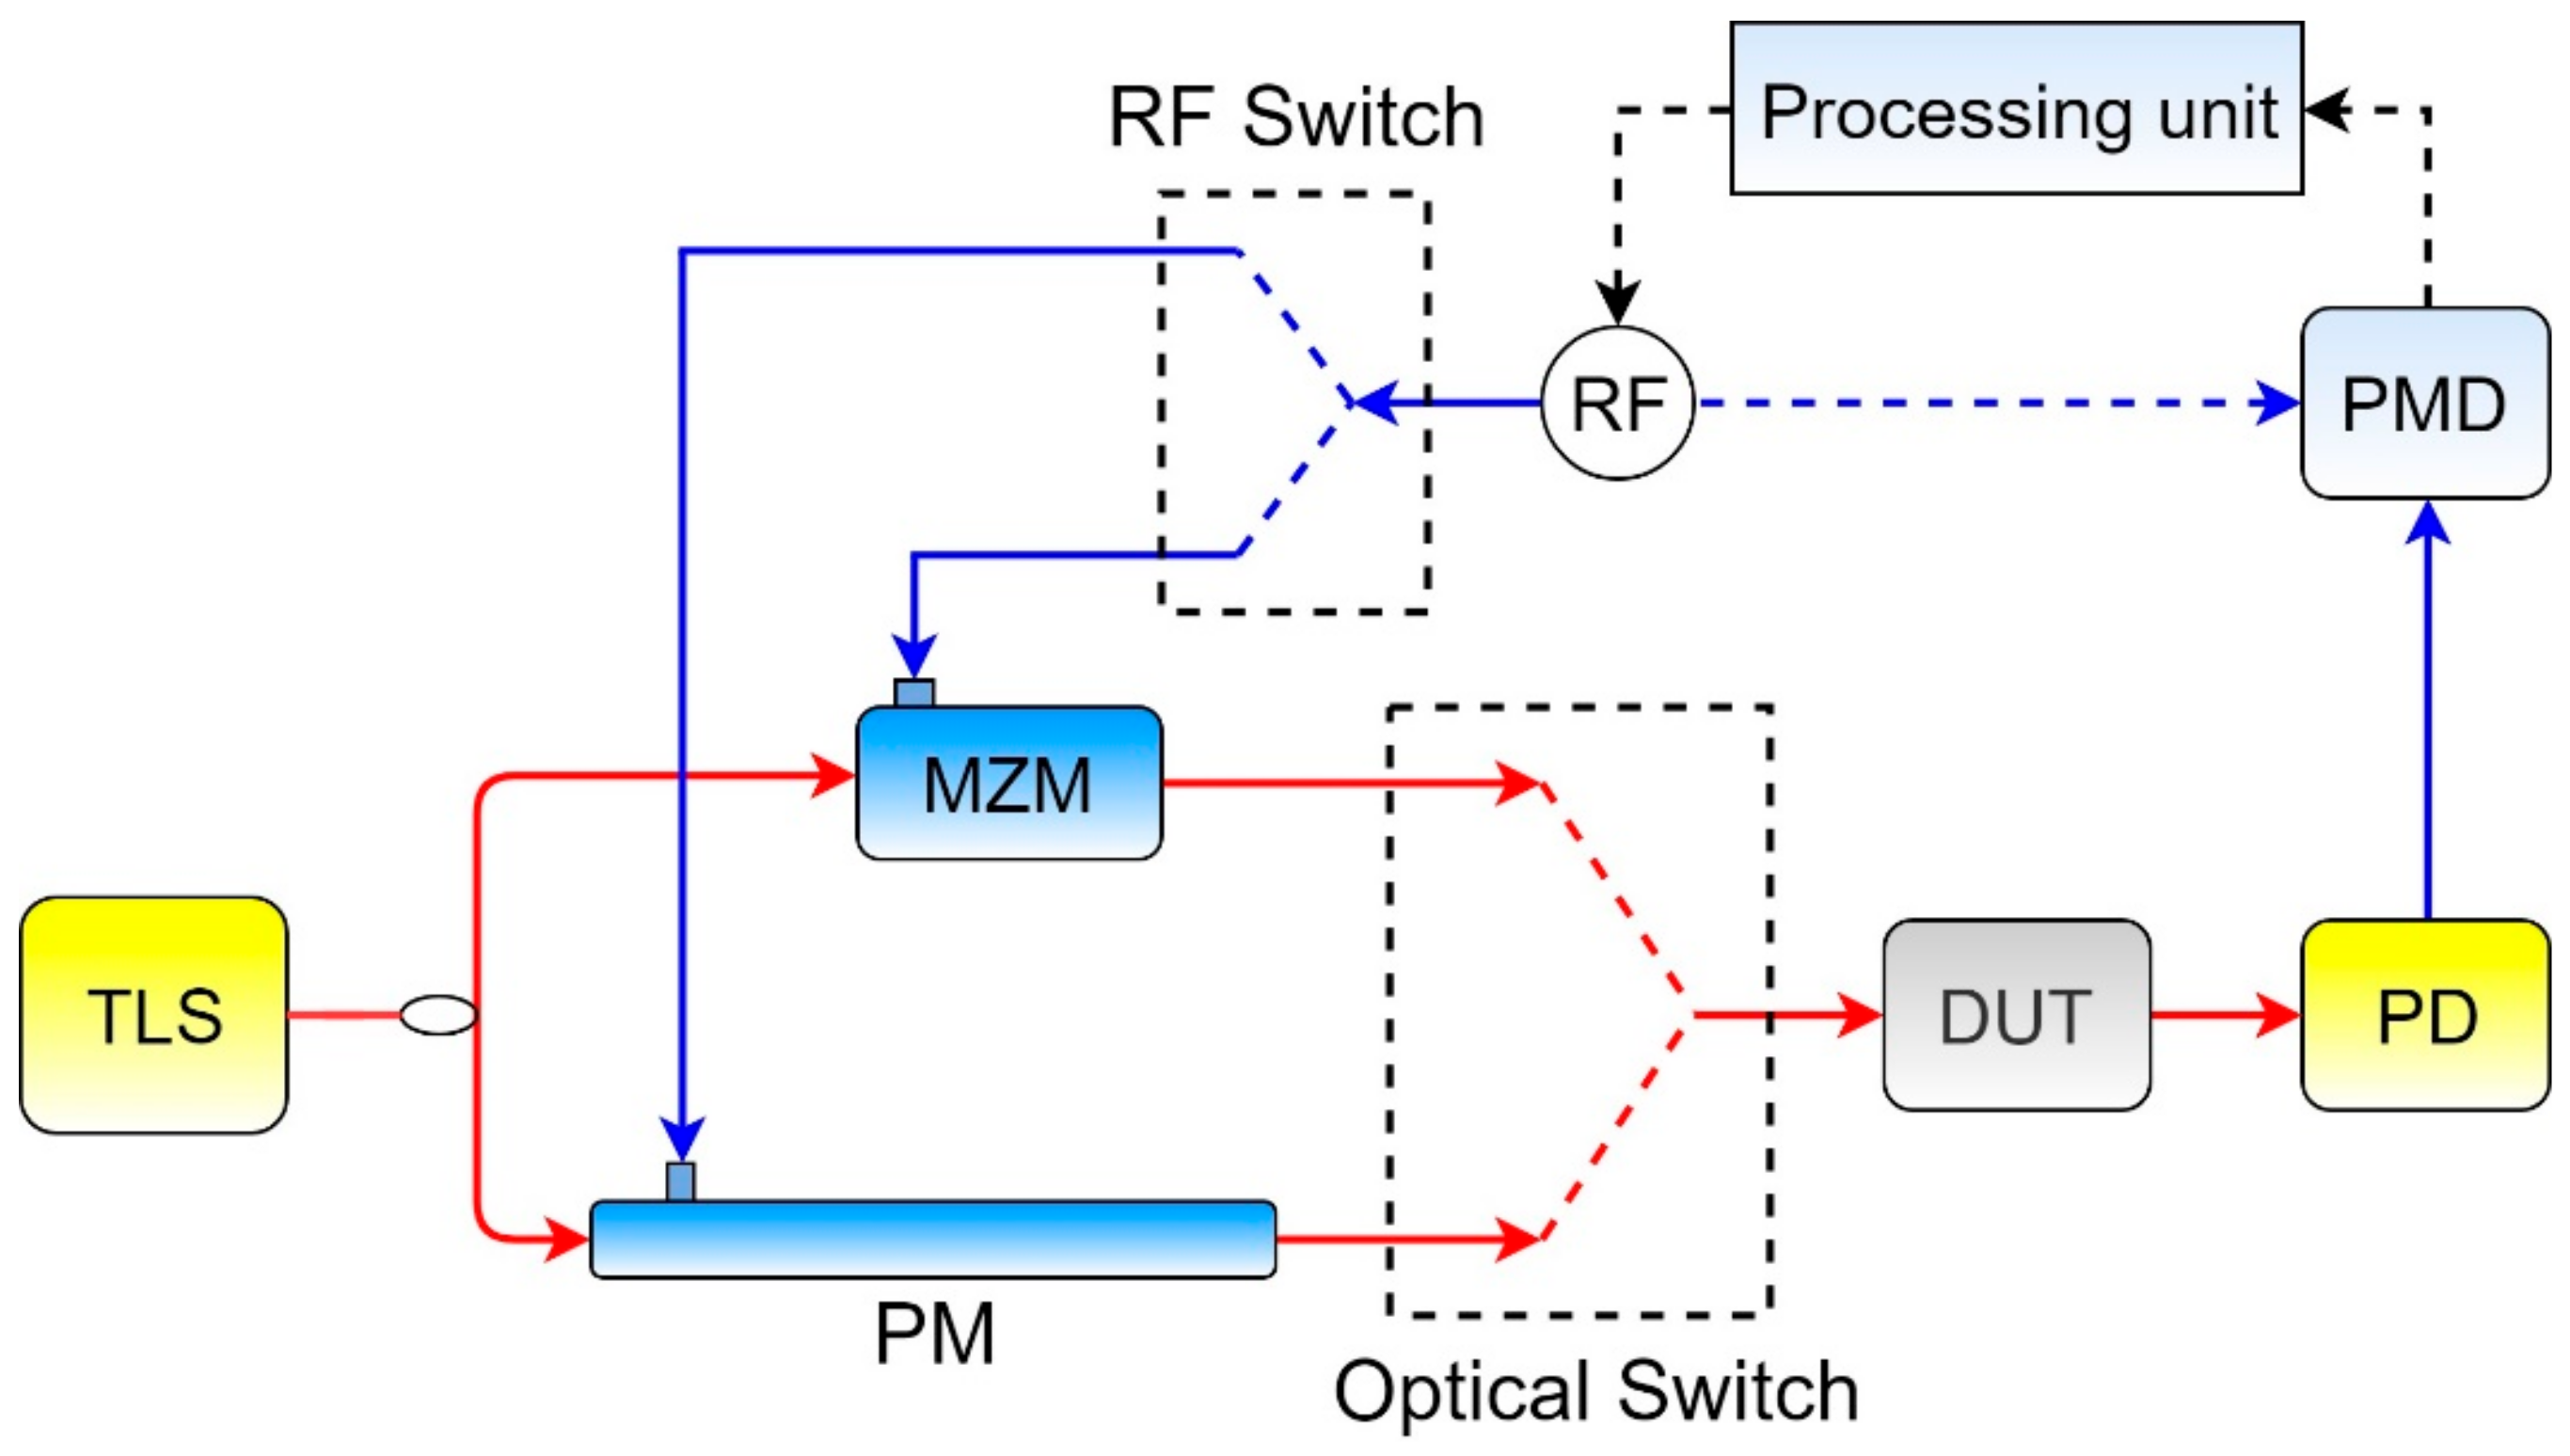
Figure 8.
The schematic diagram of the OVA based on asymmetric ODSB: TLS—tunable laser source; MZM—Mach–Zehnder modulator; RF—radio frequency; DUT—device under test; PD—photodetector; ESA—electrical spectrum analyzer; red lines—optical signal; blue lines—electrical signal; dotted line—data path; ω0—the frequency of the optical carrier; ωm—the modulation frequency; Δω—a fixed frequency shift (adapted from [24]).
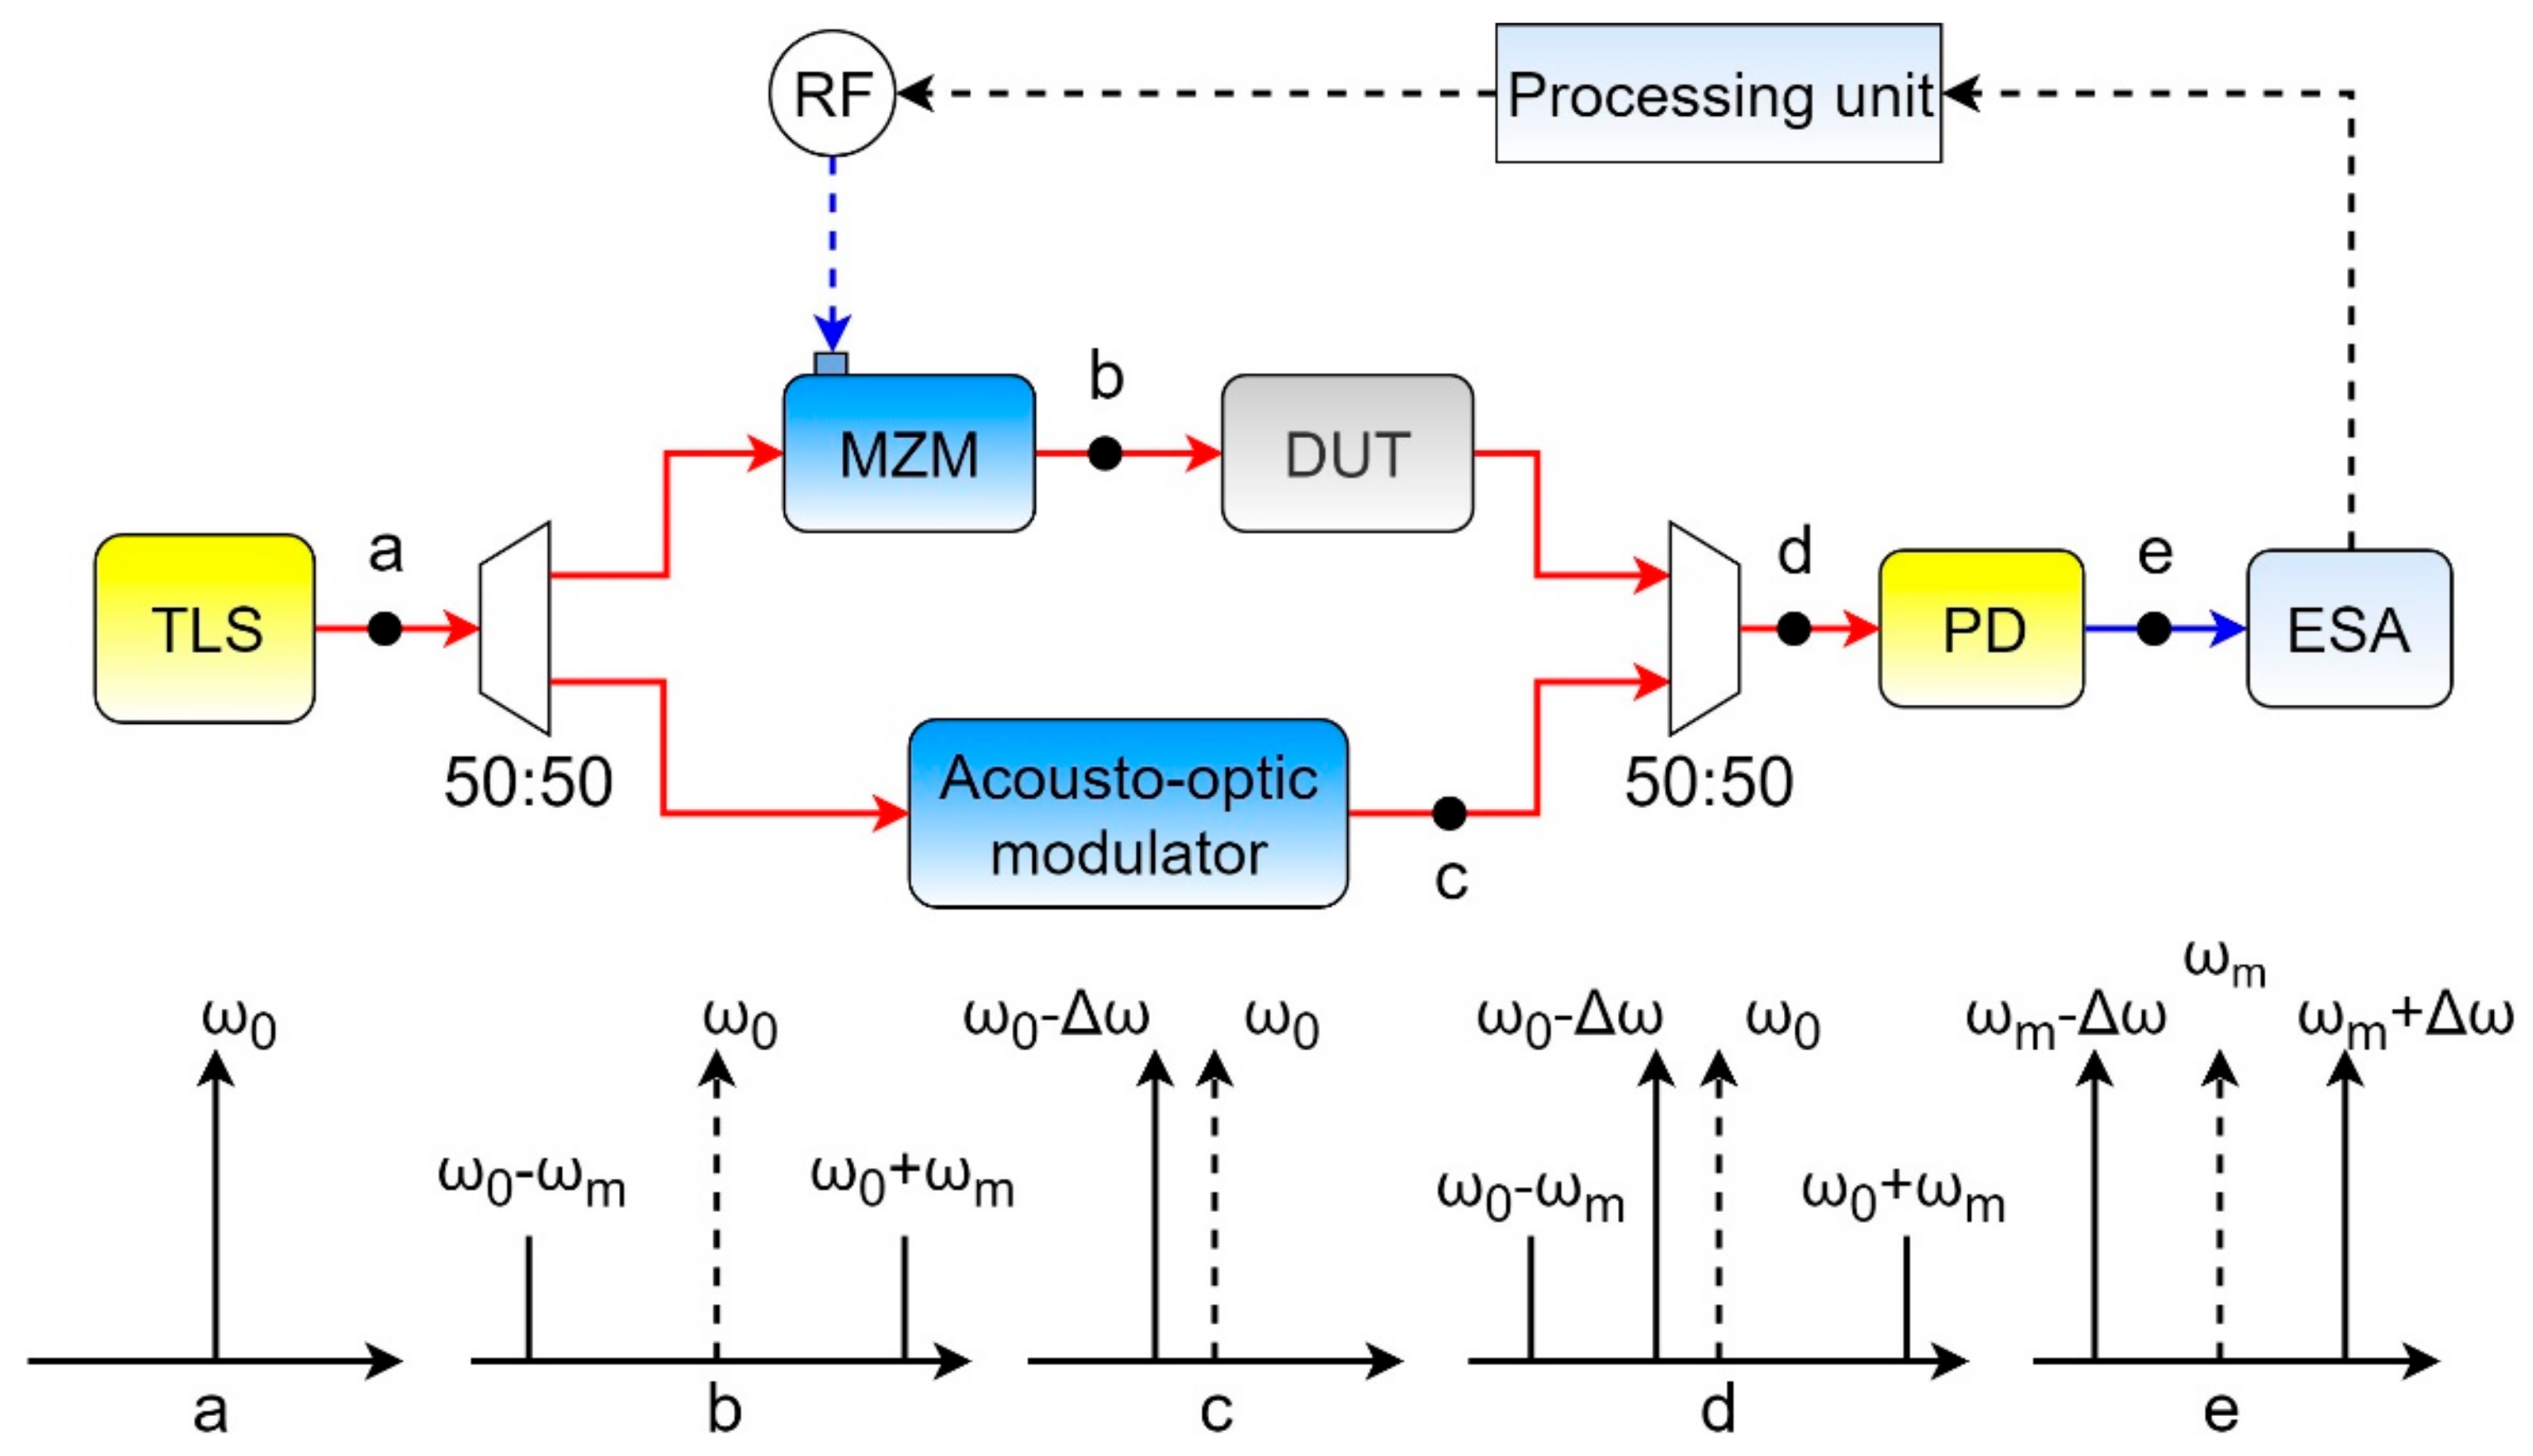
Figure 9.
The schematic diagram of the OVA based on asymmetric ODSB and DD-DPMZM: TLS—tunable laser source; MZM—Mach–Zehnder modulator; DD-DPMZM—dual-drive dual-parallel MZM; DUT—device under test; PD—photodetector; RF—radio frequency; PMD—phase-magnitude detector; BPF—bandpass filter; PU—processing unit; LO—local oscillator; red lines—optical signal; blue lines—electrical signal; ω0—the frequency of optical carrier; ωm—the modulation frequency; Δω—a fixed frequency shift (adapted from [29]).
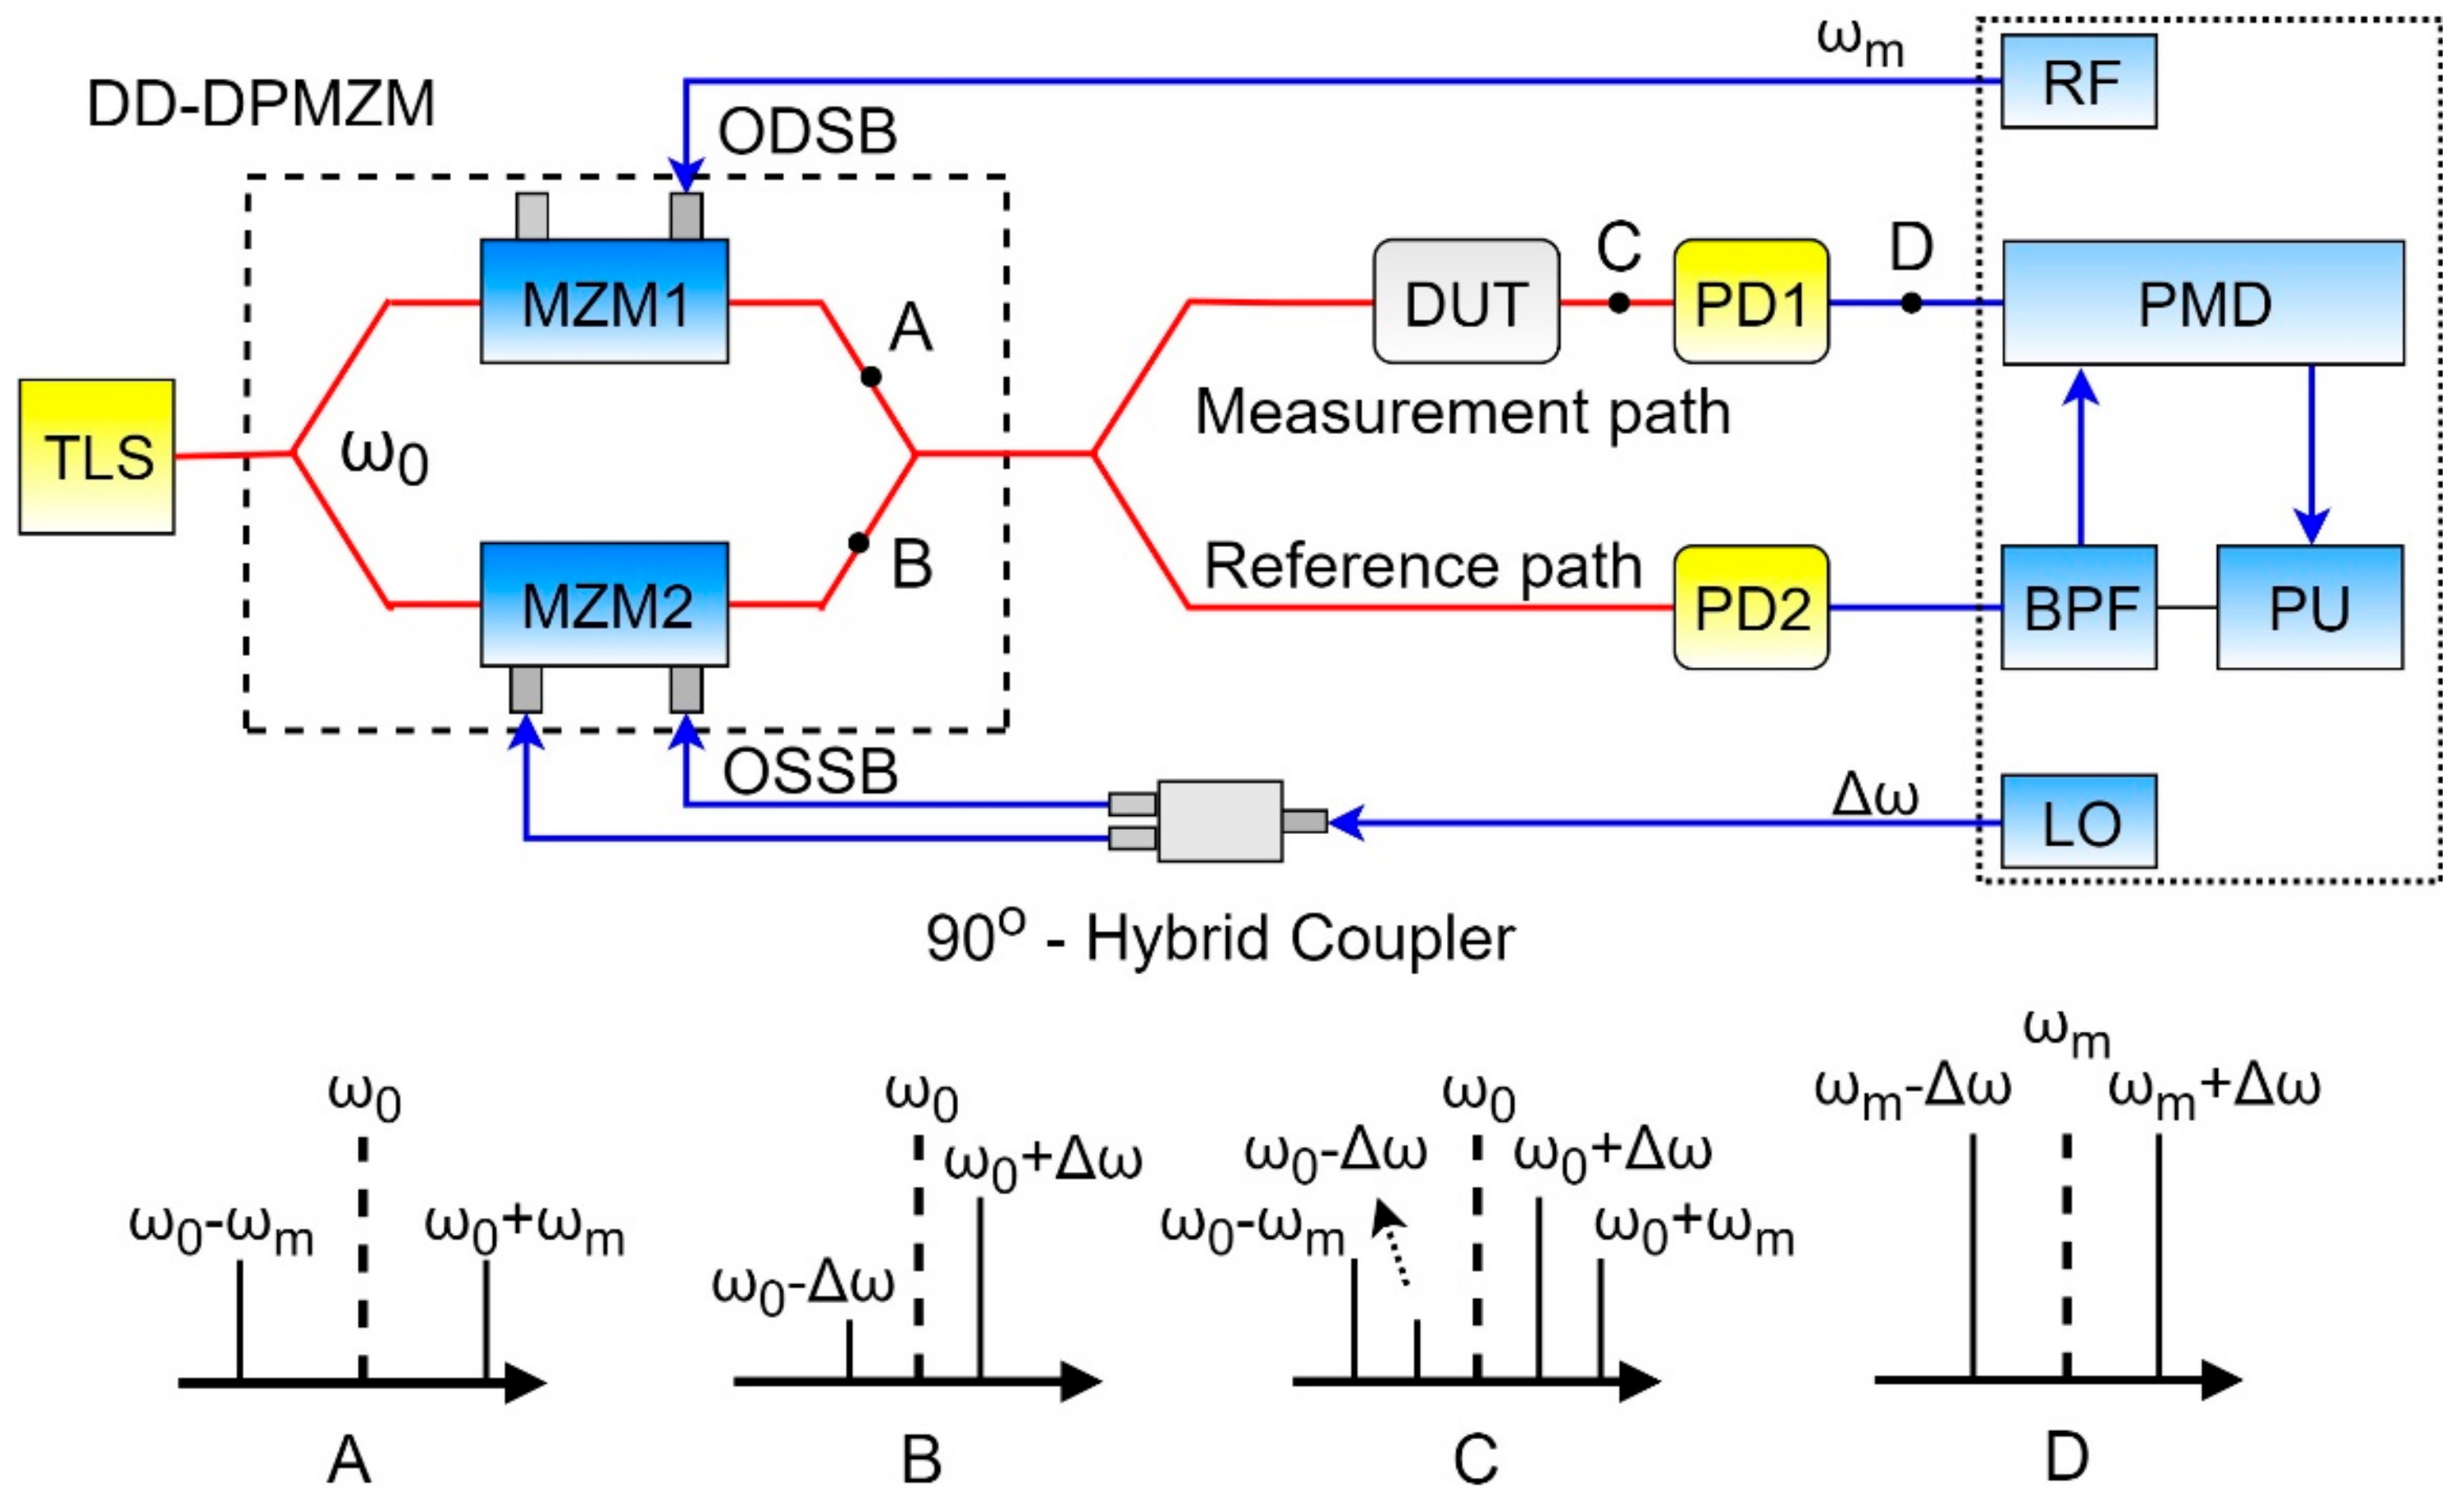
Figure 10.
The schematic diagram of the OVA based on asymmetric ODSB and SBS: TLS—tunable laser source; MZM—Mach–Zehnder modulator; DPMZM—dual-parallel MZM; RF—radio frequency; LO—local oscillator; EDFA—erbium doped fiber amplifier; SMF—single-mode fiber; DUT—device under test; PD—photodetector; BPF—bandpass filter; PMD—phase-magnitude detector; PU—processing unit; red lines—optical signal; blue lines—electrical signal; dotted line—data path; ω0—the frequency of optical carrier; ωm—the modulation frequency; Δω—a fixed frequency shift (adapted from [30]).
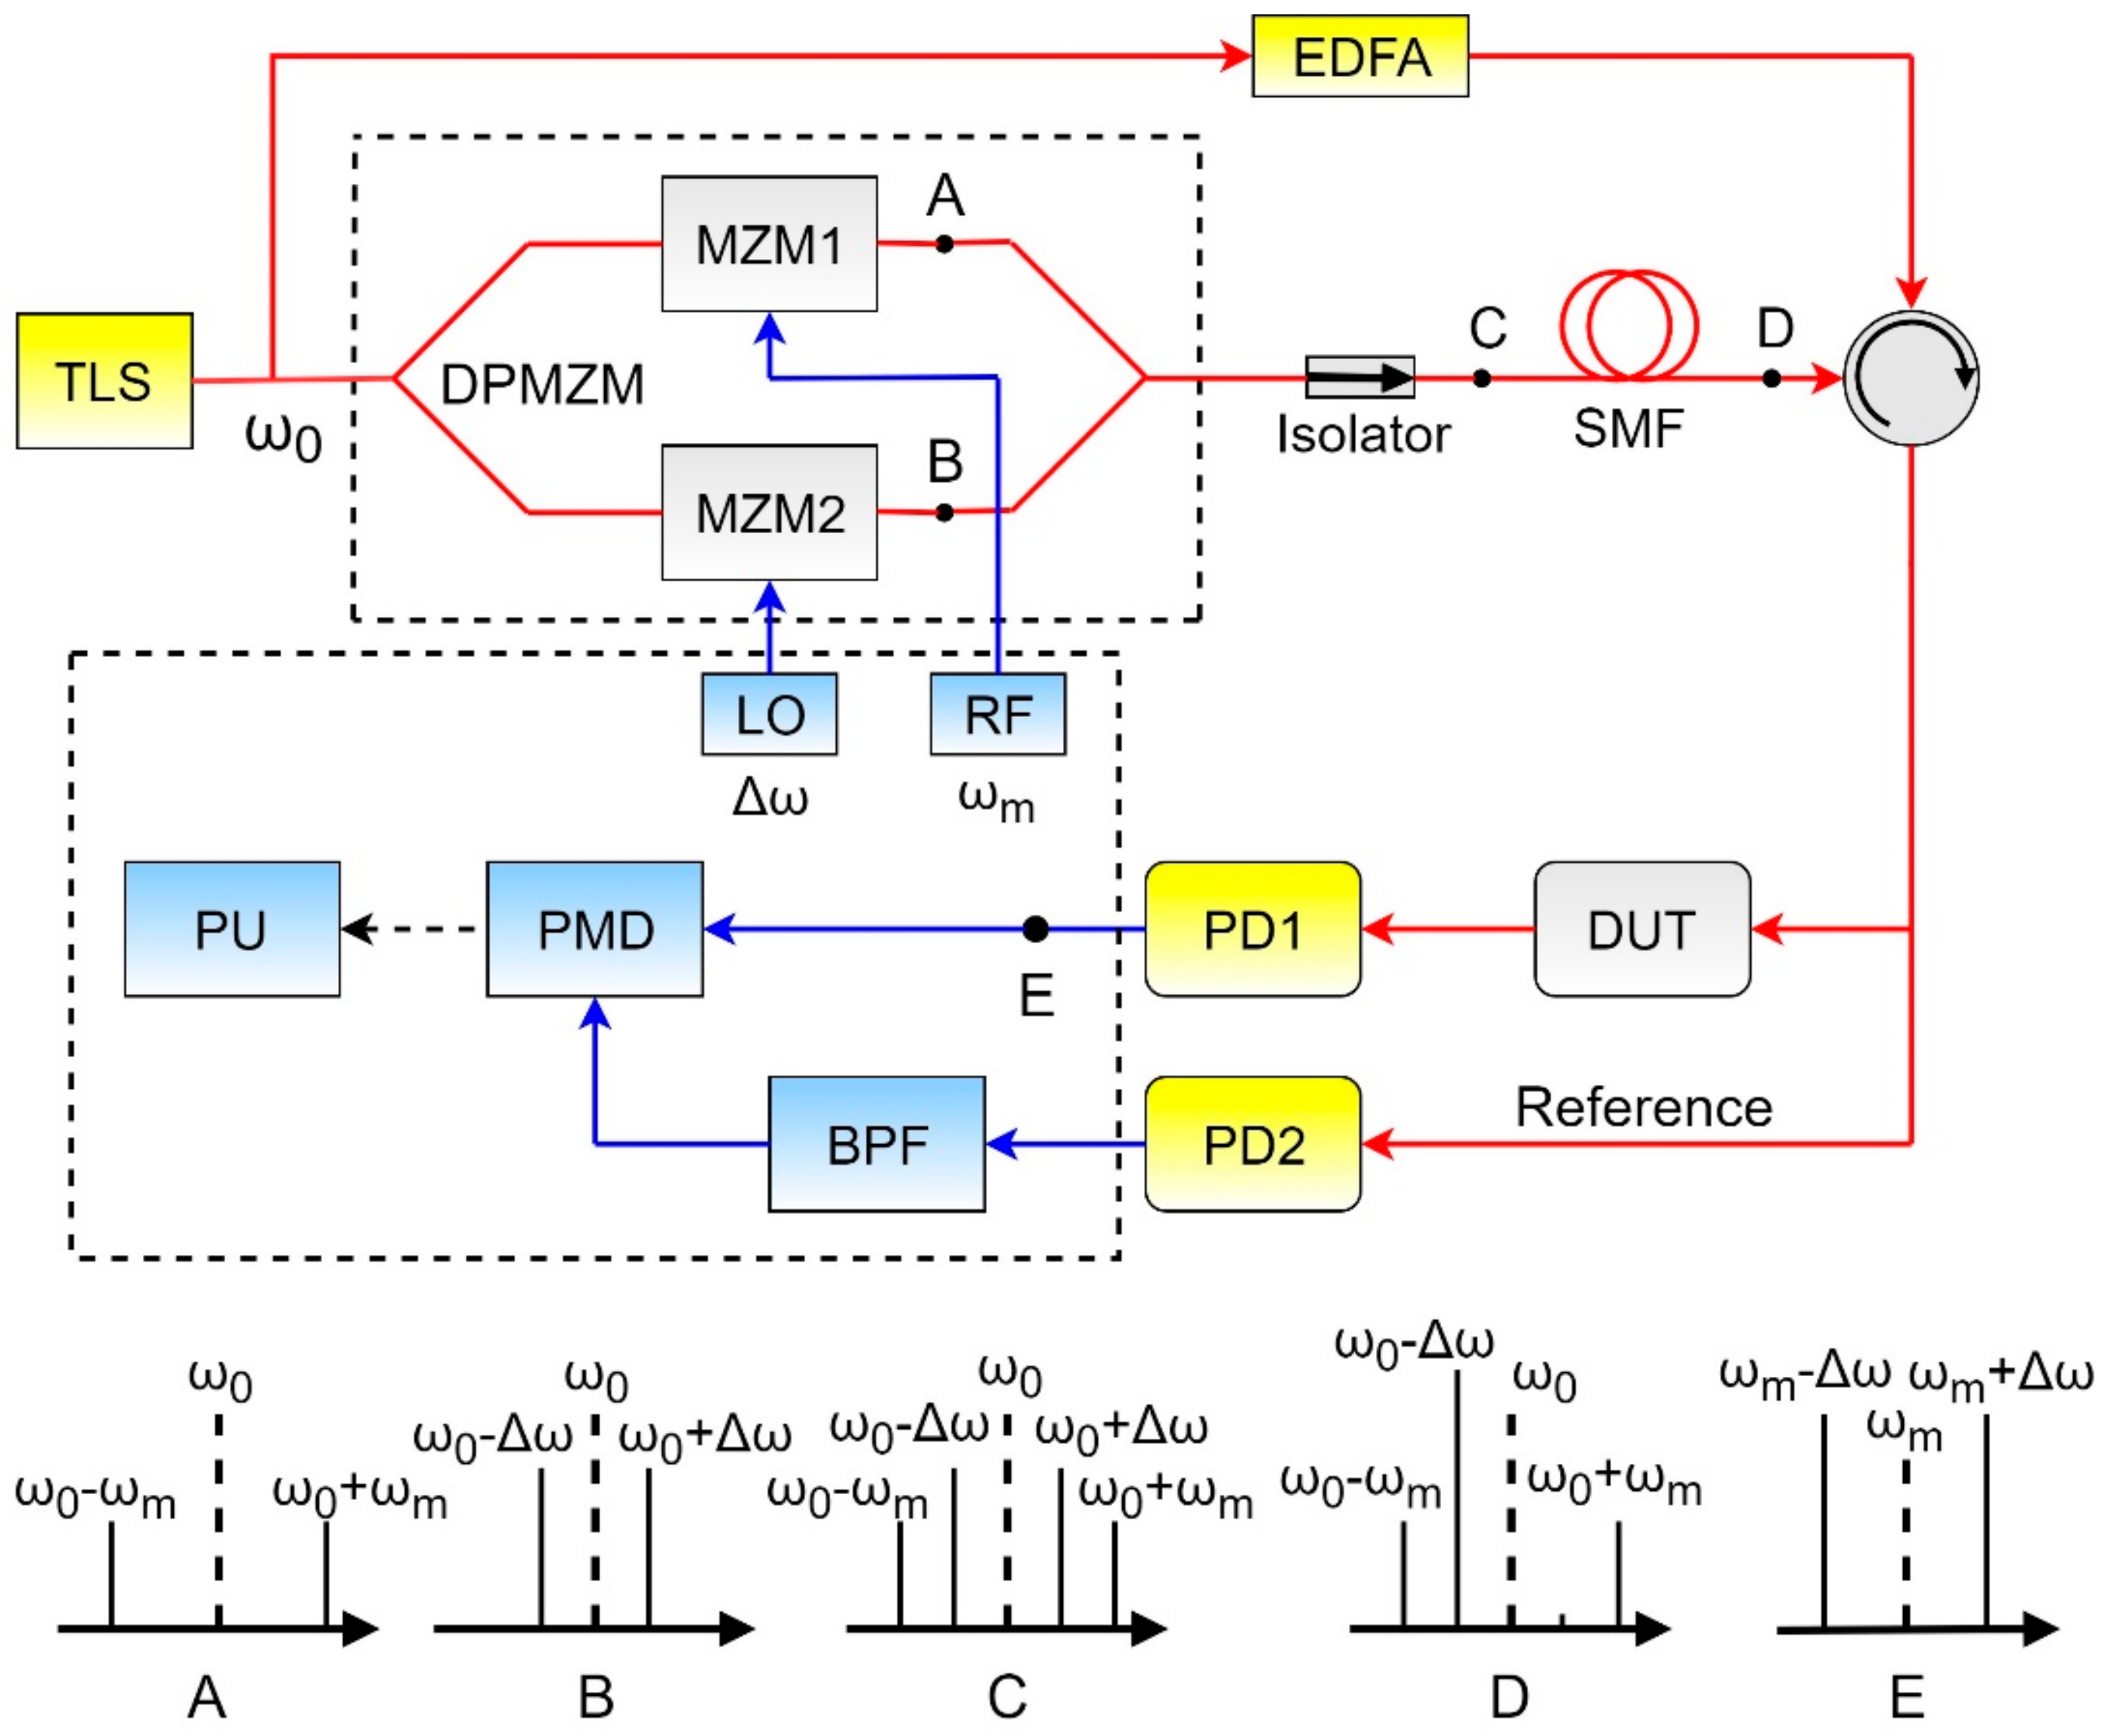
Figure 11.
The block diagram of the asymmetric ODSB-based OVA and PS-FBG: TLS—tunable laser source; DPMZM—dual-parallel Mach–Zehnder modulator; MZM—Mach–Zehnder modulator; RF1—fixed radio frequency; RF2—sweeping radio frequency; SMF—single-mode fiber; PS-FBG—phase-shift fiber Bragg grating; DUT—device under test; PD—photodetector; BPF—bandpass filter; PMD—phase-magnitude detector; PU—processing unit (adapted from [33,34]).
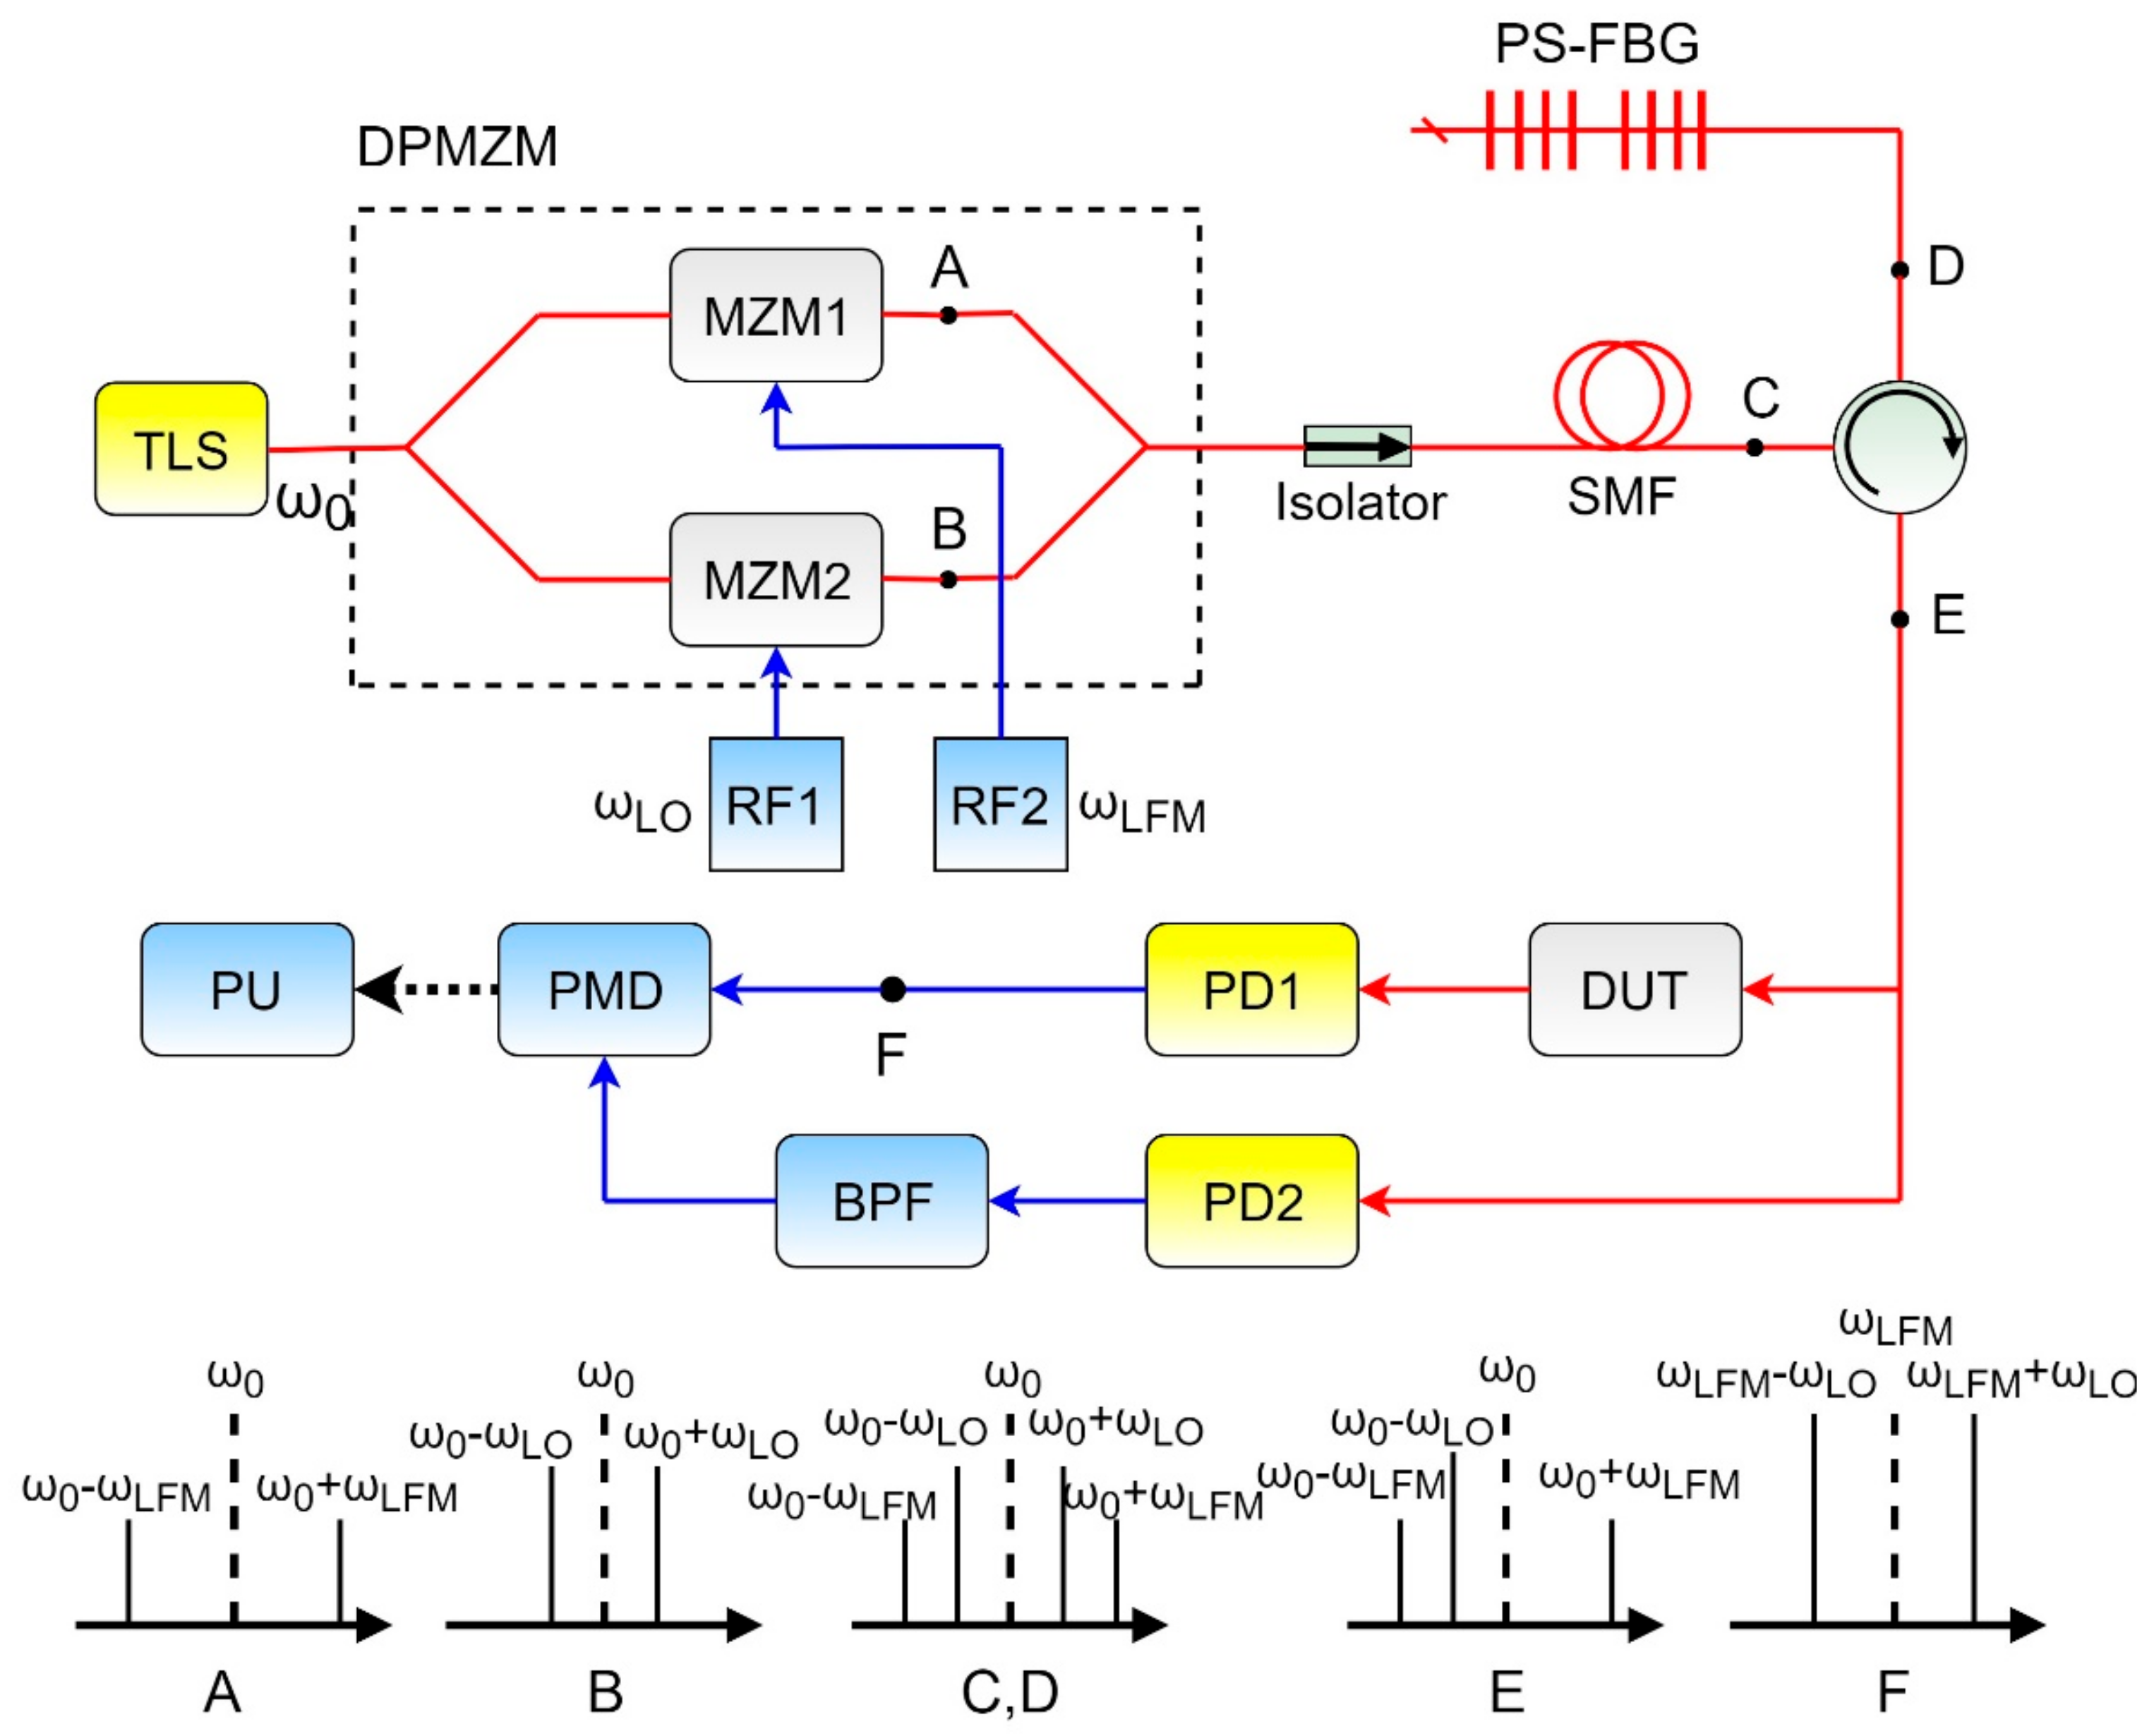
Figure 12.
(a) The magnitude and (b) the phase responses of the FBG under test; red line—measured by proposed OVA; blue line—measured by optical spectrum analyzer [33,34] © 2019 SPIE
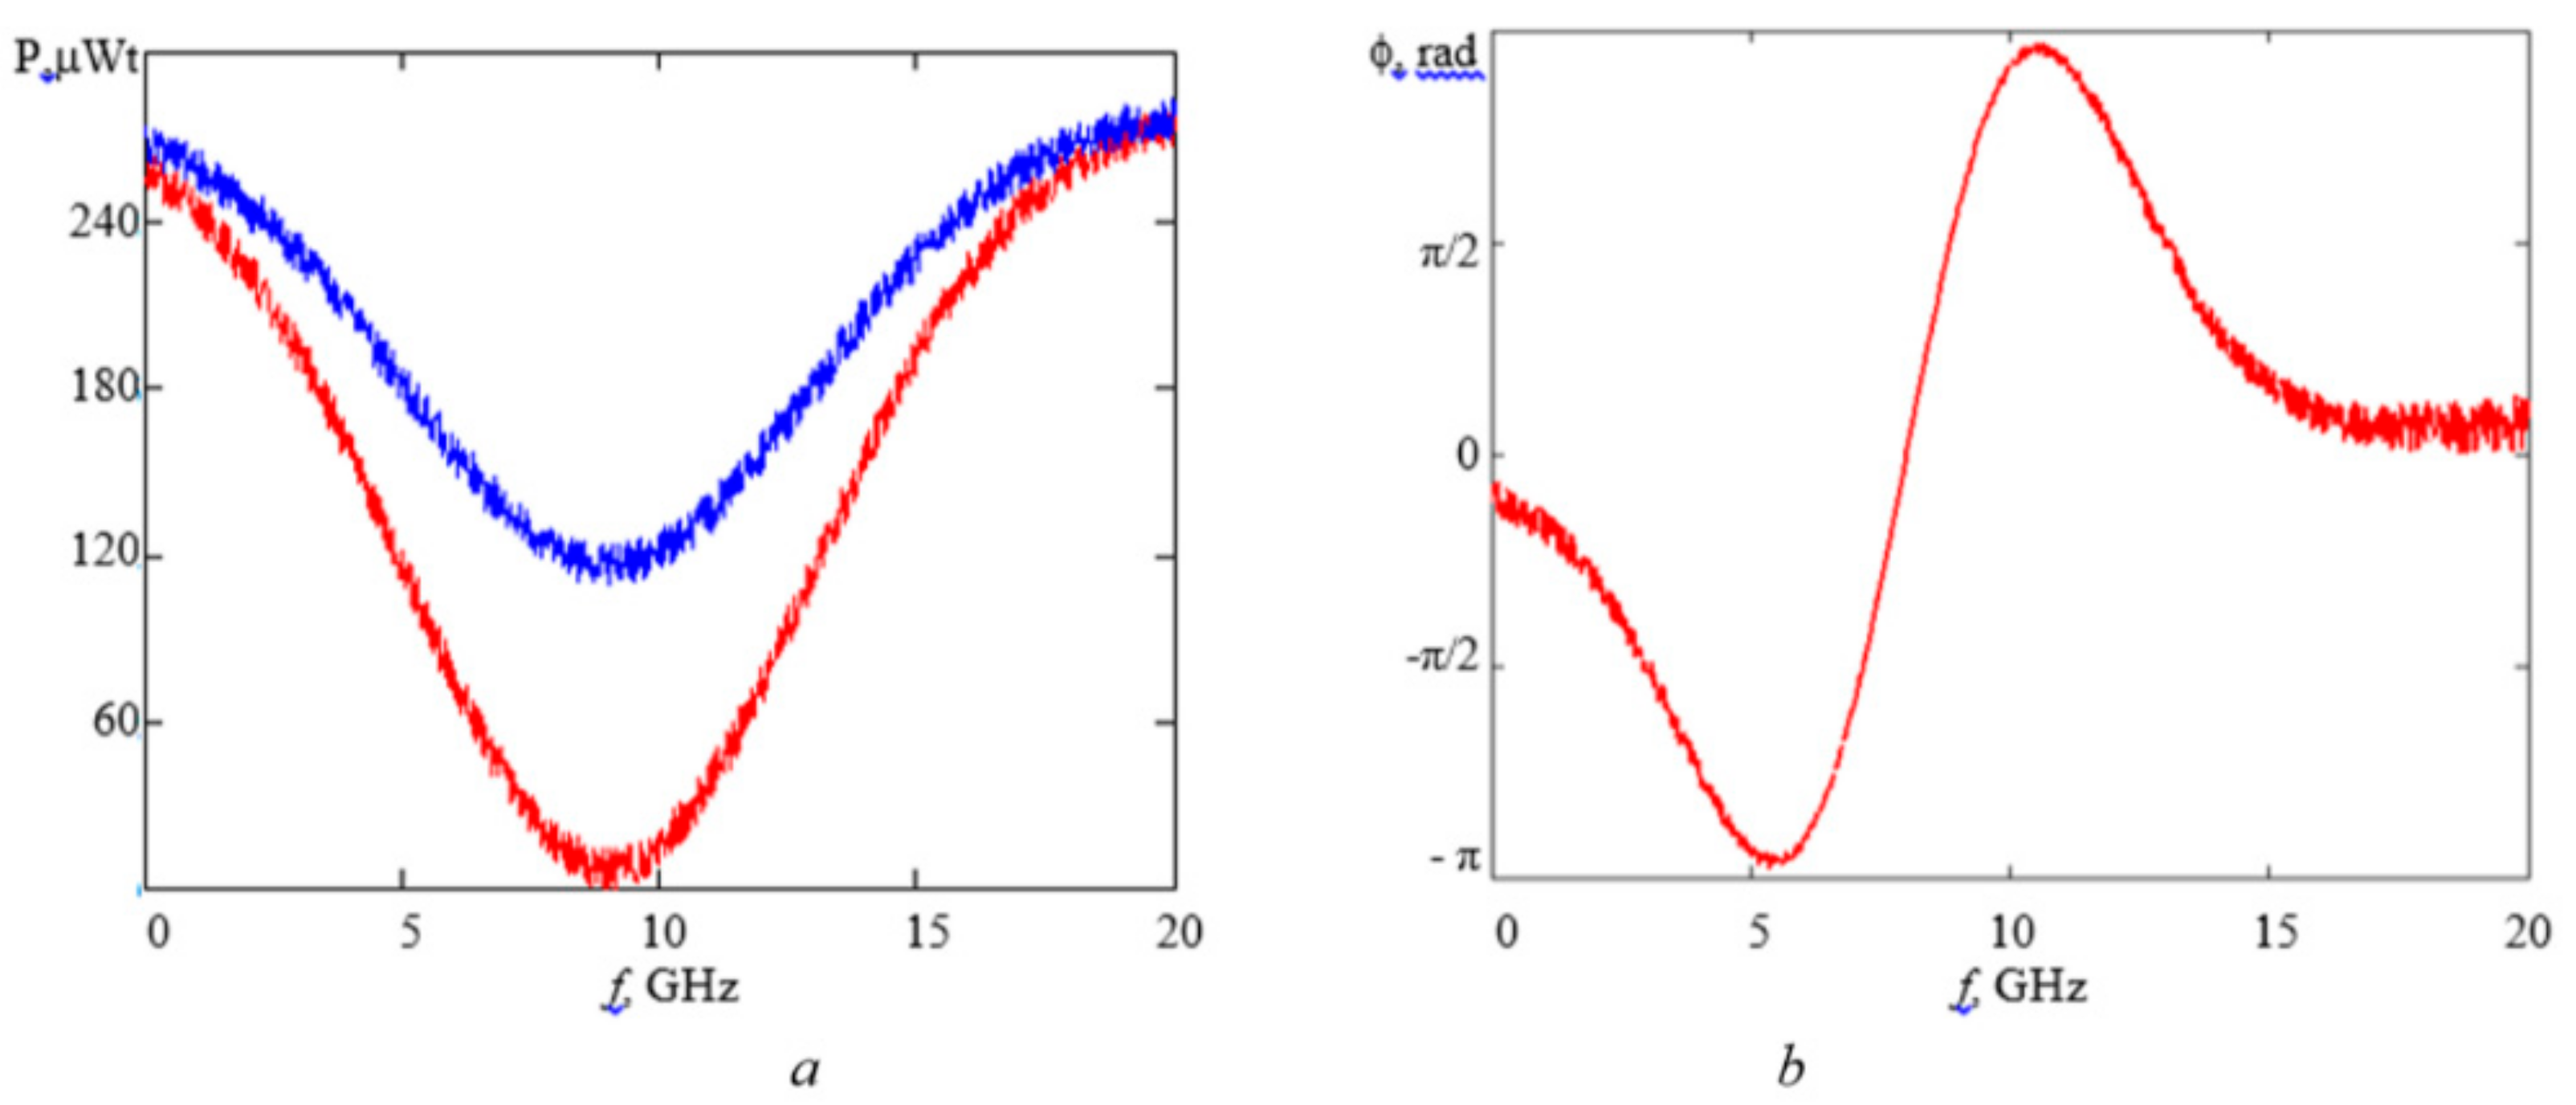
Figure 13.
Characteristics of the PS-FBG (a) in optical range and (b) in radiofrequency range [33,34] © 2019 SPIE
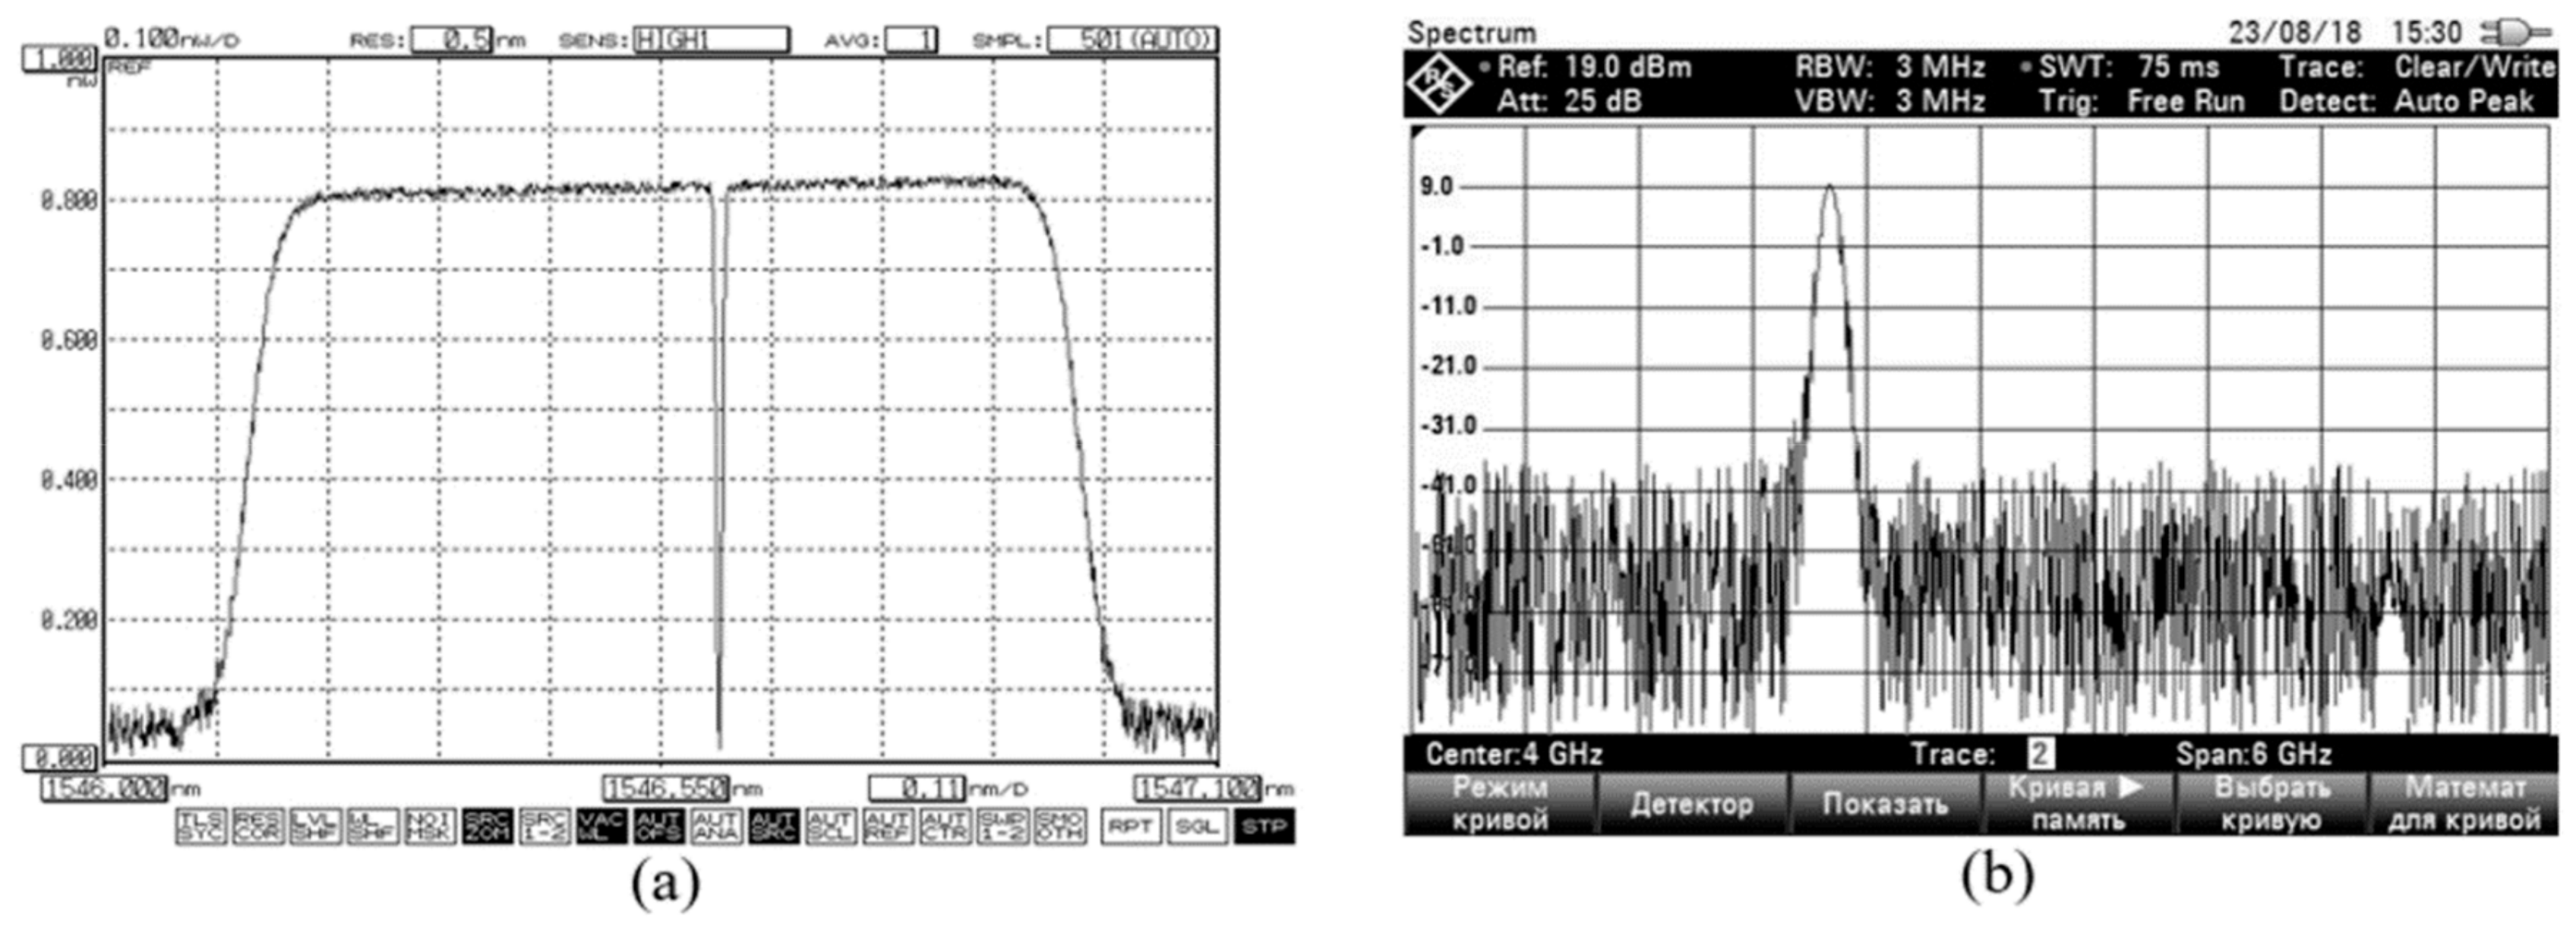
Figure 14.
TLS—tunable laser source; RF1—Scanning Radio Frequency; ODSB-SC—ODSB-signal with suppressed carrier; RF2—fixed-frequency generator; 90° HC—90° hybrid coupler; OBPF—optical bandpass filter; OSSB—OSSB-modulator; SMF—single-mode fiber; RC—reference channel; ODUT—optical device under test; PD—photodetector; ELPF—electrical low-pass filter; EBPF—electrical band-pass filter; PMD—phase-magnitude detector; PU—processing unit. (adapted from [35]).
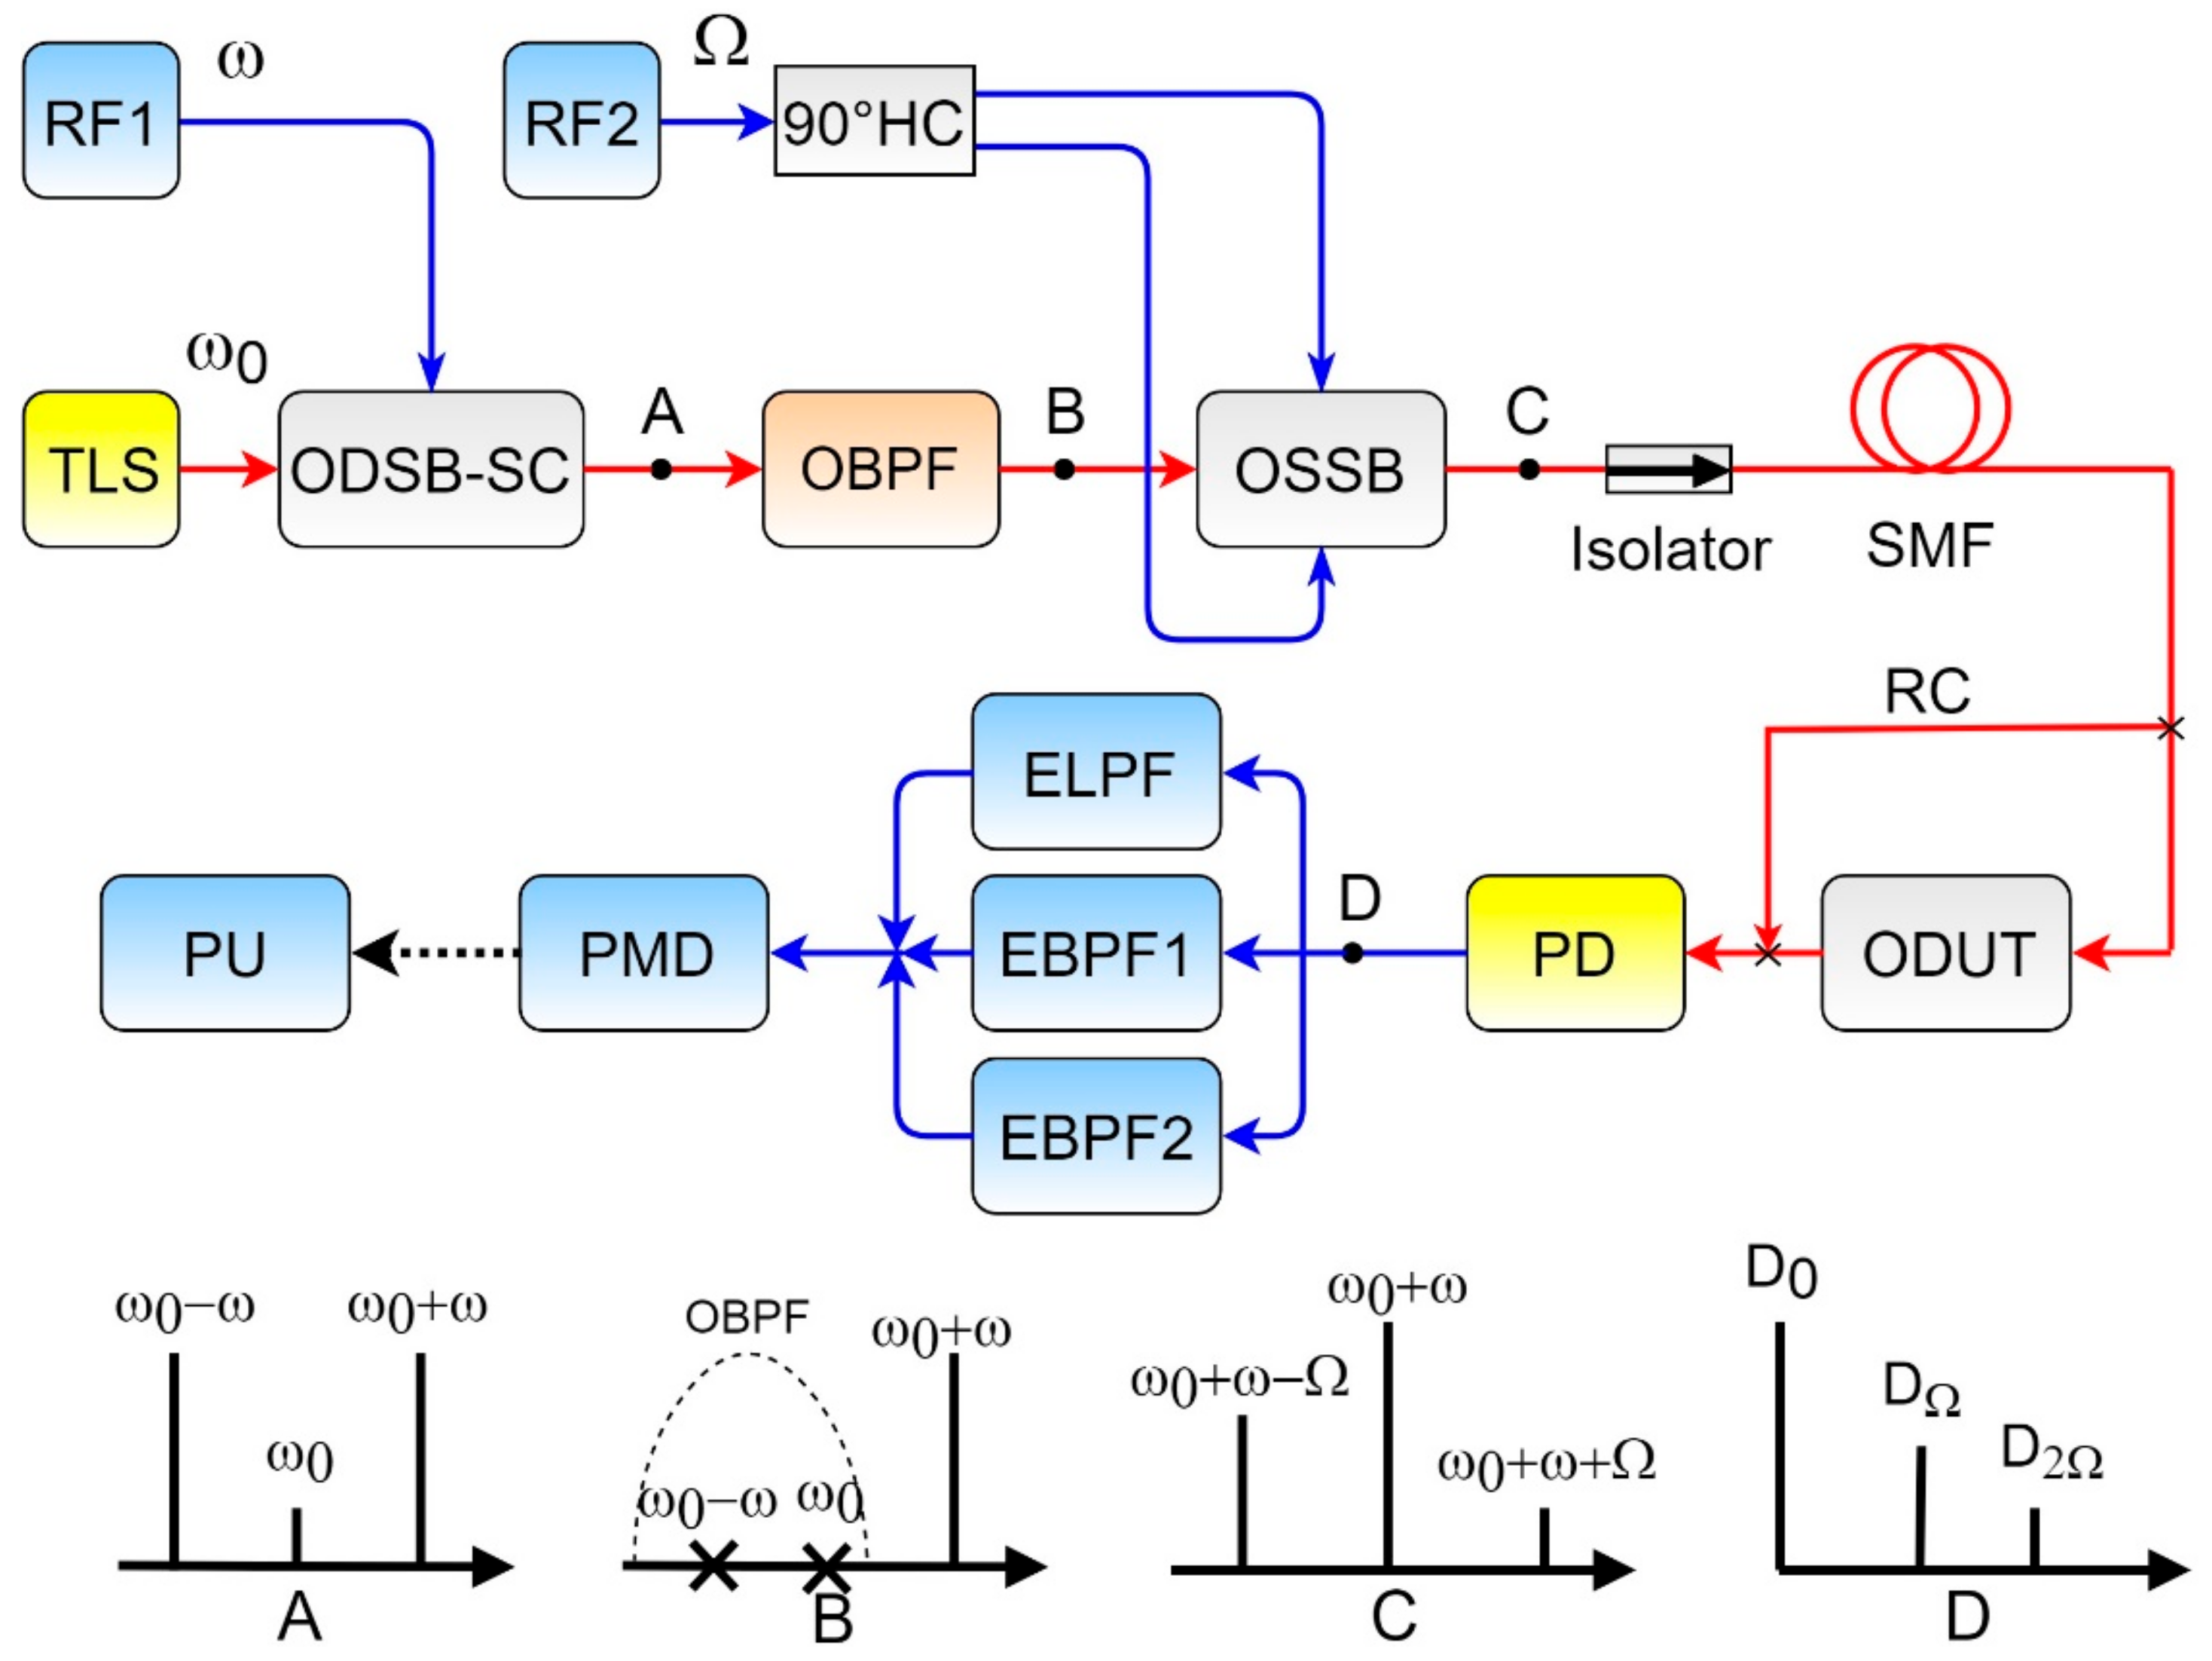
Figure 15.
Fulfillment of the criterion for the signal to fall within the limits of the studied [35] © 2019 ITM Web of Conferences
Figure 15.
Fulfillment of the criterion for the signal to fall within the limits of the studied [35] © 2019 ITM Web of Conferences
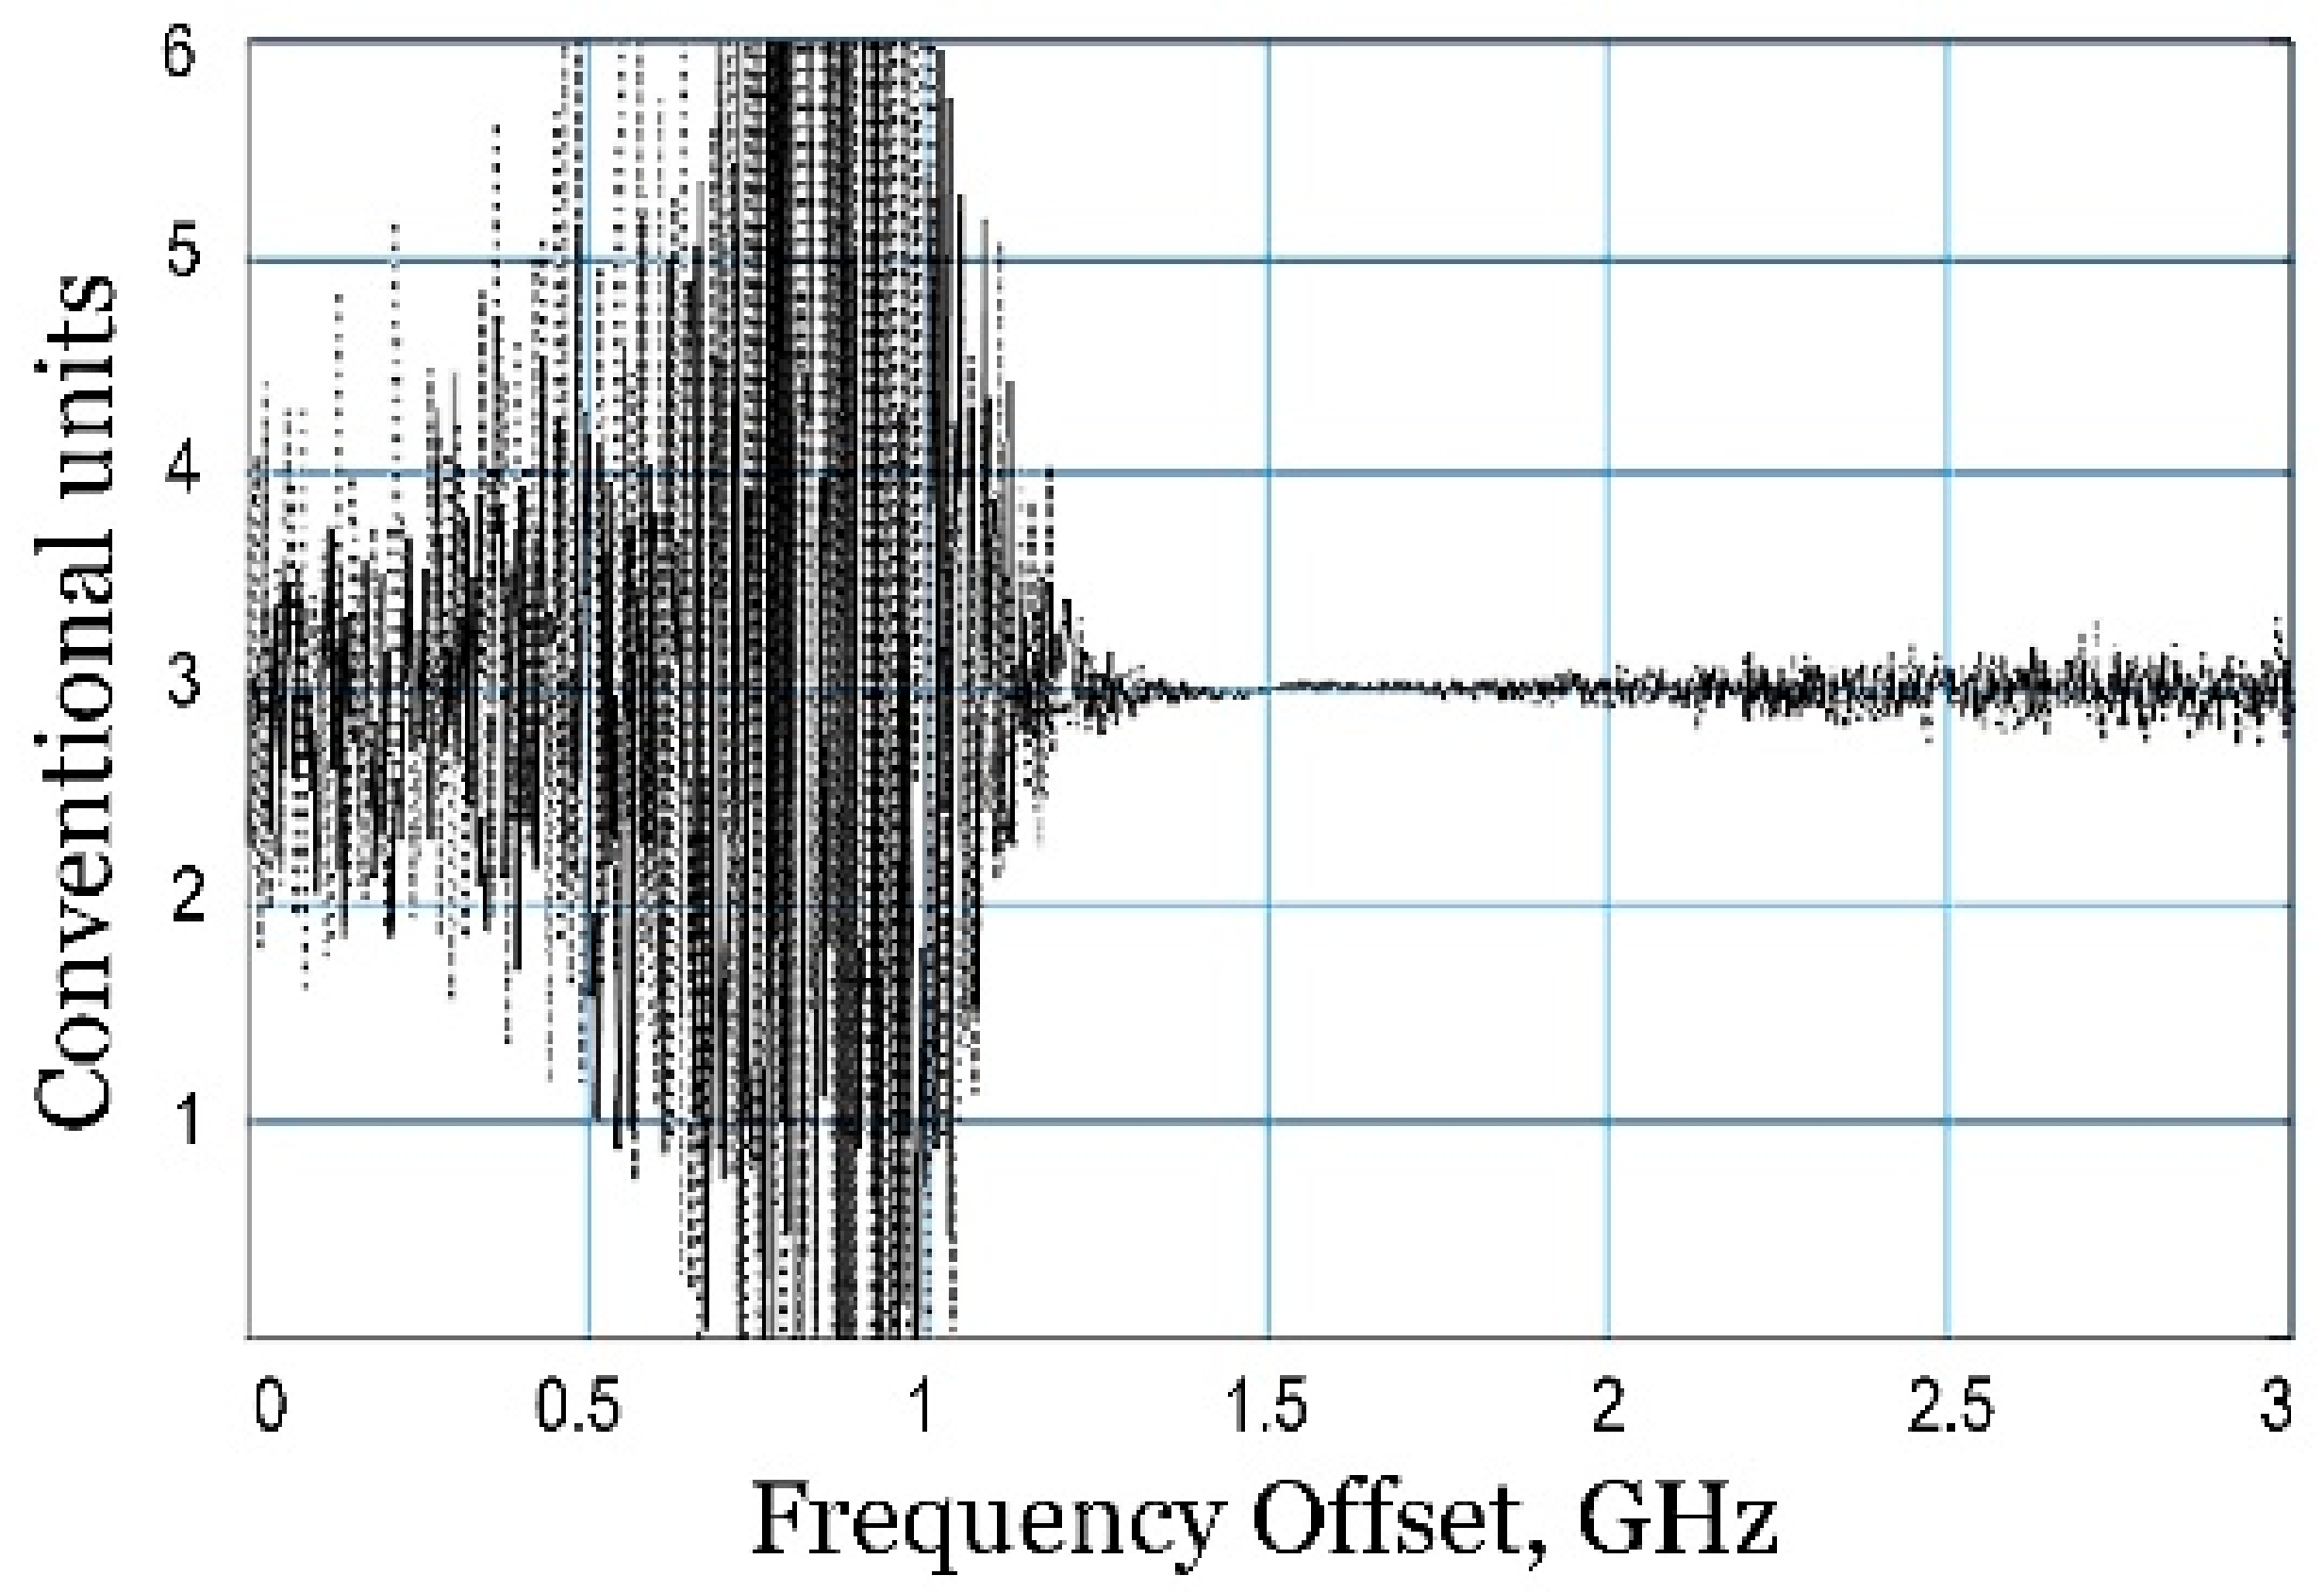
Figure 16.
The measured magnitude (black line) and phase (red line) responses of the Fano resonance [35] © 2019 ITM Web of Conferences.
Figure 16.
The measured magnitude (black line) and phase (red line) responses of the Fano resonance [35] © 2019 ITM Web of Conferences.
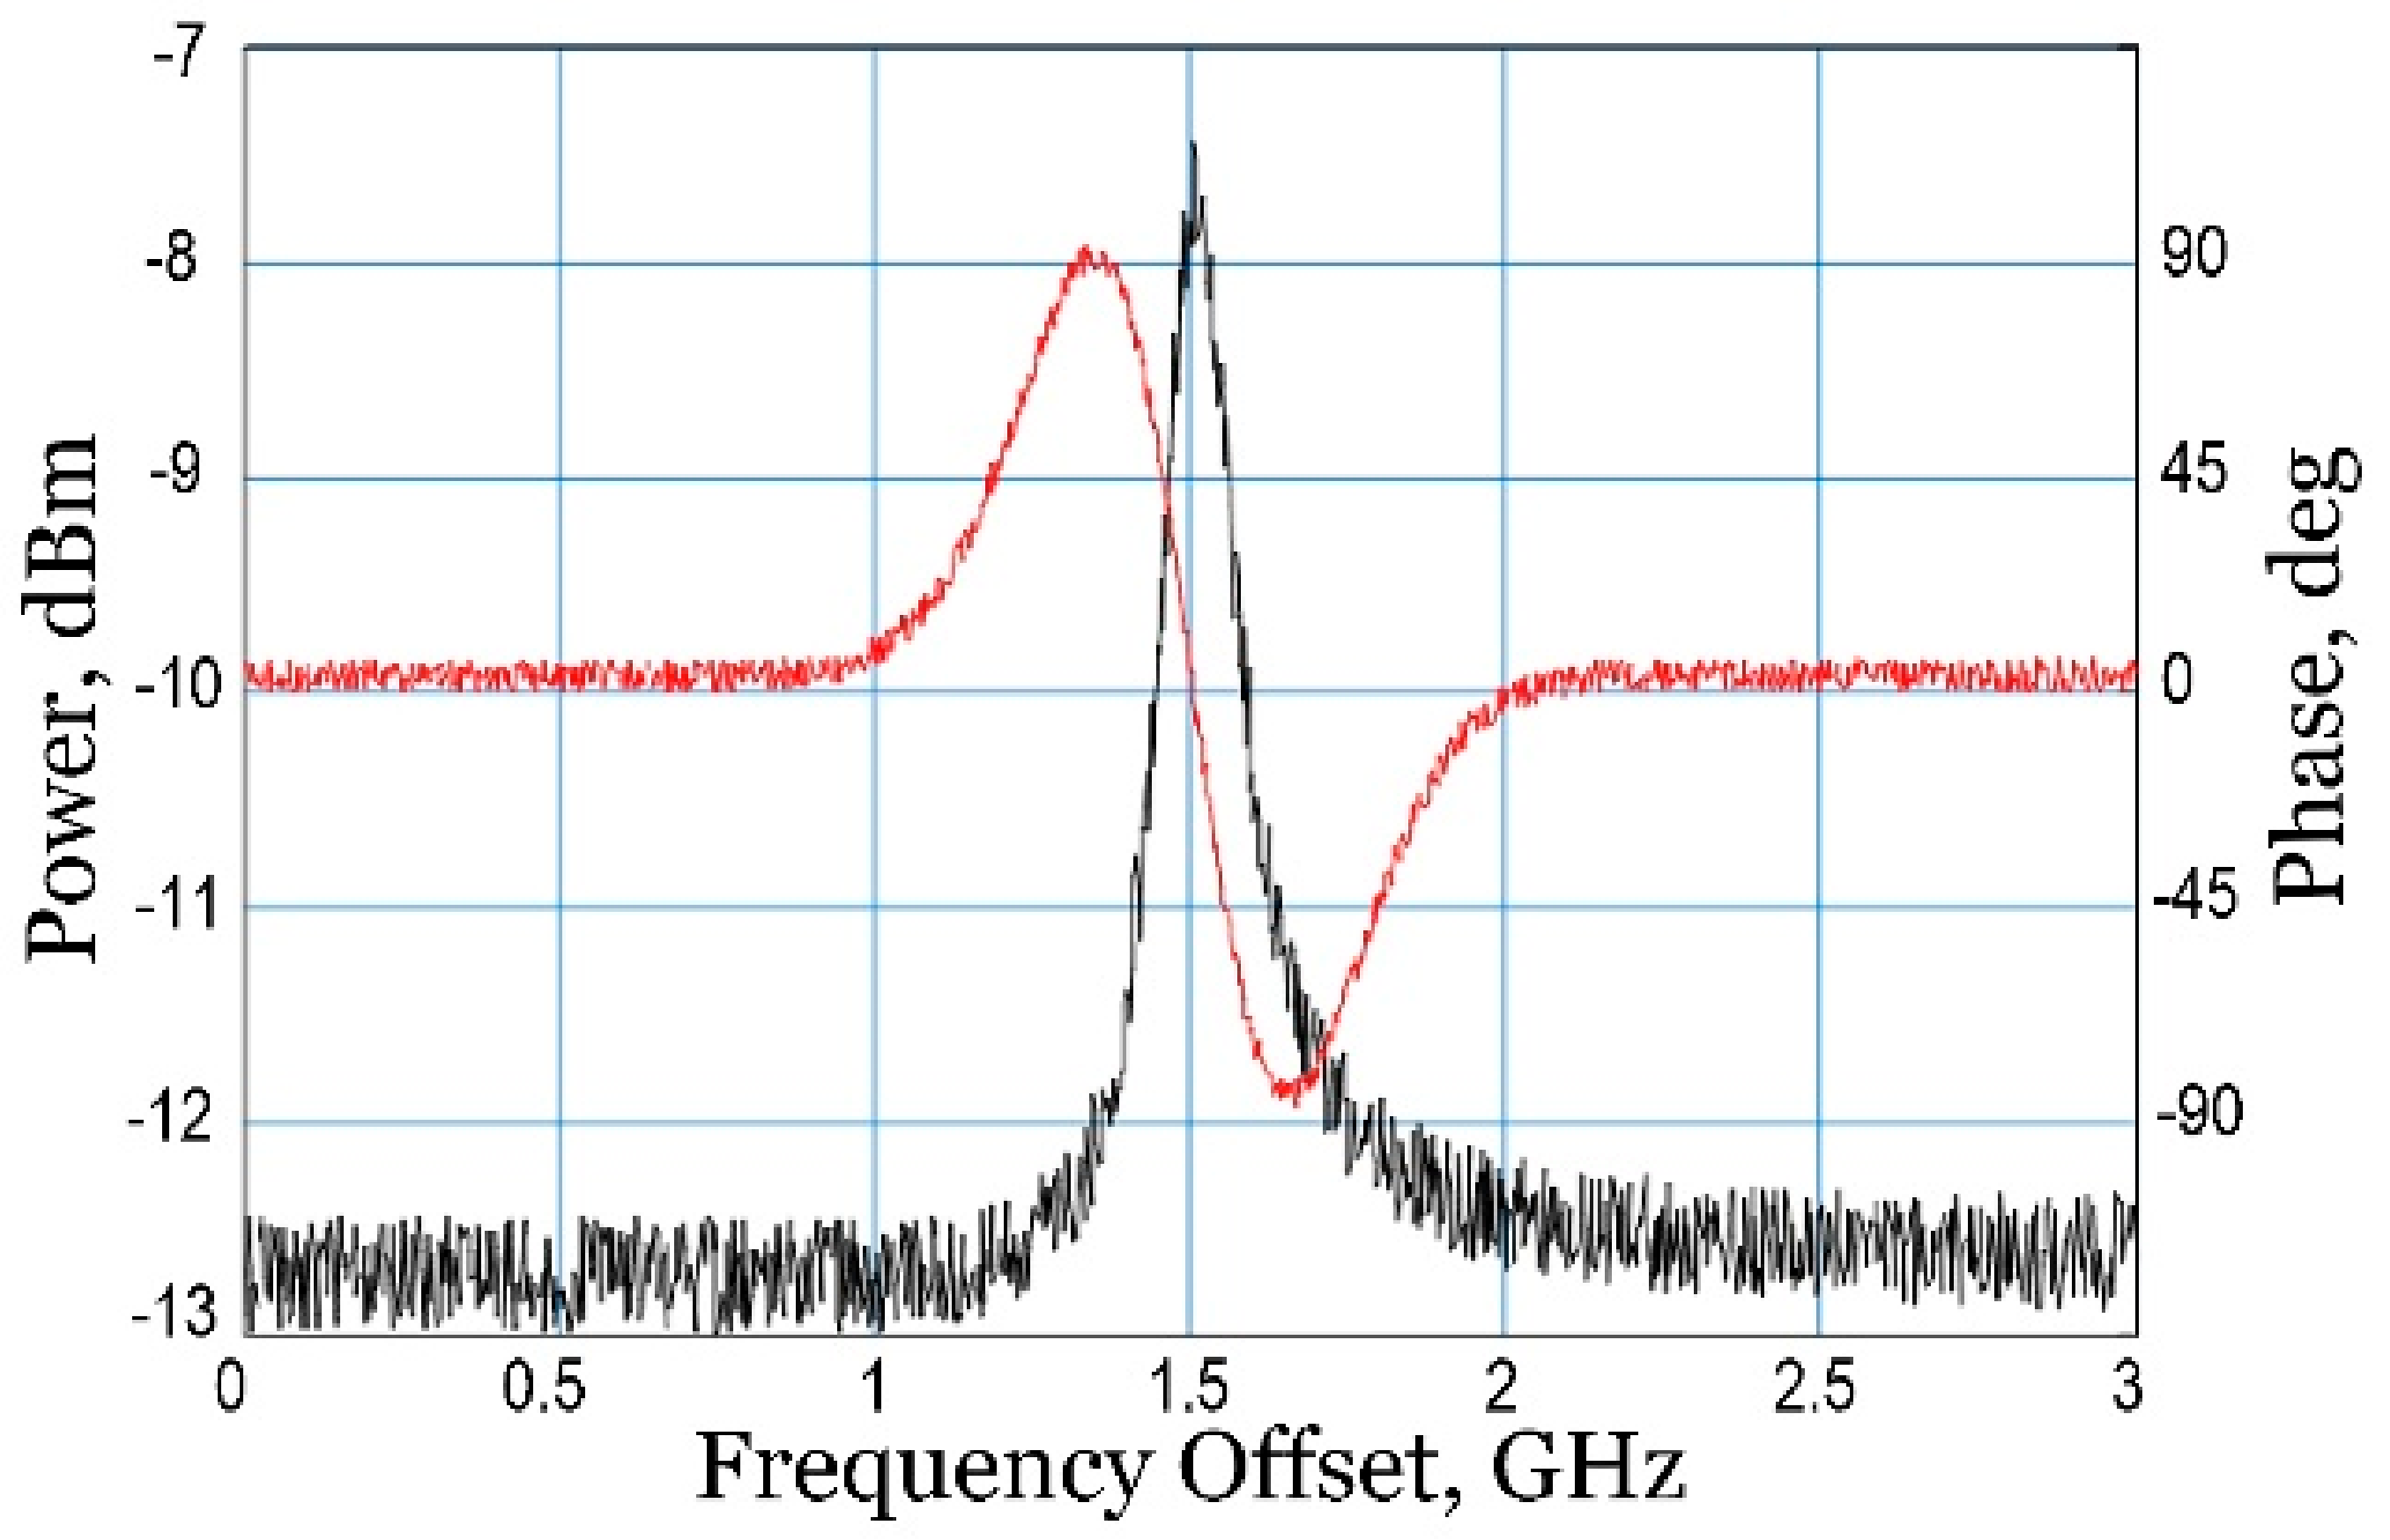
Figure 17.
The model of described OVAs.
© 2020 by the authors. Licensee MDPI, Basel, Switzerland. This article is an open access article distributed under the terms and conditions of the Creative Commons Attribution (CC BY) license (http://creativecommons.org/licenses/by/4.0/).
Share and Cite
MDPI and ACS Style
Morozov, O.; Nureev, I.; Sakhabutdinov, A.; Kuznetsov, A.; Morozov, G.; Il’in, G.; Papazyan, S.; Ivanov, A.; Ponomarev, R. Ultrahigh-Resolution Optical Vector Analyzers. Photonics 2020, 7, 14. https://doi.org/10.3390/photonics7010014
AMA Style
Morozov O, Nureev I, Sakhabutdinov A, Kuznetsov A, Morozov G, Il’in G, Papazyan S, Ivanov A, Ponomarev R. Ultrahigh-Resolution Optical Vector Analyzers. Photonics. 2020; 7(1):14. https://doi.org/10.3390/photonics7010014
Chicago/Turabian StyleMorozov, Oleg, Ilnur Nureev, Airat Sakhabutdinov, Artem Kuznetsov, Gennady Morozov, German Il’in, Samvel Papazyan, Alexander Ivanov, and Roman Ponomarev. 2020. "Ultrahigh-Resolution Optical Vector Analyzers" Photonics 7, no. 1: 14. https://doi.org/10.3390/photonics7010014
Note that from the first issue of 2016, this journal uses article numbers instead of page numbers. See further details here.