Quantitative Analysis of 4 × 4 Mueller Matrix Transformation Parameters for Biomedical Imaging

 , and
, and 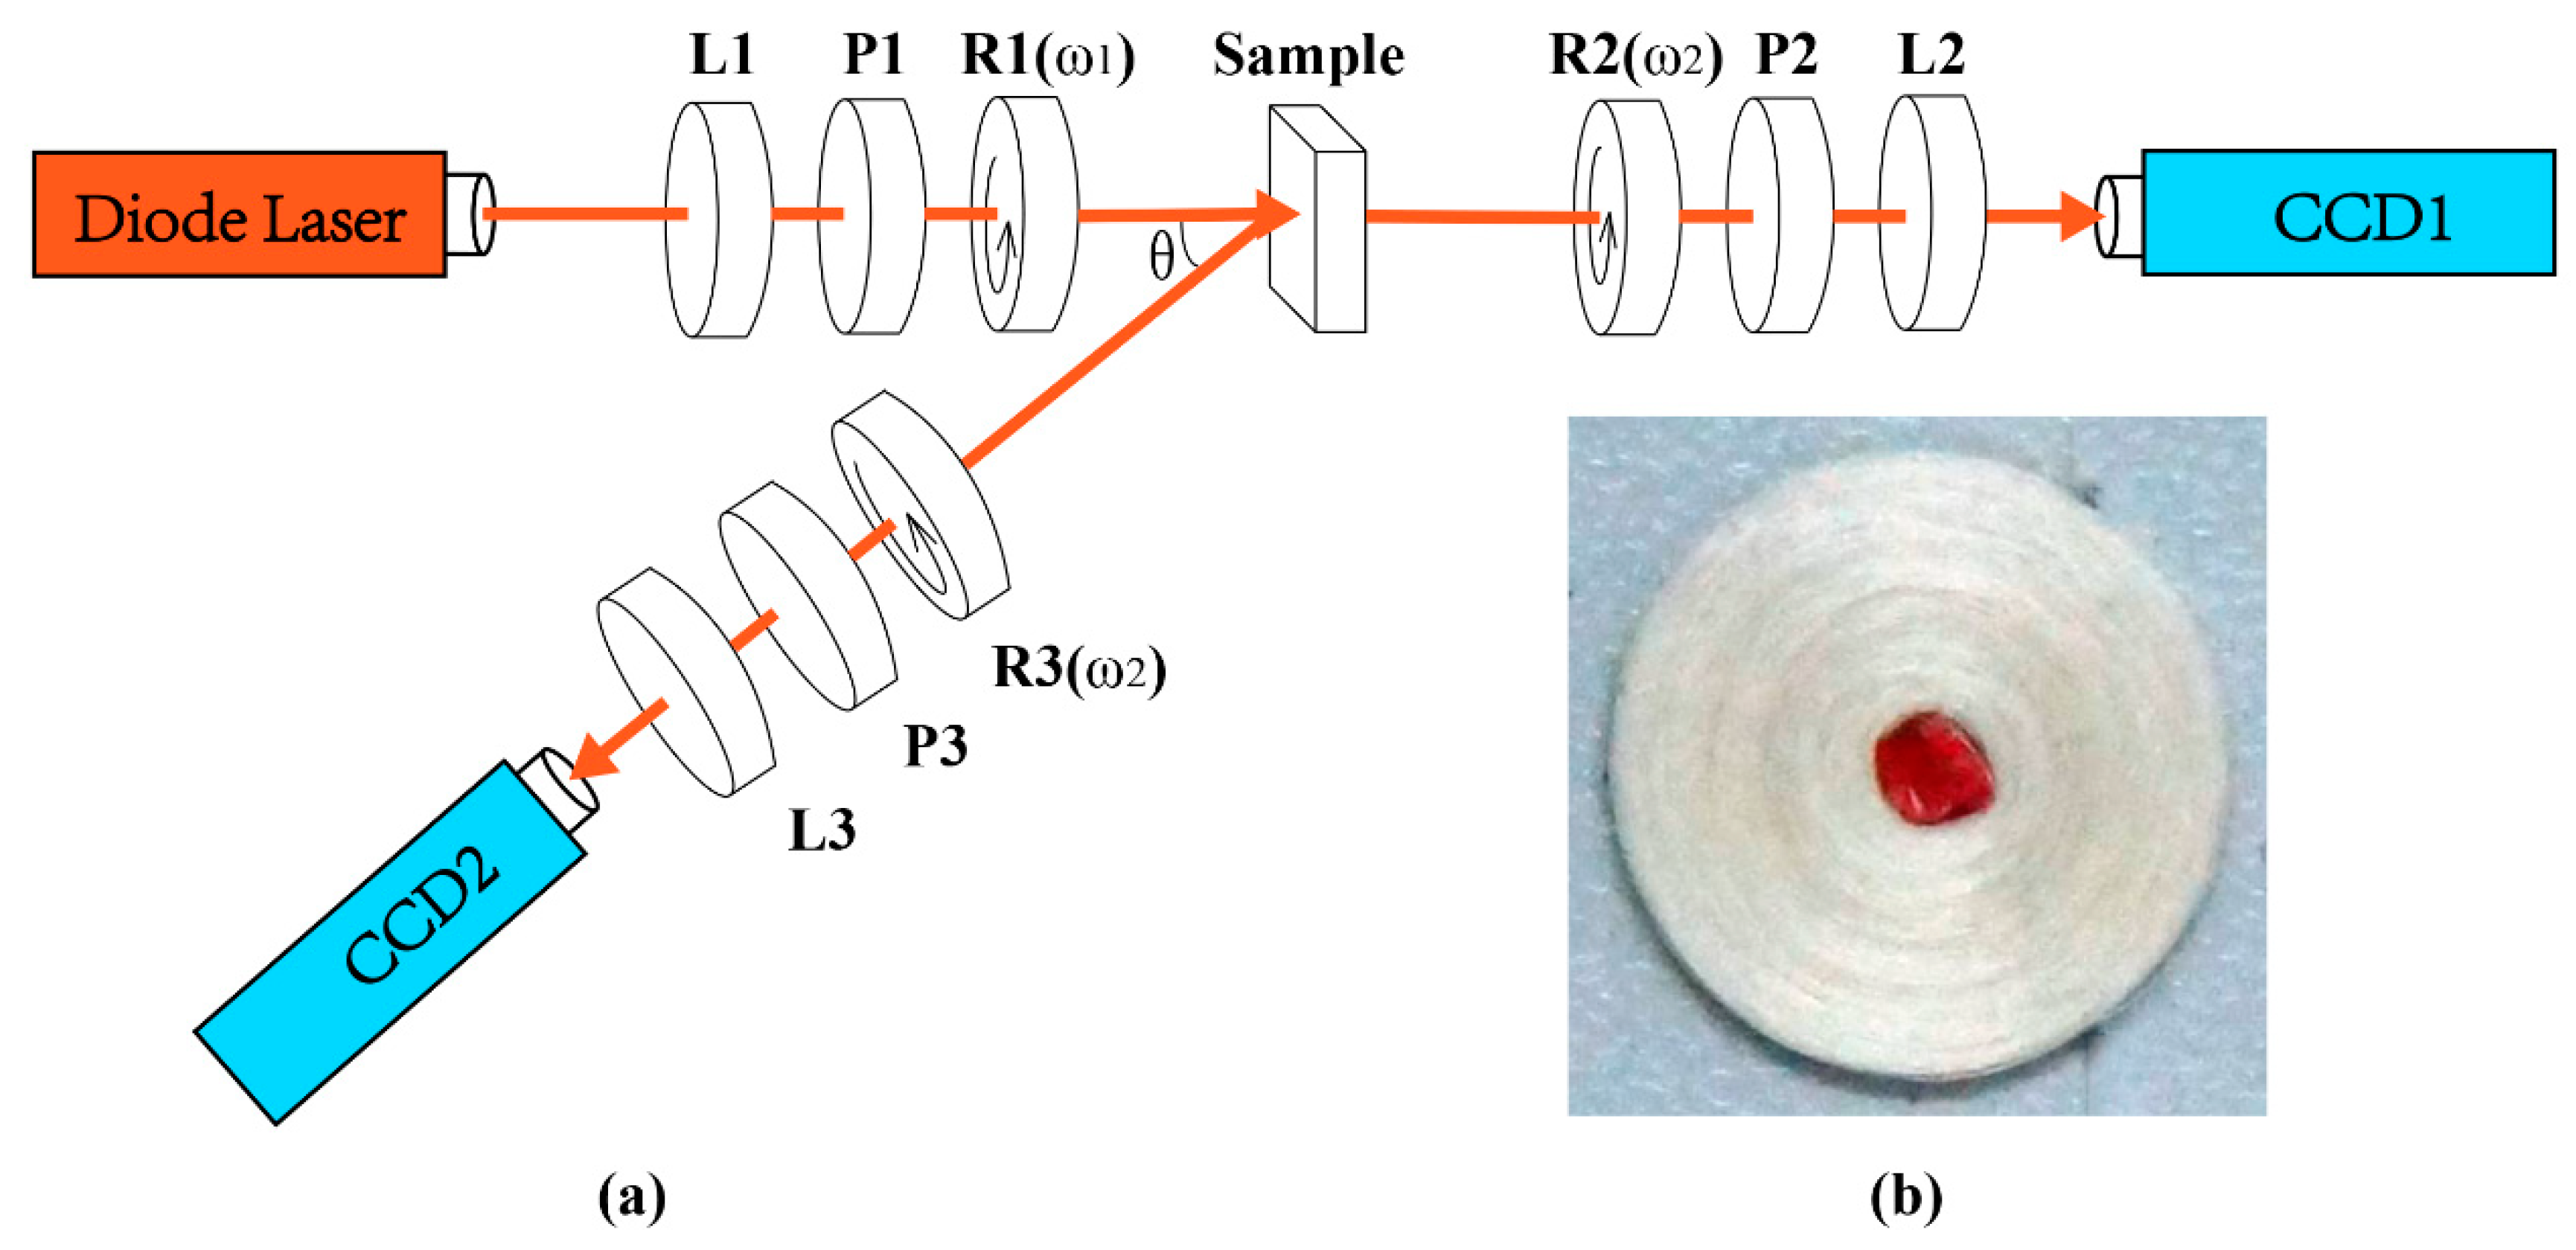
Abstract
:1. Introduction
2. Methods and Materials
2.1. Experimental Setup and Materials
2.2. Mueller Matrix Polar Decomposition (MMPD) and Mueller Matrix Transformation (MMT) Parameters
2.3. Monte Carlo Simulation and Evaluation Indicators
3. Results and Discussion
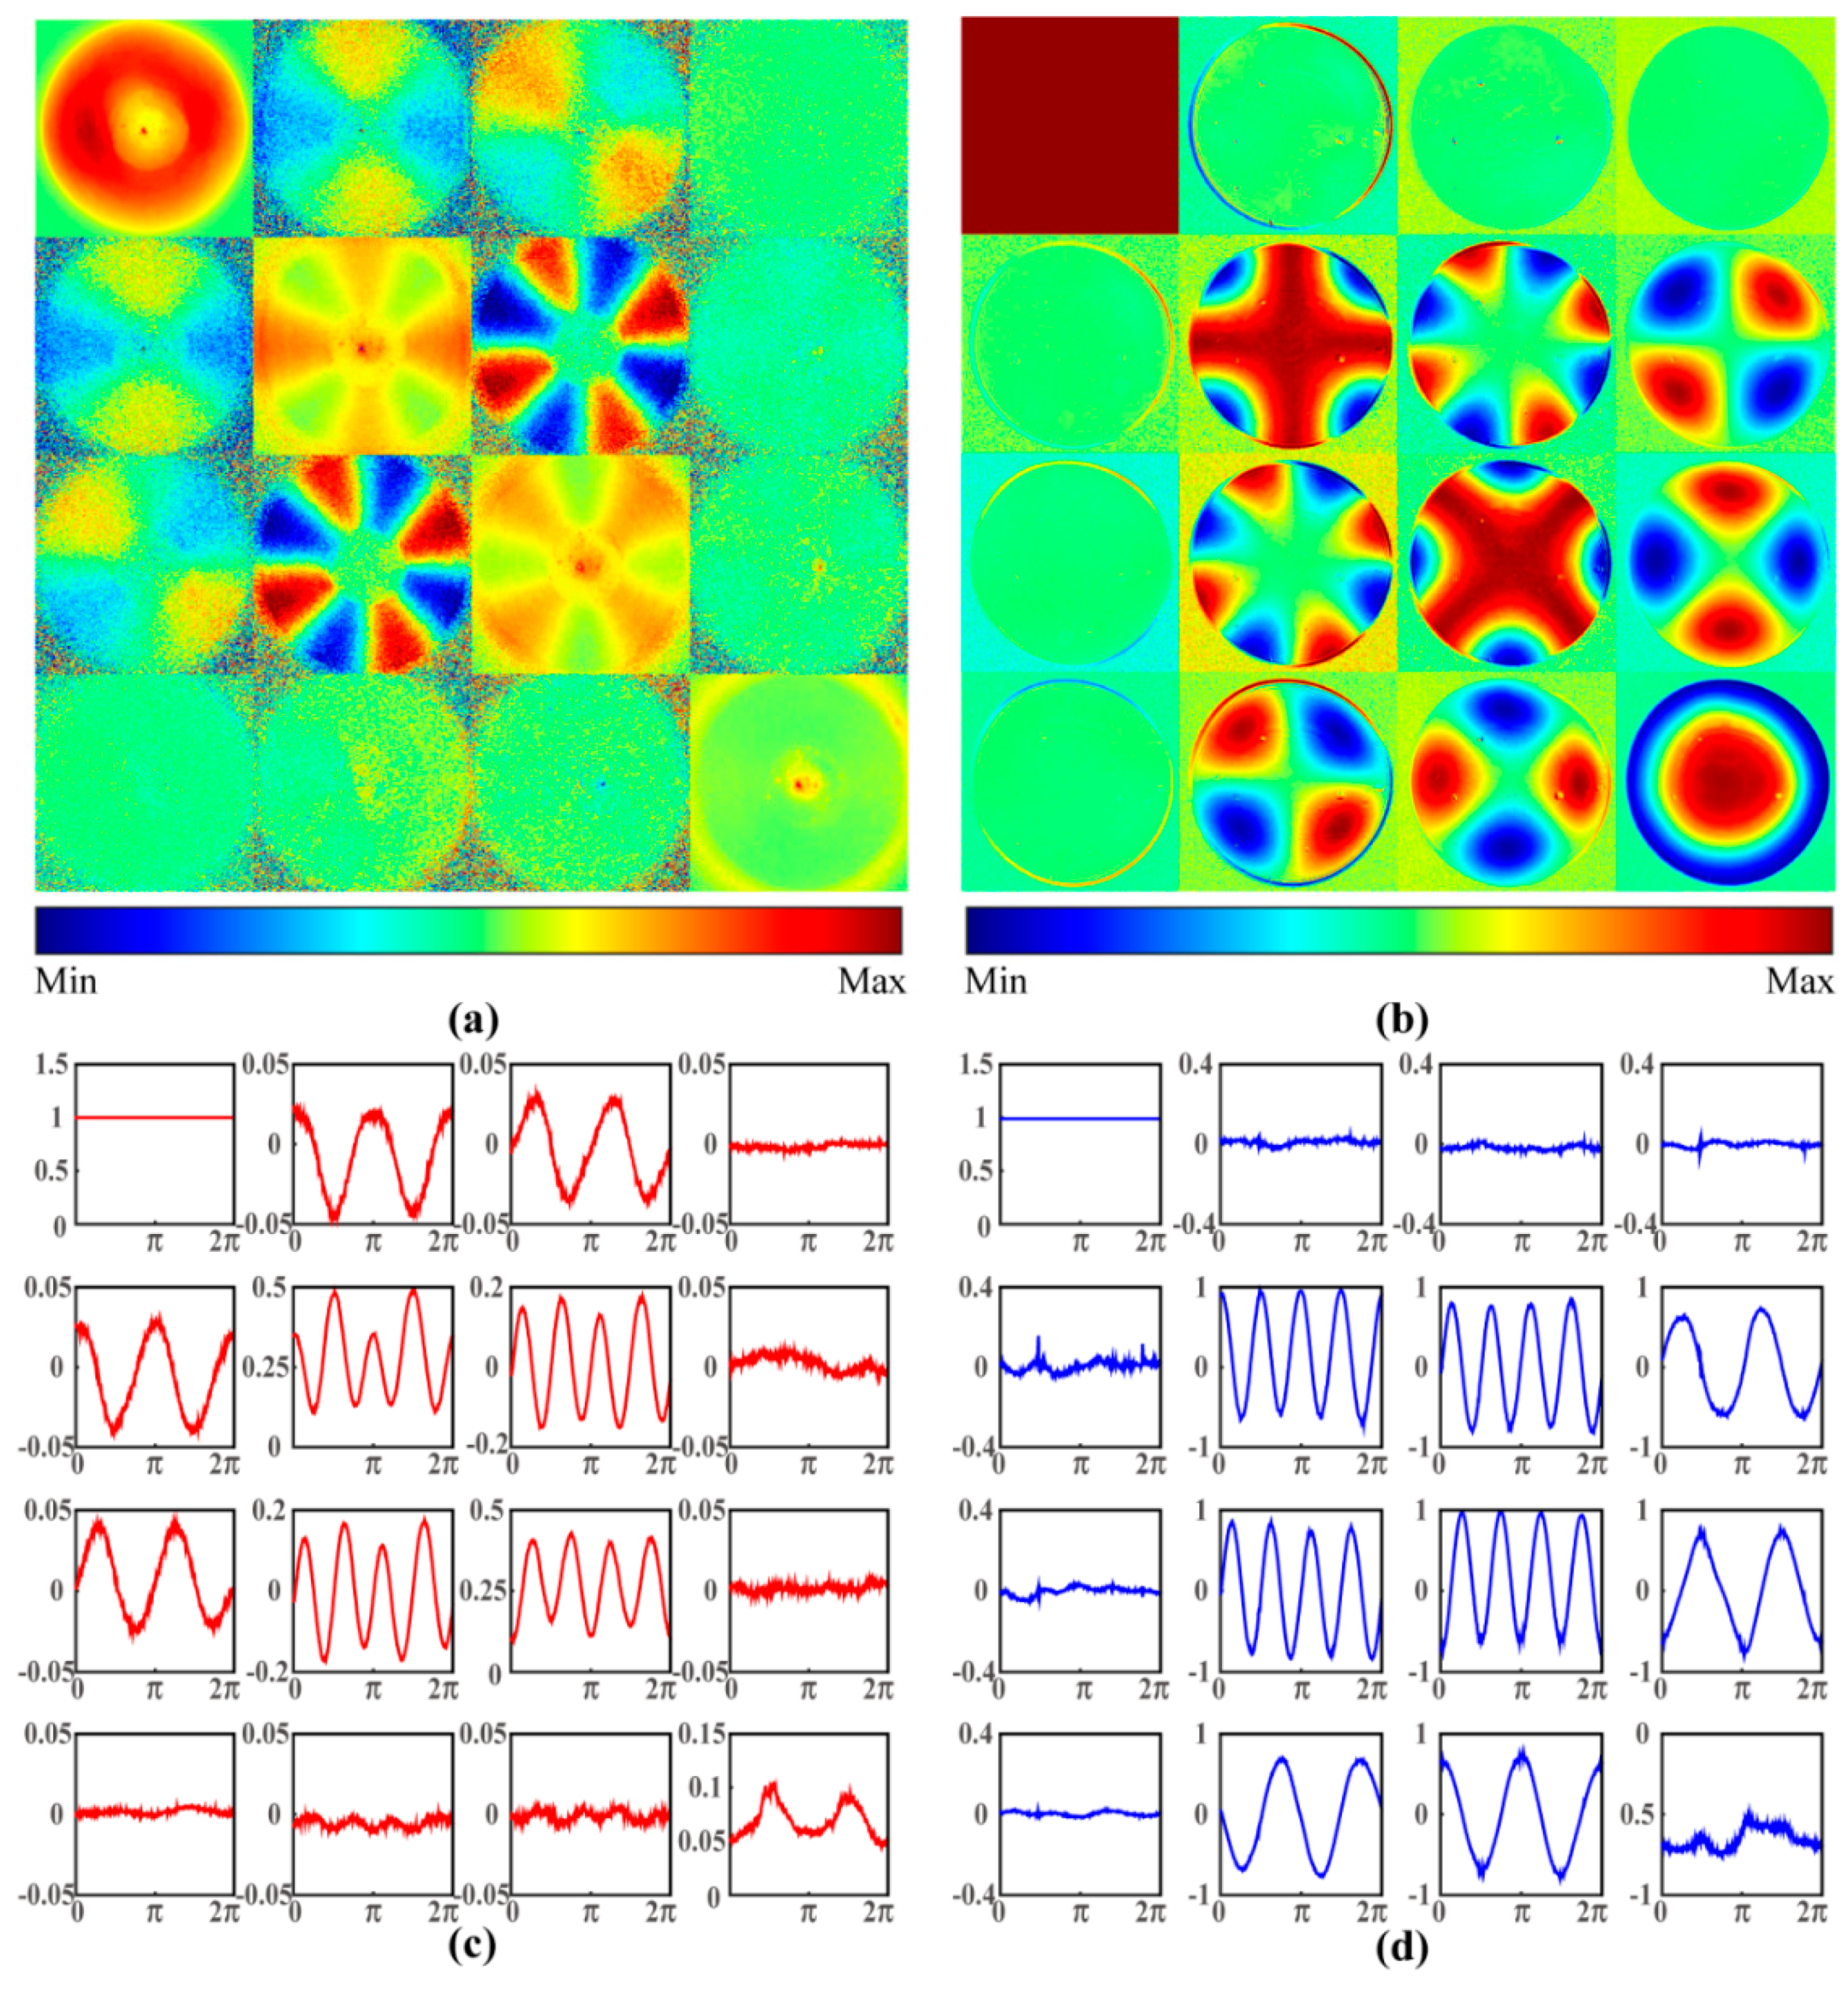
3.1. Comparison between the Mueller Matrices of the Silk Phantom and GRIN Lens
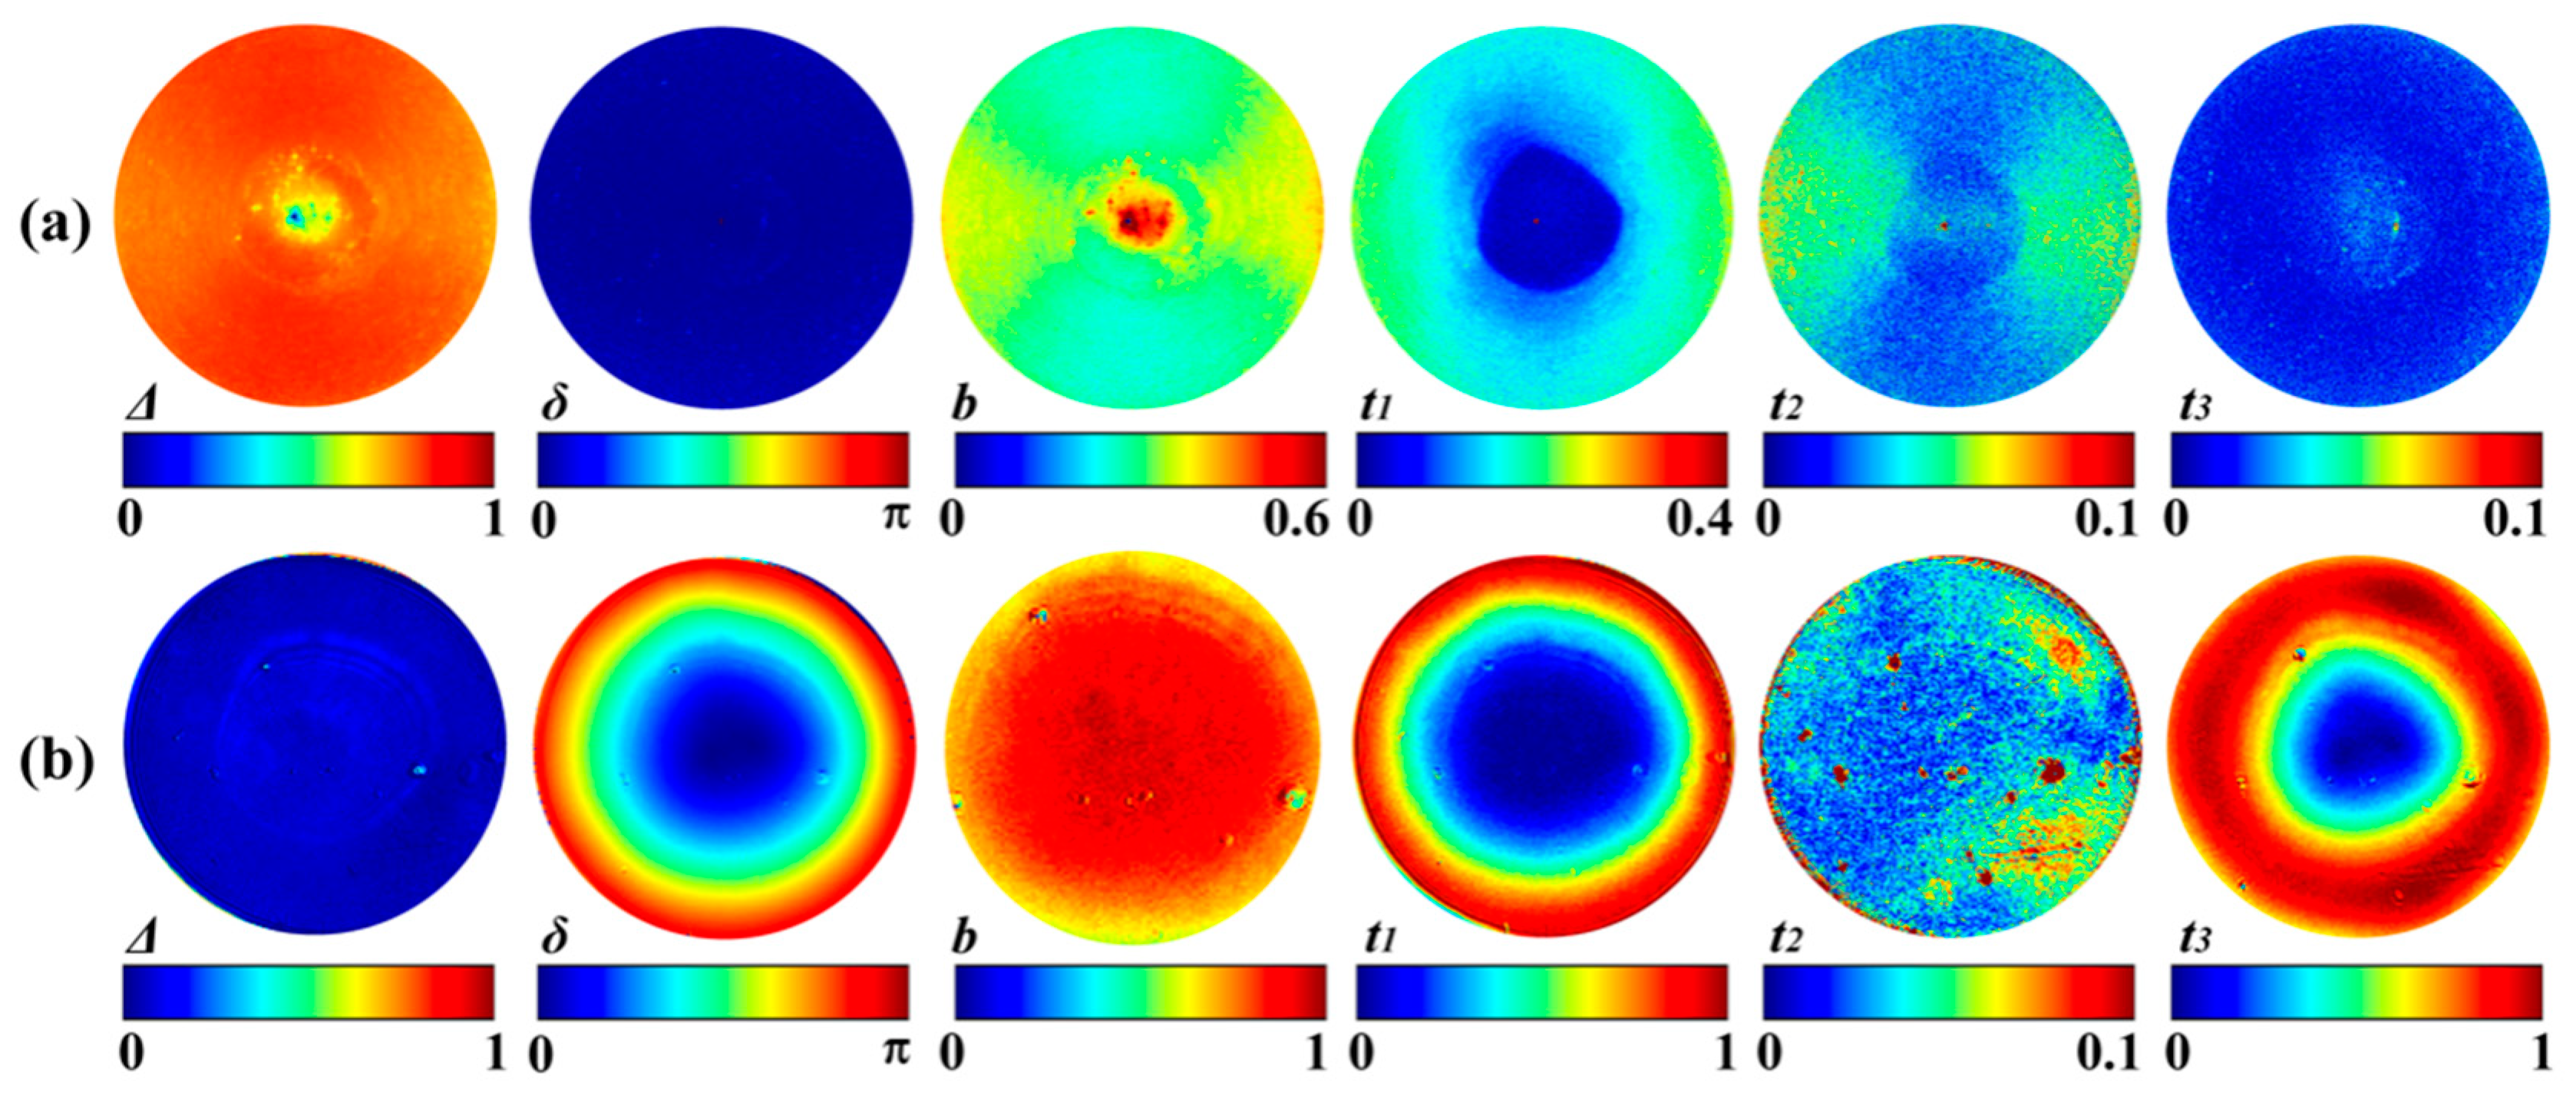
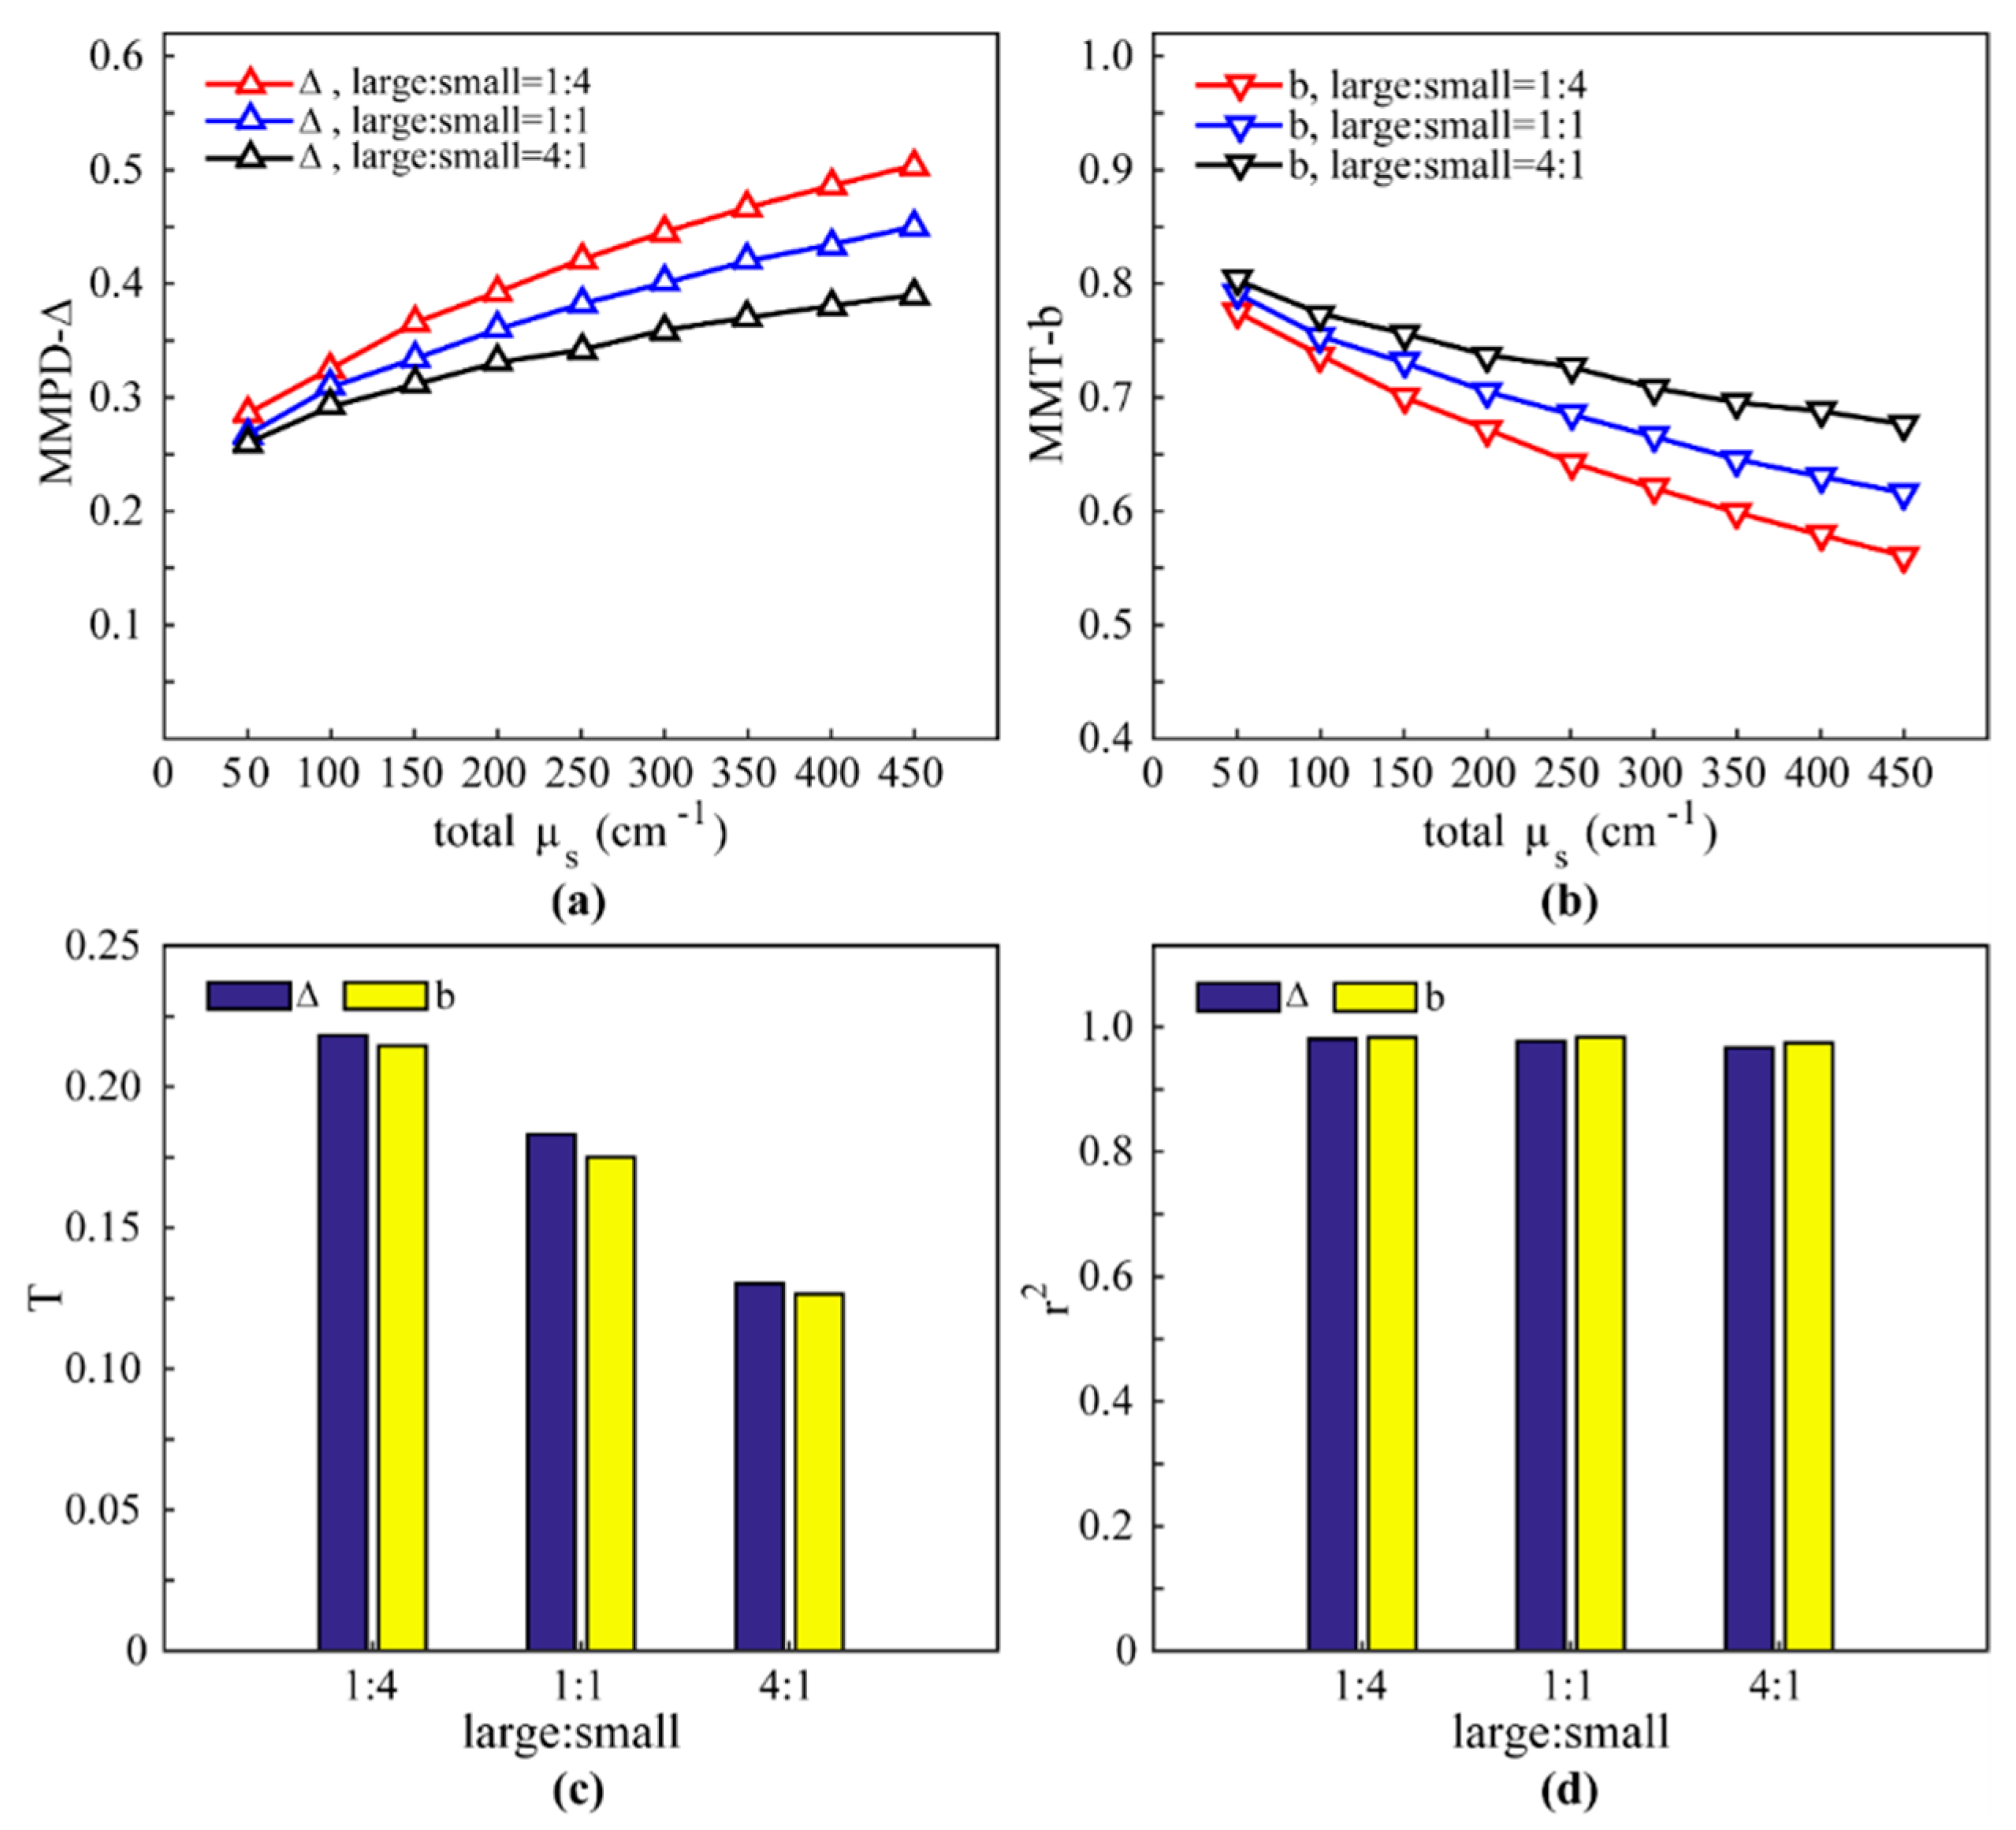
3.2. Parameters for Depolarizing Isotropic Tissues
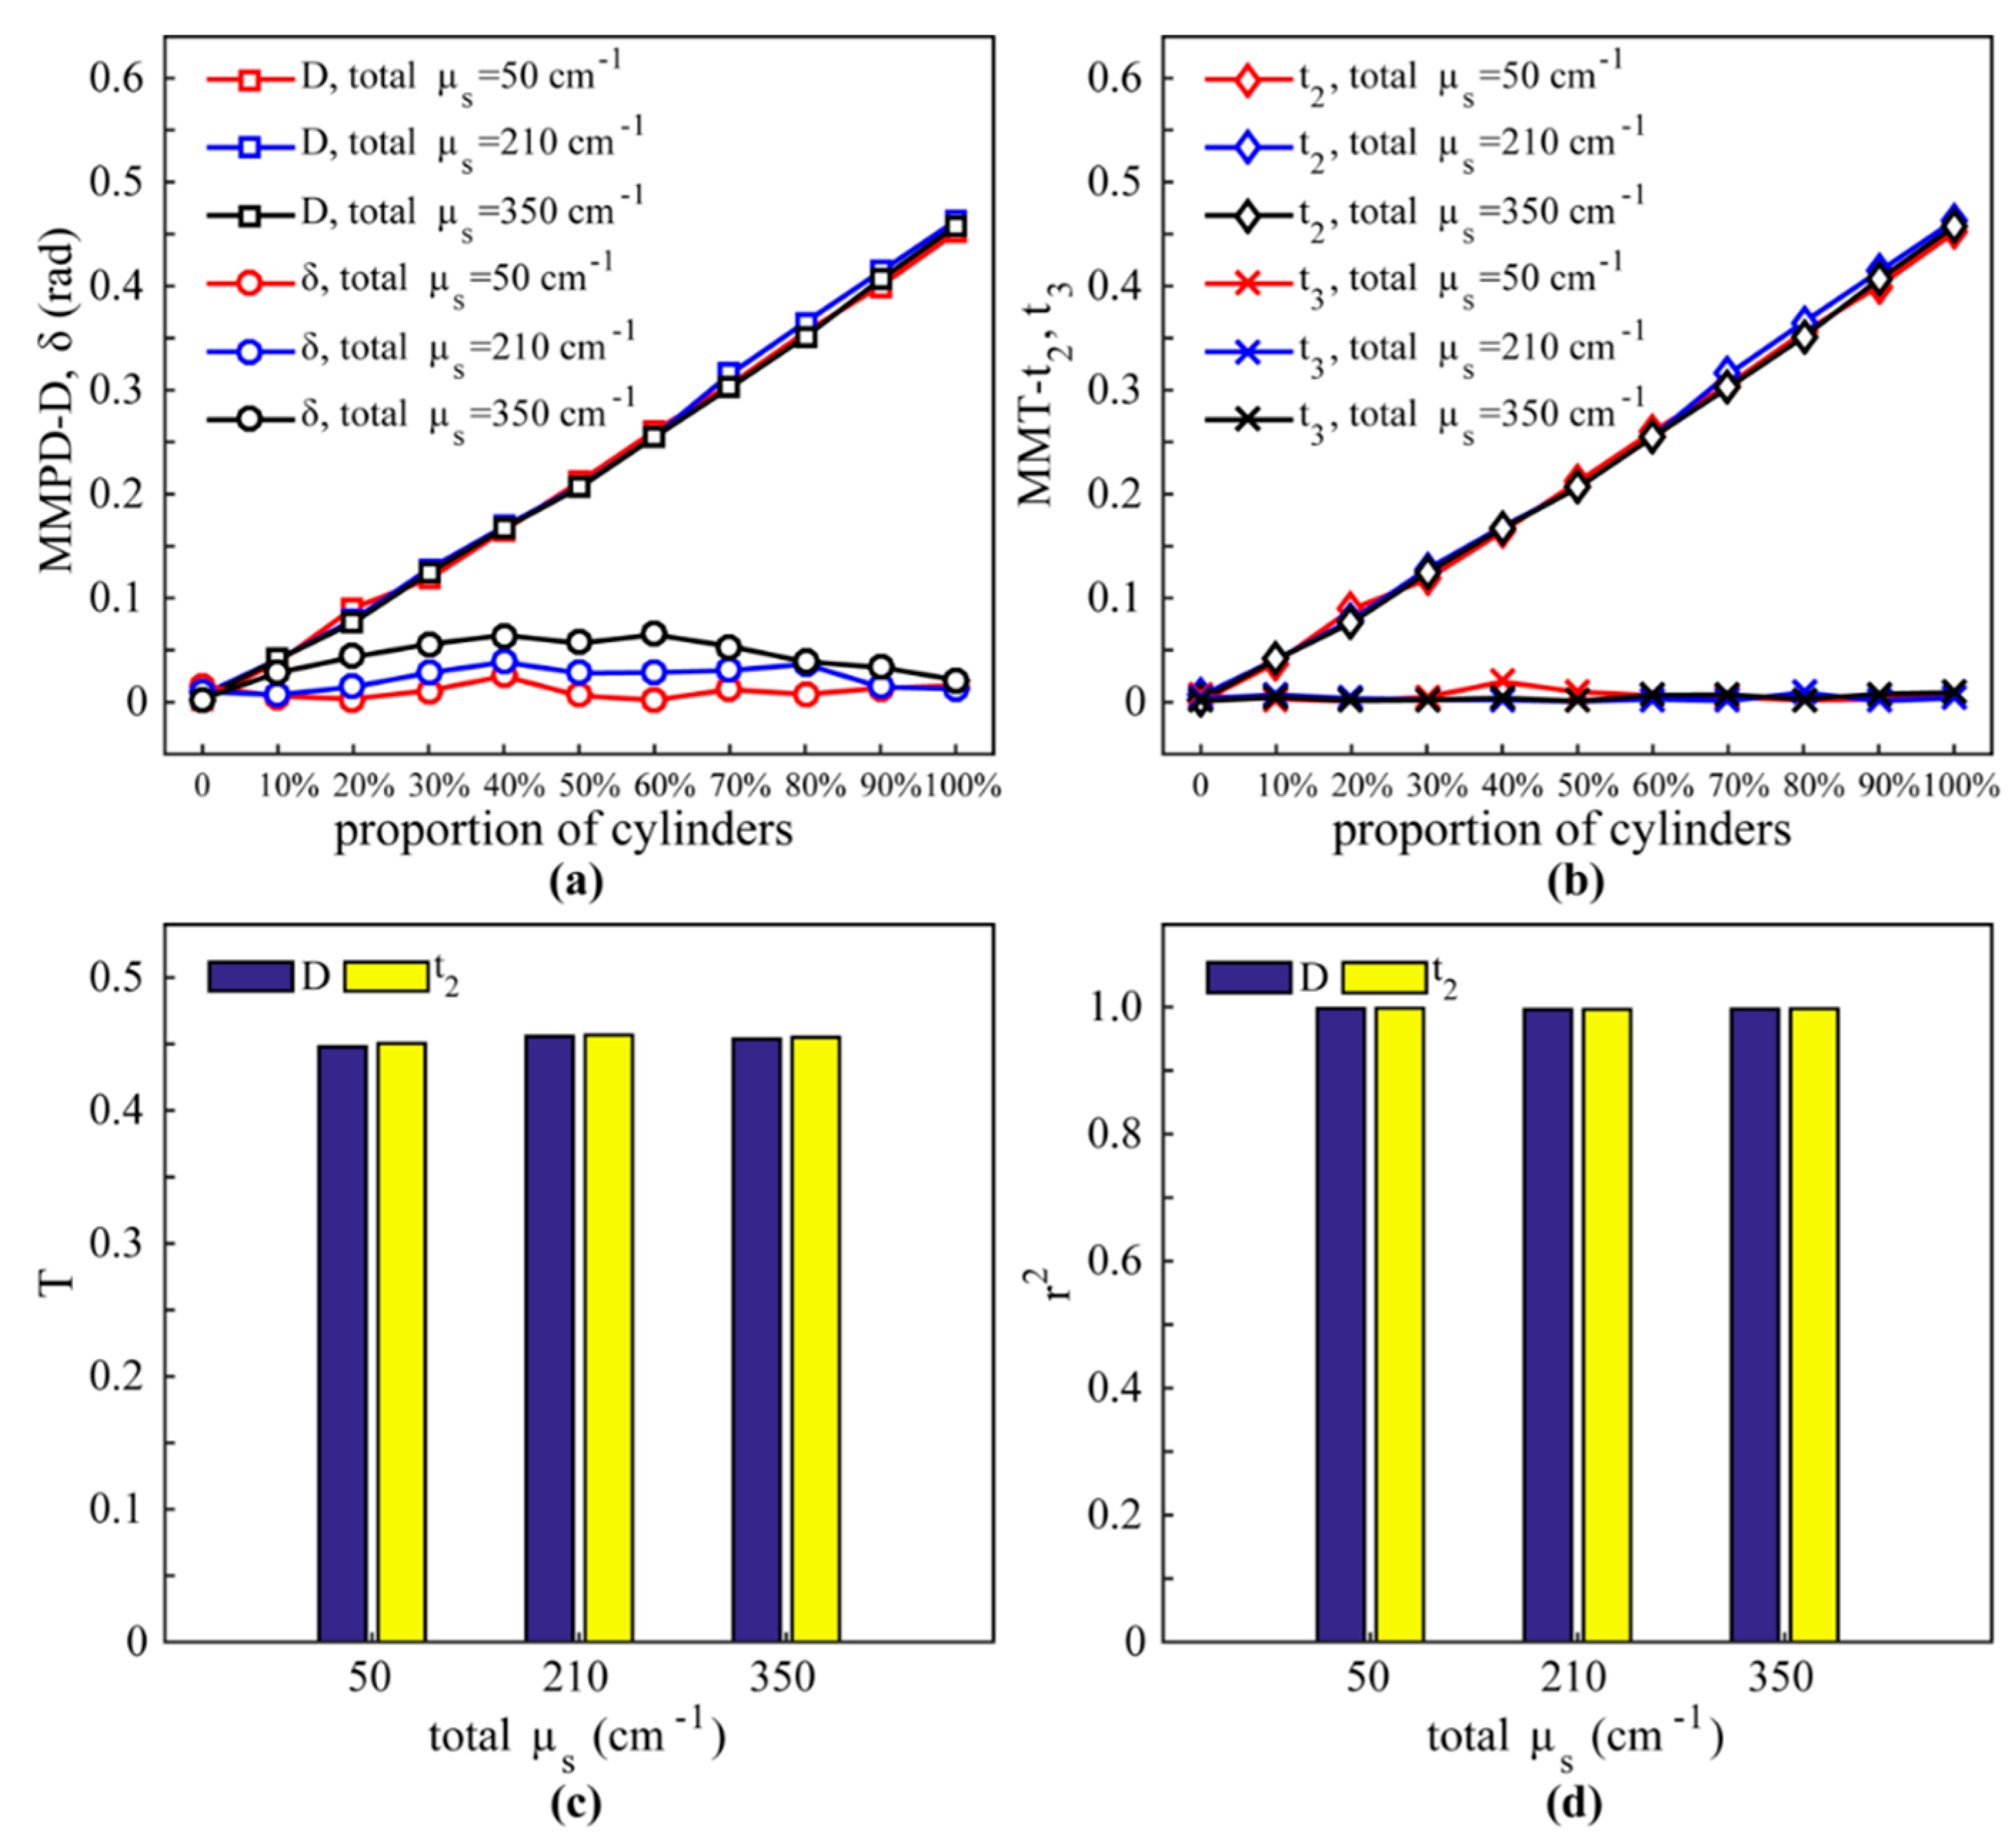
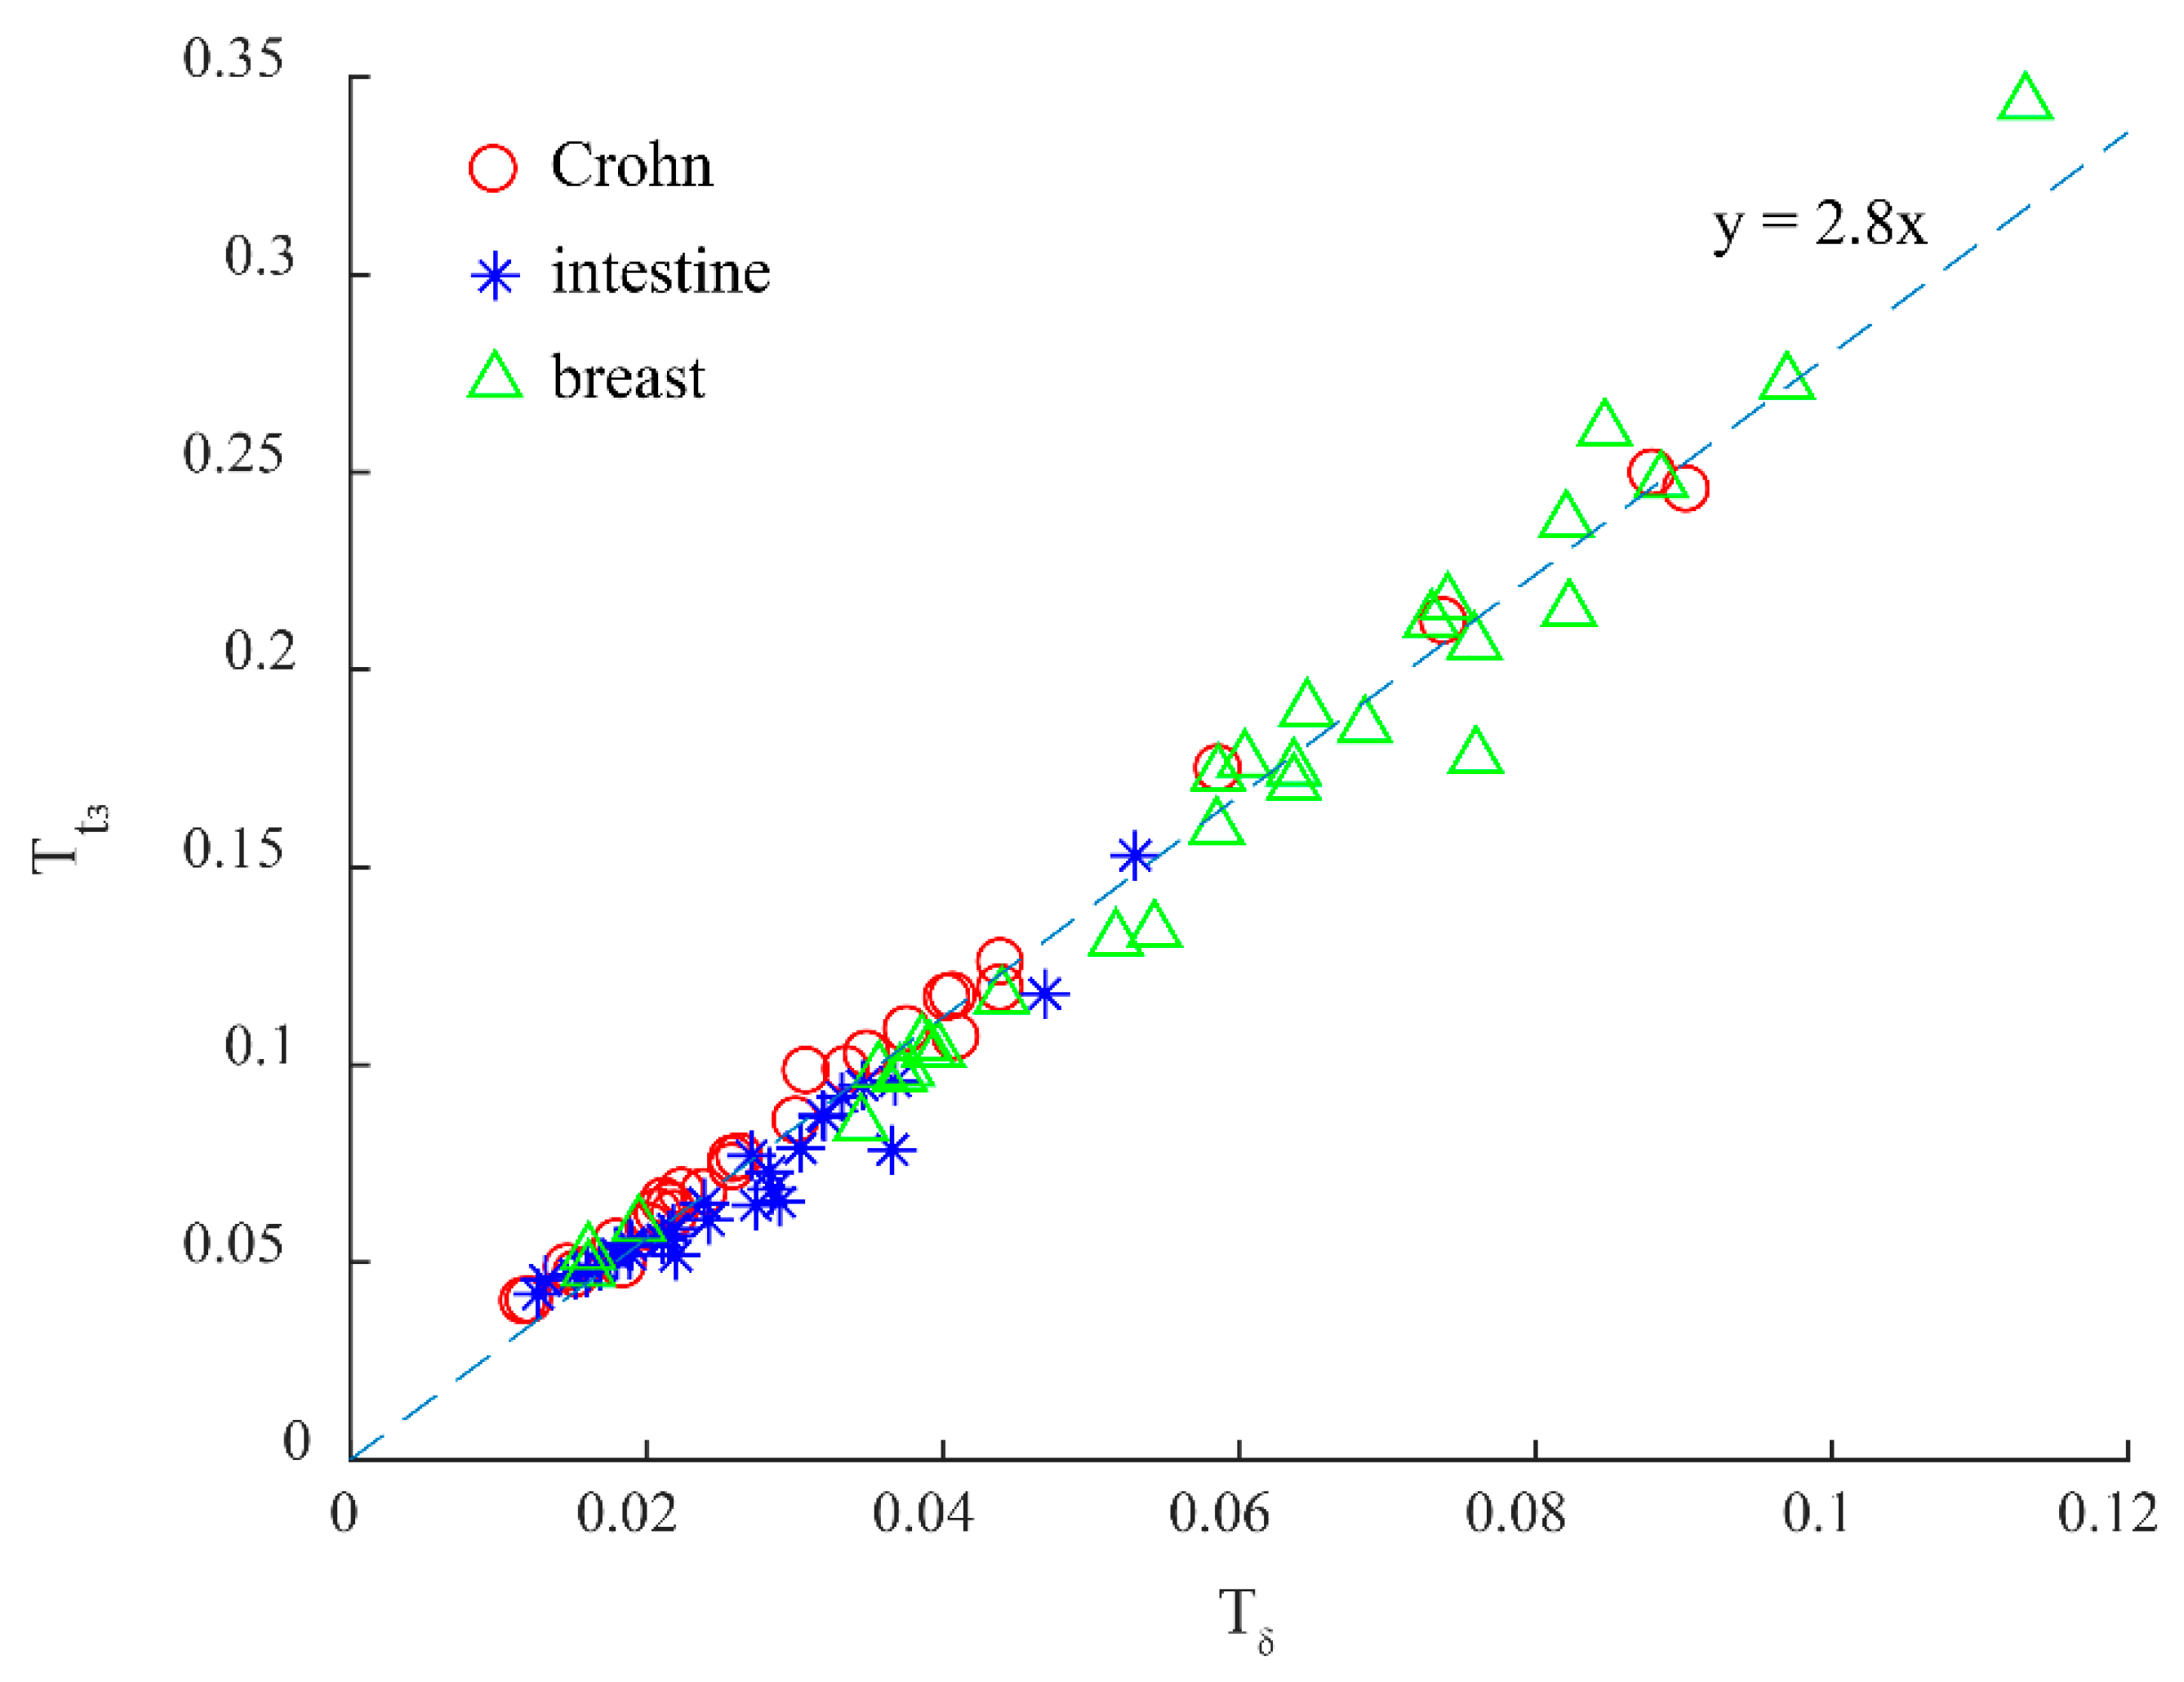
3.3. Parameters for Anisotropic Tissues with Cylindrical Scatterers
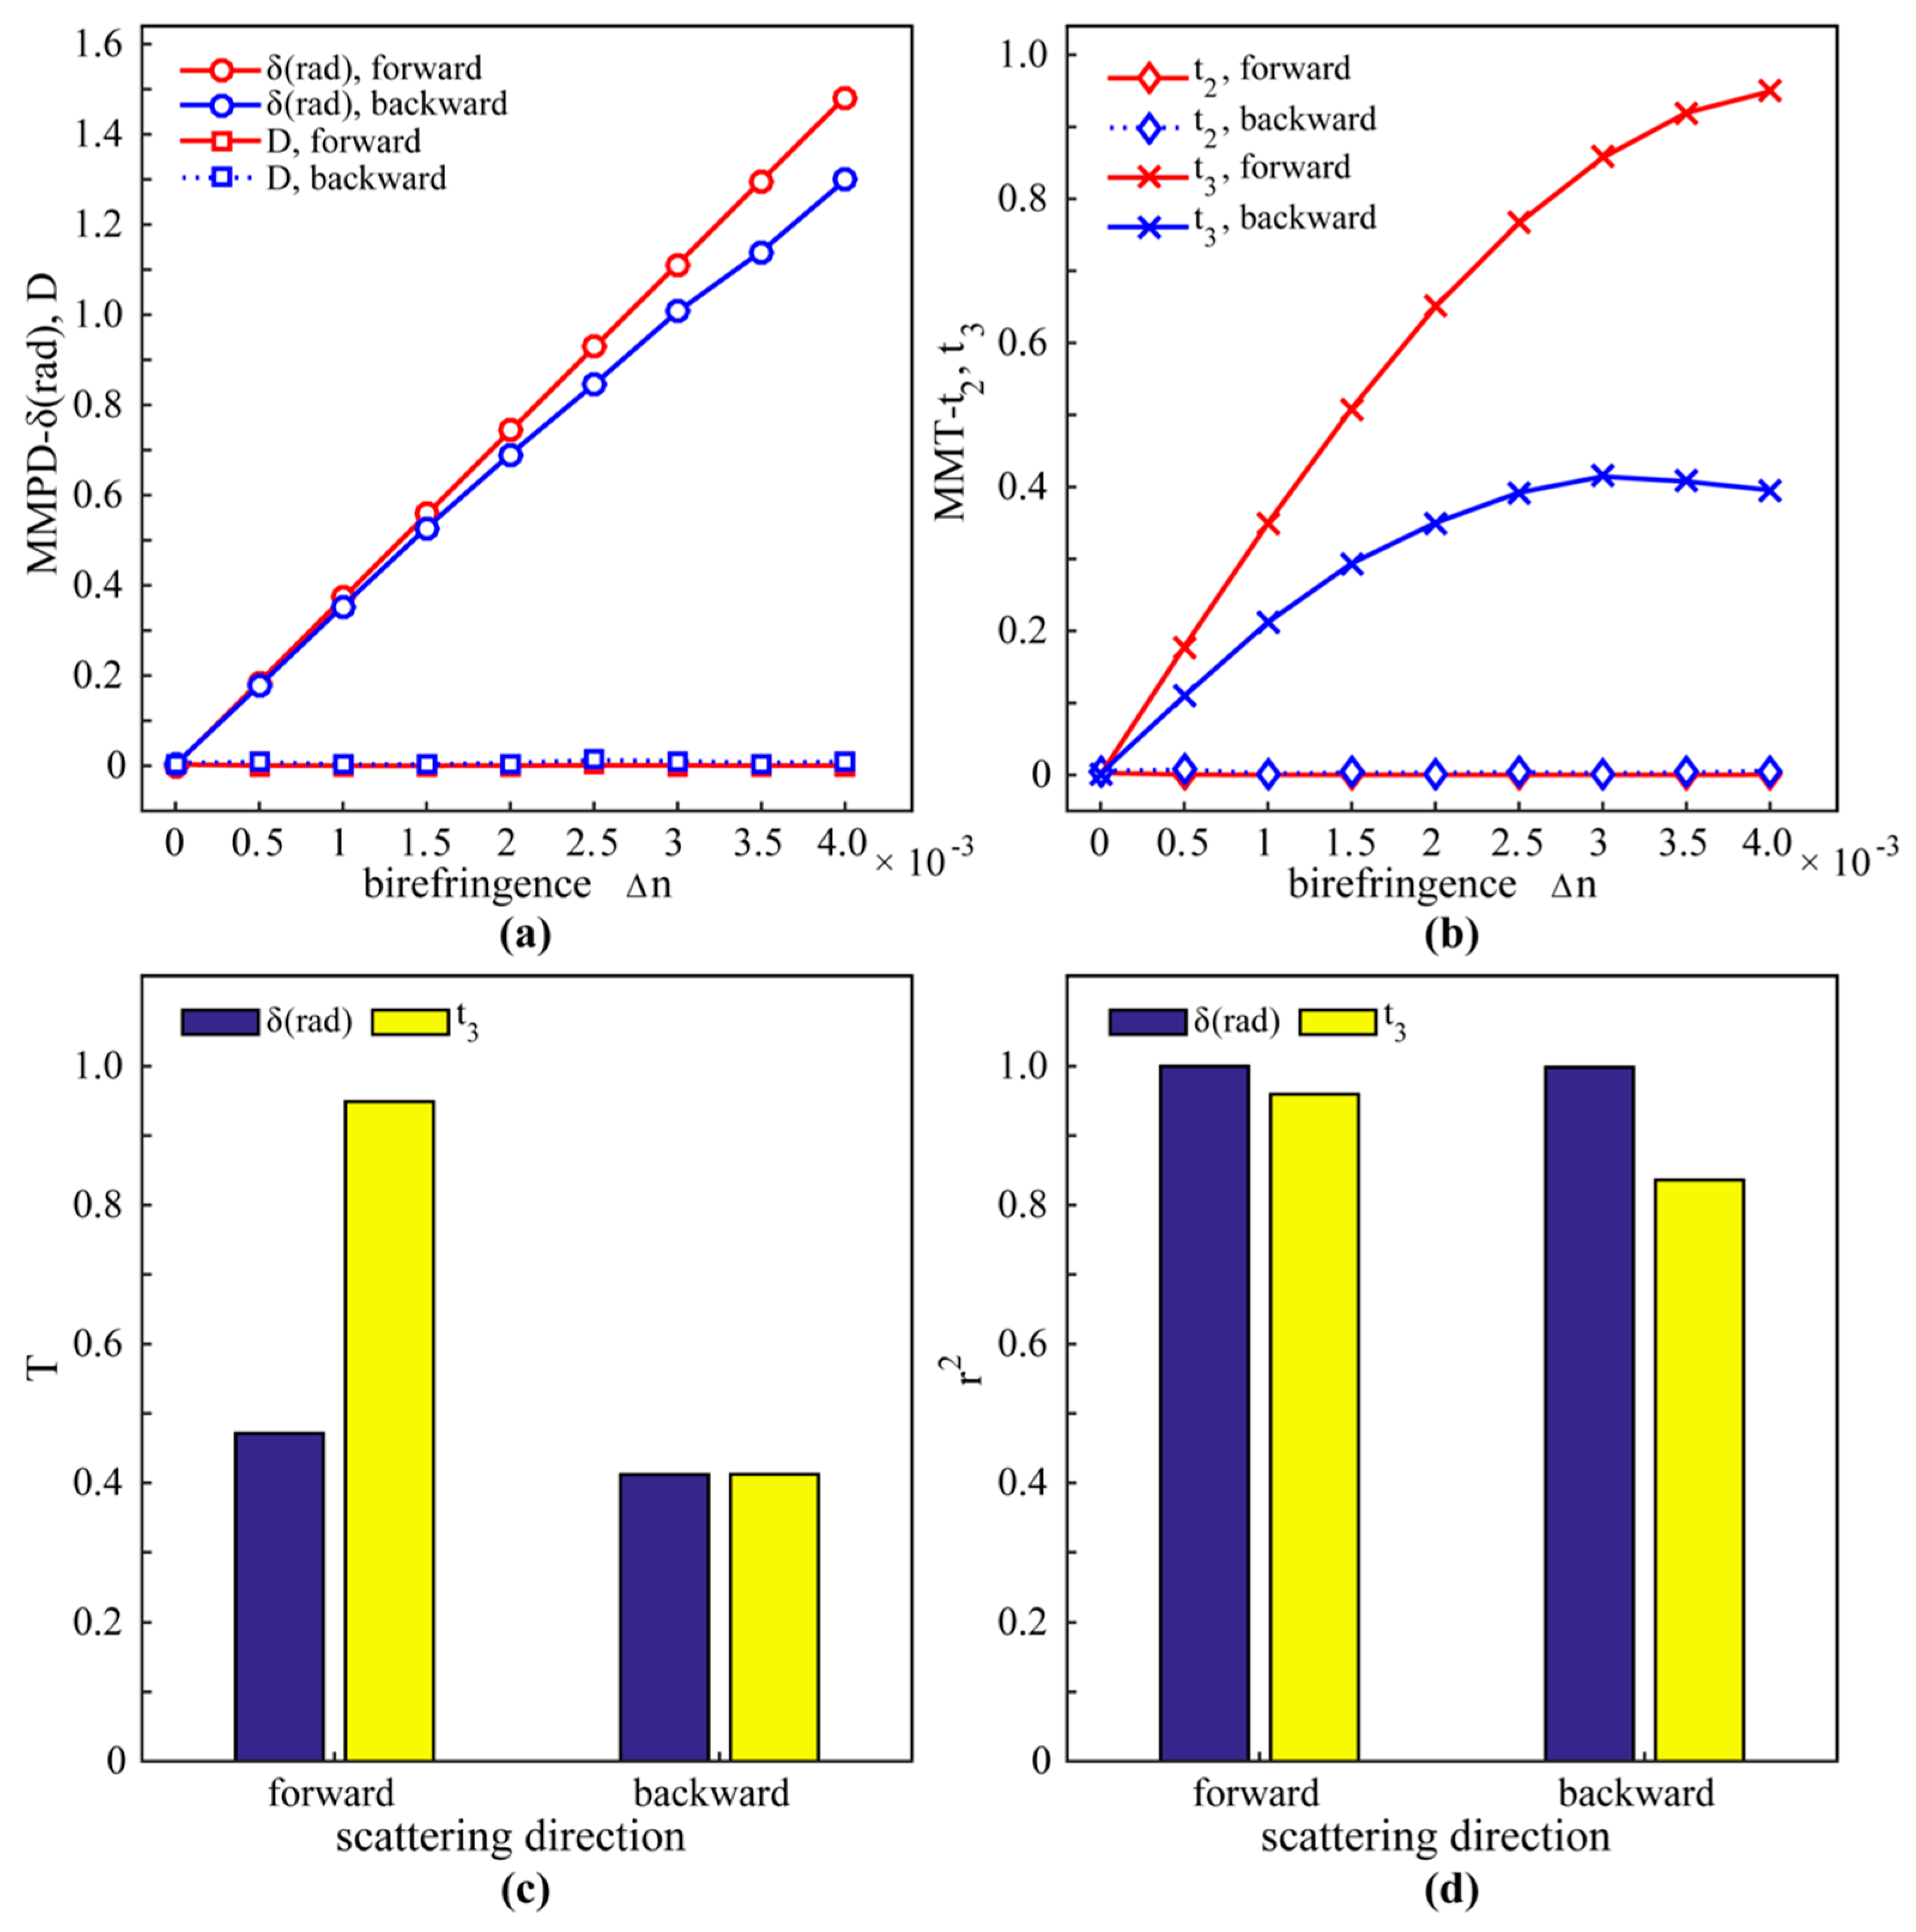
3.4. Parameters for Anisotropic Tissues with Birefringence
4. Conclusions
Author Contributions
Funding
Conflicts of Interest
References
- Ghosh, N.; Vitkin, I.A. Tissue polarimetry: Concepts, challenges, applications, and outlook. J. Biomed. Opt. 2011, 16, 110801. [Google Scholar] [CrossRef] [PubMed]
- Kunnen, B.; Macdonald, C.; Doronin, A.; Jacques, S.; Eccles, M.; Meglinski, I. Application of circularly polarized light for non-invasive diagnosis of cancerous tissues and turbid tissue-like scattering media. J. Biophotonics 2015, 8, 317–323. [Google Scholar] [CrossRef] [PubMed]
- He, H.; Liao, R.; Zeng, N.; Li, P.; Chen, Z.; Liu, X.; Ma, H. Mueller matrix polarimetry—An emerging new tool for characterizing the microstructural feature of complex biological specimen. J. Lightwave Technol. 2018. [Google Scholar] [CrossRef]
- Alali, S.; Vitkin, I.A. Polarized light imaging in biomedicine: Emerging Mueller matrix methodologies for bulk tissue assessment. J. Biomed. Opt. 2015, 20, 061104. [Google Scholar] [CrossRef] [PubMed]
- Pierangelo, A.; Nazac, A.; Benali, A.; Validire, P.; Cohen, H.; Novikova, T.; Ibrahim, B.H.; Manhas, S.; Fallet, C.; Antonelli, M.R.; et al. Polarimetric imaging of uterine cervix: A case study. Opt. Express 2013, 21, 14120–14130. [Google Scholar] [CrossRef] [PubMed]
- Sun, M.; He, H.; Zeng, N.; Du, E.; Guo, Y.; Liu, S.; Wu, J.; He, Y.; Ma, H. Characterizing the microstructures of biological tissues using Mueller matrix and transformed polarization parameters. Biomed. Opt. Express 2014, 5, 4223–4234. [Google Scholar] [CrossRef] [PubMed] [Green Version]
- He, C.; He, H.; Chang, J.; Dong, Y.; Liu, S.; Zeng, N.; He, Y.; Ma, H. Characterizing microstructures of cancerous tissues using multispectral transformed Mueller matrix polarization parameters. Biomed. Opt. Express 2015, 6, 2934–2945. [Google Scholar] [CrossRef] [Green Version]
- Wang, Y.; He, H.; Chang, J.; He, C.; Liu, S.; Li, M.; Zeng, N.; Wu, J.; Ma, H. Mueller matrix microscope: A quantitative tool to facilitate detections and fibrosis scorings of liver cirrhosis and cancer tissues. J. Biomed. Opt. 2016, 21, 071112. [Google Scholar] [CrossRef] [PubMed]
- He, H.; He, C.; Chang, J.; Lv, D.; Wu, J.; Duan, C.; Zhou, Q.; Zeng, N.; He, Y.; Ma, H. Monitoring microstructural variations of fresh skeletal muscle tissues by Mueller matrix imaging. J. Biophotonics 2017, 10, 664–673. [Google Scholar] [CrossRef] [PubMed]
- Qi, J.; Ye, M.; Singh, M.; Clancy, N.T.; Elson, D.S. Narrow band 3×3 Mueller polarimetric endoscopy. Biomed. Opt. Express 2013, 4, 2433–2449. [Google Scholar] [CrossRef] [PubMed]
- Qi, J.; Elson, D.S. A high definition Mueller polarimetric endoscope for tissue characterization. Sci. Rep. 2016, 6, 25953. [Google Scholar] [CrossRef]
- Lu, S.Y.; Chipman, R.A. Interpretation of Mueller matrix based on polar decomposition. J. Opt. Soc. Am. A 1996, 13, 1106–1113. [Google Scholar] [CrossRef]
- Ossikovski, R. Analysis of depolarizing Mueller matrices through a symmetric decomposition. J. Opt. Soc. Am. A 2009, 26, 1109–1118. [Google Scholar] [CrossRef]
- He, H.; Chang, J.; He, C.; Ma, H. Transformation of full 4×4 Mueller matrices: A quantitative technique for biomedical diagnosis. Proc. SPIE 2016, 9707, 97070K. [Google Scholar]
- Li, P.; Lv, D.; He, H.; Ma, H. Separating azimuthal orientation dependence in polarization measurements of anisotropic media. Opt. Express 2018, 26, 3791–3800. [Google Scholar] [CrossRef] [PubMed]
- Dubreuil, M.; Babilotte, P.; Martin, L.; Sevrain, D.; Rivet, S.; Grand, Y.L.; Brun, G.L.; Turlin, B.; Jeune, B.L. Mueller matrix polarimetry for improved liver fibrosis diagnosis. Opt. Lett. 2012, 37, 1061–1063. [Google Scholar] [CrossRef] [PubMed]
- Du, E.; He, H.; Zeng, N.; Sun, M.; Guo, Y.; Wu, J.; Liu, S.; Ma, H. Mueller matrix polarimetry for differentiating characteristic features of cancerous tissues. J. Biomed. Opt. 2014, 19, 076013. [Google Scholar] [CrossRef]
- Liu, T.; Sun, T.; He, H.; Liu, S.; Dong, Y.; Wu, J.; Ma, H. Comparative study of the imaging contrasts of Mueller matrix derived parameters between transmission and backscattering polarimetry. Biomed. Opt. Express 2018, 9, 4413–4428. [Google Scholar] [CrossRef] [PubMed]
- Das, N.K.; Dey, R.; Chakraborty, S.; Panigrahi, P.K.; Meglinski, I.; Ghosh, N. Quantitative assessment of submicron scale anisotropy in tissue multifractality by scattering Mueller matrix in the framework of Born approximation. Opt. Commun. 2018, 413, 172–178. [Google Scholar] [CrossRef]
- Ushenko, A.; Sdobnov, A.; Dubolazov, A.; Gritsuk, M.; Ushenko, Y.; Bykov, A.; Meglinski, I. Stokes-correlometry analysis of biological tissues with polycrystalline structure. IEEE J. Sel. Top. Quant. 2019, 25, 1–12. [Google Scholar] [CrossRef]
- Borovkova, M.; Peyvasteh, M.; Dubolazov, O.; Ushenko, Y.; Ushenko, V.; Bykov, A.; Deby, S.; Rehbinder, J.; Novikova, T.; Meglinski, I. Complementary analysis of Mueller-matrix images of optically anisotropic highly scattering biological tissues. J. Eur. Opt. Soc.-Rapid 2018, 14, 20. [Google Scholar] [CrossRef]
- Ushenko, V.; Sdobnov, A.; Syvokorovskaya, A.; Dubolazov, A.; Vanchulyak, O.; Ushenko, A.; Ushenko, Y.; Gorsky, M.; Sidor, M.; Bykov, A.; et al. 3D Mueller-matrix diffusive tomography of polycrystalline blood films for cancer diagnosis. Photonics 2018, 5, 54. [Google Scholar] [CrossRef]
- Dong, Y.; Qi, J.; He, H.; He, C.; Liu, S.; Wu, J.; Elson, D.S.; Ma, H. Quantitatively characterizing the microstructural features of breast ductal carcinoma tissues in different progression stages by Mueller matrix microscope. Biomed. Opt. Express 2017, 8, 3643–3655. [Google Scholar] [CrossRef] [Green Version]
- Chang, J.; Zeng, N.; He, H.; Guo, Y.; Ma, H. Removing the polarization artifacts in Mueller matrix images recorded with a birefringent gradient-index lens. J. Biomed. Opt. 2014, 19, 095001. [Google Scholar] [CrossRef] [Green Version]
- He, H.; Zeng, N.; Liao, R.; Yun, T.; Li, W.; He, Y.; Ma, H. Application of sphere-cylinder scattering model to skeletal muscle. Opt. Express 2010, 18, 15104–15112. [Google Scholar] [CrossRef]
- Du, E.; He, H.; Zeng, N.; Guo, Y.; Liao, R.; He, Y.; Ma, H. Two-dimensional backscattering Mueller matrix of sphere–cylinder birefringence media. J. Biomed. Opt. 2012, 17, 126016. [Google Scholar] [CrossRef] [PubMed]
- Yun, T.; Zeng, N.; Li, W.; Li, D.; Jiang, X.; Ma, H. Monte Carlo simulation of polarized photon scattering in anisotropic media. Opt. Express 2009, 17, 16590–16602. [Google Scholar] [CrossRef] [PubMed]
- Goldstein, D.H.; Chipman, R.A. Mueller matrix ellipsometry with imperfect compensators. J. Opt. Soc. Am. A 1978, 68, 1519–1528. [Google Scholar]
- Goldstein, D.H.; Chipman, R.A. Error analysis of a Mueller matrix polarimeter. J. Opt. Soc. Am. A 1990, 7, 693–700. [Google Scholar] [CrossRef]
- Sun, T.; Liu, T.; He, H.; Wu, J.; Ma, H. Distinguishing anisotropy orientations originated from scattering and birefringence of turbid media using Mueller matrix derived parameters. Opt. Lett. 2018, 43, 4092–4095. [Google Scholar] [CrossRef] [PubMed]
- He, H.; Sun, M.; Zeng, N.; Du, E.; Liu, S.; Guo, Y.; Wu, J.; He, Y.; Ma, H. Mapping local orientation of aligned fibrous scatterers for cancerous tissues using backscattering Mueller matrix imaging. J. Biomed. Opt. 2014, 19, 106007. [Google Scholar] [CrossRef] [PubMed] [Green Version]
- He, H.; Zeng, N.; Li, W.; Yun, T.; Liao, R.; He, Y.; Ma, H. Two-dimensional backscattering Mueller matrix of sphere-cylinder scattering medium. Opt. Lett. 2010, 35, 2323–2325. [Google Scholar] [CrossRef] [PubMed]
- He, H.; Zeng, N.; Du, E.; Guo, Y.; Li, D.; Liao, R.; Ma, H. A possible quantitative Mueller matrix transformation technique for anisotropic scattering media. Photon. Lasers Med. 2013, 2, 129–137. [Google Scholar] [CrossRef]
- Sun, M.; He, H.; Zeng, N.; Du, E.; Guo, Y.; Peng, C.; He, Y.; Ma, H. Probing microstructural information of anisotropic scattering media using rotation-independent polarization parameters. Appl. Opt. 2014, 53, 2949–2955. [Google Scholar] [CrossRef] [PubMed]
- Hidovic-Rowe, D.; Claridge, E. Modelling and validation of spectral reflectance for the colon. Phys. Med. Biol. 2005, 50, 1071–1093. [Google Scholar] [CrossRef] [PubMed]
- Maeda, T.; Arakawa, N.; Takahashi, M.; Aizu, Y. Monte Carlo simulation of spectral reflectance using a multilayered skin tissue model. Opt. Rev. 2010, 17, 223–229. [Google Scholar] [CrossRef]
- He, C.; He, H.; Li, X.; Chang, J.; Wang, Y.; Liu, S.; Zeng, N.; He, Y.; Ma, H. Quantitatively differentiating microstructures of tissues by frequency distributions of Mueller matrix images. J. Biomed. Opt. 2015, 20, 105009. [Google Scholar] [CrossRef] [PubMed] [Green Version]
- Pasquesi, J.J.; Schlachter, S.C.; Boppart, M.D.; Chaney, E.; Kaufman, S.J.; Boppart, S.A. In vivo detection of exercised-induced ultrastructural changes in genetically-altered murine skeletal muscle using polarization-sensitive optical coherence tomography. Opt. Express 2006, 14, 1547–1556. [Google Scholar]


© 2019 by the authors. Licensee MDPI, Basel, Switzerland. This article is an open access article distributed under the terms and conditions of the Creative Commons Attribution (CC BY) license (http://creativecommons.org/licenses/by/4.0/).
Share and Cite
Sheng, W.; Li, W.; Qi, J.; Liu, T.; He, H.; Dong, Y.; Liu, S.; Wu, J.; Elson, D.S.; Ma, H. Quantitative Analysis of 4 × 4 Mueller Matrix Transformation Parameters for Biomedical Imaging. Photonics 2019, 6, 34. https://doi.org/10.3390/photonics6010034
Sheng W, Li W, Qi J, Liu T, He H, Dong Y, Liu S, Wu J, Elson DS, Ma H. Quantitative Analysis of 4 × 4 Mueller Matrix Transformation Parameters for Biomedical Imaging. Photonics. 2019; 6(1):34. https://doi.org/10.3390/photonics6010034
Chicago/Turabian StyleSheng, Wei, Weipeng Li, Ji Qi, Teng Liu, Honghui He, Yang Dong, Shaoxiong Liu, Jian Wu, Daniel S. Elson, and Hui Ma. 2019. "Quantitative Analysis of 4 × 4 Mueller Matrix Transformation Parameters for Biomedical Imaging" Photonics 6, no. 1: 34. https://doi.org/10.3390/photonics6010034