Article

Effective Linewidth of Semiconductor Lasers for Coherent Optical Data Links

1
Optics Division, Royal Institute of Technology, Electrum 229, Kista SE-16440, Sweden
2
VPI Photonics GmBH, Berlin 10587, Germany
3
Networking and Transmission Laboratory, Acreo Swedish ICT AB, Kista SE-16425 , Sweden
4
DTU Fotonik, Technical University of Denmark, Build. 343, Kgs. Lyngby DK-2800, Denmark
*
Author to whom correspondence should be addressed.
Photonics 2016, 3(2), 39; https://doi.org/10.3390/photonics3020039
Submission received: 12 May 2016 / Revised: 7 June 2016 / Accepted: 9 June 2016 / Published: 15 June 2016

Abstract

:
We discuss the implications of using monolithically integrated semiconductor lasers in high capacity optical coherent links suitable for metro applications, where the integration capabilities of semiconductor lasers make them an attractive candidate to reduce transceiver cost. By investigating semiconductor laser frequency noise profiles we show that carrier induced frequency noise plays an important role in system performance. We point out that, when such lasers are employed, the commonly used laser linewidth fails to estimate system performance, and we propose an alternative figure of merit that we name “Effective Linewidth”. We derive this figure of merit analytically, explore it by numerical simulations and experimentally validate our results by transmitting a 28 Gbaud DP-16QAM over an optical link. Our investigations cover the use of semiconductor lasers both in the transmitter side and as a local oscillator at the receiver. The obtained results show that our proposed “effective linewidth” is easy to measure and accounts for frequency noise more accurately, and hence the penalties associated to phase noise in the received signal.

1. Introduction

Laser frequency and phase noise play a major role in the performance of current optical coherent transceivers. Such impairments must be mitigated with carrier-phase recovery (CPR) techniques. It is widely understood that frequency and phase noise, which are directly related to each other, are closely related to laser linewidth [1]. Therefore, it is common to evaluate CPR algorithms in terms of optical signal-to-noise ratio (OSNR) penalty versus the laser linewidth times the symbol period of the transmitted signal ( Δ υ τ ) [2,3,4]. However, it is only under the assumption of spectrally flat white frequency noise that the laser linewidth is directly proportional to the power spectral density (PSD) of the frequency noise [5]. This assumption holds relatively well for external cavity lasers (ECLs), which are often used in coherent transceivers as they can provide very narrow linewidths [6]. However, when considering monolithically integrated semiconductor lasers, the PSD of the frequency noise is no longer flat due to carrier induced frequency noise, and hence the relationship between linewidth and frequency noise is no longer trivial [7,8]. In this case, laser linewidth poorly indicates system performance degradation due to phase noise, disqualifying it as a suitable figure of merit to benchmark CPR algorithms.
Monolithically integrated semiconductor lasers are more cost-effective, energy efficient, wavelength tuneable and easier to integrate than ECLs. Considering the global trend towards photonic integrated circuits (PICs), they constitute a key component in optical coherent transceivers targeting low cost, low foot-print, high flexibility and low power consumption. To leverage these benefits, vendors and operators are already proposing broadcasting metro network solutions that make use of PIC based coherent technologies and simplify the network architecture [9,10]. Given the data traffic increase in metropolitan area networks, and according to latest market reports [11], this means that we are about to experience a tenfold demand for such transceivers by 2019.
In this paper, we investigate the performance of coherent systems using semiconductor lasers as the optical source in the transmitter. Following our previous research on this topic [12,13,14,15] where the main subject of matter was its interplay with feedback based CPRs, this paper provides a detailed and concise analysis focusing on one of the most popular CPRs; the blind phase search (BPS). In Section 2, we present a frequency noise model that takes into account carrier induced frequency noise and flicker noise, and numerically calculate the laser linewidth while varying different parameters of the model. In Section 3, we investigate the impact of carrier induced frequency noise on system performance using simulations. In Section 4, we depict the setup and explain the experiments that validate our simulation results. In Section 5, we propose the "Effective Linewidth"; an alternative to laser linewidth that solves the non-Lorentzian assumption and is able to predict system performance. Finally, conclusions are presented in Section 6.

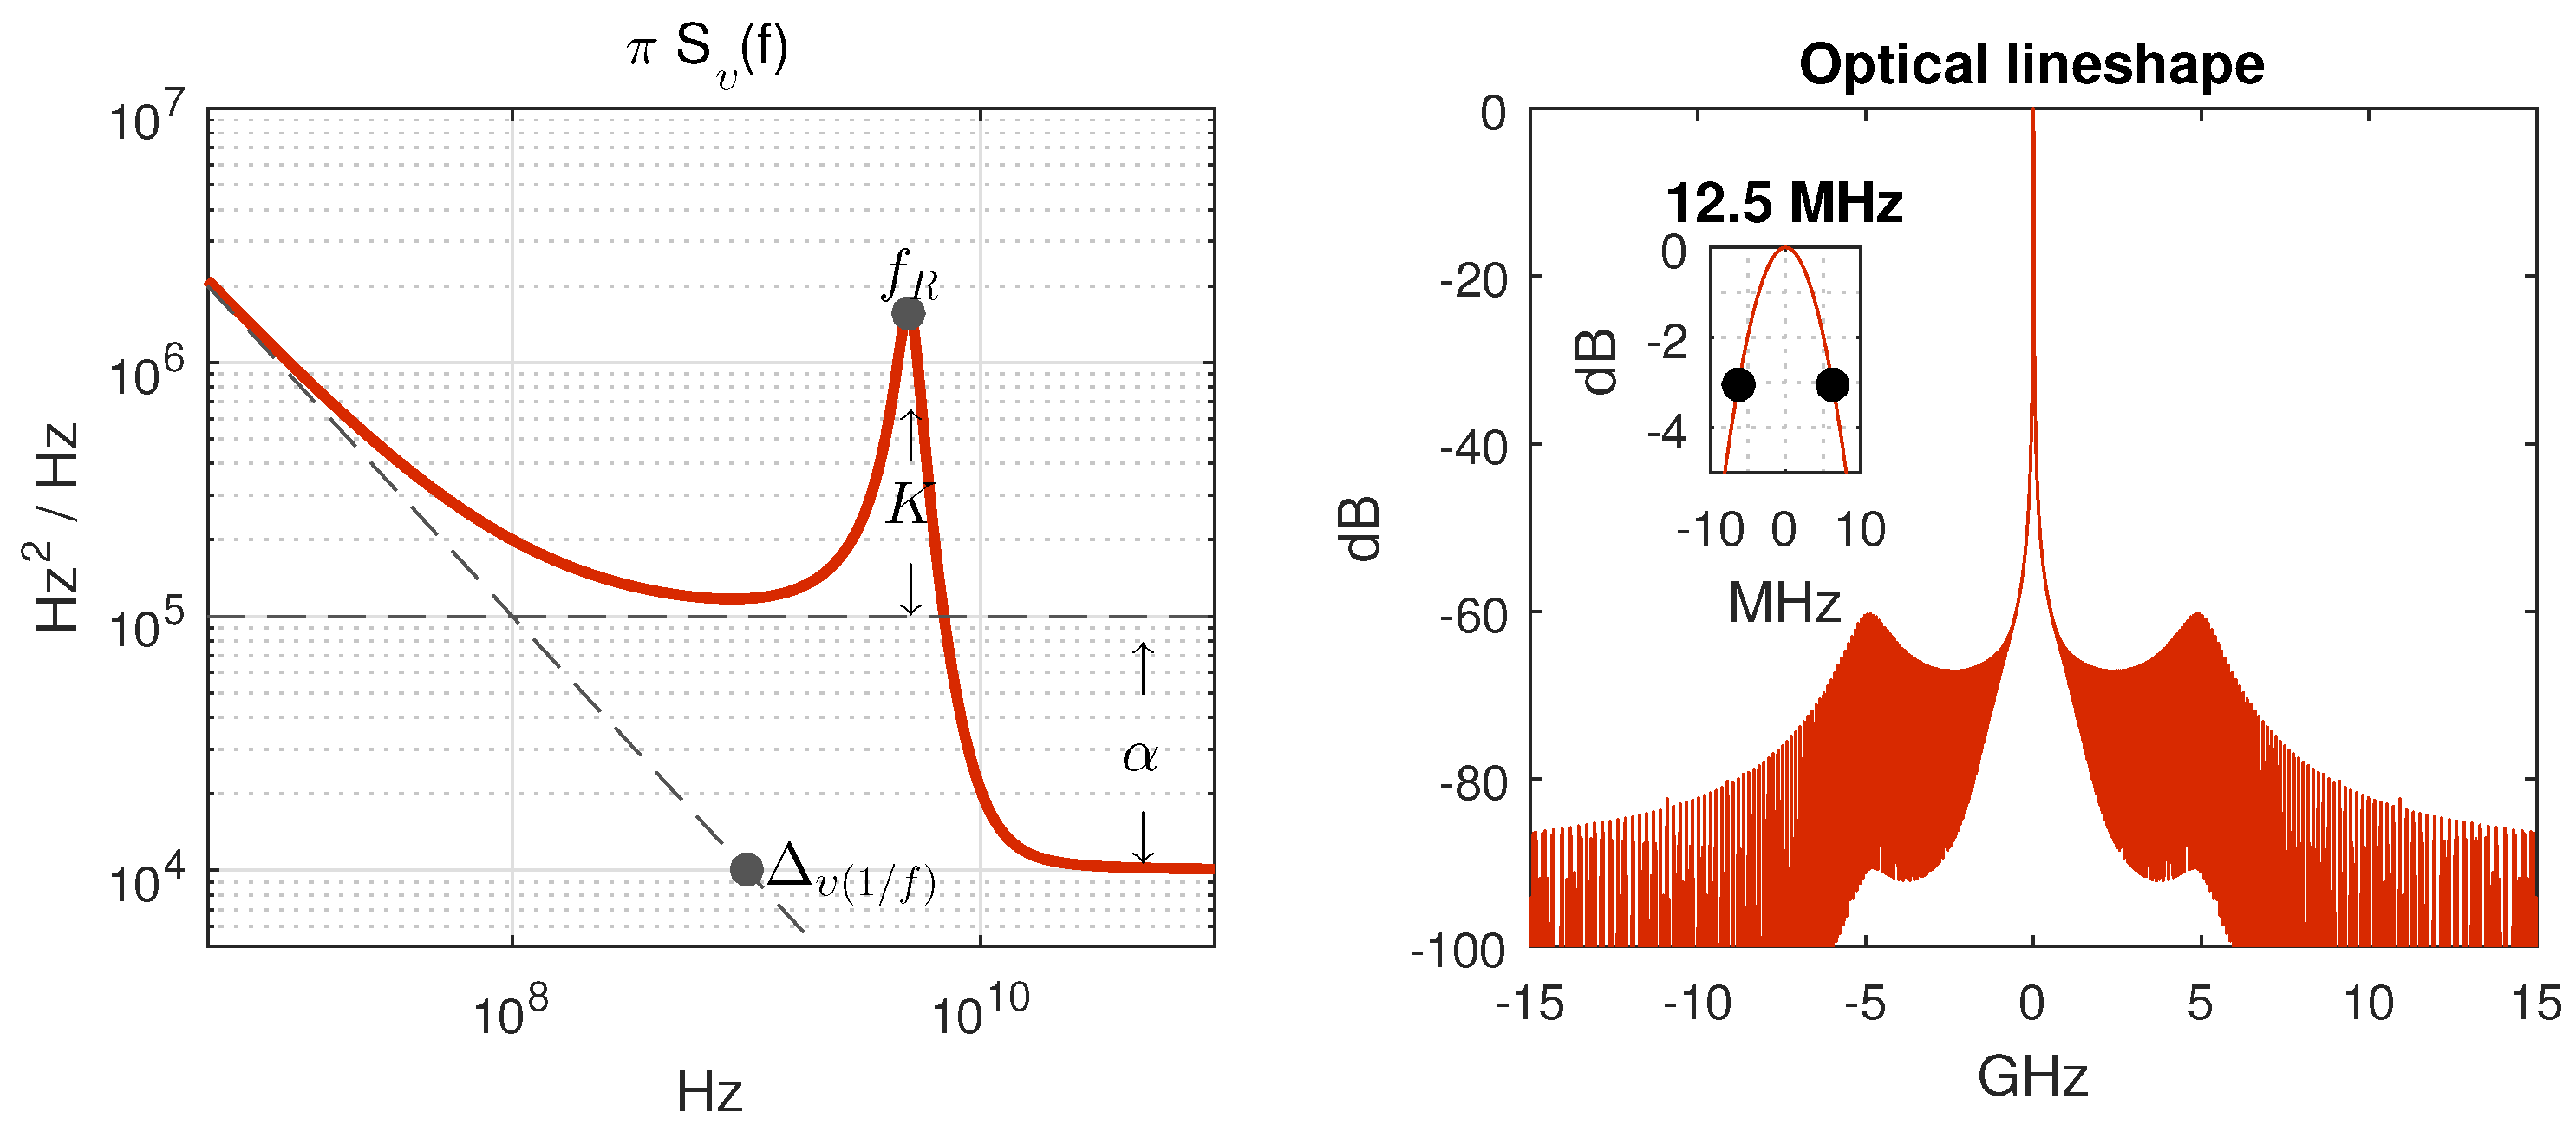
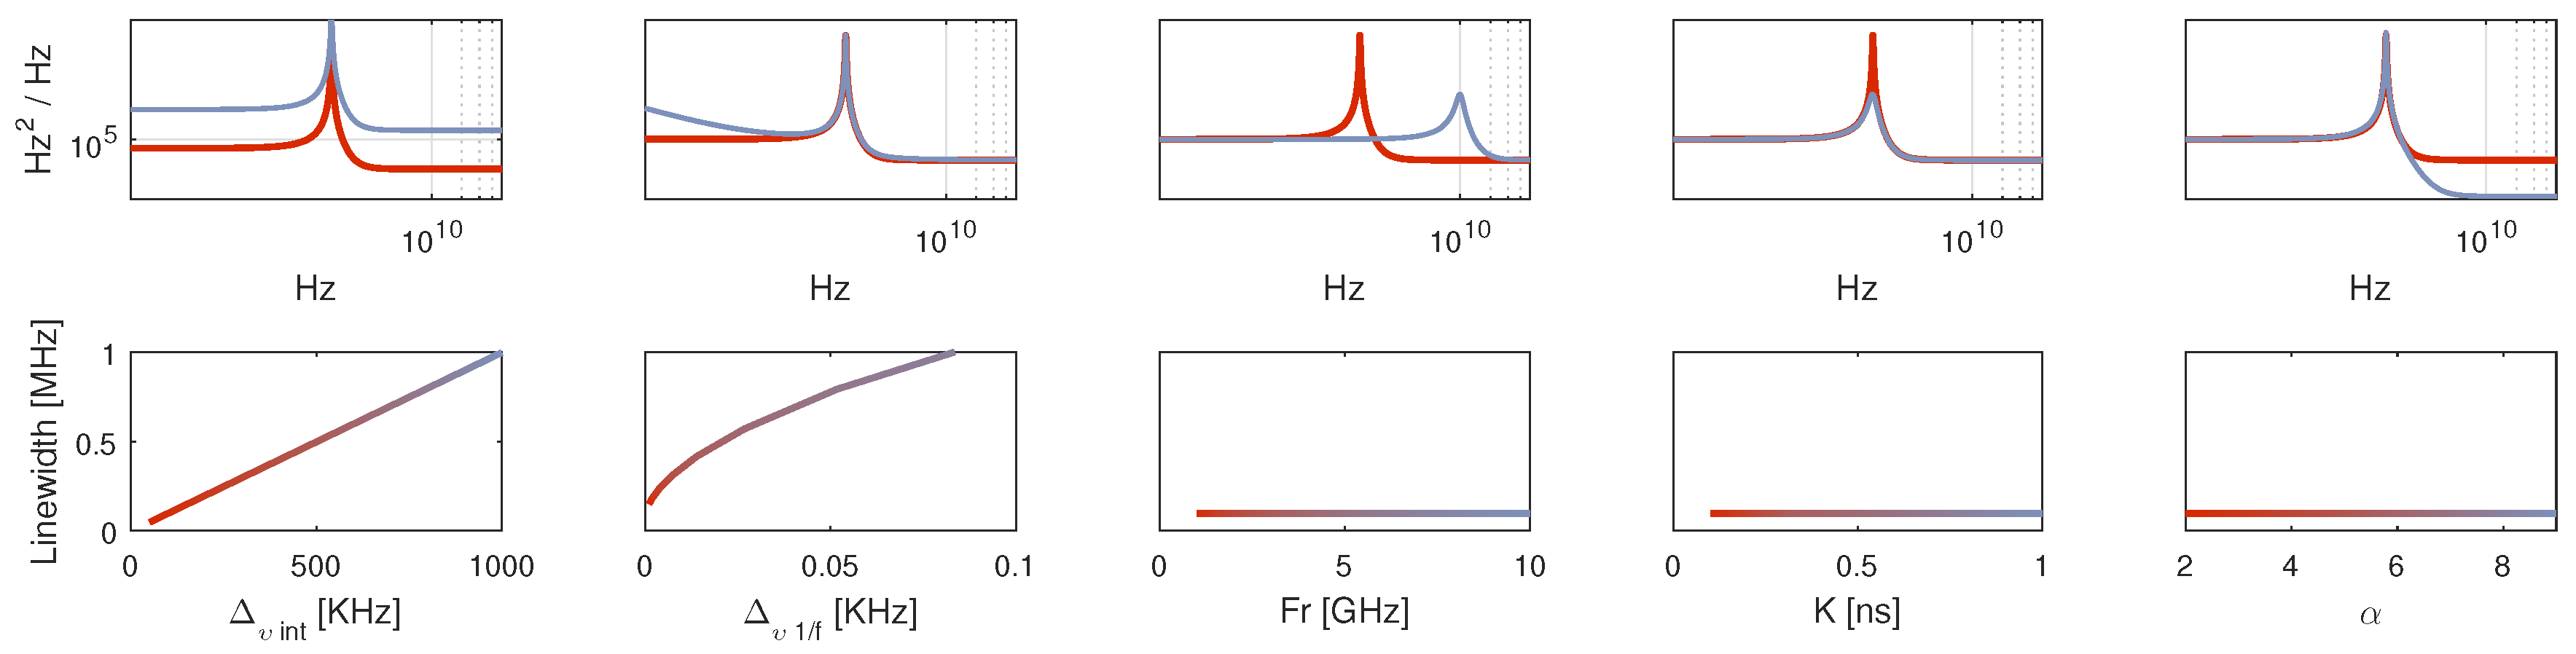
2. Semiconductor Laser Frequency Noise Model
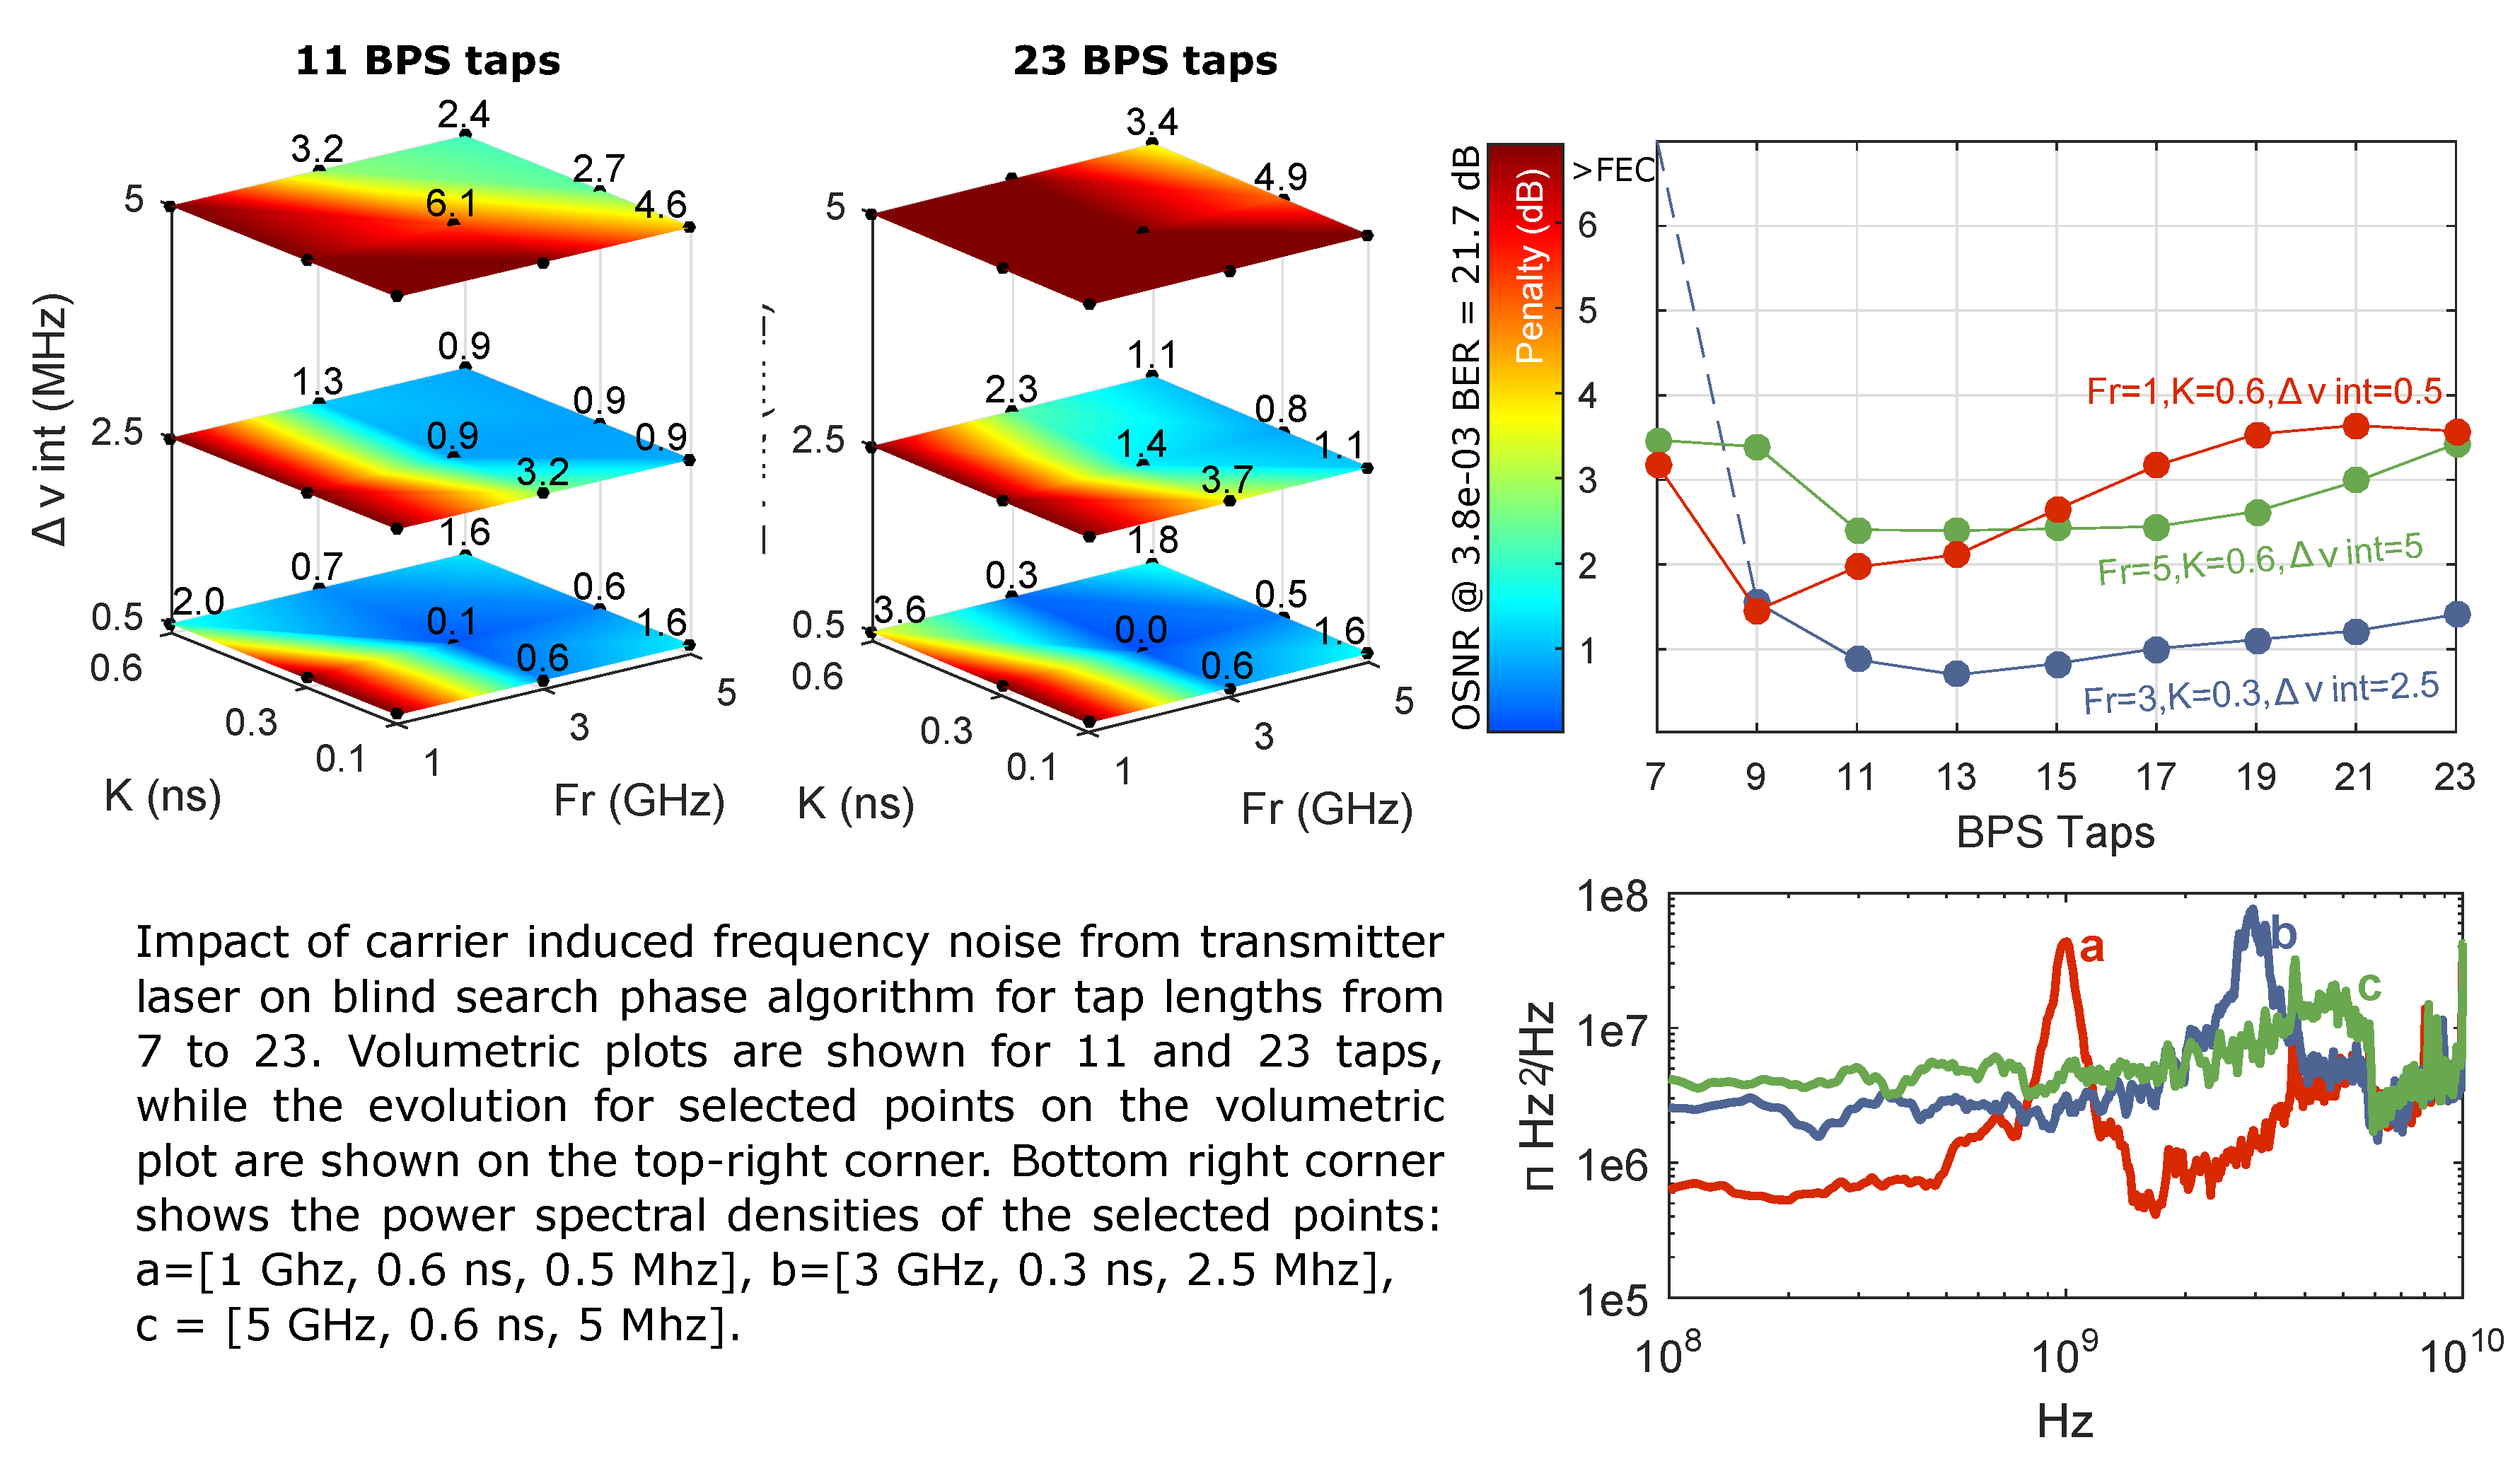
The short-term phase variation of a waveform, can be represented either as phase or frequency noise. Frequency noise refers to random fluctuations of the instantaneous frequency, which is the temporal derivative of the phase. We model the single-sided PSD of frequency noise per frequency bandwidth as:
S υ ( f ) = 10 9 Δ υ ( 1 / f ) π f + Δ υ i n t π ( 1 + α 2 ) 1 + α 2 f R 4 ( f R 2 - f 2 ) 2 + K f R 2 2 π f 2
where:
  • Δ υ ( 1 / f ) describes the level of 1 / f noise at 1 GHz.
  • Δ υ i n t describes the level of the intrinsic frequency noise at low frequencies.
  • f R is the resonance frequency.
  • K-factor describes how the damping rate increases with relaxation frequency. The K-factor of semiconductor lasers is approximately bias independent and in the range of 0.1–1 ns.
  • α parameter determines the magnitude of the carrier induced noise.
Figure 1 shows the frequency PSD and optical lineshape for a frequency modulation (FM) particular noise model. It is a common practice to scale the result by π in order to match the intrinsic linewidth ( Δ υ i n t ) with what would be the 3 dB linewidth if the lineshape was Lorentzian (white frequency noise) [16]. The phase noise PSD can be obtained by simply dividing the frequency noise PSD by f 2 .
If the frequency noise PSD is known, the optical spectrum can be calculated as the Fourier transform of the autocorrelation function [5]:
S υ ( Δ υ ) = F [ R ( τ ) ] F exp 2 ( π τ ) 2 0 S υ ( f ) sin ( π f τ ) π f τ 2 d f
where S υ ( Δ υ ) is the optical spectral density, Δ υ = υ υ 0 is the optical frequency measured with laser frequency υ 0 as a reference, and S υ ( f ) is the frequency noise PSD.
Figure 2 shows how the 3 dB linewidth of a laser changes as a function of each of the five parameters of the model. Each parameter is swept while leaving all others fixed. On the five upper plots in Figure 2, the red curve shows the FM PSD ( π S υ ( f ) ) at the start of the sweep, while the blue curve shows it at the end point of the sweep. The lower plots show the measured 3 dB linewidth as a function of each parameter under the sweep range. For Δ υ i n t , we can observe a linear relation with respect the S υ ( Δ υ ) . This is due to the fact that this parameter scales the amount of white frequency noise evenly throughout the FM noise spectrum. In case of Δ υ ( 1 / f ) , the 3 dB linewidth scales with the Δ υ ( 1 / f ) . As for f R , K and α parameters, there is no impact on laser linewidth for the values under study.
1 / f frequency noise has a large impact on laser linewidth, but low impact on system performance when exhibited by the transmitter laser [17,18,19,20]. However, the implications of f R , K and α of a semiconductor laser having no impact on its linewidth are major when considering how the optical communications community benchmarks CPR algorithms. This is usually reported as a penalty versus the laser linewidth times the symbol period. This has worked well for ECL lasers where the FM PSD is approximately flat up to the receiver bandwidth, in which case we obtain a lorenztian lineshape where the 3 dB linewidth scales linearly with the level of white frequency noise (as shown in the first sweep of Figure 2). However, when taking into account the carrier induced frequency noise of semiconductor lasers ( f R and K) this figure of merit no longer represents the amount of frequency noise, and hence phase noise in the system. Therefore, this paper is focused only on carrier induced frequency noise.

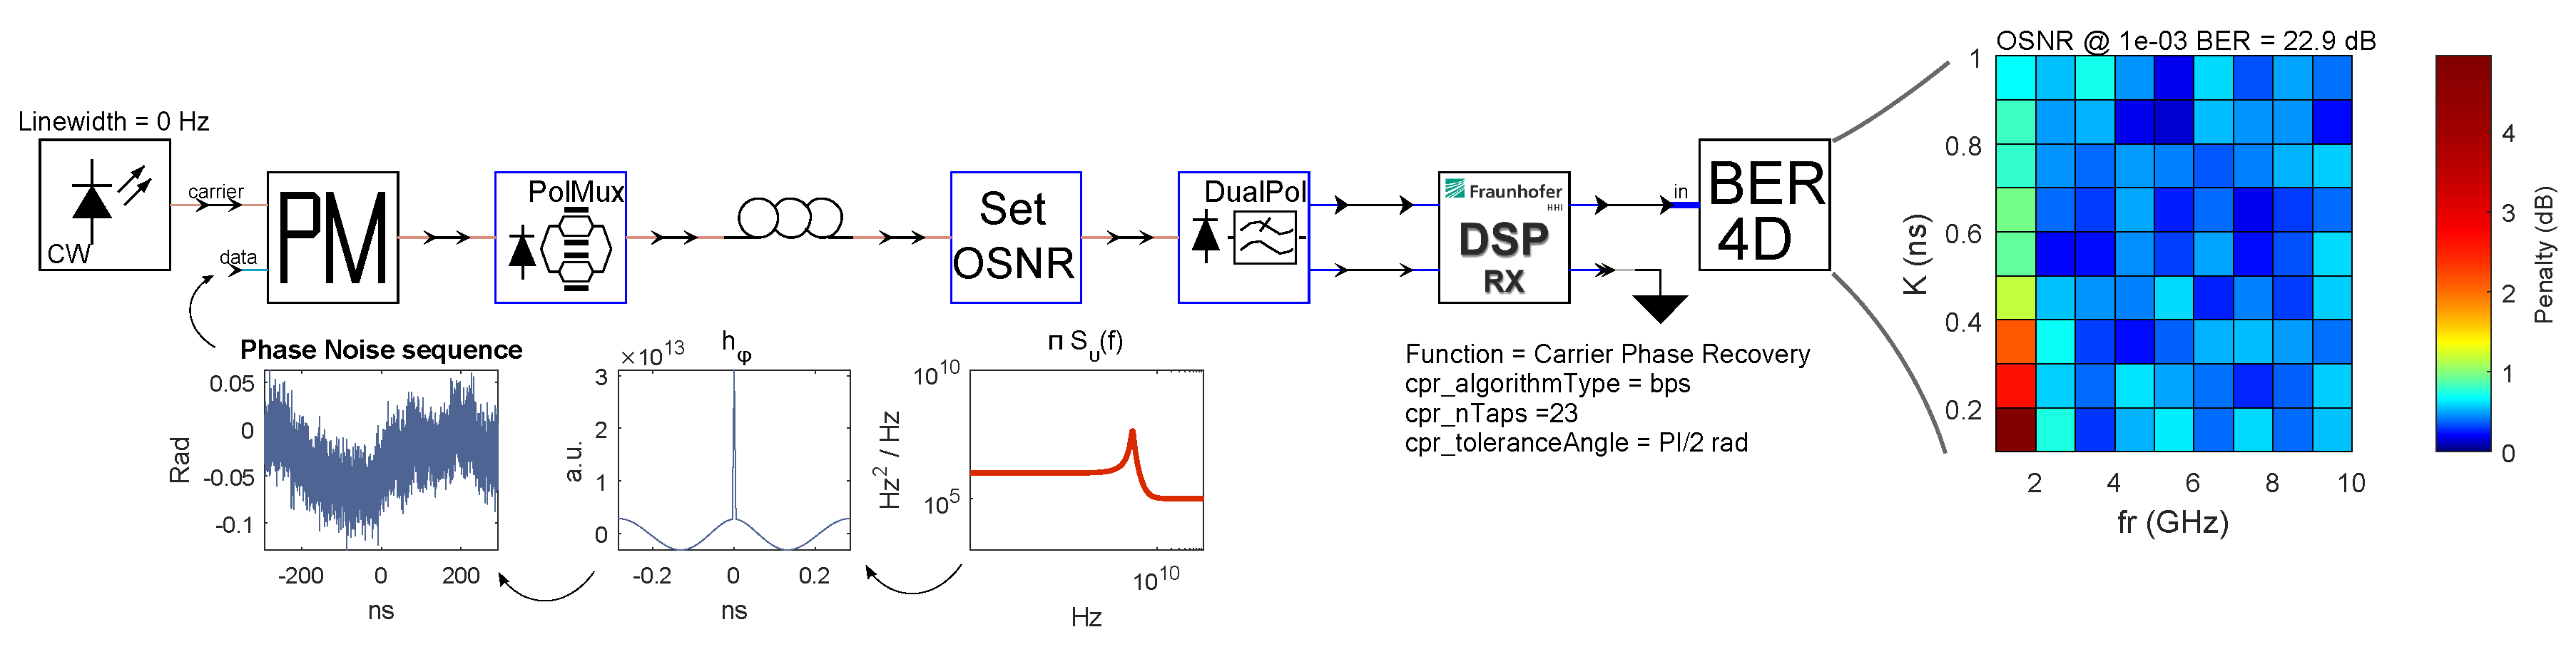
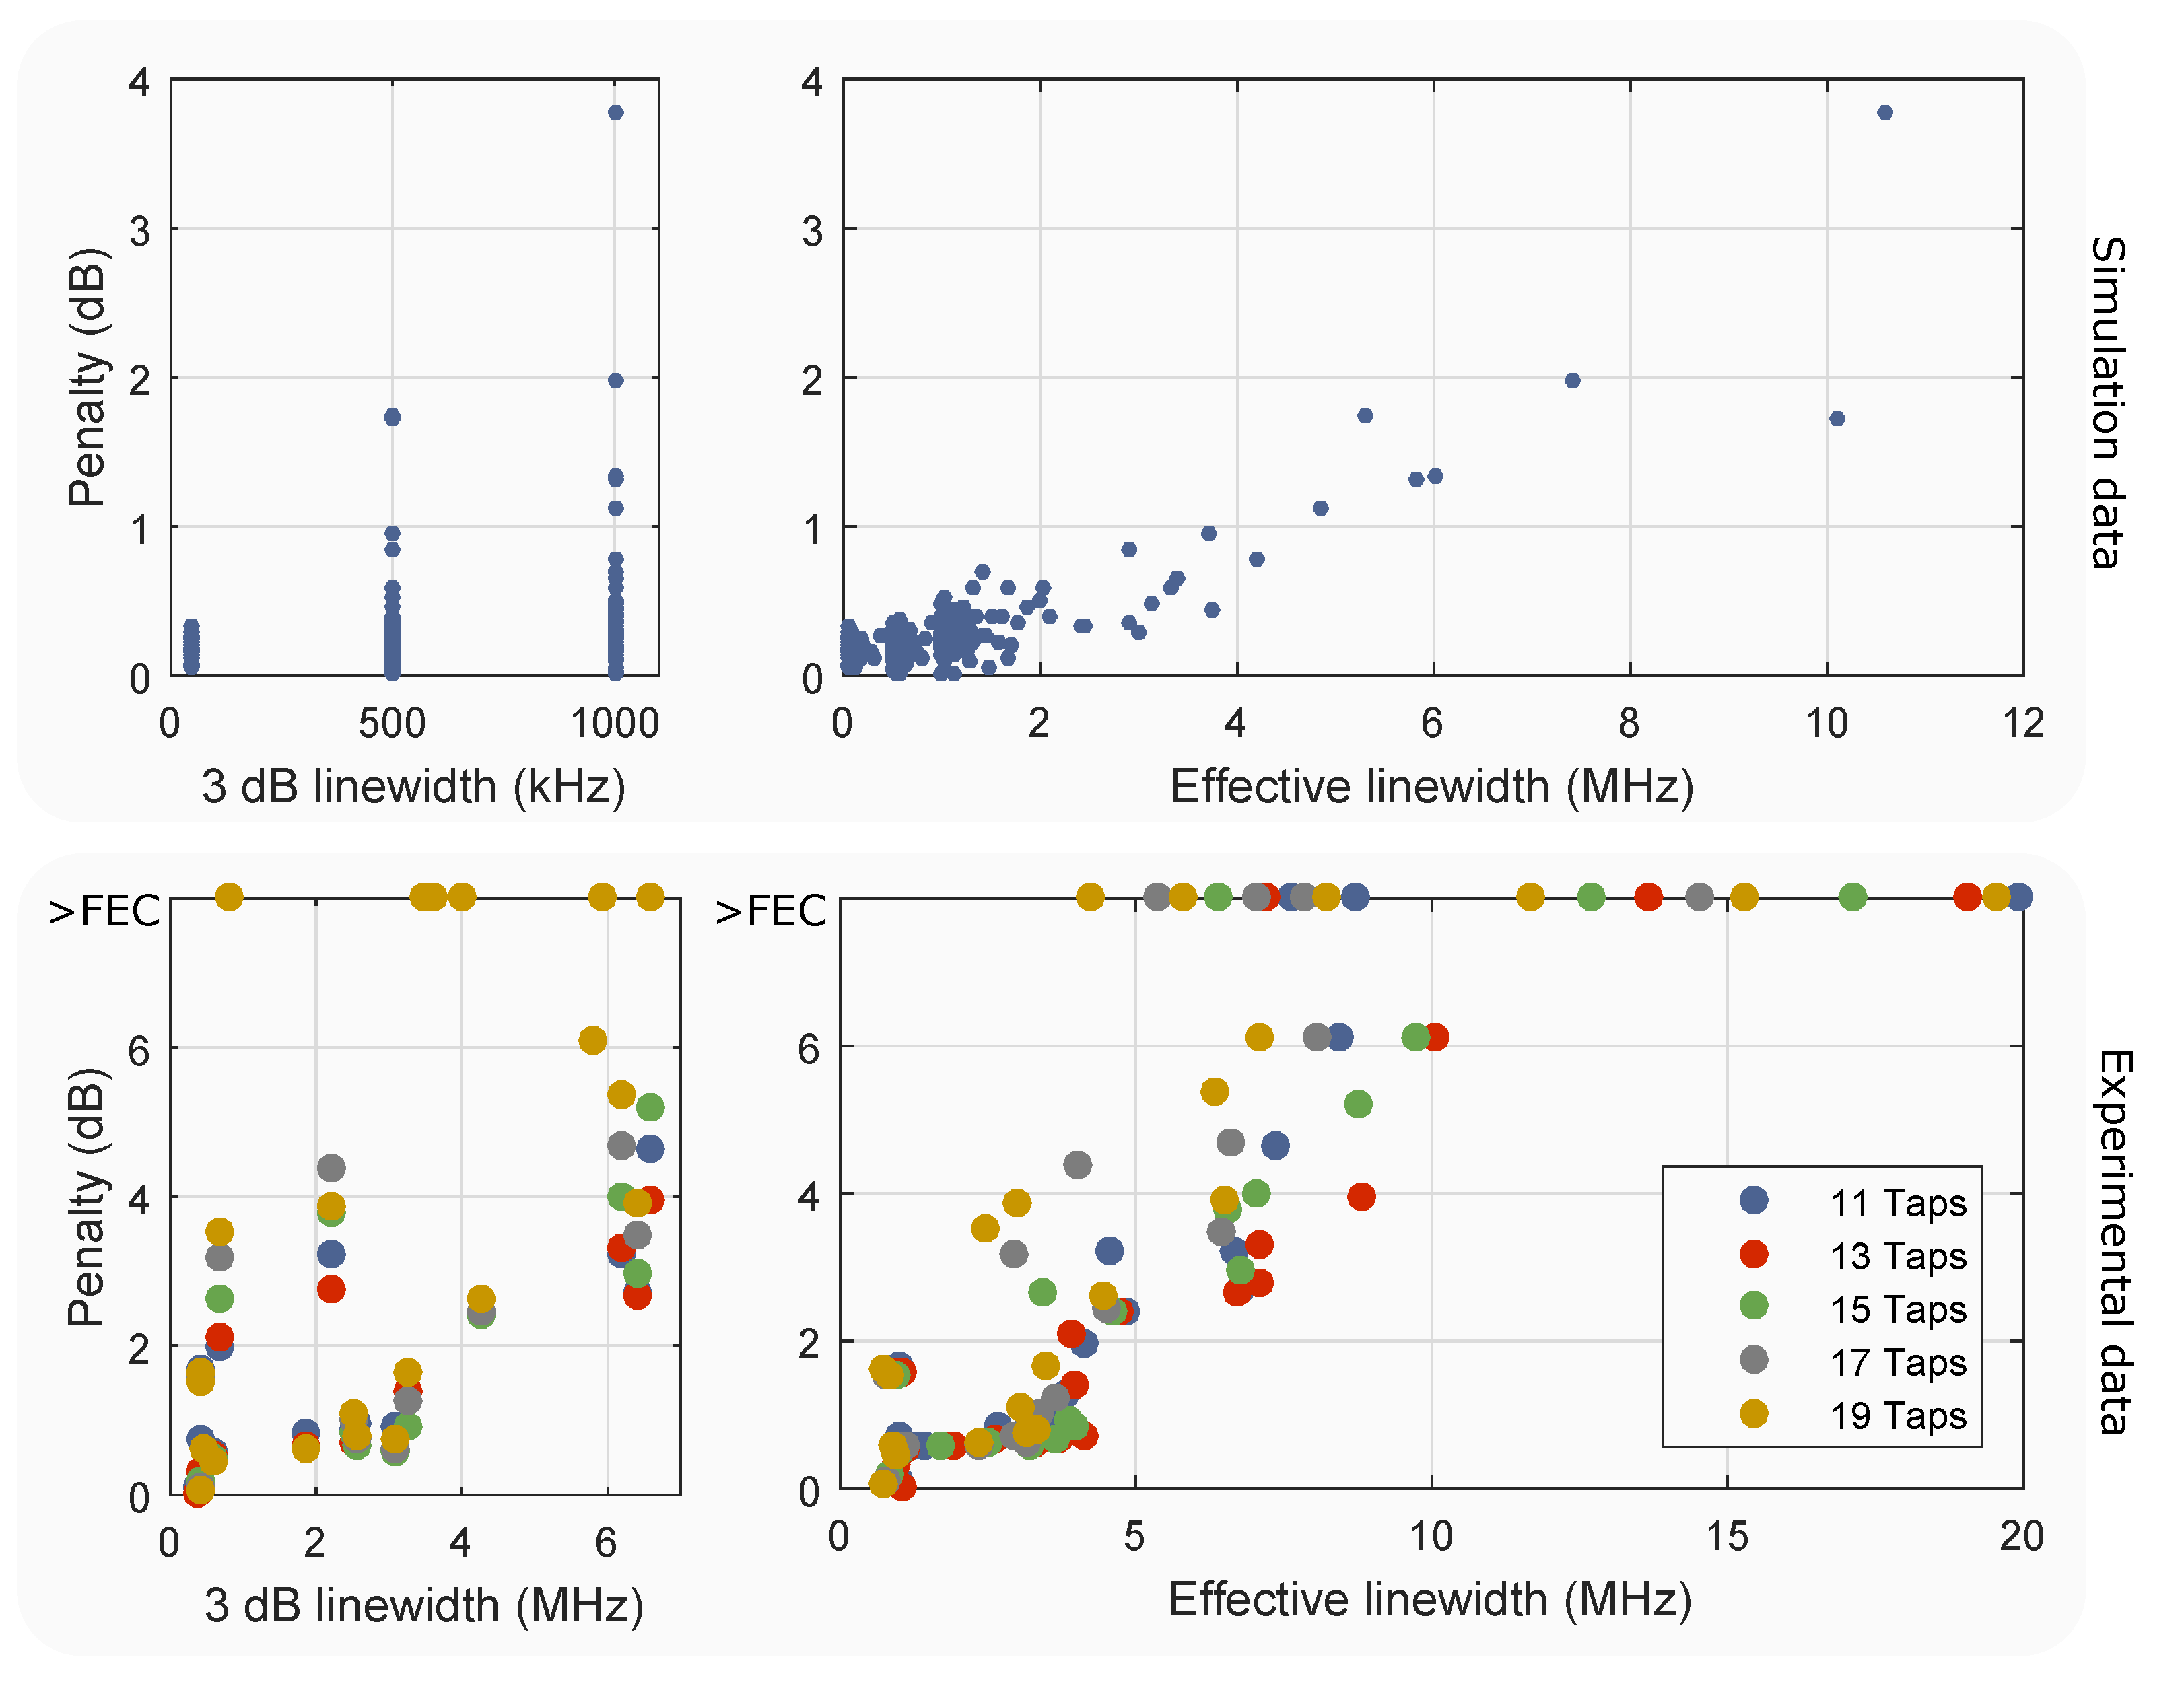
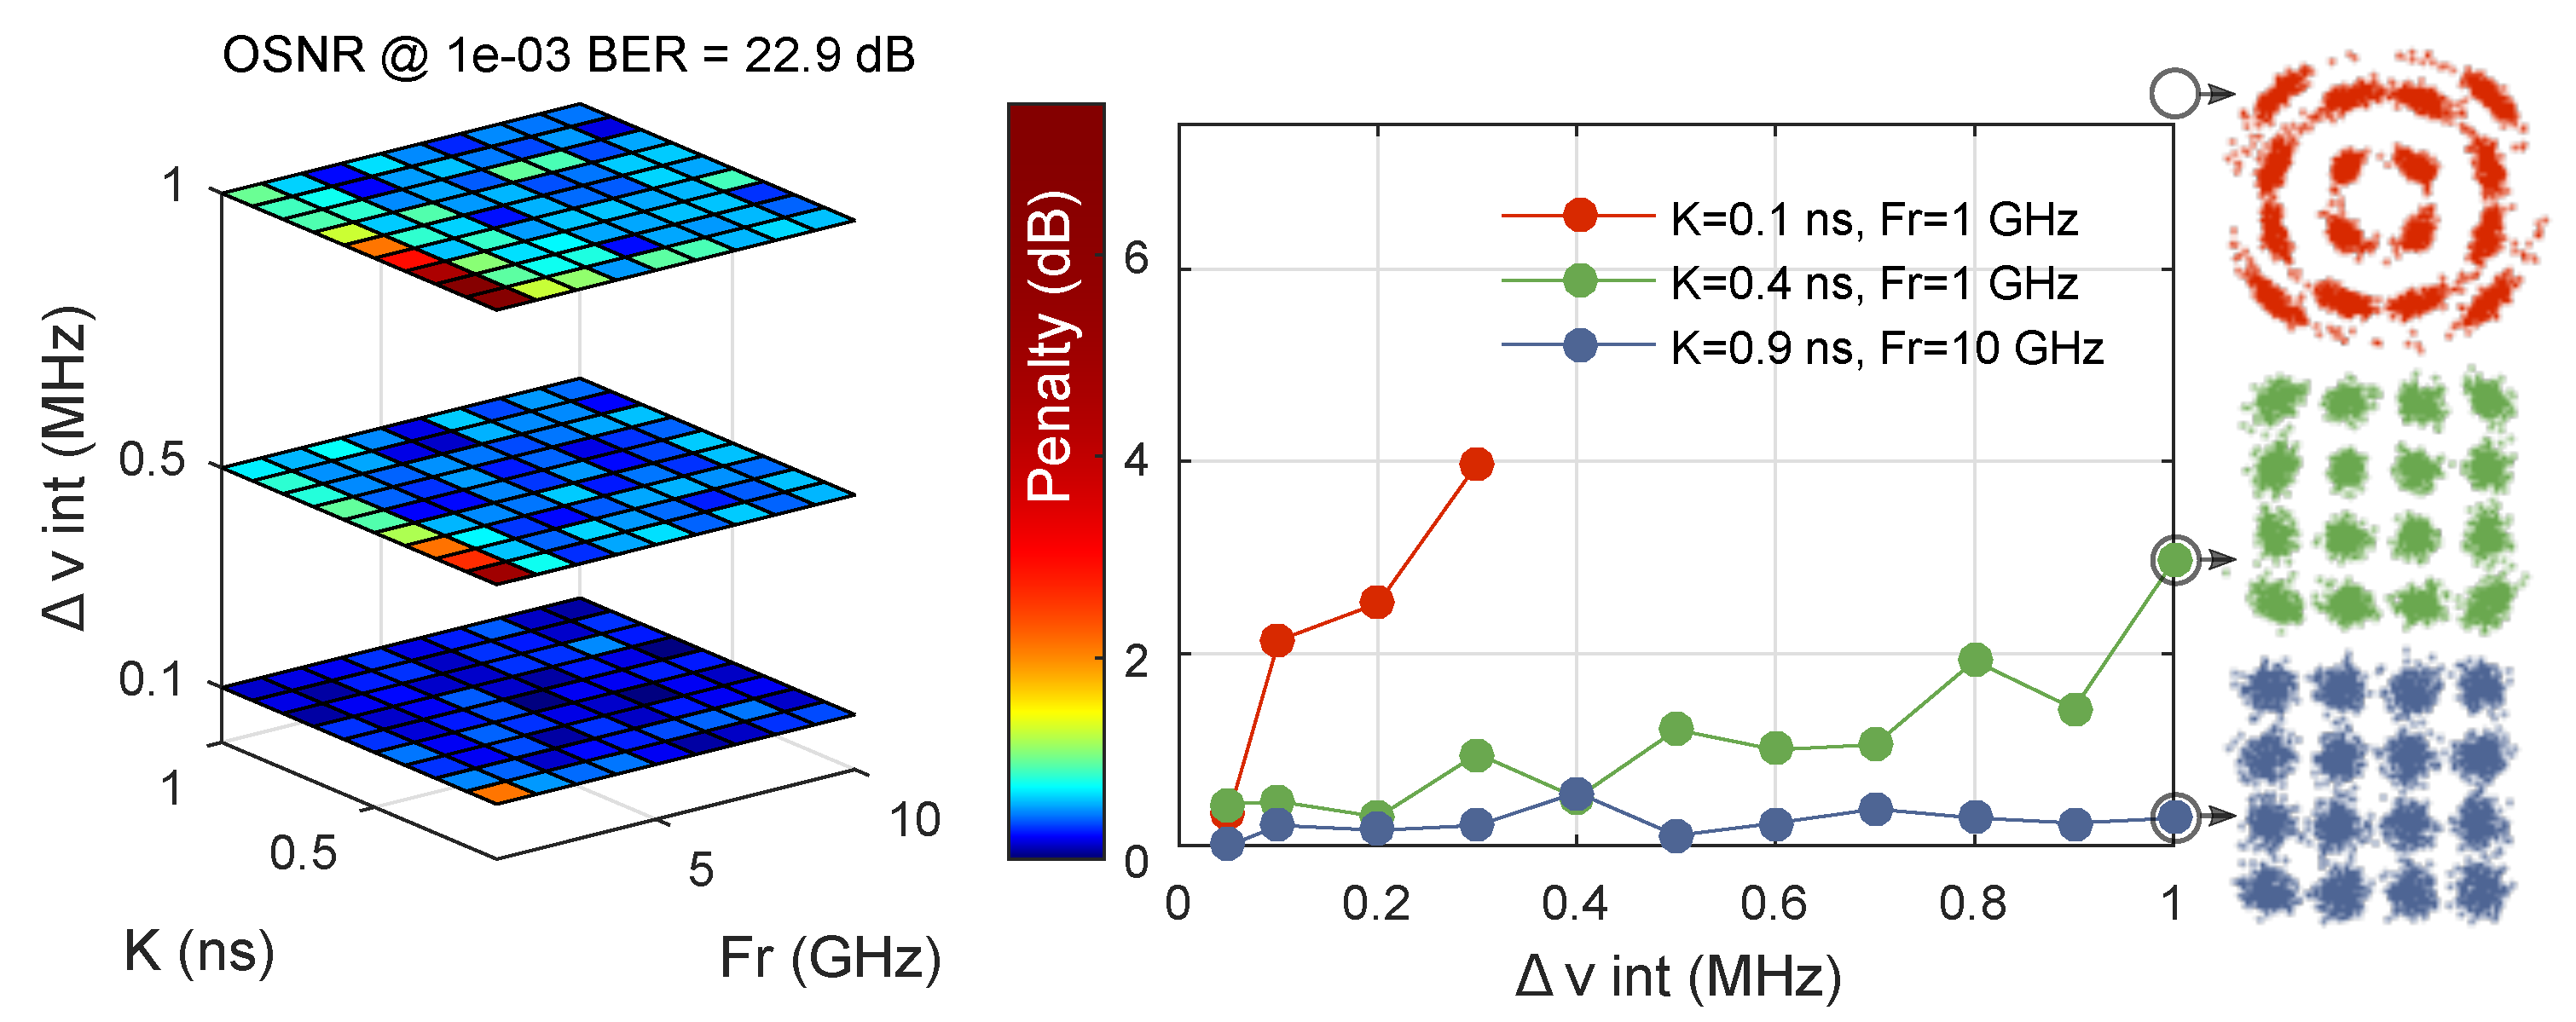
3. Impact on System Performance: Simulations

In this section we explore, by simulations, the impact of carrier induced frequency noise on system performance when a semiconductor laser is used in the transmitter module of an optical coherent link. This noise is mainly governed by the resonance frequency and the K-factor. We start by considering a laser with a lorentzian lineshape (flat spectral FM PSD). Figure 3 shows the simple schematic used in VPItransmissionMaker™ for this simulation. The transmitted signal is a 28 Gbaud dual polarization 16-level quadrature amplitude modulation (DP-16QAM) carrying a pseudo-random bit sequence (PRBS) of length 2 15 1 . In order ensure that only phase noise from the transmitter laser is present in the system, we model all of the components ideally, and set the standard single mode fiber (SSMF) length to 0. We use BPS algorithm for our CPR digital signal processing (DSP). We chose to implement BPS with 32 test phases, as it is found to be a good trade off between complexity and performance [21]. As expected, the penalty grows exponentially as the linewidth increases. We now proceed to include f R and K parameters. Figure 4 shows the modified setup. The dual polarization IQ modulator (PolMux module) now receives an ideal laser phase-modulated with a time-domain noise sequence. We calculate that sequence using Matlab®. To calculate that sequence, we first calculate the time-domain impulse response of the frequency model. This is obtained by the inverse Fourier transform of the square-root double sided FM PSD:
h f n = F 1 S υ ( f ) , F s / 2 > f > F s / 2
where F s is the sampling frequency. The obtained filter h f n is used to convolve an additive white gaussian noise (AWGN) sequence, which yields a time-domain frequency noise sequence f n = AWGN * h f n . Since the frequency is the derivative of the phase, a cumulative sum of the obtained frequency noise sequence scaled by 2 π / F s yields the L samples of the phase noise sequence:
p n i = k = 1 i 2 π F s f n k , i = 1 , 2 , 3 . . . L
which is used to phase-modulate the ideal laser, as illustrated in Figure 4. To evaluate the performance as a function of carrier induced frequency noise, we calculated 100 phase noise waveforms with K-factor on the range of 0.1 to 0.9 ns and resonance frequencies on the range of 1 to 10 GHz, while maintaining an intrinsic linewidth Δ υ i n t = 500 kHz. The color plot shown in Figure 4 now substitutes the classical Penalty vs. Linewidth (e.g., Figure 3), where the linewidth axis has been split into x and y, and the penalty is represented as a color. Penalties as high as 4.5 dB occur for the lowest values of K and F r . Note that, for the entire xy plane, the laser linewidth would still be calculated as 500 kHz. This is an important result because it proves that carrier induced frequency noise plays a role in system performance. To further investigate its implications, we proceed include different values of Δ υ i n t as well: 50, 500 and 1000 kHz. We therefore need a volumetric color plot to represent the obtained penalties, as shown in Figure 5.
Figure 5 shows the simulated penalty due to carrier induced frequency noise for different levels of intrinsic linewidth ( Δ υ i n t ). Since there is no 1 / f noise, that would be the reported 3 dB linewidth of the laser. We continue to observe higher penalties as we approach lower values of K and F r values. It becomes apparent that K factor plays a more important role than F r ; however, both penalties are significantly diminished when F r is higher than 1 GHz. We also observe that the evolution of carrier induced frequency noise penalty scales proportional to Δ υ i n t . For the case of F r = 1 GHz and K = 0.1 ns, the recovered signal is above bit error rate (BER) of 10 3 for values of Δ υ i n t higher than 300 kHz. The red constellation corresponds to the point F r = 1 GHz, K = 0 . 1 ns and Δ υ i n t = 10 MHz, and shows how important carrier induced frequency noise can be.

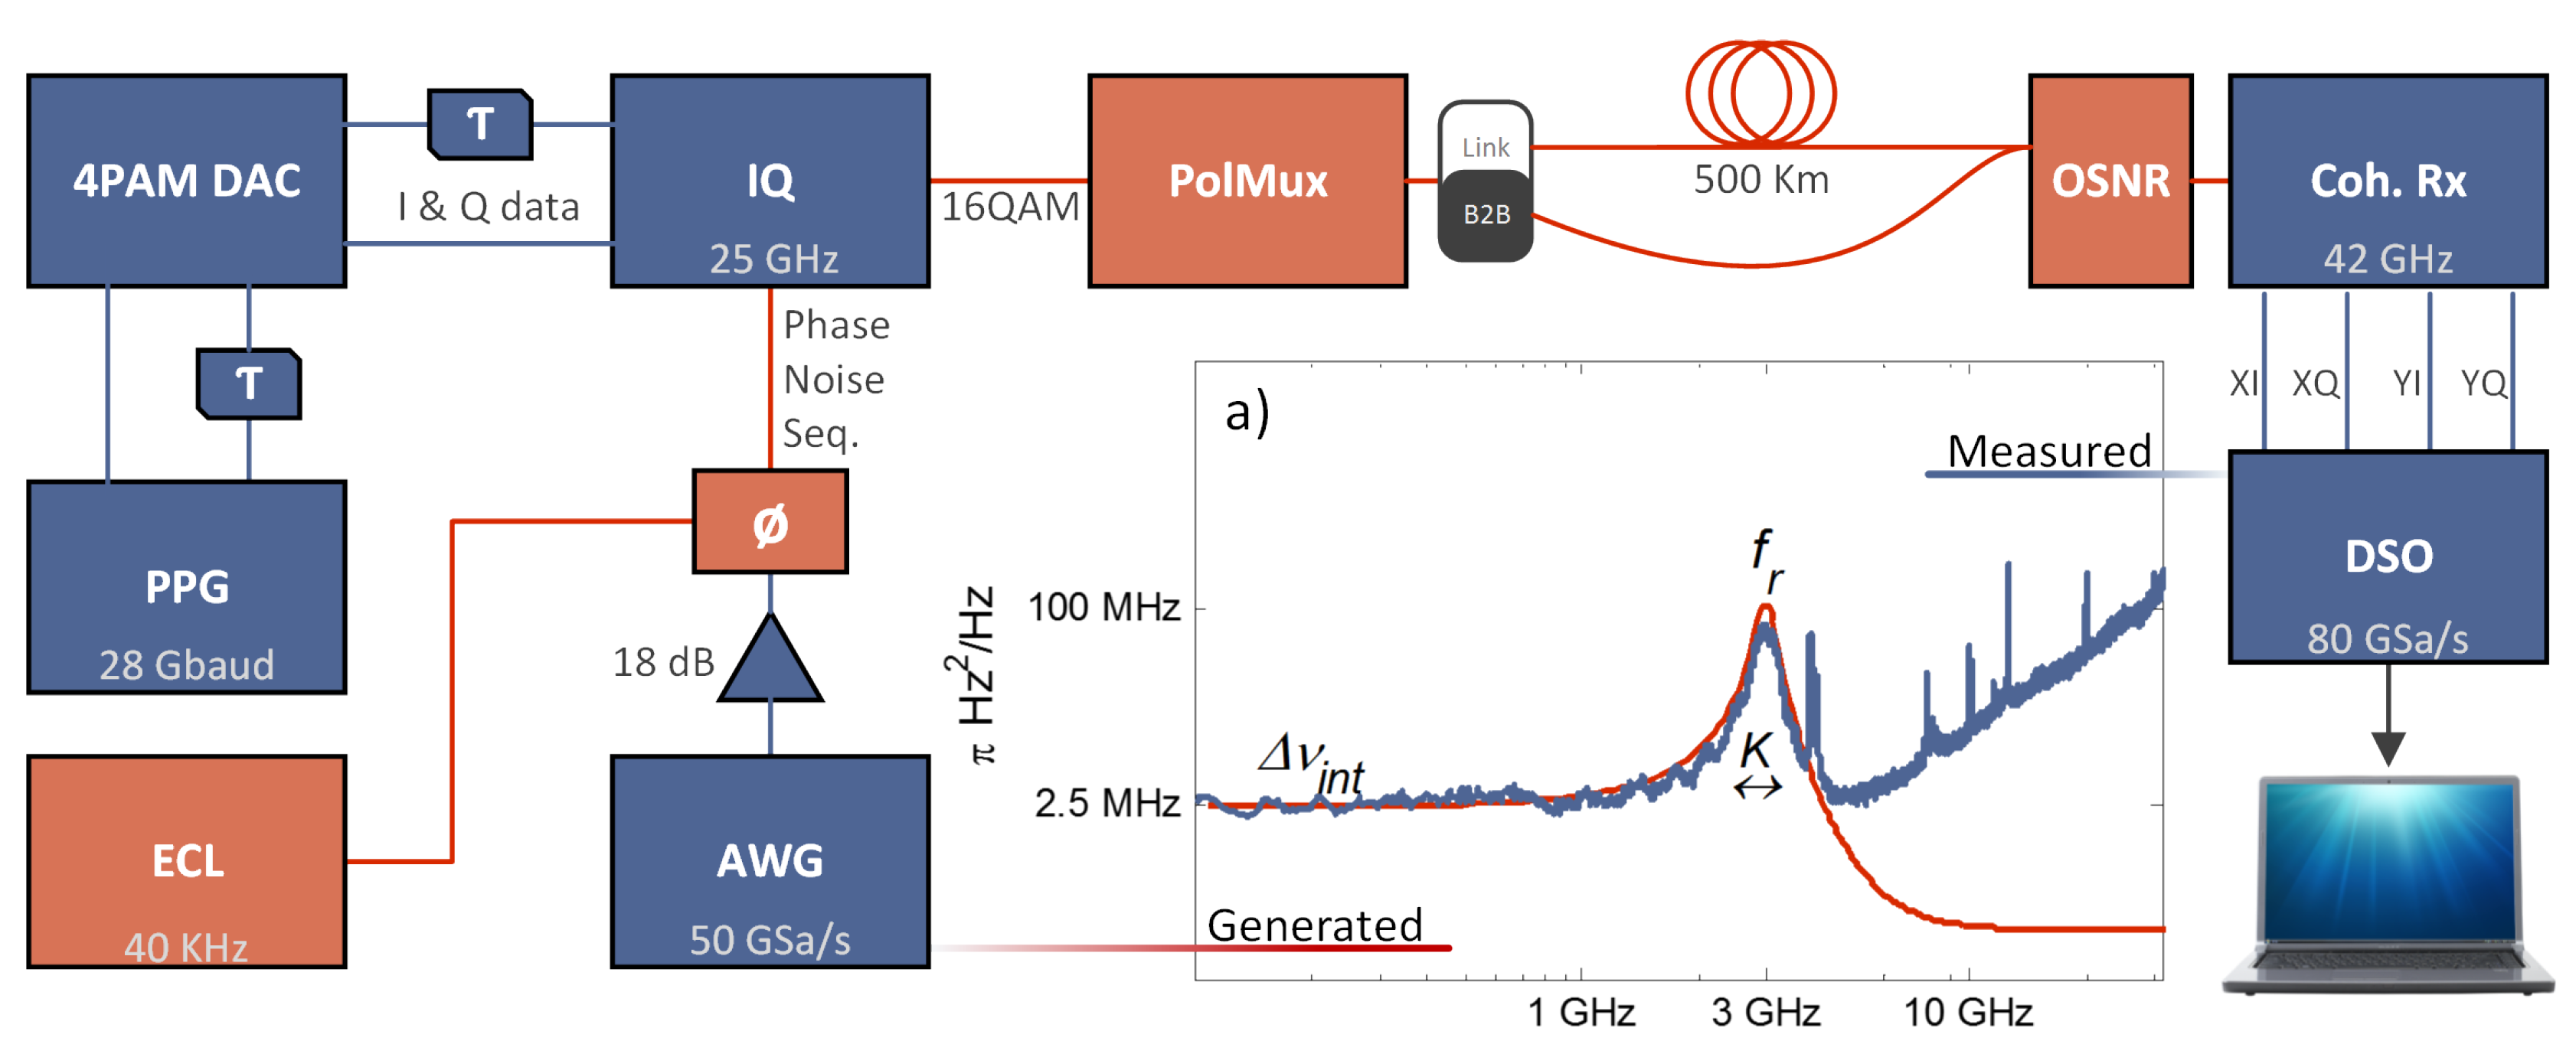
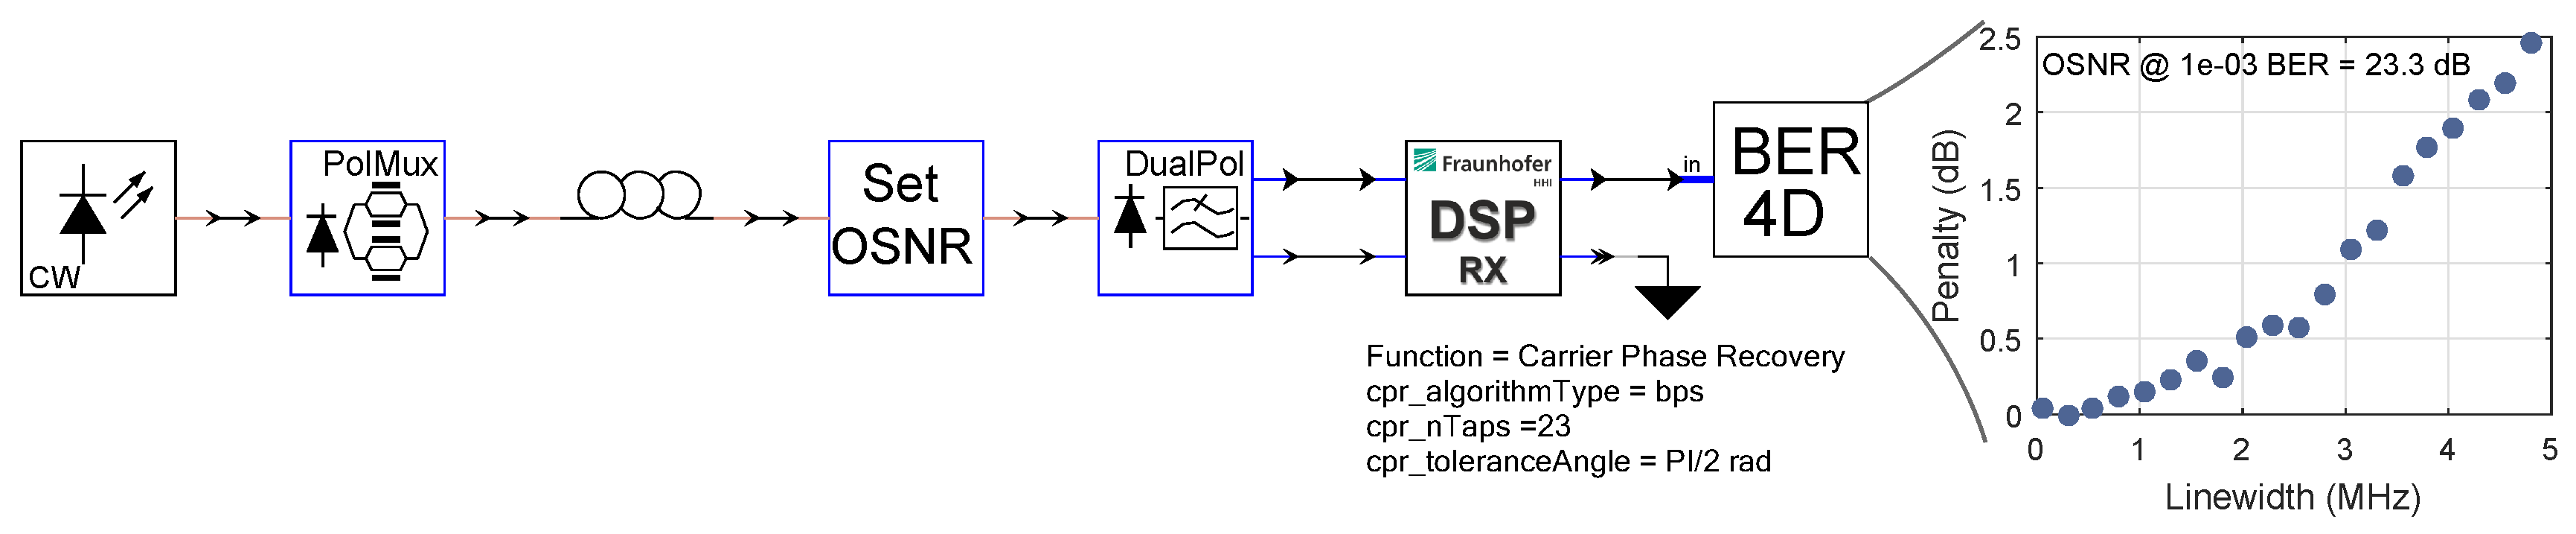
4. Impact On System Performance: Experiment

This section expands on the results published in [13], where carrier induced frequency noise was experimentally investigated using a variety of CPR algorithms. In this paper, we focus on BPS algorithm and compare system performance for different number of taps. Figure 6 shows the experimental setup. The transmitter consists of a pulse pattern generator (PPG), a 4 levels amplitude modulation (PAM) generator, and an optical IQ modulator. A LiNbO3 phase modulator is used to manipulate the frequency PSD of an external cavity laser, as illustrated in the Figure 6a. The receiver consists of an integrated coherent receiver, an ECL and a digital storage oscilloscope (DSO). Data demodulation is performed offline using standard DSP algorithms as described in [22]. The CPR algorithm used is again BPS [21]. More details about the experimental setup can be found in [13].
Results for back to back (B2B) are shown in Figure 7. We use the same volumetric plot as in Section 3 to represent the penalty vs. carrier induced frequency noise. 27 semiconductor lasers were emulated corresponding to each point in the volumetric plots. The receiver sensitivity is set to 21.7 dB for a BER of 3 . 8 3 , which we use as forward error correction (FEC) threshold (As per guidelines given in ITU-T Recommendation G.975.1, Appendix I.9 (2004)). We evaluate the system performance for different tap-lengths of the BPS algorithm. We can observe the same tendency as in simulated results, where lower values of K and F r yield higher penalties. We found that the optimum number of taps is different depending on which frequency noise profile is considered, resulting from a different trade-off between OSNR and phase noise. Another interesting observation is that, for the lowest level of white frequency noise Δ υ i n t = 500 kHz, the lowest penalty is found at the center of the plane, ( F r = 3 GHz, K = 0.3 ns). For Δ υ i n t = 2.5 MHz, the lowest penalty is shifted to ( F r = 5 GHz, K = 0.3 ns). And for Δ υ i n t = 5 MHz, the lowest penalty is located at ( F r = 5 GHz, K = 0.6 ns). This trend holds true for all other configurations of the BPS algorithm, suggesting there may be an interplay between white frequency noise and carrier induced frequency noise.
When transmission is considered, we distinguish between two cases. The first, when the emulated laser is placed at the transmitter. The second, where the emulated laser is placed in the receiver, as a local oscillator. In both cases the transmission length was 520 km. In the first case, we observe negligible penalties overall, as dispersion was digitally corrected at the receiver and launch power was kept under the non-linear regime. Results for the second case are shown in Figure 8. Penalties are computed against the same OSNR value as in the B2B case: 21.74 dB. In this case, only results from a BPS configuration with 15 taps are shown, as the results are mostly independent of the number of taps used. This is due to nonlinear intermixing of the dispersed signal and the laser phase noise, through a process known as equalization enhanced phase noise (EEPN) [23], as illustrated by the constellations in Figure 8. In this case, we can observe that carrier induced frequency noise is most relevant at low frequencies. These results are in agreement with the findings published in [24], where it was shown that low frequency noise is critical for system performance when considering local oscillator (local oscillator (LO)) lasers. In this case, we observe a similar trend to the B2B case, with two significant differences: the first, penalties are augmented due to EEPN. Secondly, K plays a more important role, specially for higher levels of white frequency noise and even at high F r frequencies; as opposed to the B2B case. It is worth noting that the point ( F r = 3 GHz, K = 0.3 ns, Δ υ i n t = 5 MHz) is above FEC for the B2B case but can below FEC after 520 km of SSMF. This is because phase variance from the LO is shared among phase and amplitude noise after transmission, converting a random walk along the entire IQ plane into a random walk within a symbol cluster.

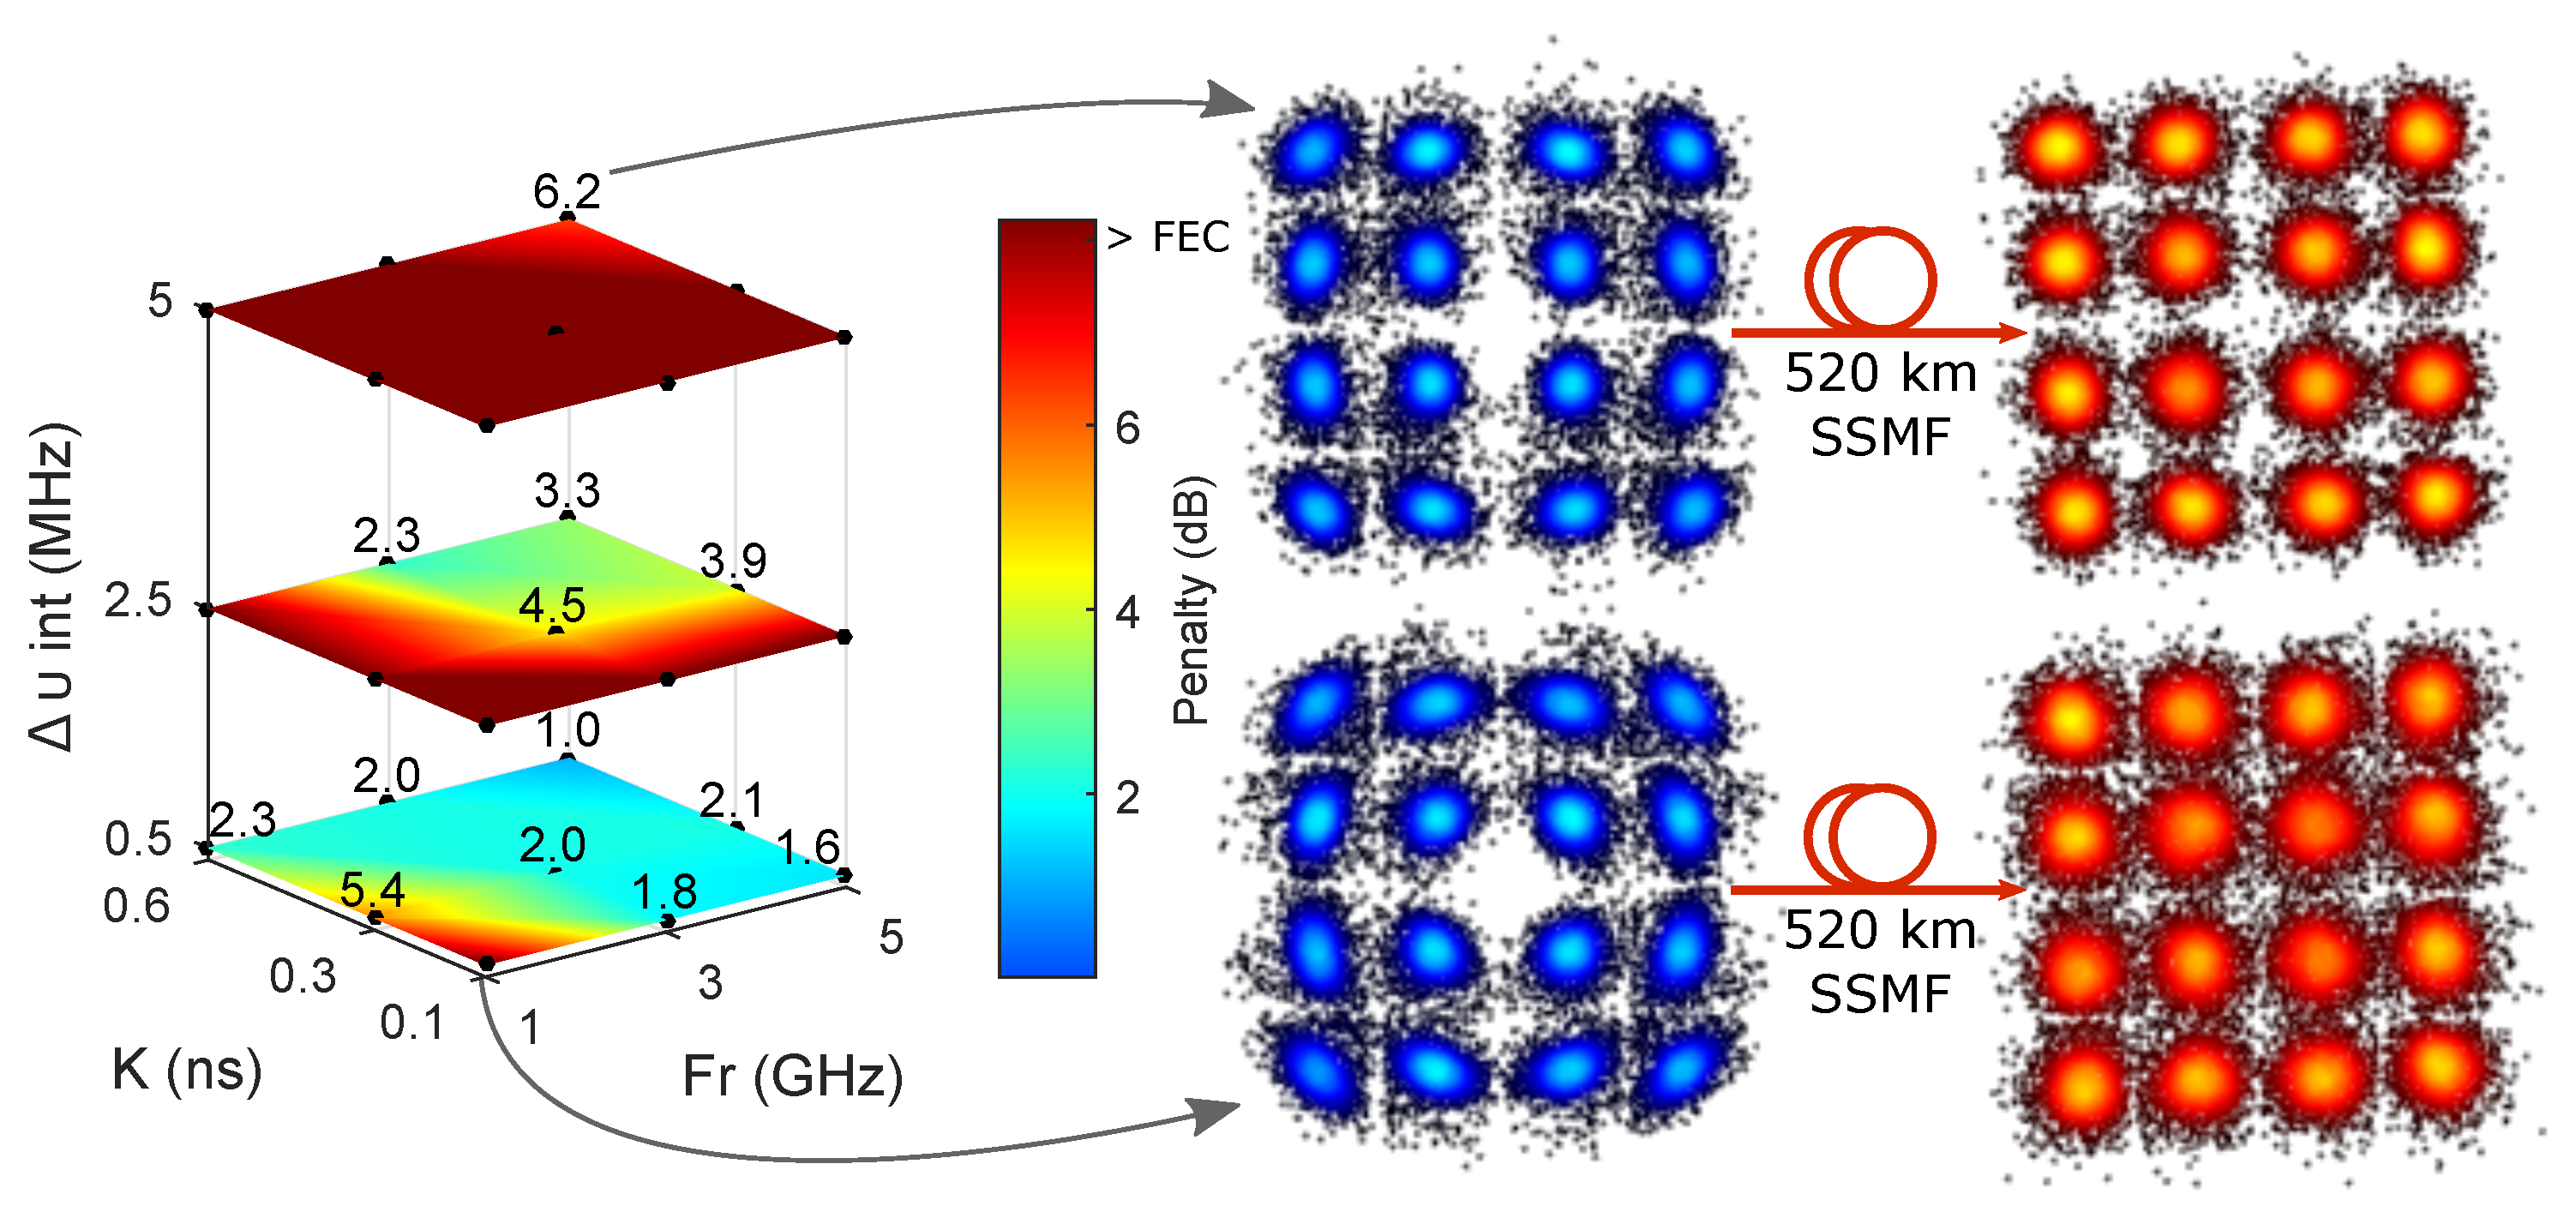
5. Effective Linewidth

We start with the variance of the phase difference between two consecutive symbols [25]:
ϕ ( t ) ϕ ( t T ) = 2 π t T t ν ( t ) d t = 2 π ν ( t ) h ( t t ) d t = 2 π ν ( t ) * h ( t )
where h ( t ) = 1 for 0 < t < T and T is the symbol period. The phase variance is then:
σ Δ ϕ 2 = S Δ ϕ ( f ) d f = 4 π 2 0 H ( f ) 2 S F M ( f ) d f = 4 π 2 T 2 0 sin π f T π f T 2 S F M ( f ) d f
We then define the Effective Linewidth as:
Δ ν e f f = 2 π N T f c r o s s f s / 2 sin π f N T π f N T 2 S F M ( f ) d f
where f c r o s s is the frequency at which 1 / f noise crosses the level of intrinsic linewidth Δ υ i n t , and f s is the sampling rate of the analog to digital converter (ADC). The variable N is the number of symbols used by the CPR algorithm for phase averaging. This is introduced because a CPR algorithm (e.g., BPS) averaging over N symbols (taps), will effectively act as a low pass filter. Therefore, 1 / N T is the bandwidth seen by the digital coherent receiver using N taps for the BPS filter length. If a decision directed phase lock loop (DDPLL) was used instead, 1 / N T should be replaced by the equivalent feedback loop bandwidth. Equation (5) basically represents the area under the curve determined by the FM PSD, up to the aforementioned bandwidth, and excluding 1 / f noise.
Figure 9 shows the calculated effective linewidth for the system described in Section 4 where the CPR algorithm assumes 17 taps. The left and right figures illustrate how the effective linewidth was calculated on experimental data. In all cases, a lower cut-off frequency of 40 MHz was used to avoid integrating over 1 / f noise, an issue that requires further investigations. We can again observe the same tendencies as in Figure 7. When K and F r are highest and the frequency noise is almost flat, the effective linewidth is very close to the 3 dB linewidth. However, when the resonance peak is within the integrating area, for Δ υ i n t = 500 kHz, the effective linewidth rises to 20.6 MHz, which explains the high BERs obtained in Figure 7. Figure 10 shows penalty vs. linewidth and transmitter laser effective linewidth on both simulated and experimental data from Section 3 and Section 4 respectively. In both cases the induced phase noise is at the transmitter laser. We can clearly observe a strong correlation of penalty vs. effective linewidth, while this is not the case when comparing to the 3 dB linewidth.

6. Conclusions

The discordant relation between laser linewidth and system performance has been demonstrated. We have shown that, when considering semiconductor lasers, 3 dB linewidth is not a good figure of merit for CPR benchmarking. We have proposed an alternative figure of merit for the transmitter laser based on a phenomenological model of carrier induced frequency noise and system experiments of the induced penalty as a function of the laser resonance frequency and damping. Our proposed effective linewidth characterizes the laser frequency noise seen by the digital receiver more accurately than the conventional 3 dB linewidth. We show that this figure of merit is simple to calculate and can be used to properly benchmark CPR algorithms, while being compatible with 3 dB linewidth when no carrier induced frequency noise is present. Note that neither the effective linewidth nor the 3 dB linewidth can be linked to system performance when considering LO lasers, as the dependence between resonance frequency, damping and EEPN requires further studies. Other future efforts in this line of research should focus on the interplay with 1 / f (flicker) noise, effective linewidth and system performance.

Acknowledgments

Project GRIFFON, gr. #324391, the Villum Foundation Young Investigator program, and the Swedish Institute (SI) are acknowledged. The equipment was funded by Knut and Alice Wallenberg foundation.

Author Contributions

Miguel Iglesias and Richard Schatz conceived the main idea; Miguel Iglesias, Xiaodan Pang and Oskars Ozolins performed the experiments; Hadrien Louchet helped design the simulations and analyze the data; Darko Zibar, Gunnar Jacobsen, Idelfonso T. Monroy and Sergei Popov provided constant supervision; Miguel Iglesias wrote the paper.

Conflicts of Interest

The authors declare no conflict of interest.

References

  1. Gallion, P.; Debarge, G. Quantum phase noise and field correlation in single frequency semiconductor laser systems. IEEE J. Quantum Electron. 1984, 20, 343–349. [Google Scholar] [CrossRef]
  2. Navarro, J.R.; Kakkar, A.; Pang, X.; Ozolins, O.; Schatz, R.; Olmedo, M.I.; Jacobsen, G.; Popov, S. Carrier phase recovery algorithms for coherent optical circular mQAM systems. J. Lightwave Technol. 2016, 34, 2717–2773. [Google Scholar] [CrossRef]
  3. Zibar, D.; Carvalho, L.; Piels, M.; Doberstein, A.; Diniz, J.; Nebendahl, B.; Franciscangelis, C.; Estaran, J.; Haisch, H.; Gonzalez, N.G.; et al. Bayesian filtering for phase noise characterization and carrier synchronization of up to 192 Gb/s PDM 64-QAM. In Proceedings of the 2014 European Conference on Optical Communication (ECOC), Cannes, France, 21–25 September 2014; pp. 1–3.
  4. Sun, H. Clock and carrier recovery for coherent receivers. In Proceedings of the 2015 European Conference on Optical Communication (ECOC), Valencia, Spain, 27 September–1 October 2015; pp. 1–3.
  5. Di Domenico, G.; Schilt, S.; Thomann, P. Simple approach to the relation between laser frequency noise and laser line shape. Appl. Opt. 2010, 49, 4801–4807. [Google Scholar] [CrossRef] [PubMed]
  6. Chraplyvy, A.; Liou, K.; Tkach, R.; Eisenstein, G.; Jhee, Y.; Koch, T.; Anthony, P.; Chakrabarti, U. Simple narrow-linewidth 1.5 μm InGaAsP DFB external-cavity laser. Electron. Lett. 1986, 22, 88–90. [Google Scholar] [CrossRef]
  7. Kikuchi, K.; Okoshi, T. Measurement of FM noise, AM noise , and field spectra of 1.3 μm InGaAsP FB lasers and determination of the linewidth enhancement factor. IEEE J. Quantum Electron. 1985, 21, 1814–1818. [Google Scholar] [CrossRef]
  8. Shi, K.; Smyth, F.; Anandarajah, P.M.; Reid, D.; Yu, Y.; Barry, L.P. Linewidth of SG-DBR laser and its effect on DPSK transmission. Opt. Commun. 2010, 283, 5040–5045. [Google Scholar] [CrossRef]
  9. Bartholf, F.; Chang, P. Cost effective metro photonics enabled by coherent optics. In Proceedings of the Optical Fiber Communication Conference, Los Angeles, CA, USA, 22–26 March 2015; Optical Society of America: Washington, DC, USA, 2015. [Google Scholar]
  10. Ciena. WaveLogic Photonics Coherent Select; Technical Report; Ciena Corporation: Hanover, MD, USA, 2015. [Google Scholar]
  11. Schmitt, A. 100G+ Coherent Optical Equipment Ports; Technical Report; IHS Infonetics: Douglas County, CO, USA, 2015. [Google Scholar]
  12. Olmedo, M.I.; Pang, X.; Udalcovs, A.; Schatz, R.; Zibar, D.; Jacobsen, G.; Popov, S.; Monroy, I.T. Impact of carrier induced frequency noise from the transmitter laser on 28 and 56 Gbaud DP-QPSK metro links. In Proceedings of the Asia Communications and Photonics Conference, Shanghai, China, 11–14 November 2014.
  13. Olmedo, M.I.; Pang, X.; Piels, M.; Schatz, R.; Jacobsen, G.; Popov, S.; Monroy, I.T.; Zibar, D. Carrier recovery techniques for semiconductor laser frequency noise for 28 Gbd DP-16QAM. In Proceedings of the Optical Fiber Communication Conference, Los Angeles, CA, USA, 22–26 March 2015.
  14. Olmedo, M.I.; Pang, X.; Schatz, R.; Zibar, D.; Jacobsen, G.; Popov, S.; Monroy, I.T. Digital signal processing approaches for phase noise tolerant coherent transmission systems. Opt. Metro Netw. Short Haul Syst. 2015. [Google Scholar] [CrossRef] [Green Version]
  15. Piels, M.; Olmedo, M.I.; Xue, W.; Pang, X.; Schaffer, C.; Schatz, R.; Jacobsen, G.; Monroy, I.T.; Mork, J.; Popov, S.; et al. Laser rate equation-based filtering for carrier recovery in characterization and communication. J. Lightwave Technol. 2015, 33, 3271–3279. [Google Scholar] [CrossRef]
  16. Huynh, T.N.; Nguyen, L.; Barry, L.P. Phase noise characterization of SGDBR lasers using phase modulation detection method with delayed self-heterodyne measurements. J. Lightwave Technol. 2013, 31, 1300–1308. [Google Scholar] [CrossRef]
  17. Kikuchi, K. Impact of 1/f-type FM noise on coherent optical communications. Electron. Lett. 1987, 23, 885–887. [Google Scholar] [CrossRef]
  18. Kikuchi, K. Effect of 1/f-type FM noise on semiconductor-laser linewidth residual in high-power limit. IEEE J. Quantum Electron. 1989, 25, 684–688. [Google Scholar] [CrossRef]
  19. Mercer, L. 1/f frequency noise effects on self-heterodyne linewidth measurements. J. Lightwave Technol. 1991, 9, 485–493. [Google Scholar] [CrossRef]
  20. Matsuda, K.; Bessho, H.; Hasegawa, K.; Yoshida, T.; Ishida, K. A study of laser white and brownian FM noise in coherent QPSK signals. In Proceedings of the Optical Fiber Communication Conference, San Francisco, CA, USA, 9–13 March 2014.
  21. Pfau, T.; Hoffmann, S.; Noe, R. Hardware-efficient coherent digital receiver concept with feedforward carrier recovery for M-QAM constellations. J. Lightwave Technol. 2009, 27, 989–999. [Google Scholar] [CrossRef]
  22. Borkowski, R.; Zibar, D.; Tafur Monroy, I. Anatomy of a digital coherent receiver. IEICE Trans. Commun. 2014, 97, 1528–1536. [Google Scholar] [CrossRef]
  23. Kakkar, A.; Navarro, J.R.; Schatz, R.; Louchet, H.; Pang, X.; Ozolins, O.; Jacobsen, G.; Popov, S. Comprehensive study of equalization-enhanced phase noise in coherent optical systems. J. Lightwave Technol. 2015, 33, 4834–4841. [Google Scholar] [CrossRef]
  24. Kakkar, A.; Ozolins, O.; Navarro, J.R.; Pang, X.; Olmedo, M.I.; Schatz, R.; Louchet, H.; Jacobsen, G.; Popov, S. Design of coherent optical systems impaired by EEPN. In Proceedings of the Optical Fiber Communication Conference, Anaheim, CA, USA, 20–22 March 2016.
  25. Kikuchi, K. Characterization of semiconductor-laser phase noise and estimation of bit-error rate performance with low-speed offline digital coherent receivers. Opt. Express 2012, 20, 5291–5302. [Google Scholar] [CrossRef] [PubMed]
Figure 1. Left: Frequency noise power spectral density (PSD) for Δ υ ( 1 / f ) = 10 kHz, Δ υ i n t = 100 kHz, f R = 5 GHz, K = 0 . 3 ns and α = 3 . Right: Optical spectrum calculated from Equation (2).
Photonics 03 00039 g001
Figure 2. Impact of model parameters on 3 dB linewidth for each parameter of the model (Equation (1)). The upper plots show the spectral shape of the requency modulation (FM) noise at the start (red) and the end (blue) of the sweep.
Photonics 03 00039 g002
Figure 3. Simulation setup for a lorentzian laser.
Photonics 03 00039 g003
Figure 4. Simulation setup for a semiconductor laser.
Photonics 03 00039 g004
Figure 5. Simulation results for carrier induced frequency noise from transmitter laser.
Photonics 03 00039 g005
Figure 6. Experimental Setup: inset (a) shows the power spectral densities for emulated and measured frequency noise.
Photonics 03 00039 g006
Figure 7. Experimental results for B2B.
Photonics 03 00039 g007
Figure 8. Experimental results for transmission when phase noise comes from local oscillator (LO) laser.
Photonics 03 00039 g008
Figure 9. Calculations of effective linewidth on experimental data for 17 carrier-phase recovery (CPR) taps.
Photonics 03 00039 g009
Figure 10. Comparison of system penalty vs. 3 dB linewidth (left) and effective linewidth (right).
Photonics 03 00039 g010

