Article

Optical Nanofiber Integrated into Optical Tweezers for In Situ Fiber Probing and Optical Binding Studies †

by
Ivan Gusachenko
1,
Viet Giang Truong
1,
Mary C. Frawley
1,2 and
Síle Nic Chormaic
1,*
1
Light-Matter Interactions Unit, Okinawa Institute of Science and Technology Graduate University, Onna, Okinawa 904-0495, Japan
2
Physics Department, University College Cork, Cork, Ireland
*
Author to whom correspondence should be addressed.
This paper is an extended version of our paper published in Proc. SPIE 9164, Optical Trapping and Optical Micromanipulation XI; Ivan Gusachenko, Mary C. Frawley, Viet. G. Truong and Síle Nic Chormaic, “Optical Nanofiber Integrated into an Optical Tweezers for Particle Manipulation and in-Situ Fiber Probing”, 91642X (16 September 2014); doi:10.1117/12.2061442.
Photonics 2015, 2(3), 795-807; https://doi.org/10.3390/photonics2030795
Submission received: 5 June 2015 / Revised: 29 June 2015 / Accepted: 29 June 2015 / Published: 2 July 2015
(This article belongs to the Special Issue Optical Trapping in Biology and Nanotechnology)

Abstract

:
Precise control of particle positioning is desirable in many optical propulsion and sorting applications. Here, we develop an integrated platform for particle manipulation consisting of a combined optical nanofiber and optical tweezers system. We show that consistent and reversible transmission modulations arise when individual silica microspheres are introduced to the nanofiber surface using the optical tweezers. The observed transmission changes depend on both particle and fiber diameter and can be used as a reference point for in situ nanofiber or particle size measurement. Thence, we combine scanning electron microscope (SEM) size measurements with nanofiber transmission data to provide calibration for particle-based fiber assessment. This integrated optical platform provides a method for selective evanescent field manipulation of micron-sized particles and facilitates studies of optical binding and light-particle interaction dynamics.

1. Introduction

A decade after its first realization, Ashkin [1] used a laser to move micron-sized dielectric particles. Nowadays, light-mediated trapping boasts a myriad of experimental applications, including cell manipulation [2], force measurement [3], holographic trapping [4], angular momentum transfer [5] and the use of optical fibers as trapping sources [6]. Recent advances include the study of light-matter coupling in optically-bound structures [7] and lab-on-a-chip integrated techniques [8]. A sister branch of optical manipulation that is subject to increasing attention exploits the potential of surface evanescent fields. Prism surfaces [9], microscope objectives [10] and waveguides [11] have been used as evanescent field interfaces to probe the dynamics of optical trapping and binding, including extensive studies of counter propagating and standing-wave field effects [12,13].
A special case of evanescent field geometry is found in the optical nanofiber (ONF). With a diameter comparable to the wavelength of light guided within, such ultra-thin optical fibers have intense evanescent fields, which penetrate into the surrounding medium [14]. Being relatively easy to fabricate and integrate with other optical components, nanofibers have emerged as compact, versatile devices with a broad range of applications [15,16], such as cold-atom manipulation [17] and microresonator coupling [18]. For a review on some of this work, the reader is referred to [19,20]. Optical manipulation using nanofibers is now a field of increasing potential [21]; the evanescent field around the waist of the nanofiber is used to optically trap and propel micron-sized particles in suspension. In a manner reminiscent of conventional optical tweezers (OT), the gradient of the evanescent field attracts nearby particles to the fiber surface. These are then propelled along the direction of light propagation via radiation pressure. Since their establishment as optical propulsion tools [21], nanofibers have been used for bidirectional particle conveyance [22], wavelength selective particle sorting [23] and mass biological particle migration under photopheresis [24]. Such methods have exciting applications as particle “conveyor belts” and sorting mechanisms in enclosed systems, particularly as their mm-scale lengths also facilitate continuous and long-range trapping at any point in a sample, beyond the limits achievable with conventional focused-beam tweezers.
In most cases, nanofibers are immersed in a “particle bath”, a relatively high-density solution, which allows many particles to simultaneously interact with the fiber. However, particles moving in and out of the evanescent field can cause major scattering-induced system fluctuations, making it difficult to determine the evanescent field incident on particles within a given visual frame. Microfluidic insertion is one way to address this problem [25]. Although such systems are highly relevant for mass particle sorting and filtration, they can be complex to arrange and have limitations in terms of particle/site selection and system reversibility.
Here, we introduce an integrated platform for particle manipulation using a combined optical nanofiber and optical tweezers system. This allows particles to be selectively trapped, individually or in arrays, and site-specifically introduced to the nanofiber surface. Previously, we showed that addressing nanofibers in a more structured and site-specific way offers many advantages, including facilitating the study of interparticle or particle plus evanescent field interactions [26,27].
Previously reported works on ONF-based particle manipulation rely solely on video sequence analysis for studying particle displacement. However, as in standard optical tweezers, the monitoring of the trapping beam affords new capabilities for the system, such as position tracking [28] or force measurement [29]. The ONF transmission can also be used as a relatively simple tool to provide complementary information about both trapping or trapped entities. The reason it has not been considered before probably stems from the difficulties associated with high colloidal particle concentrations in “particle baths”, as discussed earlier.
Taking advantage of our selective control over particle deposition onto ONFs, in this paper, we implement ONF transmission monitoring to create an experimental toolbox for a range of trapping and manipulation studies. More precisely, we show that a single silica particle of known diameter can serve as a probe to sense the local fiber diameter by observing the nanofiber transmission. We also report ONF transmission as a function of particle-ONF separation, as well as preliminary results on the way the optical binding between particles on an ONF is related to its transmission. Our integrated technique may be further extended to provide a powerful, system-defined particle selection and manipulation tool, with broad spectroscopic applications analogous to those demonstrated in free space via injection of quantum dots onto the fiber surface [30] or selective deposition of fluorescent microparticles in a Paul trap [31]. The details and applications of this combined system are outlined below.

2. Experimental Methods

2.1. Optical Tweezers

To create the integrated tweezers-nanofiber system, we used home-built tweezers (see Figure 1a) based on Thorlabs model OTKB/M, equipped with a continuous wave (CW) 1064 nm laser Wavespectrum WSLS-1064-400m-4 (maximal power of around 300 mW, hereafter referred to as the tweezers laser). Typical trapping power was set to 30 mW. The system features an inverted microscope configuration, where the sample is placed over an oil-immersion objective (×100, with numerical aperture (NA) of 1.25) and illuminated from above. The tweezers includes a galvo-steered mirror pair in the incident beam path, and this allows modulation of the beam position in the focal plane for simultaneous trapping of multiple particles through time-sharing of the beam.

2.2. Optical Nanofiber Fabrication, Mounting and Integration

Optical nanofibers with waist diameters of approximately 530 nm were fabricated from Thorlabs 1060XP fiber using a hydrogen/oxygen flame-brushed, heat-and-pull rig [32] The flame-brushing technique allows for arbitrary taper profiles [33] depending on the particular application. In our work, we used linear 29 mm-long tapers with a 2 mm-long waist, and measured transmissions greater than 90%. We selected a nanofiber diameter of 530 nm to satisfy the single-mode condition for 1064 nm [14] guided light and to ensure an enhanced evanescent field, while maintaining fiber robustness for handling. After that, the fiber was fixed to a custom mount, which was then firmly attached to the tweezers' 3D stage, positioning the nanofiber centrally over the pre-mounted cover slip (see Figure 1b).
To facilitate stable co-planar focusing with the optical trap (1.25 NA objective with relatively small working distance of), the nanofiber should be located within 100 μm of the sample cover slip surface due to the limited working distance of the objective. The tilt function of the mount allows the user to align the fiber parallel to the surface of the cover slip; this is important both for even focusing of the fiber over the field of view and to avoid contact between the fiber and the cover slip, which results in complete loss of the fiber-guided light.
Figure 1. (a) Schematic of the optical tweezers setup. A 1064-nm laser is deflected by a pair of galvanic mirrors, which are imaged onto the back pupil of the objective by a beam-expanding telescope. The sample holder is mounted onto a 3D stage and imaged using a CMOS camera, with LED providing illumination. (b) The nanofiber is integrated into the optical tweezers using a custom-designed mount, enabling the fiber to be positioned carefully in the microparticle solution.
Photonics 02 00795 g001

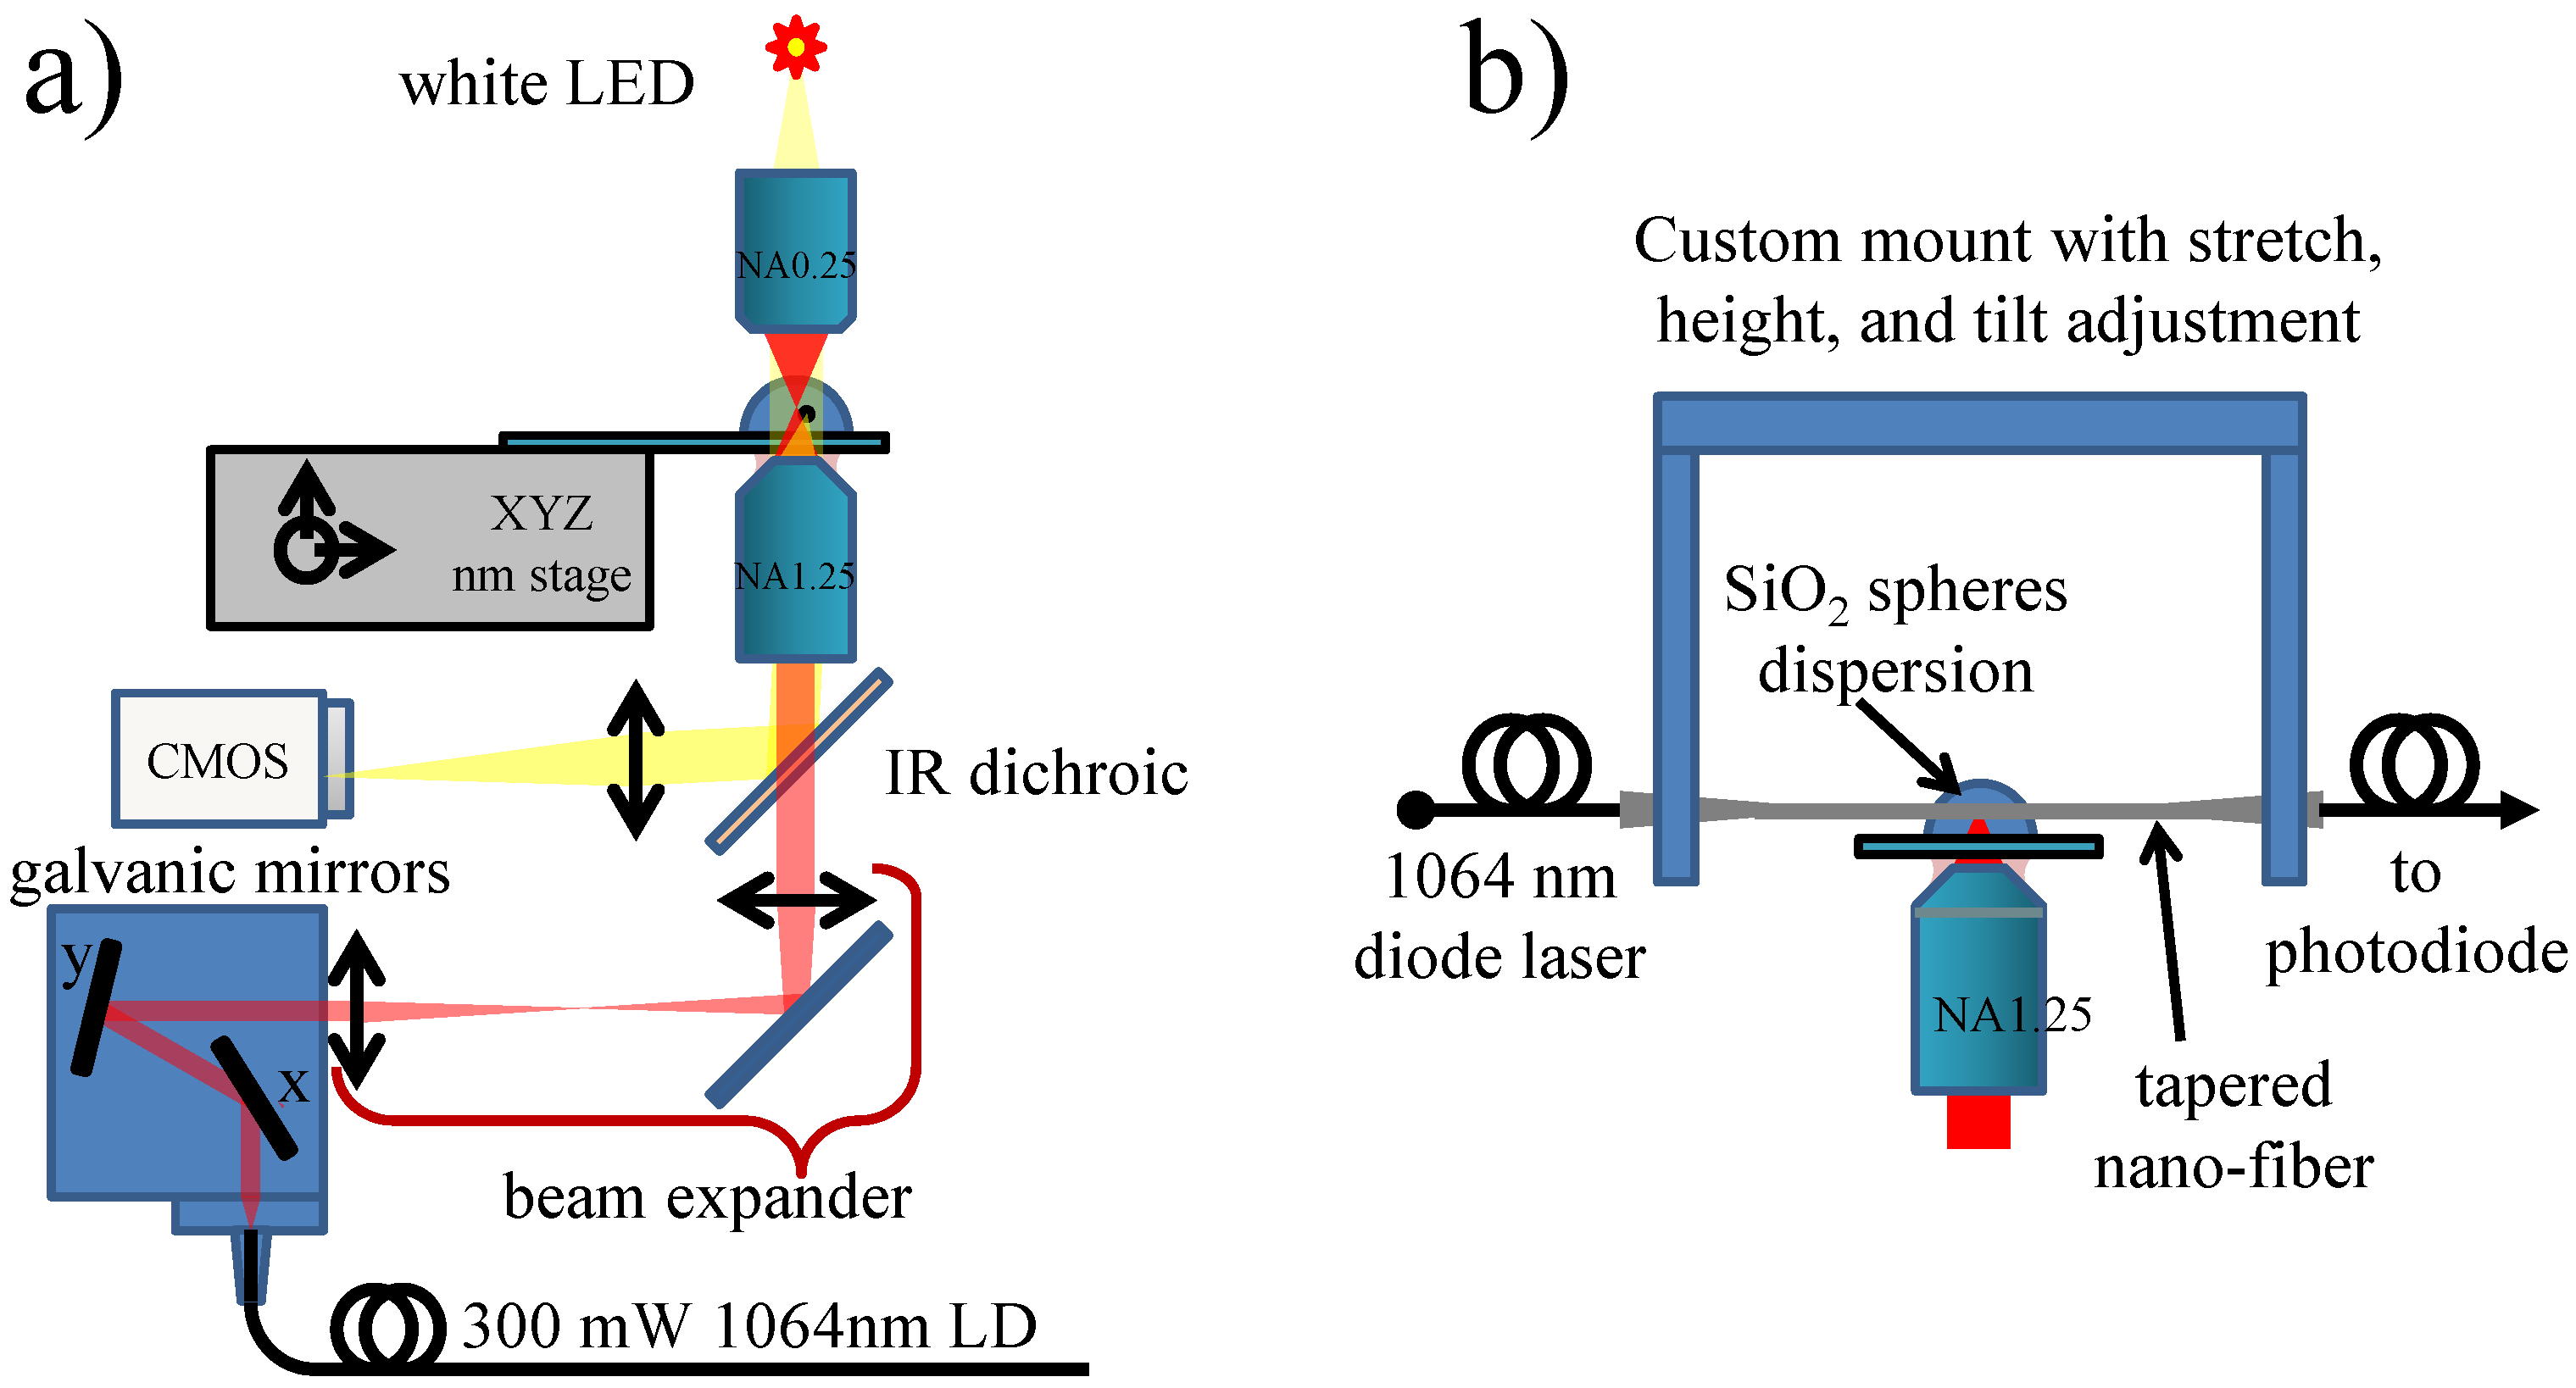
2.3. Nanofiber in Dispersion

Silica microspheres of 2.01 μm and 3.13 μm (SS04N and SS05N Bangs Laboratories, Inc., Fishers, IN, USA, CV 10 % 15 % ) were diluted with ultra-pure deionized water (Nanopure, Thermo Scientific, Waltham, MA, USA) to concentrations of 105–106 μL−1. Prior to positioning the fiber, 100 μL of the dispersion was pipetted onto the center of the cover slip and left for five minutes to allow the beads to settle to the bottom. Once mounted, one fiber pigtail was spliced into a 1-mW fiber 1064-nm diode laser (Oclaro LC96A1064BBFBG-20R), hereinafter referred to as the guided laser, and the transmitted power was monitored at the fiber output. The fiber was then lowered until it was just above the cover slip (see Figure 1b). Finally, a second cover slip was positioned above the sample using short supports. This stabilizes the system by alleviating atmospheric airflow across the droplet and serves to delay water evaporation, a cause of power fluctuations. With an exponentially-tapered fiber, the fiber transmission gradually increased upon lowering into the solution, until it reached a typical level of 80% near the cover slip surface. The loss in this instance is repeatable and largely due to scattering at the air-water interfaces of the thin fiber. However, if linearly-shaped tapers are used, the transmission is restored nearly to its initial value when the nanofiber is positioned close to the cover slip. This may be attributed to the larger fiber diameter as it enters and leaves the droplet in this geometry. Thus, linear tapers prove to be more suitable for this type of application due to a more uniform waist and increased robustness.

2.4. Data Acquisition and Treatment

Once the nanofiber had been brought into the microparticle dispersion, single silica microparticles were trapped on the surface of the optical tweezers sample holder cover slip. The sample stage was then lowered to bring the trapped particles into common focus with the nanofiber. Next, spheres were introduced to the evanescent field of the fiber, by either manually translating the stage or displacing the optical trap via galvanic mirror steering. The optical transmission was recorded from the analogue output of a Thorlabs PM100 power meter using an NI BNC-6229 DAQ card using MATLAB-written software. The sampling rates were either 1 or 2 kHz.
Figure Figure 2 shows individually-trapped particles in the vicinity of the nanofiber, with a 2.01-μm sphere in the top images and a 3.13-μm sphere in the bottom images. The trapped particles were introduced into the evanescent field of the fiber by manually translating the 3D stage, and sharp drops in transmitted power were consistently observed due to the contact with the particle. The presence of a dip indicates that a portion of the evanescent field is coupled to the scatterer (sphere) and then radiated into the far field. Figure 2c shows typical fiber transmission plots recorded for both particle sizes, with markedly larger transmission drops recorded for the larger sphere at the same fiber position.
Figure 2. (Top) 2.01-m and (bottom) 3.13-μm silica microspheres trapped (a) near to and (b) in selective individual contact with the nanofiber surface. (c) Guided laser transmission dips due to particle scattering in the nanofiber evanescent field. The left (red) plot for a 2.01-μm sphere and the right (blue) plot for a 3.13-μm sphere show drastically different induced loss in transmission.
Photonics 02 00795 g002
Before placing the fiber into the optical tweezers system, the 1064-nm guided light power was stable within 0.1%. Once placed in the dispersion, the guided laser power fluctuated by 0.3–0.5%. This increase in the fluctuations appears to arise from systemic noise in the combined tweezers-nanofiber system. To improve SNR and record nanofiber transmission changes over several repetitive events (5–15), the particle was made to approach the fiber in a periodical manner using a MATLAB program controlling galvanic mirrors. The recorded waveforms were then treated using MATLAB scripts to extract the best estimation for the transmission changes.
To exclude possible artifacts, it has been verified that even at OT trap powers >100 mW, there was negligible coupling of light from the trap to the nanofiber (a few microwatts), whether a particle was in contact with the fiber or not, while the typical guided fiber was around 10 mW. Hence, the OT beam did not affect the transmission data.

3. Results and Discussion

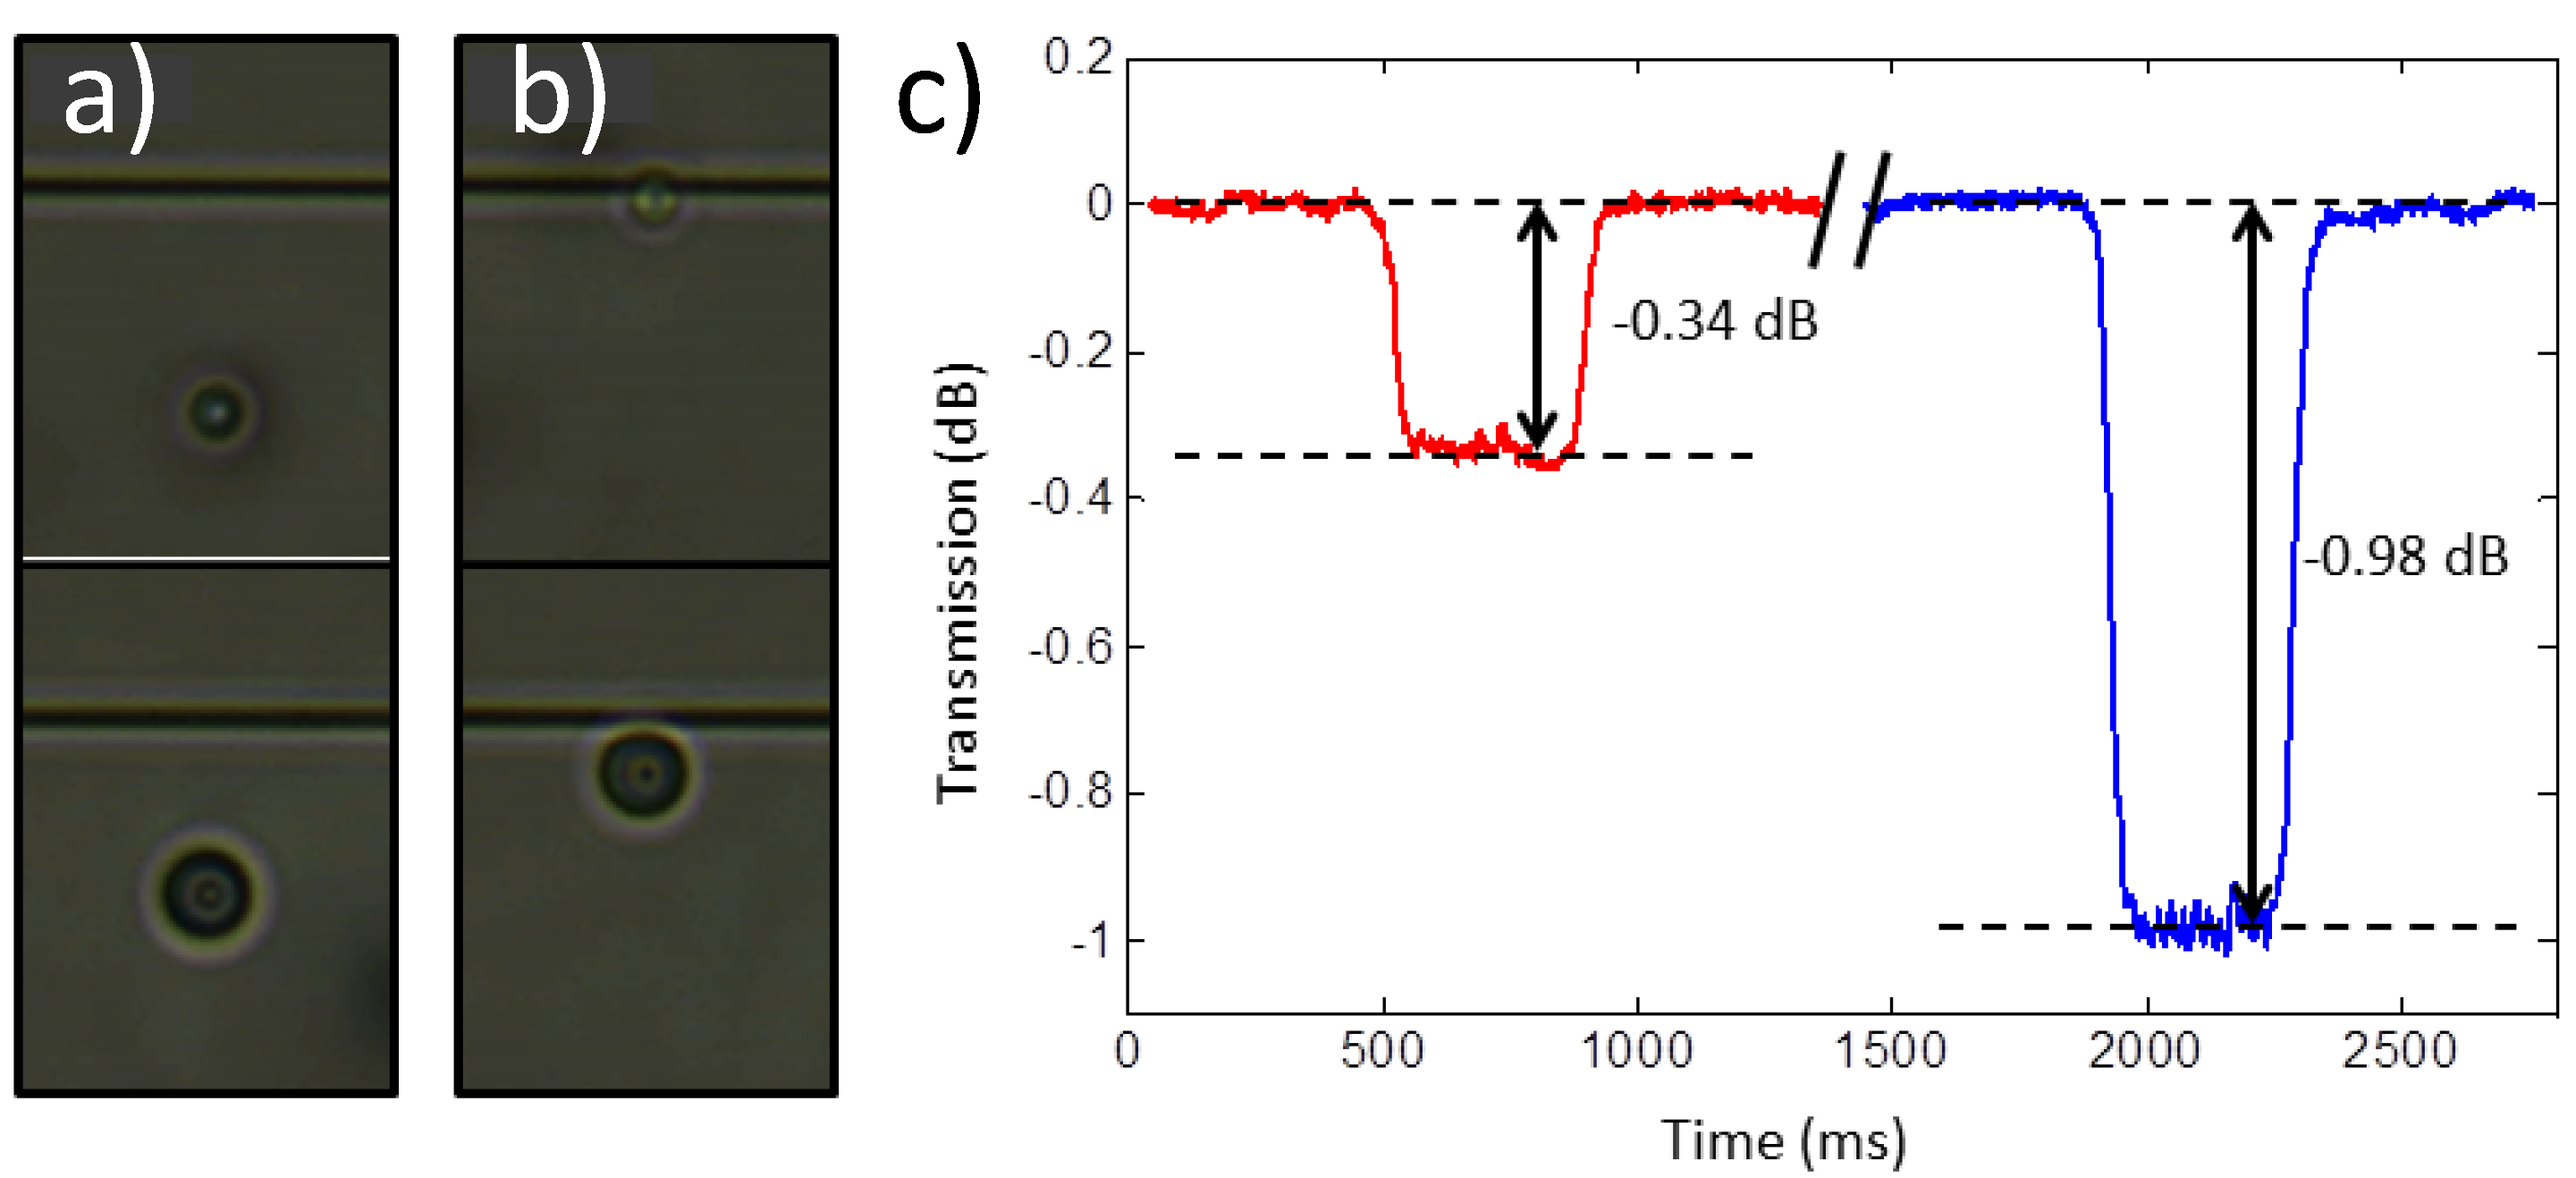
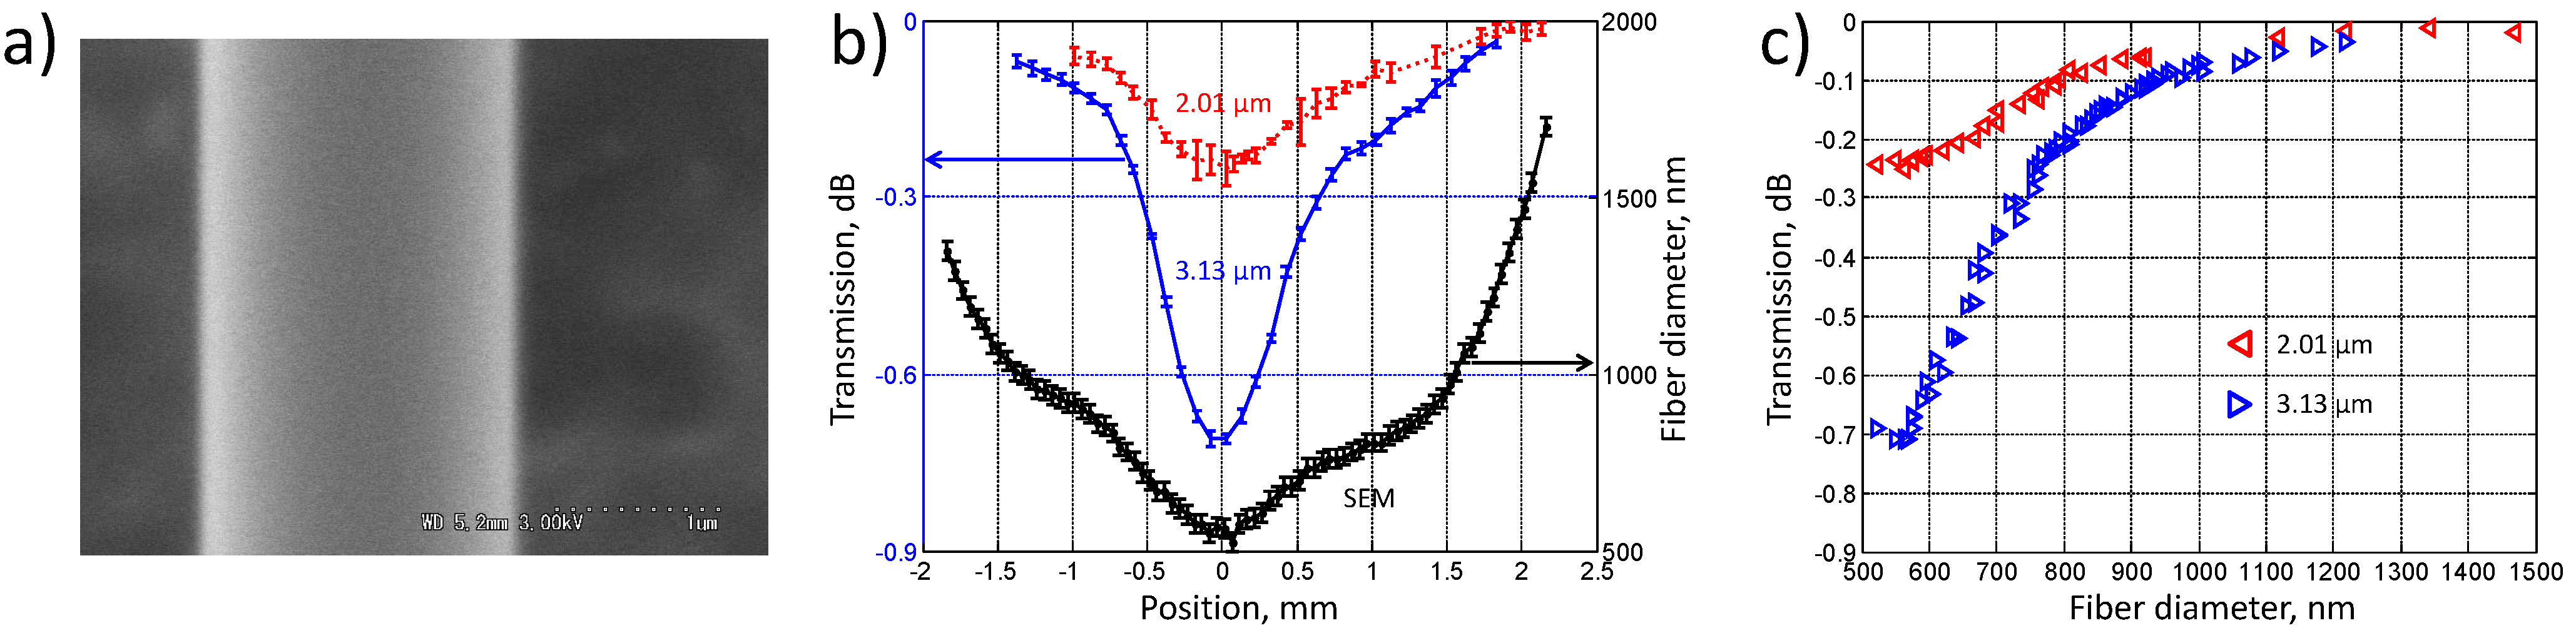
3.1. Trapped Particle as a Probe of Fiber Diameter and Field Distribution

As shown in Figure 2, the transmission dip induced by particles is dependent on particle size, probably due to the varying overlap of the fiber evanescent field with the particle. Since, for a given wavelength, a different fiber diameter results in a different evanescent field structure [15], it is natural to consider the influence of nanofiber diameter on fiber transmission loss. Similar transmission effects to those in Figure 2c were systematically recorded for 2.01-μm and 3.13-μm particles, at 100-μm intervals along the fiber, starting in the down taper region, continuing across the nanofiber waist and, finally, along the up taper. After the removal from the droplet, the fiber was put on a conductive tape stuck to a metal mount. The fiber profile was then measured via scanning electron microscopy (SEM) at multiple places along the fiber at 50-μm intervals (Figure 3a,b) and the results correlated (see Figure 3c). The decreasing nanofiber diameter induces dramatic and increasing scattering in the particle; this scattering also increases with particle size. This effect can be associated with varying evanescent field penetration depths and intensity profiles at different fiber diameters for a given wavelength. These results provide a useful tool for in situ measurements of nanofiber diameters, which is otherwise time consuming and can often only be measured afterwards using an SEM. Experimental knowledge of this relationship is thus important for emerging techniques for site-specific particle detection in low-density solutions, for instance in fiber propulsion and optical binding studies [21,26]. It should be noted that the accuracy of the calibration curves in Figure 3c is subject to inherent variation of particle size in dispersion. It is thus beneficial to choose uniformly-sized particles (size standards) for applications requiring higher accuracy.
Figure 3. (a) Typical SEM image of the optical nanofiber. (b) Fiber transmission when in contact with a 2.01-μm (red line) and a 3.13-μm (blue line) silica sphere and the fiber diameter as measured from SEM images (black line), as a function of position along the fiber axis. (c) Fiber transmission as a function of fiber diameter when probed by silica particles with diameters of 2.01 μm (red left-pointing triangles) and 3.13 μm (blue right-pointing triangles).
Photonics 02 00795 g003

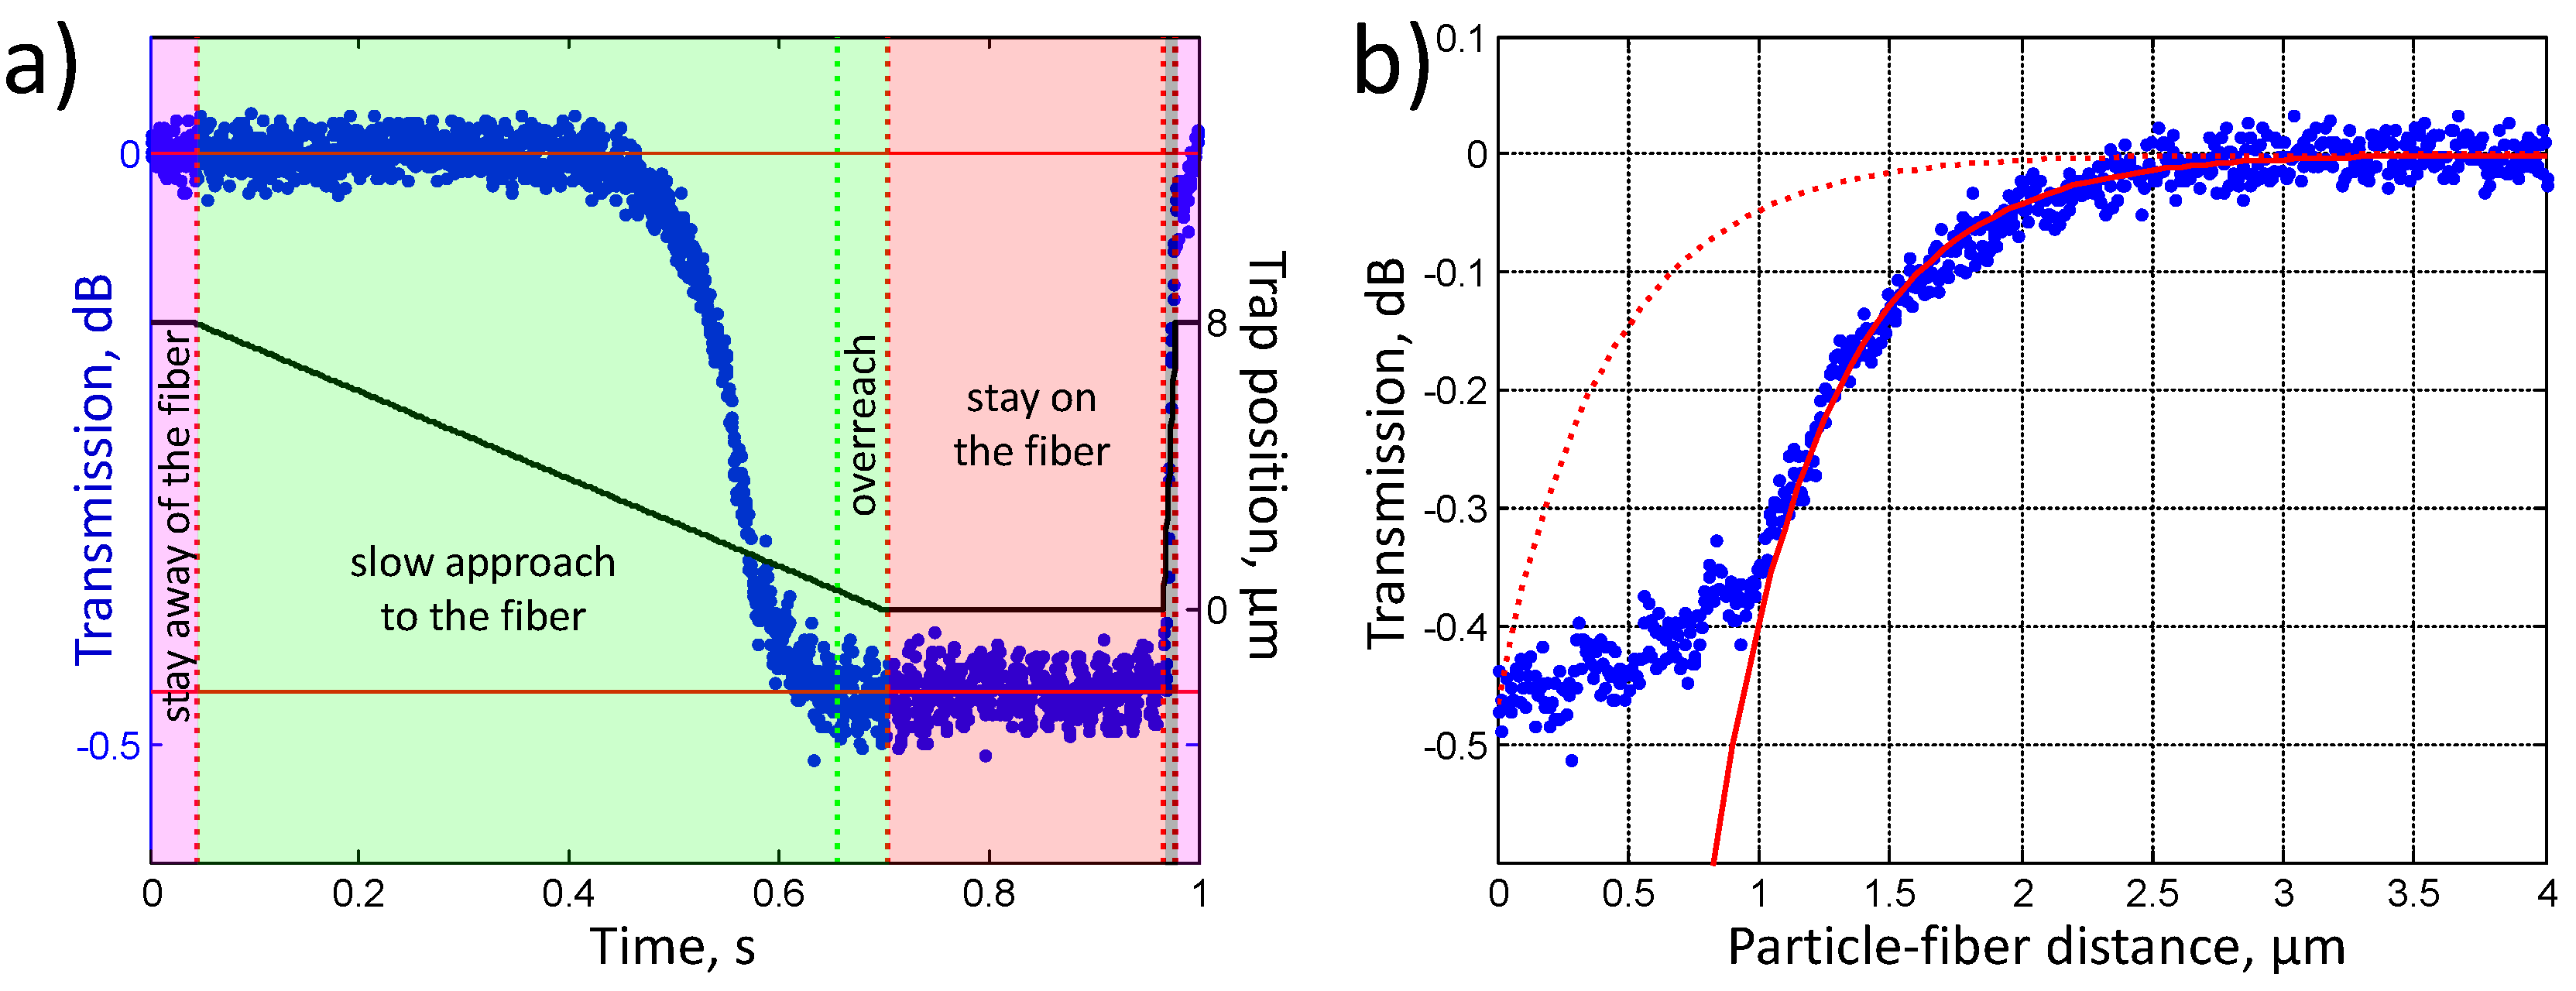
3.2. Fiber Transmission as a Function of Fiber-Particle Separation

While bringing particles to a fiber, in our case, resulted in sharp transmission modulation, it is expected that the modulation depth varies continuously with the fiber-particle separation. At the same time, empirical knowledge of this dependence can be helpful, first, to study the field structure of the fiber with a given particle and, second, to implement a high sensitivity probe for the particle-fiber separation. Thus, we also studied nanofiber transmission loss as a function of distance between the fiber and a probe particle of 3.13 μm in diameter.
To perform the measurements, the optical trap displacement was performed in a periodic way, and fiber transmission was averaged over 10 consecutive periods, similar to what an averaging mode of a digital oscilloscope would produce. The resulting transmission profile is shown in Figure 4a as blue dots. The black line shows the trap position as a function of time within a one second-long period, which consisted of four distinct parts with the corresponding relative time portion given in the brackets: slow approach to the fiber from an 8-μm distance (five); on the fiber (two); quick removal from the fiber (0.1); separated from the fiber by 8 μm (0.5). Due to manual positioning of the oscillating trap with respect to the ONF, there was typically an overreach, i.e., the trap moved a little further after the sphere was brought in contact, making it slide azimuthally along the surface of the fiber. This overreach can be deduced from the imaging and corrected for.
Figure 4. (a) Temporal profile of fiber transmission change (blue dots) during a cycle of optical trapping with a 3.13-μm sphere approaching and moving away from the fiber (black line). The trap movement is decomposed into four parts: (i) slow approach to the fiber (green zone), (ii) particle on the fiber (red zone), (iii) quick removal from the fiber (very thin gray zone) and (iv) particle at an 8-μm distance away from the fiber (purple zone). The overreach zone corresponds to the particle being already at the surface of the fiber, while the trap continues to move in. (b) Fiber transmission as a function of fiber-particle distance, showing the strongest dependence at 1–1.5 μm away from the fiber surface (blue dots); the model fit matching the transmission at zero separation between fiber and particle (red dotted curve); the model fit matching the experimental transmission at a distance from the fiber (solid red curve).
Photonics 02 00795 g004
The transmission versus separation curve was deduced from the part corresponding to the approach (Figure 4b). The dependence shows a smooth sigmoidal transition with the highest sensitivity for fiber-particle distances between 0.5 and 2 μm. As can be seen from the figure, the sensitivity ( T / d ) is low for distances both smaller than the diameter of the fiber and larger than the diameter of the particle (T and d are nanofiber transmission and fiber-particle separation, respectively).
To fit the experimental dependence, we exploit an intuitive, yet simplified theoretical estimation for the transmission loss. In this model, we assume that the loss is proportional to the power scattered by the particle, which is in its turn proportional to the radiation intensity of the induced dipole represented by the particle. In the simplest approximation, we estimate it as the square of the field amplitude overlap with the sphere:
T = 1 - γ ( E ( r ) d V ) 2
where V is the particle volume and γ, being the free parameter of the model, is the proportionality factor between the transmission loss Δ T and the field overlap integral squared. The field profile E i ( r ) was obtained from numerical simulation in COMSOL with the model reproducing the experimental geometry. The numerically-calculated profile was fitted with an exponential function to provide the decay length of ≈ 0.88 μm.
The fit that matches the measured transmission at the contact between fiber and particle cannot describe the highest sensitivity obtained at a significant distance from the fiber (Figure 4b, dotted curve). The slow transmission variation at large distances (>1 μm) is, however, consistent with this simple model, provided that we adjust the free parameter γ to achieve the fit (Figure 4b, solid curve). On the other hand, the model fails to explain the observed sigmoidal behavior and predicts excessively low transmission (around 7 dB) at the nanofiber surface. At the same time, this phenomenon can be explained considering that, for the light coupled from the fiber into the sphere, there is an interplay between scattering into the far field (transmission loss) and coupling back to the propagation mode of the fiber (no loss in transmission). In this case, our observations may imply that for an approaching particle, the increasing overlap with the evanescent field is compensated for by an increase of coupling back to the fiber, and this alleviates a further transmission decrease.
The obtained results suggest that ONFs can be used for colloidal particle sensing in flow, with particles not necessarily touching the ONF surface. Besides providing the effective sensing volume of a single ONF for a given particle size, the separation-transmission dependence could be useful for profiling electromagnetic fields that have complex profiles, e.g., for higher order modes propagating in an ONF [27,34]. We also show that the observed, unexpected transmission dependence at small separations cannot be directly explained by the simplistic model we employed, which relies on the field overlap integral, and this clearly requires further investigation.

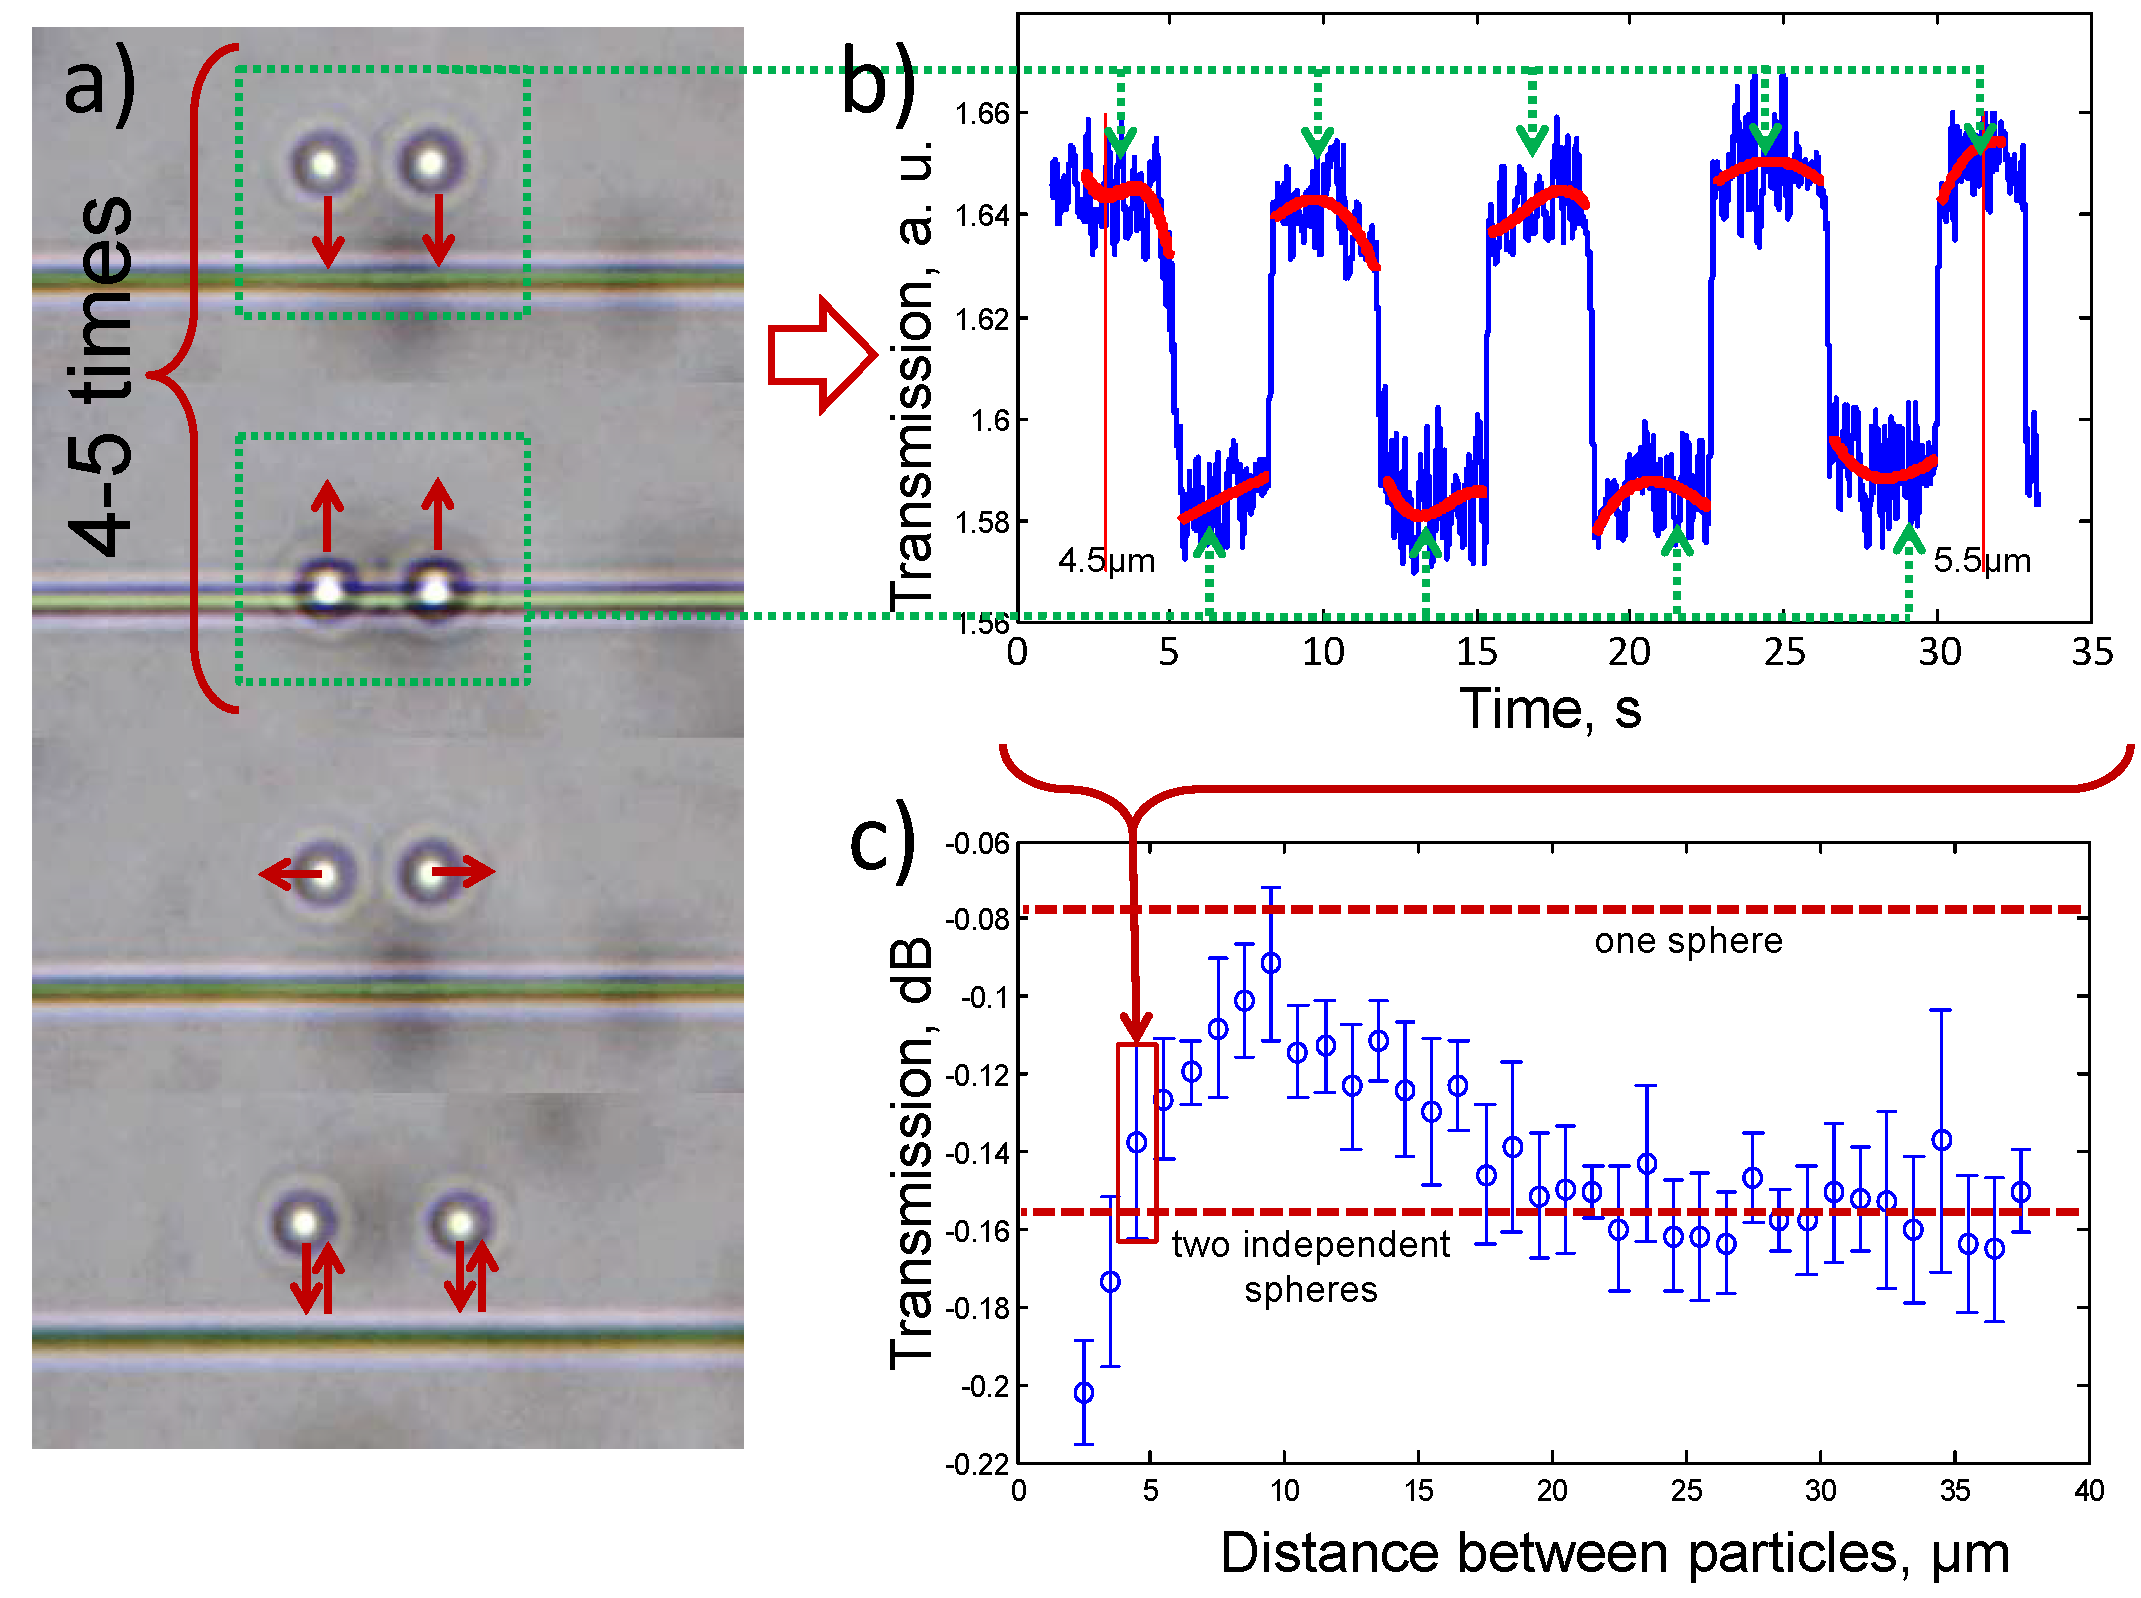
3.3. Transmission Modulation Induced by Two Particles

In order to gain insight into ONF-based optical binding [26] via fiber transmission monitoring, we recorded the fiber transmission loss on bringing two particles simultaneously into contact with a fiber. Two 2.01-μm diameter spheres were trapped in two time-shared optical traps, brought manually to the fiber (Figure 5a), and the corresponding transmission changes were recorded and analyzed (Figure 5b).
We observed strong transmission dependence on the interparticle distance (Figure 5c). It is meaningful to compare the recorded transmission loss with twice the loss induced by a single particle (red lines in Figure 5c), corresponding to the absence of any optical interaction between particles on the fiber. The recorded experimental curve consists of values that can be both smaller and larger than the indicated benchmark value of two independent particles; this clearly indicates the presence of an optical interaction.
Figure 5. Transmission modulation of a 850-nm optical nanofiber (ONF) induced by two 2.01-μm silica particles in contact. (a) Schematic of the experiment showing the succession of steps. (b) ONF transmission as a function of time shows reproducible dips when particles are brought into contact with the ONF. Red lines show the polynomial fit of the transmission. The particular curve was recorded at an interparticle distance of 4.5 μm (vertical red lines indicate the change of interparticle distance). (c) Transmission loss for two particles on a fiber exhibits strong variation with the interparticle distance, indicating optical interaction. The red lines indicate the estimates for single-particle-induced loss, as well as twice this value, corresponding to two independent, non-interacting particles.
Photonics 02 00795 g005
The optical binding on an ONF can be considered in two different geometries, using either a single propagation direction [26] or counter propagating beams [7]. In particle sorting applications that are particularly suited to ONFs, the binding within propagating clusters is what is relevant. Experimentally, this involves tracking fast moving particles over distances larger than several typical fields of view (FOV) of a microscope, which is often impractical. Provided that the link between ONF transmission modulation and particle binding is established, current results open possibilities for studying such optical binding for propagating clusters using a stationary trap system, within a single FOV. However, additional experiments explicitly evaluating binding together with ONF transmission are required.

4. Conclusions

We have presented a combined optical nanofiber-optical tweezers integrated platform for particle propulsion and manipulation. Notably, we studied fiber transmission variations as a function of sphere size, fiber diameter and fiber-sphere separation and demonstrated the particular effect of transmission modulation for two particles on a fiber. Our system presents a powerful framework for studying various interactions between particles and the evanescent field of the fiber, while also serving as a tool for other fiber-based particle propulsion and sorting experiments. In particular, it enables us to determine local fiber diameter in situ, as well as potentially elucidating optical binding behavior in such systems.
The tweezers and nanofiber intensities can be modulated to trap at a specific surface position on the fiber or propel in both directions by balancing bidirectional nanofiber fields. This setup is also perfect for trapping multiple particles and was successfully used for studying optical binding interactions occurring in the evanescent field of an optical nanofiber [26].
Although the experiments described above used silica microspheres, the techniques are also applicable to optical interaction studies and manipulation of other dielectric or biological specimens, notably polystyrene spheres and living cells. Extended functionality of the tweezers will introduce further experimental possibilities. For example, introducing high precision calibrated particle tracking via a quadruple photo diode [28] or a high-speed camera [35] would enable site-specific force measurements of the evanescent field-mediated particle to particle and fiber to particle interactions.
Finally, the nanofiber field may be tailored by changing the input wavelength, power or light polarization; this shows that the combined tweezers-nanofiber system has further potential for use in fluorescence and spectroscopy studies, using the nanofiber as a passive (collection) or active (excitation) probe. The evanescent field structures of non-uniform fiber elements [36] and complex evanescent fields under counter propagating light [22] and higher mode propagation [27,34,37] may also be investigated using this system.

Acknowledgments

This work was supported in part by funding from the Okinawa Institute of Science and Technology Graduate University and and Science Foundation Ireland under Grant No. 08/ERA/I1761 through the NanoSci-E+ Transnational Programme.

Author Contributions

Ivan Gusachenko planned and conducted the experiment, treated the data and wrote and prepared the manuscript. Mary C. Frawley participated in writing the manuscript. Viet Giang Truong participated in planning the experiment, performed the COMSOL simulation and edited the manuscript. Síle Nic Chormaic proposed and supervised the project and edited the manuscript.

Conflicts of Interest

The authors declare no conflict of interest.

References

  1. Ashkin, A. Acceleration and trapping of particlesby radiation pressure. Phys. Rev. Lett. 1970, 24, 24–27. [Google Scholar] [CrossRef]
  2. Ashkin, A.; Dziedzic, J.M. Optical trapping and manipulation of viruses and bacteria. Science 1987, 235, 1517–1520. [Google Scholar] [CrossRef] [PubMed]
  3. Kuo, S.C.; Sheetz, M.P. Force of single kinesin molecules measured with optical tweezers. Science 1993, 260, 232–234. [Google Scholar] [CrossRef] [PubMed]
  4. Curtis, J.E.; Koss, B.A.; Grier, D.G. Dynamic holographic optical tweezers. Opt. Commun. 2002, 207, 169–175. [Google Scholar] [CrossRef]
  5. Simpson, N.B.; Dholakia, K.; Allen, L.; Padgett, M.J. Mechanical equivalence of spin and orbital angular momentum of light: An optical spanner. Opt. Lett. 1997, 22, 52–54. [Google Scholar] [CrossRef] [PubMed]
  6. Liu, Z.; Guo, C.; Yang, J.; Yuan, L. Tapered fiber optical tweezers for microscopic particle trapping: Fabrication and application. Opt. Express 2006, 14, 12510–12516. [Google Scholar] [CrossRef] [PubMed]
  7. Dholakia, K.; Zemánek, P. Colloquium: Gripped by light: Optical binding. Rev. Mod. Phys. 2010, 82, 1767–1791. [Google Scholar] [CrossRef]
  8. Enger, J.; Goksör, M.; Ramser, K.; Hagberg, P.; Hanstorp, D. Optical tweezers applied to a microfluidic system. Lab Chip 2004, 4, 196–200. [Google Scholar] [CrossRef] [PubMed]
  9. Kawata, S.; Sugiura, T. Movement of micrometer-sized particles in the evanescent field of a laser beam. Opt. Lett. 1992, 17, 772–774. [Google Scholar] [CrossRef] [PubMed]
  10. Gu, M.; Haumonte, J.B.; Micheau, Y.; Chon, J.W.M.; Gan, X. Laser trapping and manipulation under focused evanescent wave illumination. Appl. Phys. Lett. 2004, 84, 4236–4238. [Google Scholar] [CrossRef]
  11. Yang, A.H.J.; Moore, S.D.; Schmidt, B.S.; Klug, M.; Lipson, M.; Erickson, D. Optical manipulation of nanoparticles and biomolecules in sub-wavelength slot waveguides. Nature 2009, 457, 71–75. [Google Scholar] [CrossRef] [PubMed]
  12. Šiler, M.; Čižmár, T.; Šerý, M.; Zemánek, P. Optical forces generated by evanescent standing waves and their usage for sub-micron particle delivery. Appl. Phys. B 2006, 84, 157–165. [Google Scholar] [CrossRef]
  13. Šiler, M.; Čižmár, T.; Jonáš, A.; Zemánek, P. Surface delivery of a single nanoparticle under moving evanescent standing-wave illumination. New J. Phys. 2008, 10, 113010. [Google Scholar] [CrossRef]
  14. Tong, L.; Lou, J.; Mazur, E. Single-mode guiding properties of subwavelength-diameter silica and silicon wire waveguides. Opt. Express 2004, 12, 1025–1035. [Google Scholar] [CrossRef] [PubMed]
  15. Tong, L.; Sumetsky, M. Subwavelength and Nanometer Diameter Optical Fibers; Zejiang University Press: Hangzhou, China; Springer-Verlag: Berlin, Germany, 2010. [Google Scholar]
  16. Wu, X.; Tong, L. Optical microfibers and nanofibers. Nanophotonics 2013, 2, 407–428. [Google Scholar] [CrossRef]
  17. Kumar, R.; Gokhroo, V.; Deasy, K.; Nic Chormaic, S. Autler-Townes splitting via frequency up-conversion at ultralow-power levels in cold 87Rb atoms using an optical nanofiber. Phys. Rev. A 2015, 91, 2–6. [Google Scholar] [CrossRef]
  18. Ward, J.M.; Féron, P.; Nic Chormaic, S. A taper-fused microspherical laser source. IEEE Photonics Technol. Lett. 2008, 20, 392–394. [Google Scholar] [CrossRef]
  19. Morrissey, M.J.; Deasy, K.; Frawley, M.; Kumar, R.; Prel, E.; Russell, L.; Truong, V.G.; Nic Chormaic, S. Spectroscopy, manipulation and trapping of neutral atoms, molecules, and other particles using optical nanofibers: A review. Sensors (Basel, Switzerland) 2013, 13, 10449–10481. [Google Scholar] [CrossRef] [PubMed]
  20. Chen, G.Y.; Ding, M.; Newson, T.P.; Brambilla, G. A review of microfiber and nanofiber based optical sensors. Open Opt. J. 2013, 7, 32–57. [Google Scholar] [CrossRef]
  21. Brambilla, G.; Murugan, G.S.; Wilkinson, J.S.; Richardson, D.J. Optical manipulation of microspheres along a subwavelength optical wire. Opt. Lett. 2007, 32, 3041–3043. [Google Scholar] [CrossRef] [PubMed]
  22. Lei, H.; Xu, C.; Zhang, Y.; Li, B. Bidirectional optical transportation and controllable positioning of nanoparticles using an optical nanofiber. Nanoscale 2012, 4, 6707. [Google Scholar] [CrossRef] [PubMed]
  23. Zhang, Y.; Li, B. Particle sorting using a subwavelength optical fiber. Laser Photonics Rev. 2013, 7, 289–296. [Google Scholar] [CrossRef]
  24. Lei, H.; Zhang, Y.; Li, X.; Li, B. Photophoretic assembly and migration of dielectric particles and Escherichia coli in liquids using a subwavelength diameter optical fiber. Lab Chip 2011, 11, 2241–2246. [Google Scholar] [CrossRef] [PubMed]
  25. Xin, H.; Li, Y.; Li, L.; Xu, R.; Li, B. Optofluidic manipulation of Escherichia coli in a microfluidic channel using an abruptly tapered optical fiber. Appl. Phys. Lett. 2013, 103, 6720–6724. [Google Scholar] [CrossRef]
  26. Frawley, M.C.; Gusachenko, I.; Truong, V.G.; Sergides, M.; Nic Chormaic, S. Selective particle trapping and optical binding in the evanescent field of an optical nanofiber. Opt. Express 2014, 22, 16322. [Google Scholar] [CrossRef] [PubMed]
  27. Maimaiti, A.; Truong, V.G.; Sergides, M.; Gusachenko, I.; Nic Chormaic, S. Higher order microfiber modes for dielectric particle trapping and propulsion. Sci. Rep. 2015, 5. [Google Scholar] [CrossRef] [PubMed]
  28. Gittes, F.; Schmidt, C.F. Interference model for back-focal-plane displacement detection in optical tweezers. Opt. Lett. 1998, 23, 7–9. [Google Scholar] [CrossRef] [PubMed]
  29. Thalhammer, G.; Obmascher, L.; Ritsch-Marte, M. Direct measurement of axial optical forces. Opt. Express 2015, 23, 6112. [Google Scholar] [CrossRef] [PubMed]
  30. Yalla, R.; Le Kien, F.; Morinaga, M.; Hakuta, K. Efficient channeling of fluorescence photons from single quantum dots into guided modes of optical nanofiber. Phys. Rev. Lett. 2012, 109, 1–5. [Google Scholar] [CrossRef]
  31. Gregor, M.; Kuhlicke, A.; Benson, O. Soft-landing and optical characterization of a preselected single fluorescent particle on a tapered optical fiber. Opt. Express 2009, 17, 24234–24243. [Google Scholar] [CrossRef] [PubMed]
  32. Ward, J.M.; Maimaiti, A.; Le, V.H.; Nic Chormaic, S. Contributed Review: Optical micro- and nanofiber pulling rig. Rev. Sci. Instrum. 2014, 85, 111501. [Google Scholar] [CrossRef] [PubMed]
  33. Birks, T.A.; Li, Y.W. The shape of fiber tapers. J. Lightwave Technol. 1992, 10, 432–438. [Google Scholar] [CrossRef]
  34. Frawley, M.C.; Petcu-Colan, A.; Truong, V.G.; Nic Chormaic, S. Higher order mode propagation in an optical nanofiber. Opt. Commun. 2012, 285, 4648–4654. [Google Scholar] [CrossRef]
  35. Gibson, G.M.; Leach, J.; Keen, S.; Wright, A.J.; Padgett, M.J. Measuring the accuracy of particle position and force in optical tweezers using high-speed video microscopy. Opt. Express 2008, 16, 14561–14570. [Google Scholar] [CrossRef] [PubMed]
  36. Xin, H.; Li, B. Targeted delivery and controllable release of nanoparticles using a defect-decorated optical nanofiber. Opt. Express 2011, 19, 13285–13290. [Google Scholar] [CrossRef] [PubMed]
  37. Ravets, S.; Hoffman, J.E.; Orozco, L.A.; Rolston, S.L.; Beadie, G.; Fatemi, F.K. A low-loss photonic silica nanofiber for higher-order modes. Opt. Express 2013, 21, 18325. [Google Scholar] [CrossRef] [PubMed]

