1. Introduction
Self-probing spectroscopy based on high-order harmonic generation (HHG) has proven to greatly benefit from phase measurements, both for structural and dynamic studies of the generating medium [
1,
2,
3]. Indeed, the infrared (IR) laser-driven electron rescattering process [
4,
5,
6] leading to the emission of harmonic combs in the extreme ultra-violet (XUV) allows one to probe atoms and molecules
in situ with unprecedented attosecond time resolution and Ångström precision. In particular, the phase of the attosecond emission gives access to photo-recombination Wigner delays [
2,
7,
8] and phase difference in multi-channel ionization of aligned molecules [
3,
9]. Specific techniques have been developed to measure phases in the XUV domain [
1,
3,
10,
11,
12,
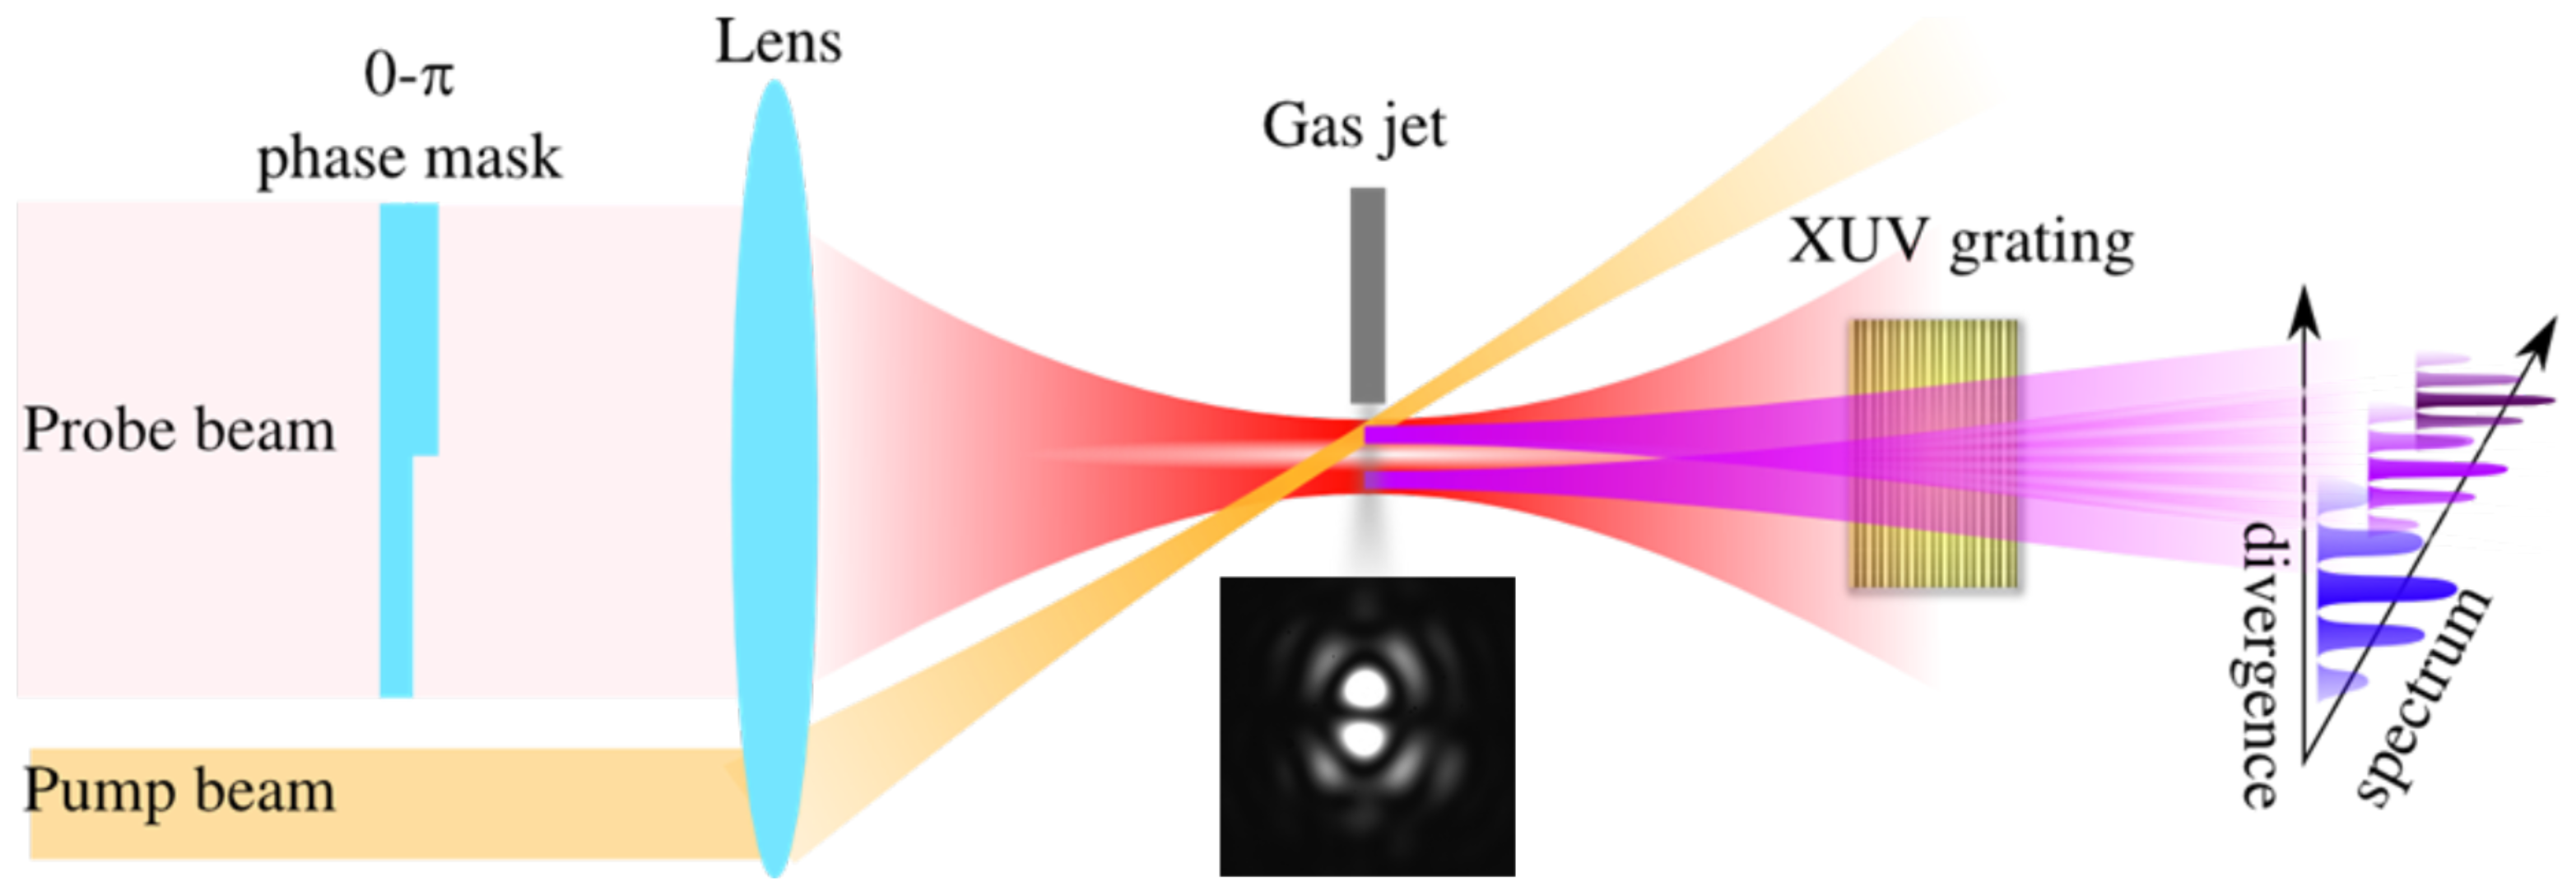
13] and unravel this subtle information. All of these interferometric techniques require the synchronization of two light or matter waves (the one to be characterized and a reference) with sub-femtosecond precision. In HHG two-source interferometry (TSI), the two light waves are overlapped in the far-field to form fringes on a phosphor screen (see
Figure 1). The position on the screen of the latter one directly reflects the phase difference between the two emissions. In a recent paper [
14], we reported the use of a 0-
π phase plate to convert a Gaussian beam into a TEM
01 Transverse Electromagnetic Mode and created two bright spots at the focus of a lens. These two foci were used as two spatially separated and synchronized HHG sources. We qualified this setup for TSI self-probing spectroscopy with full three-dimensional simulations of the generation process and experimental phase measurements in aligned carbon dioxide. Here, we give a more thorough insight into this 0-
π phase plate interferometer, how it works, its precision and its stability. The spatial interferogram analysis procedure is also described. We then report the phase measurements using this setup and demonstrate that subtle information about nitrogen alignment revivals and sulfur hexafluoride Raman vibrations can be followed through harmonics phase variations. These results reveal phase variations with opposite behaviors below and above a threshold. This method could be used to assign HHG to one specific ionization channel in molecules having several orbitals contributing to the non-linear process.
Figure 1.
(Color on-line) A 0-π phase plate is used as a mode convertor for HHG phase measurement by twp-source interferometry (TSI). The inset below the gas jet shows an experimental picture of the two bright spots created at the focus of a lens with a 0-π phase plate on the LUCAlaser. One of the two sources is used as a probe of the dynamics induced by a pump beam that is overlapped only with this source. The other HHG source remains unexcited and is used as a reference. A set of micro-channel plates and a phosphor screen are placed in the flat-field of a variable groove grating that allows one to disperse the different harmonic orders in one dimension and resolve their spatial profile in the other dimension. The overlap of the two emissions in the far-field results in interference fringes. Their position directly reflects the phase difference between the two HHG sources.
2. Phase-Plate Mode Conversion
Interferometric precision is more and more demanding as the central frequency of the signal increases. In particular, interferograms in the XUV-domain [
15] require highly stable experimental arrangements (for instance, the wavelength of H
21, the 21st harmonic order of a 800-nm laser, is about 38nm). In TSI, the reference beam is used to heterodyne the signal,
id est, the signal is transferred to a lower frequency. Recently, several TSI schemes were developed using amplitude division [
15,
16,
17,
18] and wave-front division [
1,
19]. All-transmissive schemes are more adapted to this kind of experiment than a Michelson or Mach–Zehnder interferometer, since they intrinsically offer higher stability. In a recent paper [
20], TSI was implemented to determine the amount of orbital angular momentum carried by HHG using diffractive optical element (DOE) beam splitting [
21]. In [
14], we instead based our two source setup on the spatial mode conversion of the driving laser beam. In the absence of a chirp-pulse amplification (CPA) digital laser [
22] providing on-demand mode femtosecond pulses, we used a 0-
π phase plate to implement the mode conversion [
23,
24,
25,
26]. As shown in
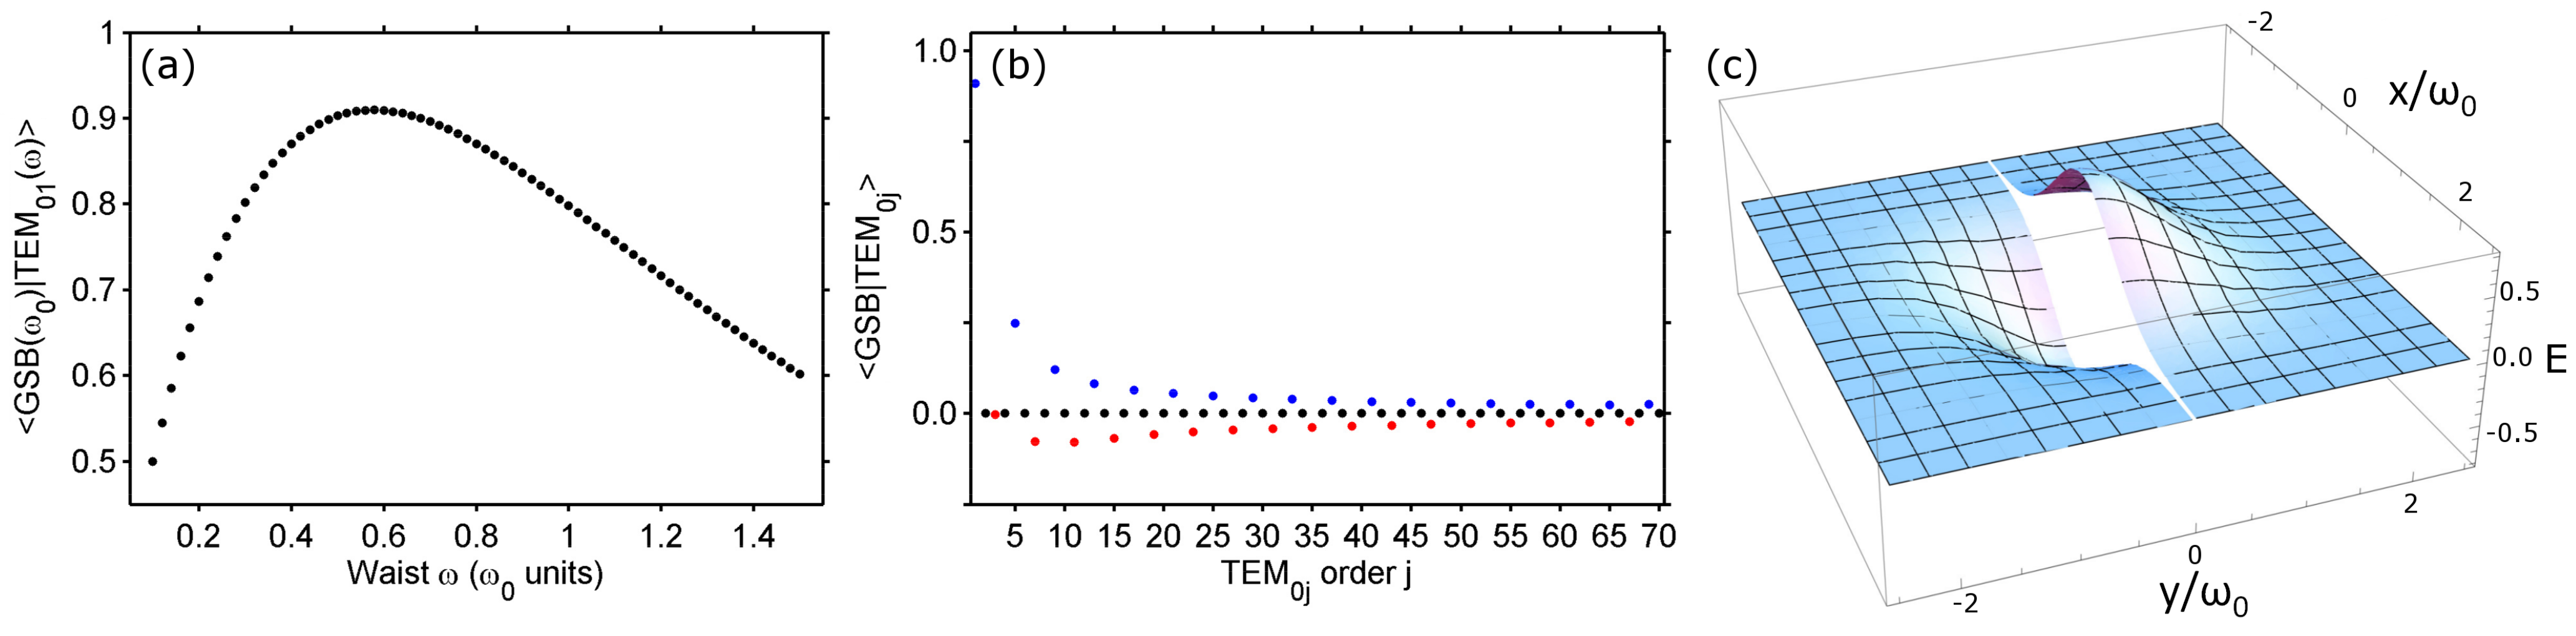
Figure 2a, we computed the overlap integral between the Gaussian phase-plate-shaped beam (GSB; see
Figure 2c) of waist
and a TEM
01 mode. Both electric fields are considered collimated. We find that a maximum of 90.94% of the input Gaussian beam is converted into the TEM
01 mode of waist
. This value is slightly smaller than the 93% reported in [
26], but still rather close. This conversion rate could be improved by using a cylindrical lens to adjust the waist of the transmitted beam in the direction orthogonal to the 0-
π step. In
Figure 2b, we show the overlap integral between the GSB and higher TEM
0i modes with waist
. As expected, the overlap integral with TEM
02i modes is zero, while TEM
04j+1 and TEM
04j+3 contribute with opposite signs and a decreasing amplitude as
j increases. These higher order contributions are revealed at the focus of a lens as diffraction peaks in the surroundings of the two bright spots of interest. However, the intensity in these undesired diffraction patterns is not strong enough to induce the HHG non-linear non-perturbative process (see [
14]).
Figure 2.
(Color on-line) (a) Conversion efficiency from a TEM00 mode with waist to a TEM01 mode with waist ω using a 0-π phase step as a mode convertor. The conversion efficiency is computed as the overlap integral between the Gaussian phase-plate-shaped beam (GSB) and a TEM01 beam of waist ω. A maximum of 90.94% is reached for . (b) Decomposition of the spatial profile of the beam after the phase plate in the TEM0i basis. Each coefficient is calculated as the overlap integral between the GSB and the TEM0i mode of waist . TEM02i modes do not contribute. TEM04j+1 (blue dots) and TEM04j+3 (red dots) modes contribute with opposite signs. (c) Three–dimensional view of the GSB electric field.
As the conclusion of this section, we would like to emphasize that this spatial mode conversion approach is more efficient than the DOE beam splitting one that allows at best to focus 81.1% in the two spatially-separated bright spots. Moreover, the mode conversion approach creates the two foci in the zeroth order of diffraction, which results in a smaller source-to-source distance than the DOE beam splitting method and contributes to transferring the signal to smaller spatial frequencies. In the next section, we study the effect of the IR laser phase front curvature on the far-field overlap of the two HHG beams.
3. Far-Field Overlap
HHG in the gas phase is a macroscopic emission process and is therefore subjected to specific phase matching conditions. These conditions are strongly influenced by the phase of the microscopic harmonic dipole moment, which was shown to depend linearly on the laser intensity [
27,
28]. Consequently, intensity variations in the fundamental beam induce strong phase variations in the harmonic emission. By contrast, in the vicinity of a maximum, this phase is stationary, such that harmonics are emitted along the direction orthogonal to the local phase front. In each bright spot created by the phase plate at the focus of a lens, the phase front inclination at the peak intensity determines the direction in which the harmonics are emitted. If the phase front tilt in the two foci is unfavorable, the two harmonic beams may not overlap in the far-field, preventing interferences.
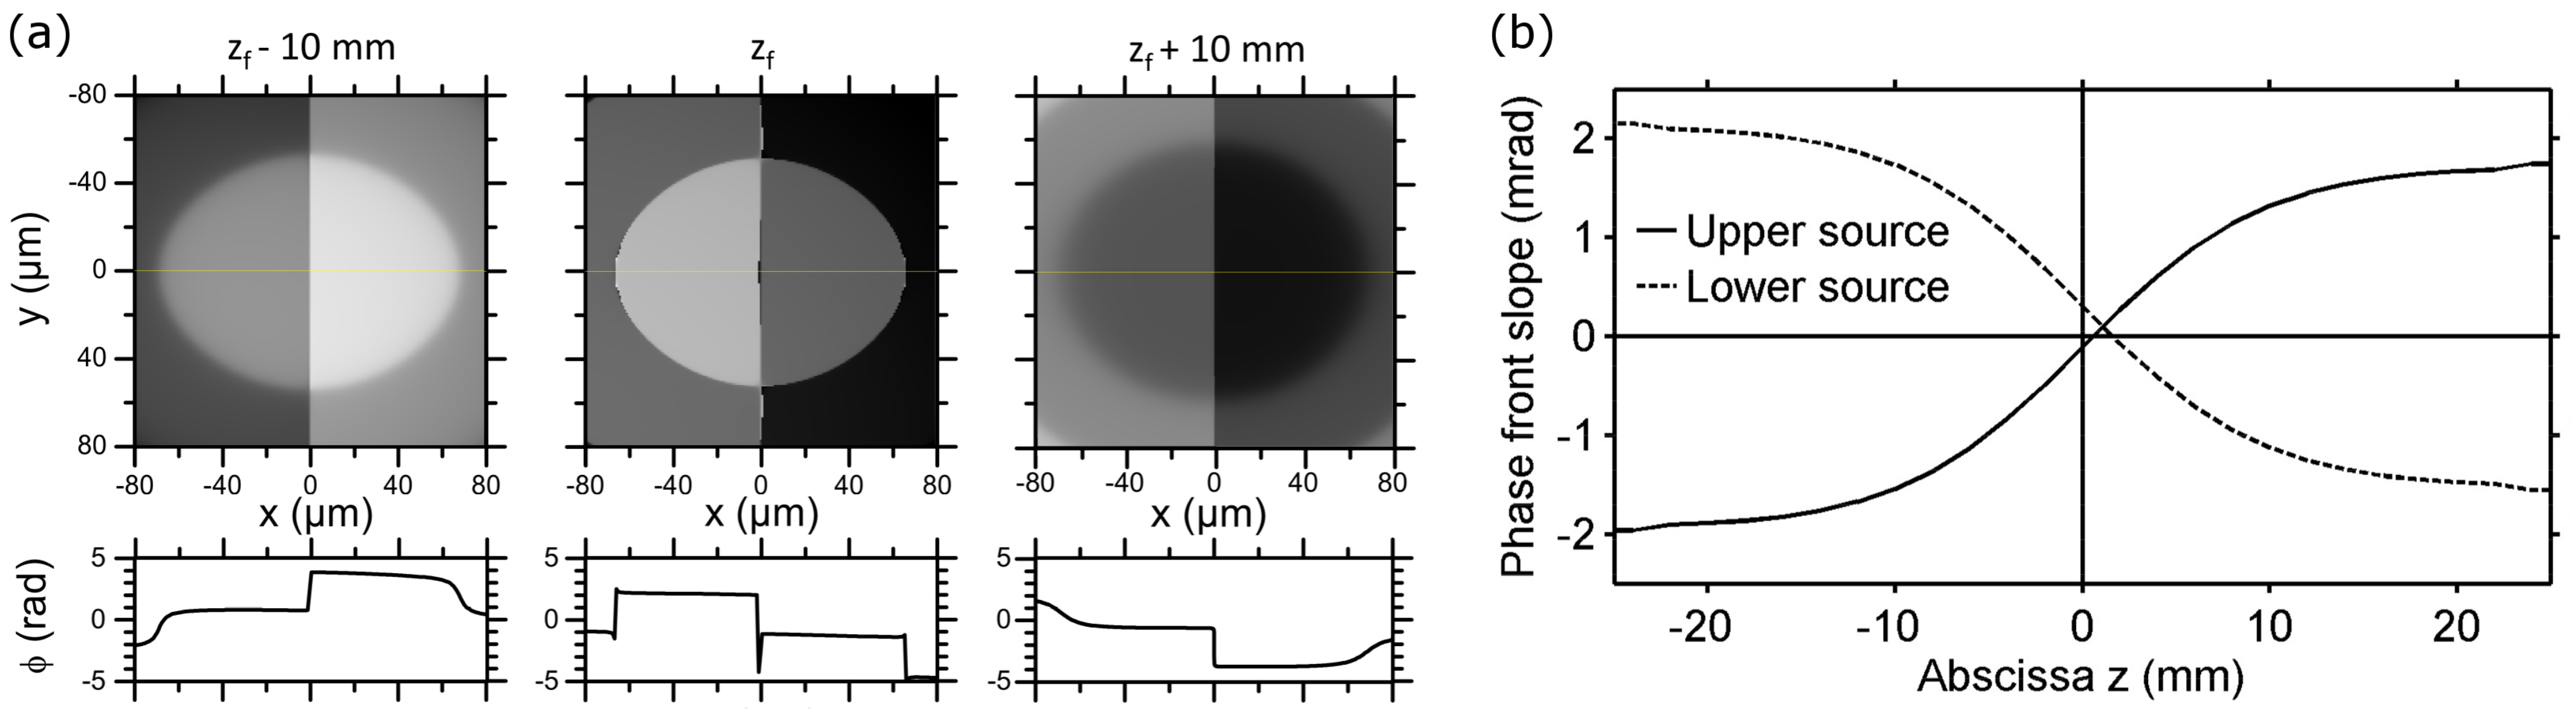
Figure 3a shows the phase front of the GSB at the focus of a 1-m focusing lens (central column) and 10mm upstream (left column) and downstream (right column) of the focus. While at the exact focus position, the phase front is almost flat on both sides of the 0-
π phase step, a slope appears outside of focus. In order to estimate its impact on HHG, we evaluate this slope at the position of the two harmonic sources,
id est, at the points of maximum laser intensity.
Figure 3b shows the phase front inclination for each source as a function of the distance along the propagation axis. The two sources see opposite phase slopes, so that, in general, they will emit in different directions. A positive sign in the upper (respectively lower) source phase front slope indicates that the harmonics are propagating towards (resp. away from) the optical axis. We conclude that there is only one position along the propagation direction for which the two emissions are emitted parallel to one another. Note that in this case, the harmonics from the two sources do not propagate along the IR propagation axis, but they are emitted with a small angle (the value of the slope when the two curves cross is not zero). This condition is reached when the jet is placed shortly downstream of the laser focus. This position is known for allowing the phase-matching of both short and long trajectories [
27,
28]. To conclude this discussion, if the gas target is far enough away from the laser focus (upstream or downstream), the harmonic emission from the two sources will no longer overlap and will not interfere. When the laser focus is placed upstream of the gas jet (
), the upper (resp. lower) harmonic emission measured in the far-field will be generated by the upper (resp. lower) source, whereas it will result from the lower (resp. upper) bright spot non-linear interaction with the generating medium if the latter is placed downstream of the laser focus.
Figure 3.
(a) Phase front bidimensional maps (first row) and lineouts along y=0 (second row) of a Gaussian laser beam shaped with a 0-π phase plate 10mm upstream of the focus of a 1-m lens (left) (–10mm), at the focus (center) () and 10mm downstream of the focus (right) (+10mm). The beam diameter is 32.4mm at 1/e2. It is apertured down to 15mm and has a 10-mm hole centered on-axis. This annular beam geometry corresponds to the one used with the LUCA laser. We checked that the results presented here are still valid for the Gaussian geometry used for the Aurore laser. (b) Phase front inclination at peak intensity across the laser focus in, respectively, the upper (solid line) and lower (dashed line) source.
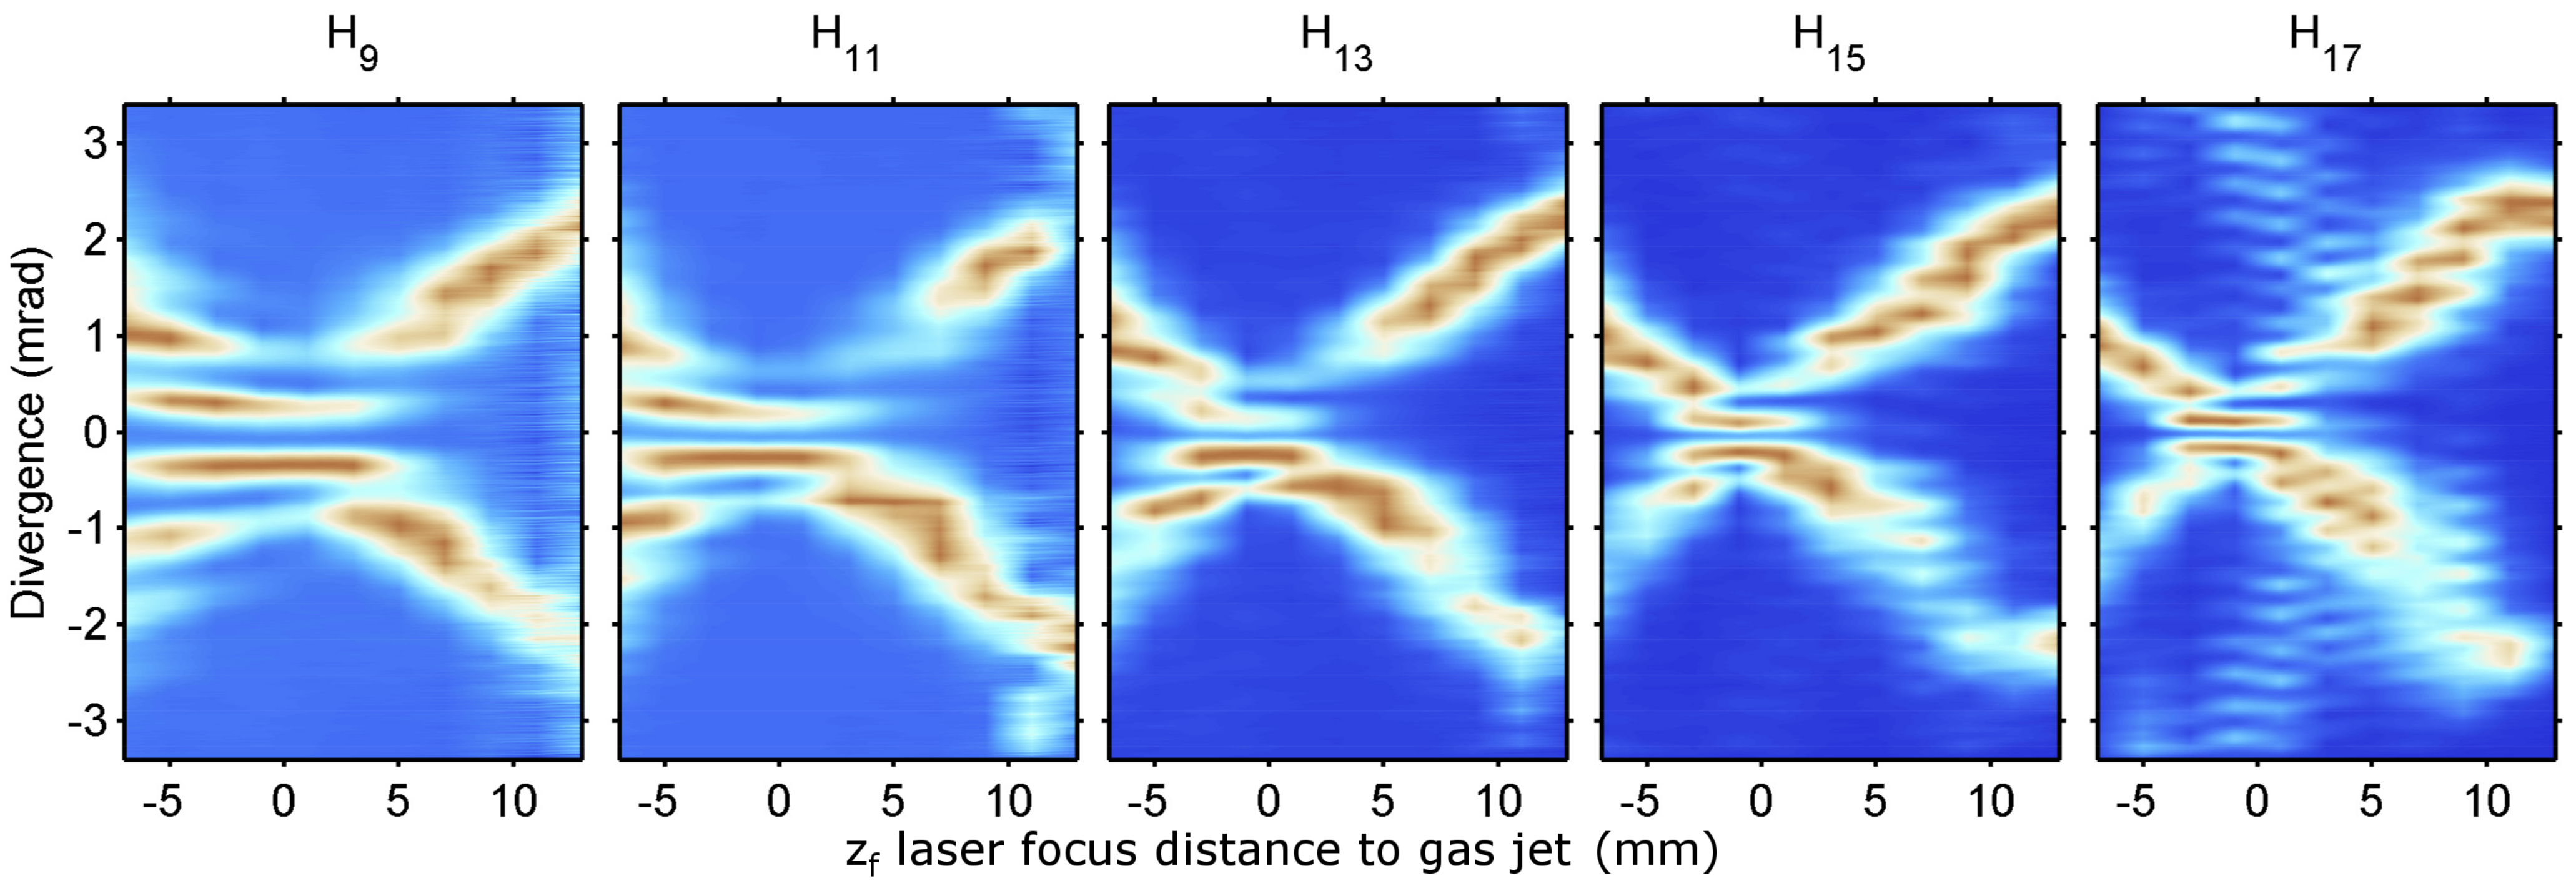
To investigate experimentally the influence of the phase front inclination, we generated harmonics using the Aurore Ti:sapphire laser system at CELIA, which delivers 8mJ, 25-fs pulses at 1kHz (see also the results presented in [
14]). A hard aperture of 7mm in diameter was placed in the laser beam. Harmonics were produced by focusing the phase-shaped beam in a 250
μm-thick continuous jet of nitrogen gas with a lens of 500mm in focal length. The phosphor screen is about 500mm away from the two sources.
Figure 4 shows the far-field spatial profile of H
9 to H
17 as a function of the laser focus with respect to the gas jet position. These measurements confirm that the two sources generally emit harmonics in different directions. Interferences are only observed when the focus is close to the gas jet position. This condition is even more strict for higher harmonics. In addition, for H
15 and H
17 generated close to the focus, one can clearly identify out-of-axis contributions that can be related to long-trajectory HHG. Although this part of the emission also features fringes, the phase in the short-trajectory HHG can still be analyzed, since the two contributions are spatially separated.
Figure 4.
(Color on-line) Far-field profile of H9 to H17 of the Aurore laser at CELIAgenerated with a 0-π phase-plate when the gas jet is moved through the focus. The peak intensity has been normalized for each harmonic and each position of the gas jet. The gas target is nitrogen.
Figure 4.
(Color on-line) Far-field profile of H9 to H17 of the Aurore laser at CELIAgenerated with a 0-π phase-plate when the gas jet is moved through the focus. The peak intensity has been normalized for each harmonic and each position of the gas jet. The gas target is nitrogen.
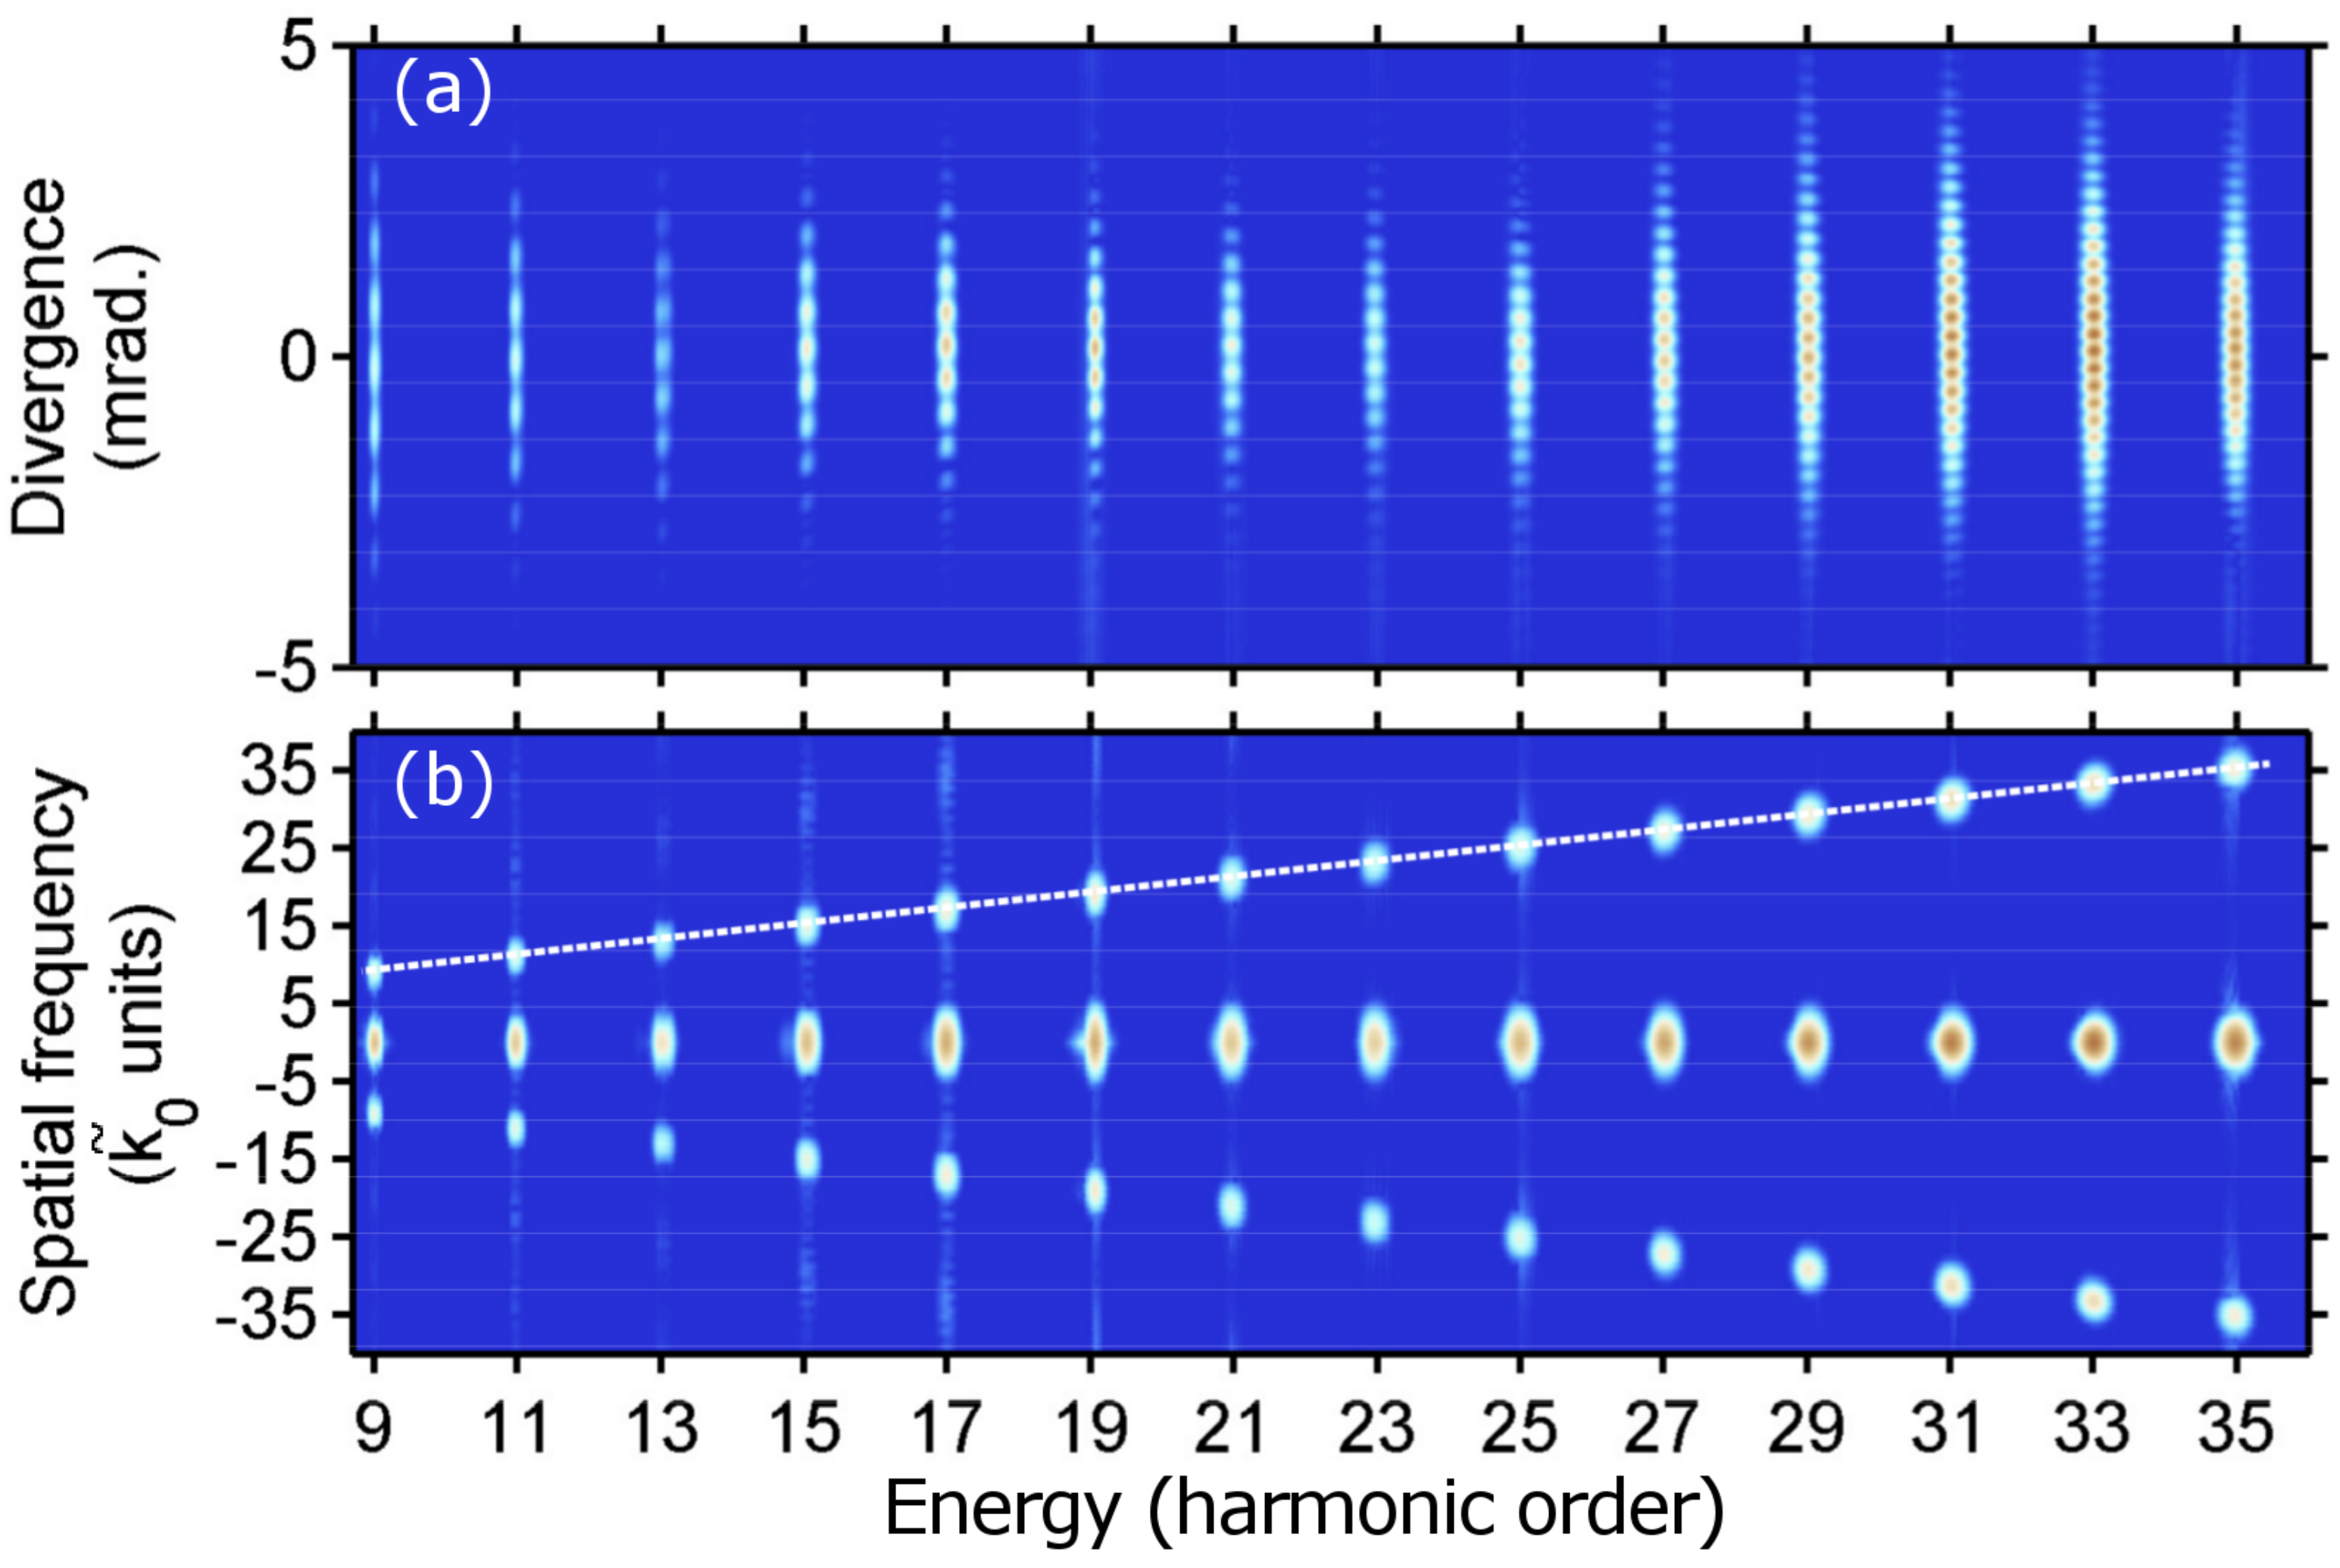
After optimizing the focus position, we study the harmonic interference pattern over a broad spectral range by generating in sulfur hexafluoride (SF
6). This broad-band spectrum presented in
Figure 5a results from the juxtaposition of the first and second diffraction orders of the XUV-grating. H
9 to H
17 were obtained from the first order of diffraction and H
19 to H
35 from the second order. The relative amplitude between the two spectra was adjusted following the results presented in [
29].
Figure 5b shows the amplitude of the one-dimensional Fourier transform of the above spectrum along the vertical dimension. The dashed line emphasizes the linear relation between the interferogram spatial frequencies and the photon energies:
where
D is the source-to-screen distance,
a the distance between the two sources,
the spatial frequency demagnification rate,
the IR fundamental wavelength,
q the harmonic order and
the q
harmonic order wave vector modulus. The dispersion described in Equation (
1) is expected from the analogy with the Young double-slit experiment. In particular, the spatial frequencies are proportional to the source spacing, and the smaller
a, the higher spatial frequencies can be resolved. We believe that our mode conversion approach offers the smallest source-to-source distance possible, since in this case,
a is only twice the full width at half maximum (FWHM) of one source (see [
14]).
Figure 5.
(Color on-line) (
a) Interference pattern in the SF
6 HHG spectrum reconstructed from the first (H
9 to H
17) and second order (H
19 to H
35) of diffraction of the grating; (
b) Fourier transform decomposition in spatial frequencies of the interferogram presented in (a). The dashed line reveals the Young double-slit linear dispersion. Spatial frequencies are given in
units (see Equation (
1) in the text).
Equation (
1) can also be used to gain insight into TSI bandwidth limitations imposed by its intrinsic achromatic demagnification rate Γ. At low photon energies, Γ might be too weak. At least one full period of the spatial oscillation is required to determine the phase difference between the two emissions. Considering in first approximation that all harmonic orders have the same divergence, there is a lower photon energy limit for which this condition is no longer met. At high energies, the highest spatial frequency that can be resolved by the detector following the Shannon–Nyquist criteria is finally limited to half the inverse of the center-to-center pixel distance of the CCD camera imaging the phosphor screen. The spatial spectrogram presented in
Figure 5a is within these limits.
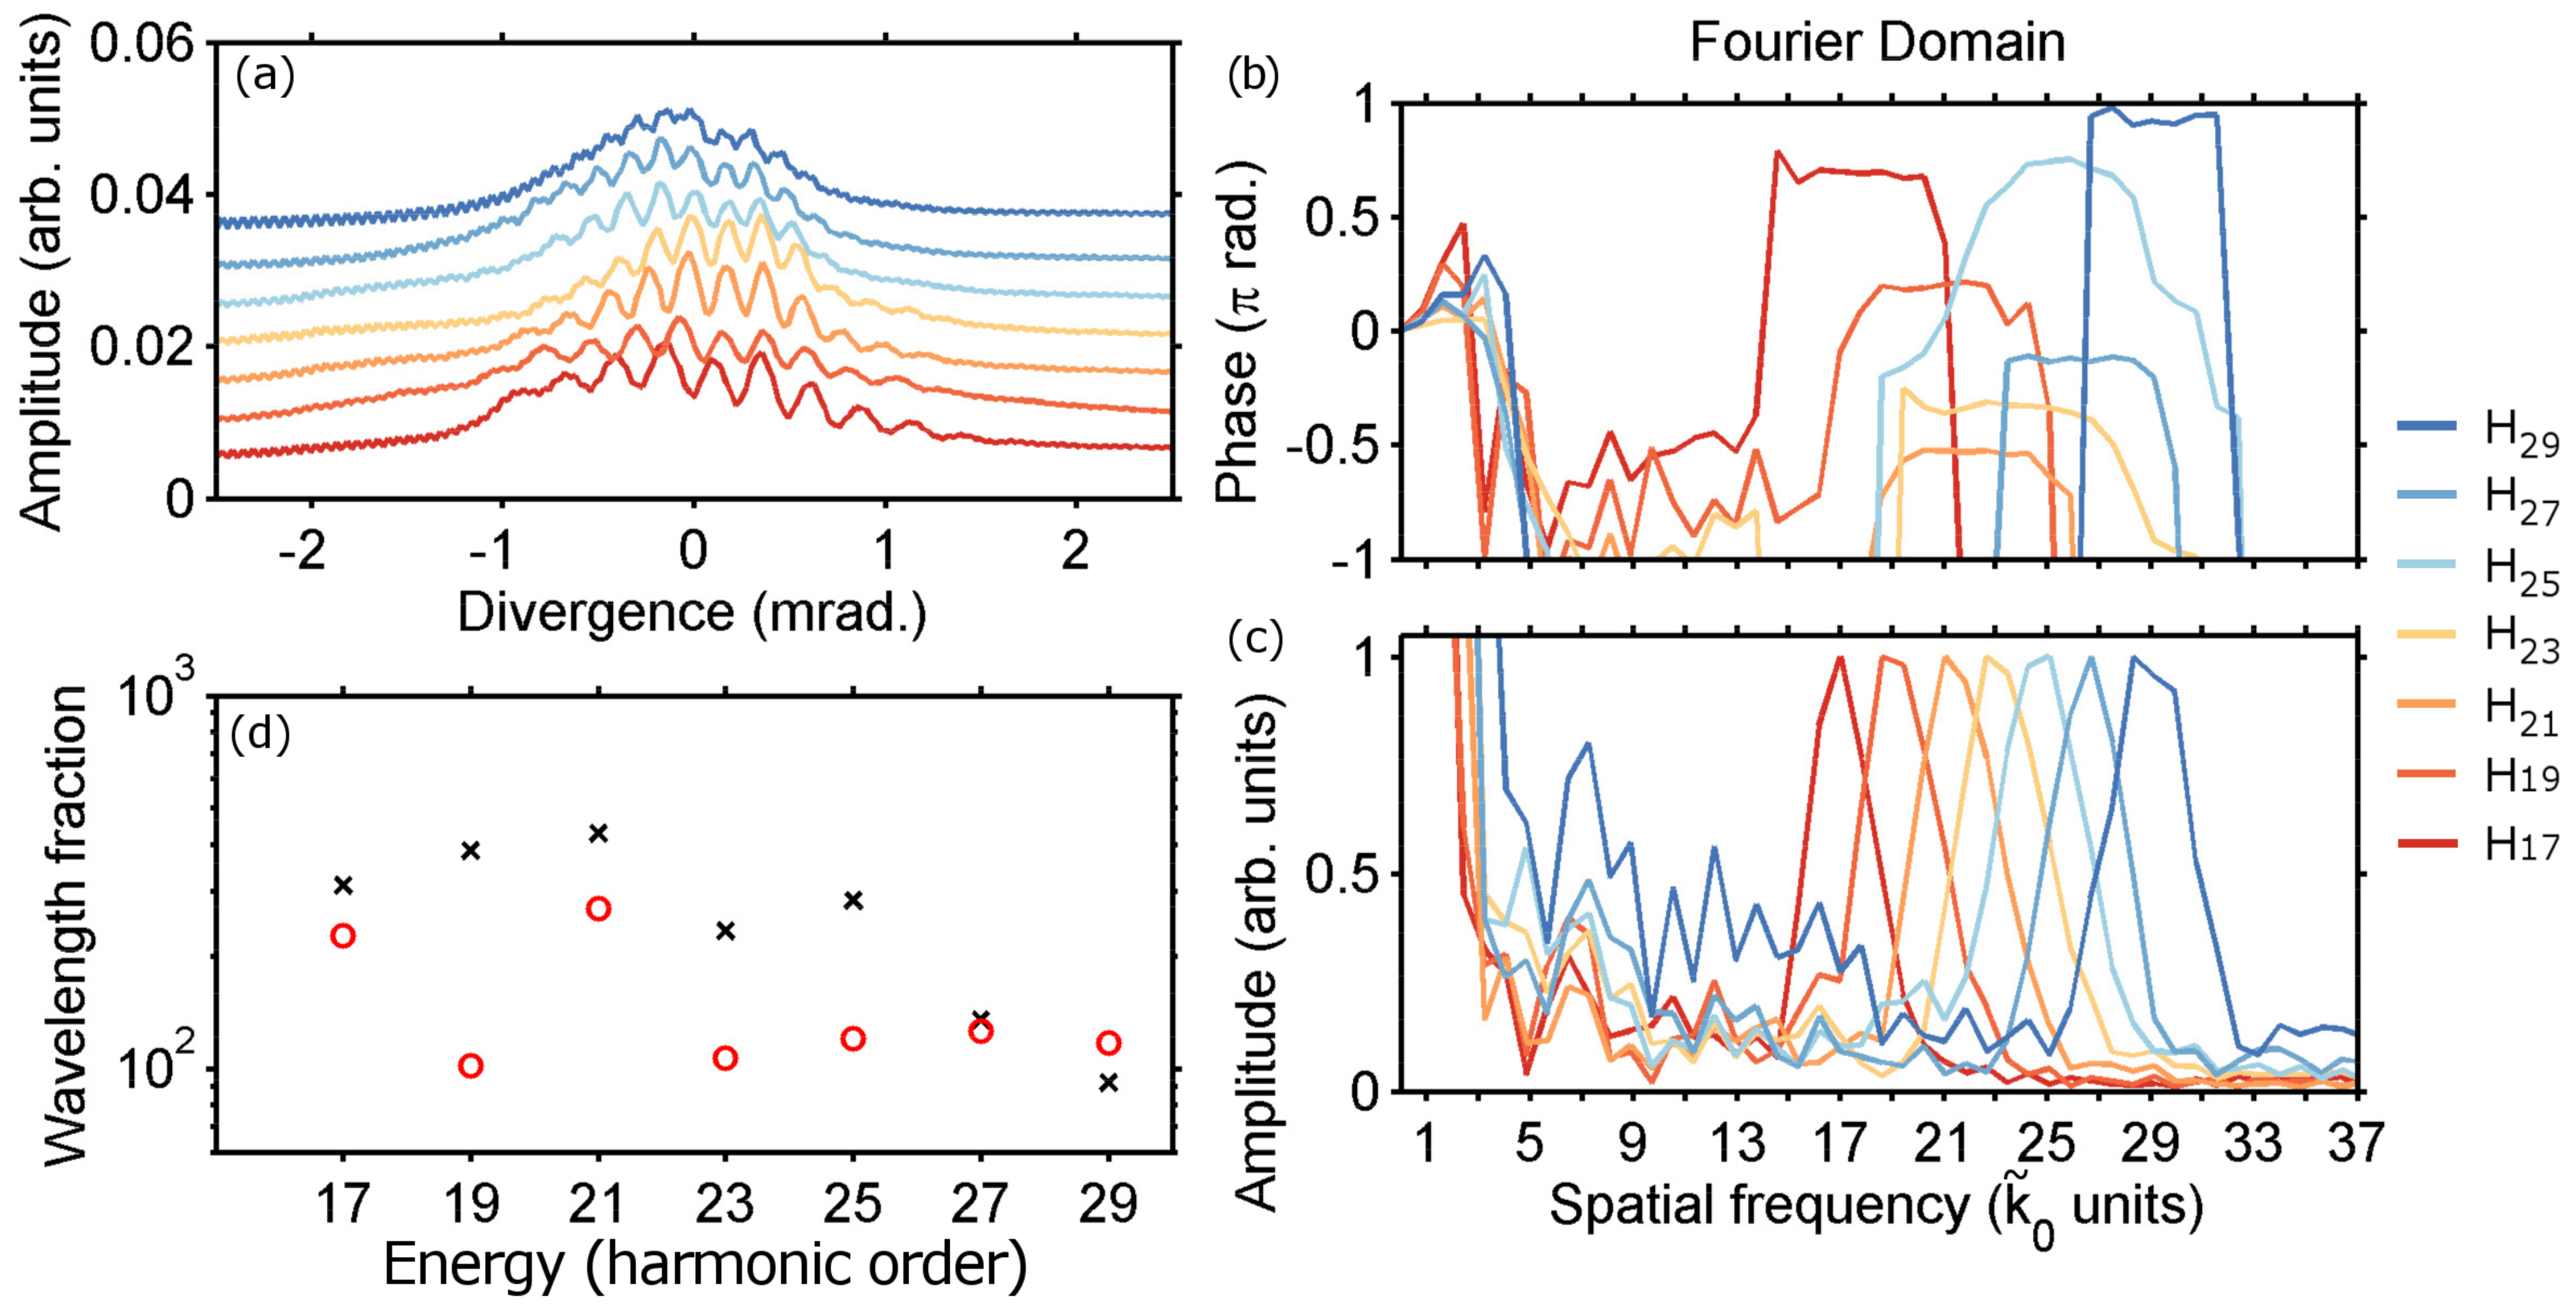
The dispersion relation of Equation (
1) is also found in
Figure 6, which features far-field profile lineouts (Panel a) of H
17 to H
29 generated in nitrogen with LUCA (100mJ, 20Hz, 60fs, CPAlaser system available at CEA-Saclay) and both the phase (Panel b) and amplitude (Panel c) of the Fourier transform of these fringe patterns. The imaging system used in this experiment has a lower resolution than the one used at CELIA, and the spatial frequency in H
29 is close to the highest that can be resolved. In the next section, we use the harmonics generated in nitrogen to investigate the precision on phase measurements and the stability of our phase-plate mode conversion interferometer.
Figure 6.
(Color on-line) (a) The fringes’ lineout of H17 (red) to H29 (blue) generated in nitrogen with the LUCA laser. Each harmonic order was integrated over a 0.2-photon unit interval centered at the harmonic frequency; the harmonic spatial profiles have been arbitrarily shifted for clarity; (b) phase and (c) amplitude of the Fourier transform of each fringe pattern presented in (a); the phase has been wrapped, so that its variations around the amplitude peak are clearly visible for each harmonic order. The amplitude has been normalized at the non-zero spatial frequency peak. (d) The red circles represent the precision of the interferometer evaluated as 2π times the inverse of the standard deviation of the phase over the spatial frequency width of each amplitude peak. The black “x”-shaped crosses indicate the long-term stability of the interferometer estimated as 2π times the inverse of the standard deviation of the phase for about ten thousand shots.
5. Inversion of the Harmonic Phase at a Threshold
In this section, we illustrate the interest of TSI in HHG and the benefits of our highly stable interferometer by studying the response of near-threshold harmonics to molecular rotations and vibrations. We first consider HHG from rotationally-excited nitrogen molecules. In 2009, Lock
et al. [
30] reported no phase variations inside nitrogen revival using TSI. This result was used to support a failure of the two-center model [
31] in the N
2 highest occupied molecular orbital (HOMO) recombination dipole. This result was almost immediately challenged by phase measurements using other techniques, like gas mixing [
12], transient grating spectroscopy [
13] and RABBIT(Reconstruction of Attosecond Beating by Interference of two–photon Transitions) [
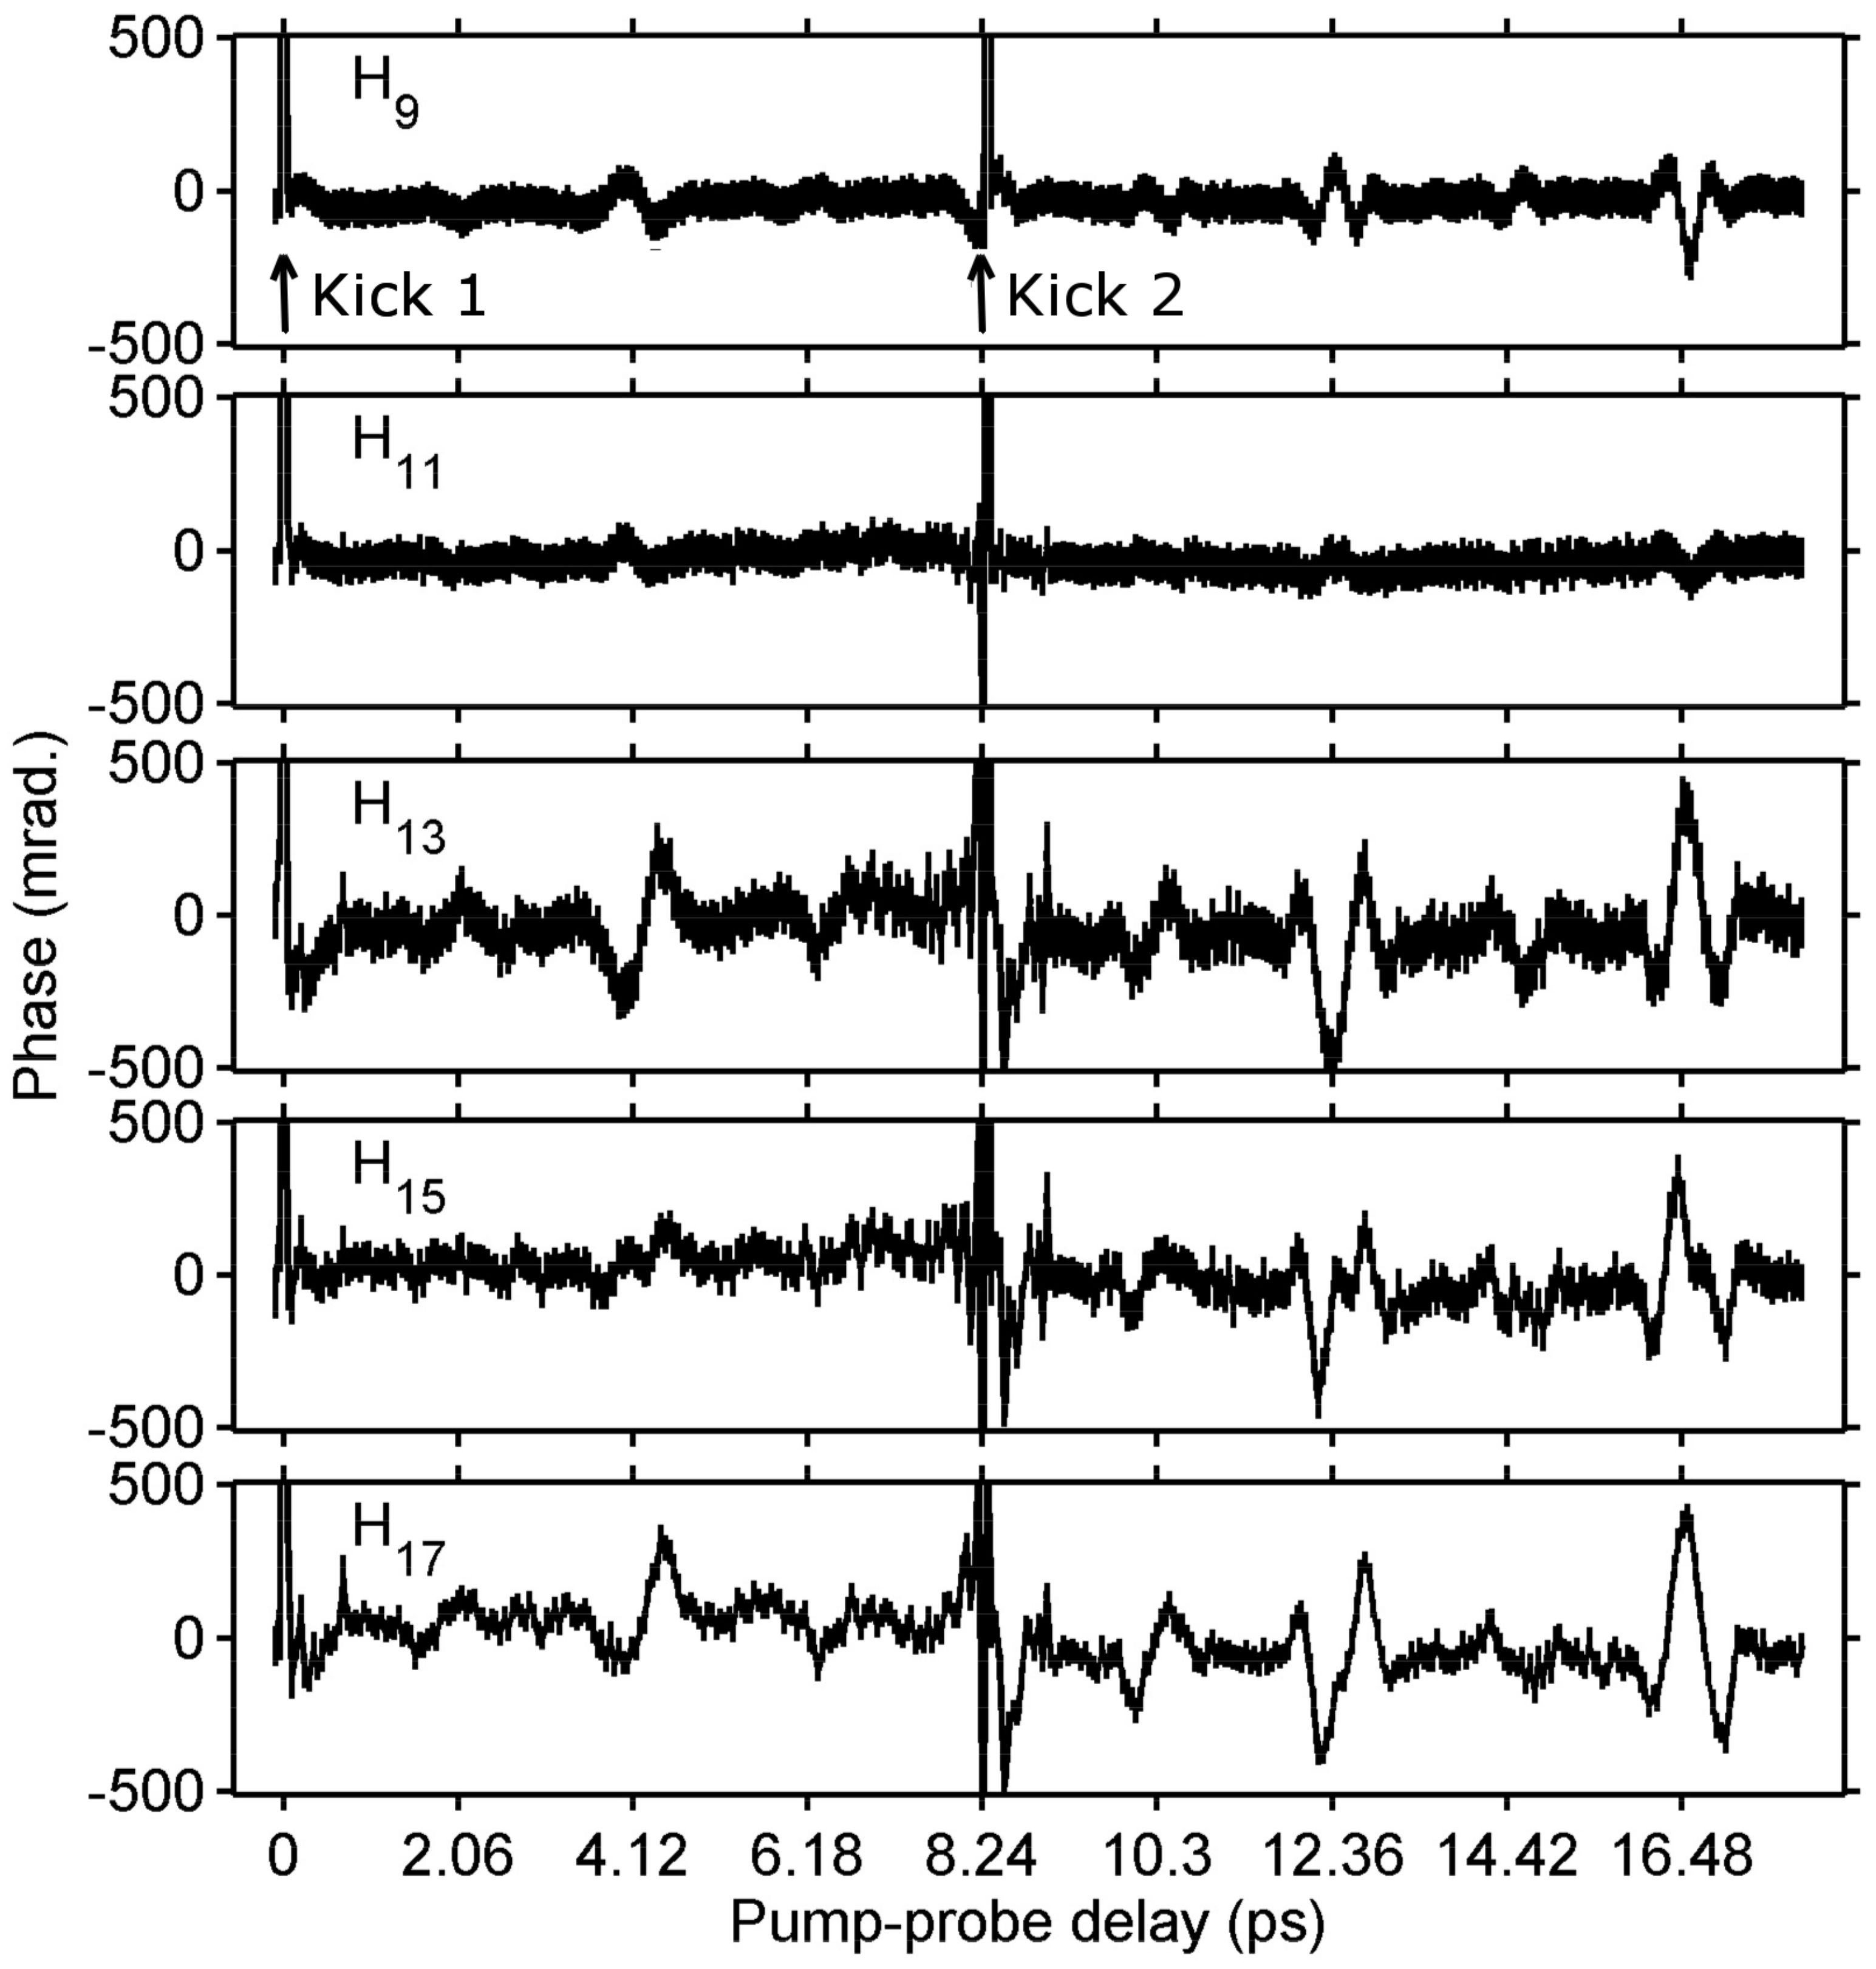
2]. However, to our best knowledge, no further attempts to measure the phase variations inside the revival of nitrogen using TSI were reported. In
Figure 7, we show phase measurements inside the revival of N
2 for H
9 to H
17 using our mode-conversion interferometer and a two-pulse alignment stacker [
32]. The first striking feature of
Figure 7 is that even after only one kick, the first quarter, first half and third quarter revivals (resp. at 2.06, 4.12 and 6.18ps) are clearly seen in all harmonic orders studied here. The second kick allows one to couple more energy into the rotational wave packet initiated by the first kick, to increase the degree of alignment and therefore the contrast of the revival trace, which corresponds here to a deeper phase modulation. Being able to follow nitrogen revival through the variations of the high harmonics phase reflects the high stability of our experimental arrangement. We expect that being able to measure phase variations inside molecular revival with good enough resolution will greatly help to understand specific issues, like fractional revivals [
33,
34].
Figure 7.
The phase of H9 to H17 generated in nitrogen as a function of the alignment pump-HHG probe delay. Two kickers (indicated with arrows on the first row) separated by one full rotational period (8.24ps) are used to increase the degree of molecular alignment.
Figure 7.
The phase of H9 to H17 generated in nitrogen as a function of the alignment pump-HHG probe delay. Two kickers (indicated with arrows on the first row) separated by one full rotational period (8.24ps) are used to increase the degree of molecular alignment.
The second piece of information extracted from
Figure 7 is that the phase variations change sign when the photon energy crosses the ionization potential (15.58eV for the HOMO of nitrogen); in our sign convention, the phase of H
9 and H
11 is maximum at half-revival, whereas it is minimum for H
13 to H
17. Interestingly, H
11 (which might be below the N
2 effective ionization potential due to the ponderomotive shift [
35] in our experimental conditions) is the least contrasted. This could be the result of a destructive interference between two processes contributing to the harmonic emission, like HHG and multiphoton perturbative harmonic generation.
The same kind of inversed behavior in HHG when crossing the ionization threshold was reported in a quantum path-resolved harmonic yield study [
36]. For the short trajectories investigated here, this inversion was interpreted as the signature of resonant multiphoton processes. In another kind of experiment, a phase difference between harmonics generated at the threshold in unaligned nitrogen and argon (nitrogen’s atomic partner, which is an atomic species with a similar ionization potential) was measured by RABBIT [
37,
38] and interpreted as the effect on the recombination of the Hopfield resonance [
39] featured by the ionic potential. The full understanding of this inversion, seen both in the phase and the amplitude of the harmonics generated in aligned nitrogen molecules, is beyond the scope of the current paper, but we believe that the phase inversion is important additional information towards this goal. Near the threshold HHG showing particularly interesting features in excited molecules, we investigated another type of excitation: vibrations. We generated harmonics in sulfur hexafluoride [
40,
41,
42,
43], which has a similar ionization potential to nitrogen and argon.
The results reported by Wagner
et al. [
40] in SF
6 were the very first evidence of time-resolved vibrational quantum beats in molecules followed by HHG self-probing spectroscopy. More recently, phase measurements in vibrationally-excited SF
6 using a transient excitation grating [
43] and our mode-conversion interferometer [
44] were reported for H
13 to H
27. In
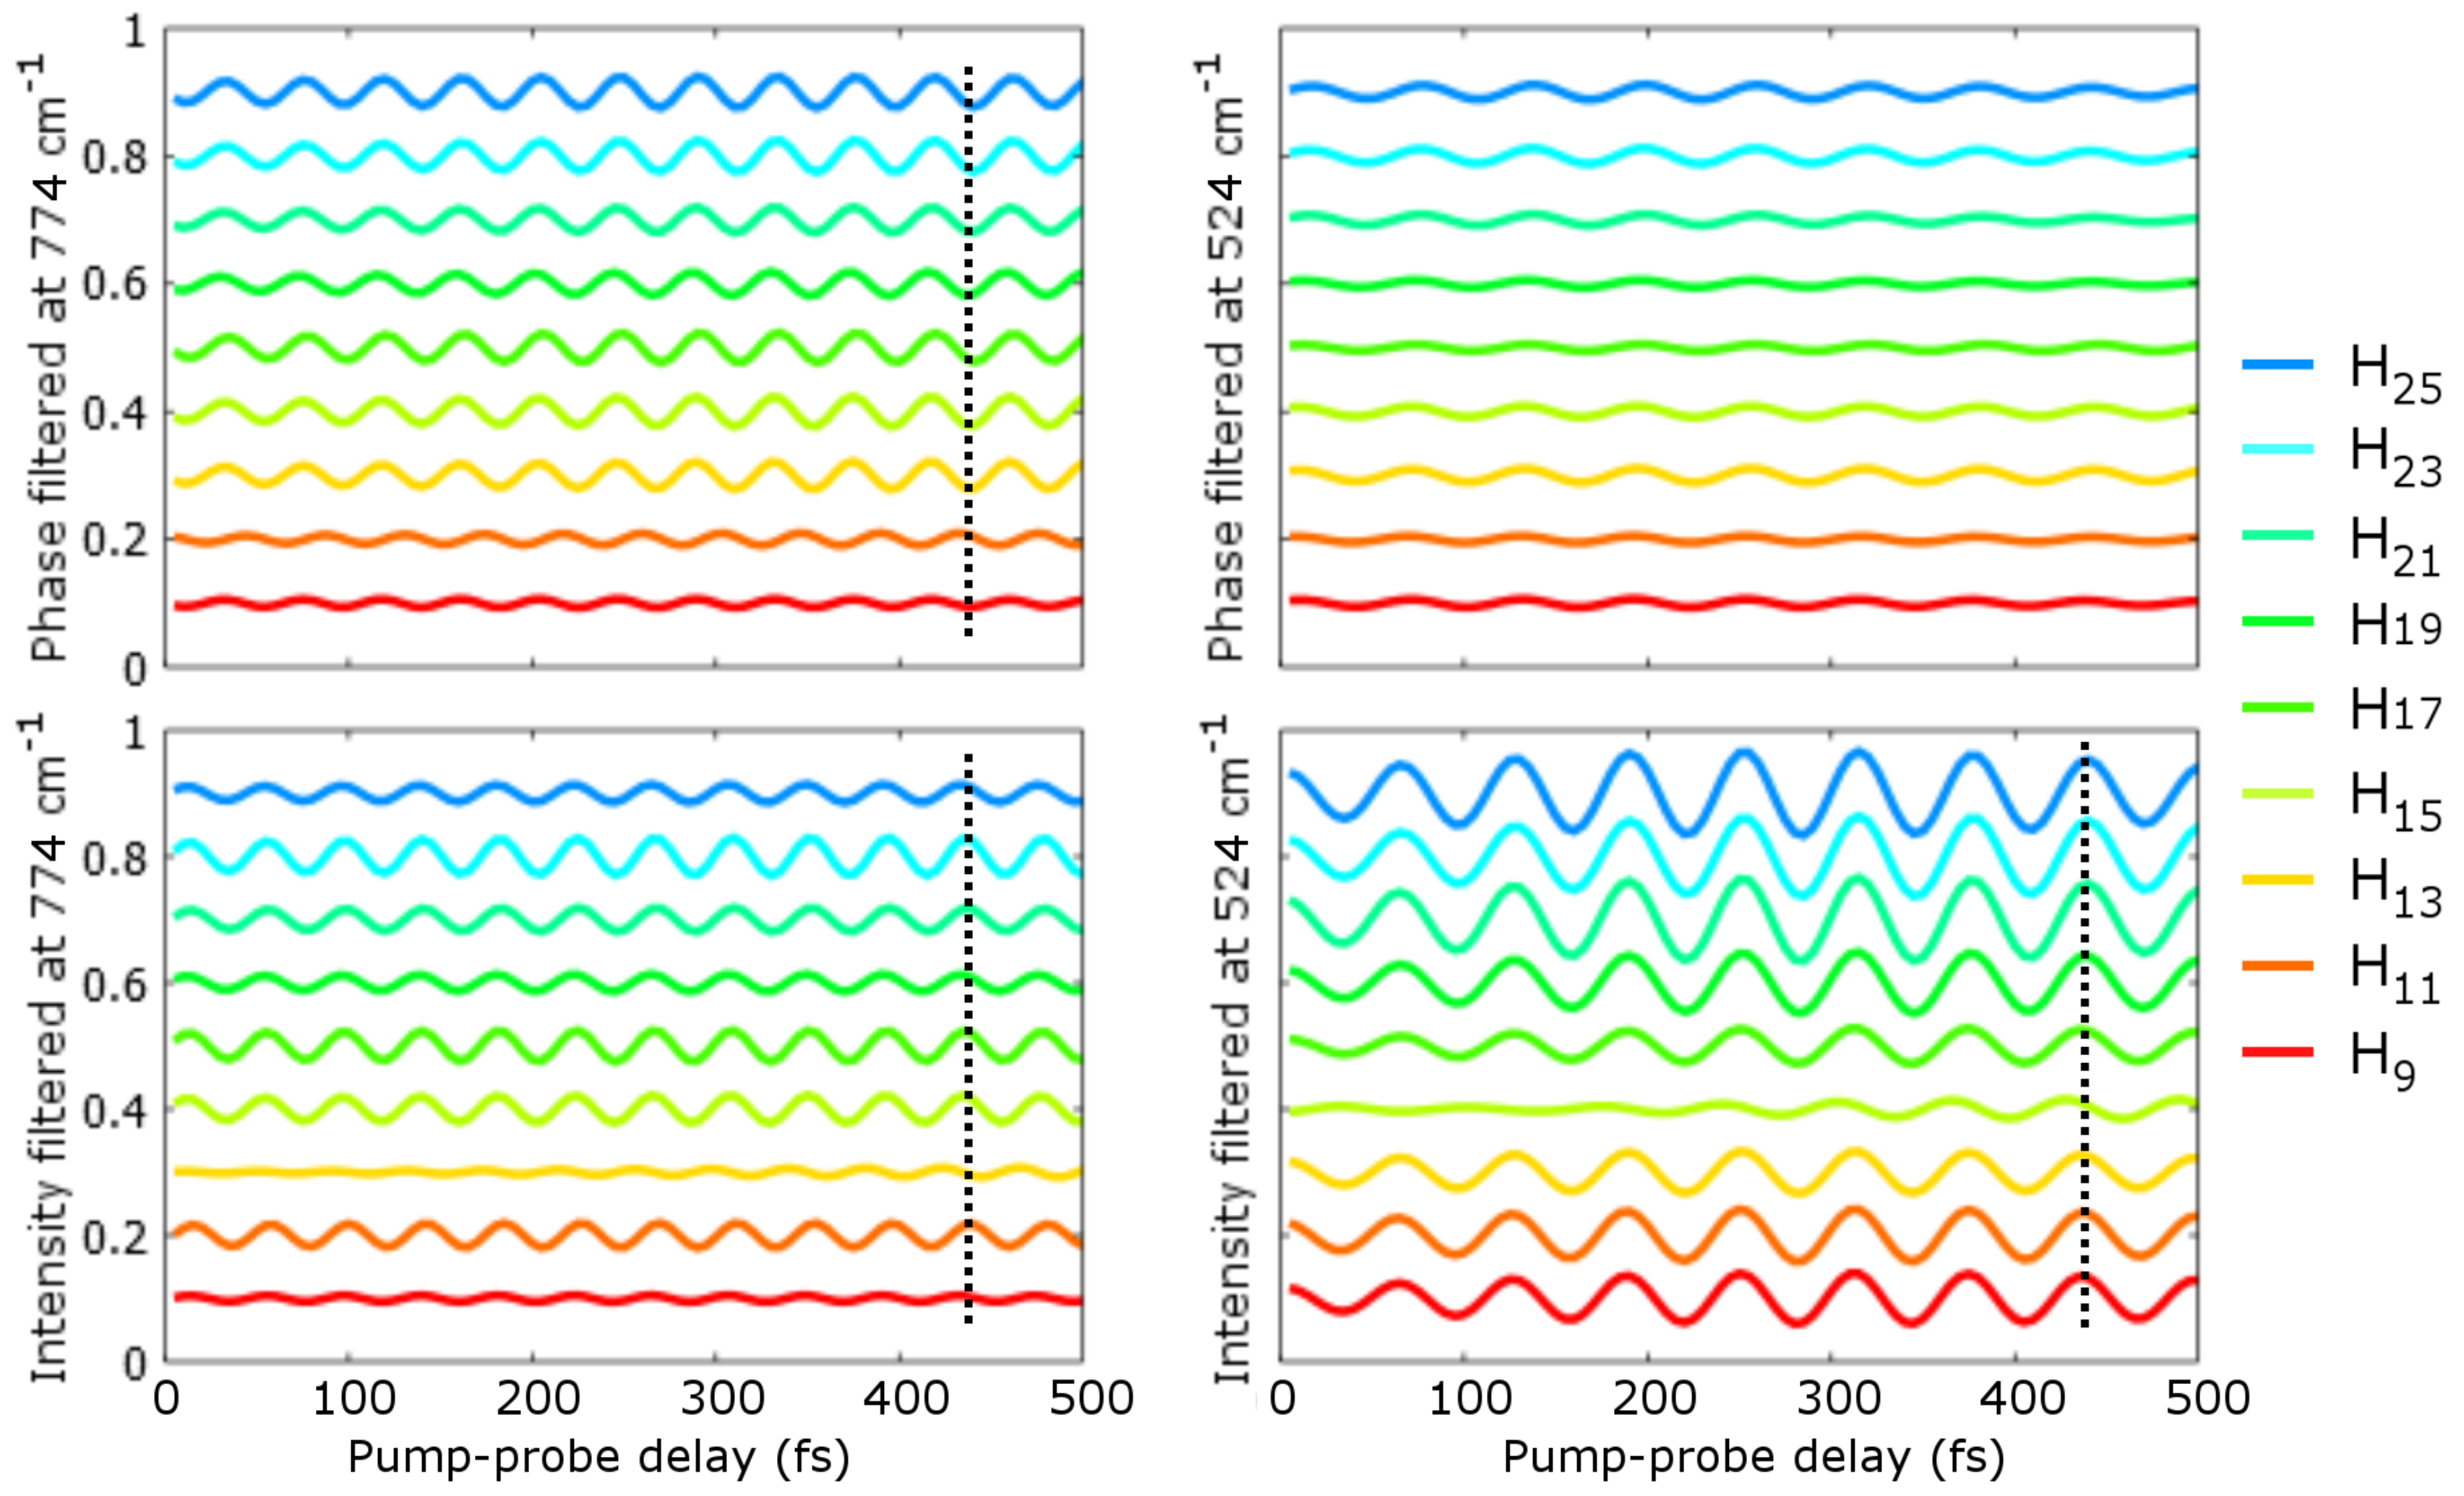
Figure 8, we present the results extended to H
9 and H
11, that is to harmonic orders below and at a threshold of SF
6 HOMO (15.7eV), HOMO-1 (16.9eV), HOMO-2 (17.2eV) and HOMO-3 (18.3eV). Our previous studies showed that these orbitals may give non-negligible contributions to the harmonic emission [
44]. The four panels of
Figure 8 show the oscillations of the phase (first row) and intensity (second row) of H
9 (red) to H
25 (blue) as a function of the pump-probe delay, filtered at two different vibrational mode frequencies: 774cm
−1 (
-A
1g mode, first column) and 524cm
−1 (
-T
1g mode, second column). The first piece of information in
Figure 8 is that all harmonic orders show intensity and phase modulations at these two vibrational mode frequencies. Also weaker, the oscillations in the phase signal filtered at 524cm
−1 are real and significant. For the three other panels, the oscillations are in phase in all harmonic orders, except one, which shows close to out-of-phase less contrasted oscillations. This is the case for H
11 (harmonic generated at a threshold of SF
6 HOMO-2) in the phase filtered at 774cm
−1, for H
13 in the intensity filtered at 774cm
−1 and for H
15 in the intensity filtered at 524cm
−1. As proposed in [
44], the dephasing occurring at H
13 and H
15 in the oscillations of the intensity could be linked to the shape resonance in the B-channel of SF
6 (corresponding to ionization from and recombination to HOMO-2). The new result presented here is the dephasing in the oscillations of the phase at H
11, which we believe is a similar effect to the one observed at the threshold in the revival of nitrogen.
We foresee that all of these experimental results will guide theoretical studies to better understand several issues, such as the mechanism for HHG at the threshold of a molecule, the effect of Hopfield resonances on HHG and also how strong-field ionization populates vibrational levels in different polyatomic molecular cations and how this affects HHG.
Figure 8.
(Color on-line) Phase and intensity of H9 (red) to H25 (blue) generated in SF6 as a function of the pump-probe delay filtered at two vibrational frequencies (774 and 524 cm−1). All curves are arbitrarily shifted for clarity. The dashed lines help to visualize the relative phase of the oscillations.
6. Conclusions
We reported on a thorough investigation of the spatial mode-conversion TSI arrangement presented in [
14]. In particular, we presented overlap integral computations showing that 90.94% of an incident Gaussian beam of waist
is converted into a TEM
01 mode of waist 0.58
. We emphasized the relation between the IR laser phase-front curvature and the far-field overlap of the two XUV beams when using this mode-conversion device to create two spatially-separated HHG sources at the focus of a lens. We demonstrated the high resolution of this interferometer (
down to 27nm) and the good stability of the overall setup (the standard deviation of the phase measurement is 46.5mrad at H
27).
This arrangement was finally used to investigate the harmonic phase in rotating and vibrating molecules. In particular, we have shown that it is possible to follow N2 revival and vibrational quantum beats in SF6 through TSI phase measurements. At the threshold of these two molecules, similar results are observed in the behavior of the phase variations. The harmonic generated at the threshold of the molecule shows an inverted behavior with respect to the harmonic generated above the threshold. More theoretical investigations are needed to determine whether this is an intrinsic or phenomenological feature of HHG in molecules.
This work has been supported by the FP7 program, LASERLAB-EUROPE, Grant No. 284464, by the French National Research Agency (ANR) through the “Laboratoire d’Excellence Physics Atoms Light Mater” (LabEx PALMANR-10-LABX-0039-PALM) and by the ANR Attowave (ANR-09BLAN-0031-01) and MISFITS(ANR-14-CE32-0014). We also acknowledge financial support of the Conseil Régional d’Aquitaine (20091304003 ATTOMOL and COLA2 No. 2.1.3-09010502) and the European Union (EU-FP7-ATTOFEL). AC acknowledges financial support from DGA.
