Measurement and Evaluation Method of Distributed Optical Fiber Acoustic Sensing Performance

1
Department of Electronic and Communication Engineering, North China Electric Power University, Baoding 071003, China
2
Hebei Key Laboratory of Power Internet of Things Technology, North China Electric Power University, Baoding 071003, China
*
Author to whom correspondence should be addressed.
Photonics 2024, 11(2), 166; https://doi.org/10.3390/photonics11020166
Submission received: 14 December 2023
/
Revised: 4 February 2024
/
Accepted: 5 February 2024
/
Published: 8 February 2024
(This article belongs to the Section Lasers, Light Sources and Sensors)
Abstract
:Distributed acoustic sensing incorporates multiple indicators, and there exists a mutually constraining relationship among these indicators. Different application fields have varying requirements for indicators. Therefore, indicator testing and comprehensive evaluations are crucial for engineering applications. In this paper, we conducted a theoretical analysis of key indicators, including frequency response, sensitivity, spatial resolution, sensing distance, multi-point perturbation, and temperature influence. The indicator test scheme was developed, and a test system was constructed. The test data were analyzed and compared in the time-frequency domain. A performance evaluation method for distributed acoustic sensing, based on the analytic hierarchy process, is proposed, and a comprehensive evaluation example focused on high-frequency applications is presented. The results show that the test scheme and method presented in this paper can accurately measure the upper limits of each indicator of distributed acoustic sensing. The proposed comprehensive evaluation method enables the assessment of sensor performance and applicability based on engineering practices. It addresses the challenge of evaluating distributed acoustic sensing with multiple indicators and offers an efficient approach for equipment development and engineering applications.
1. Introduction
Distributed fiber optic sensing technology utilizes light as the carrier of information and fiber optics as the medium for transmitting this information [1]. It enables the long-distance and distributed measurement of temperature, strain, vibration, and other parameters [2]. In the field of vibration measurement, phase-sensitive optical time-domain reflection (φ-OTDR) technology is highly regarded due to its advantages of high sensitivity, fast response speed, and high signal-to-noise ratio [3,4,5]. Distributed acoustic sensing (DAS) is one of the commercially available φ-OTDR devices that are already being extensively employed for diverse engineering applications. The DAS can perform the real-time demodulation of phase information related to the position of a disturbance [6]. This enables it to accurately restore external disturbance signals [7]. As a result, the DAS exhibits great promise for various applications. It is necessary to master the operation steps of DAS devices and the basic indicators of DAS in depth. DAS has significant potential for applications in areas such as seismic observation and perimeter security.
In recent years, scholars have applied DAS in various condition-monitoring fields and obtained significant results. Table 1 shows the test/evaluation requirements for DAS in different application areas. These application areas require the evaluation of indicators, including the sensitivity and spatial resolution of DAS. DAS systems encompass a variety of indicators, each with interdependencies and constraints. In different application domains, indicator requirements vary. Therefore, it is crucial to assess the overall performance of DAS devices. However, there is currently a lack of research on the comprehensive evaluation of DAS performance.
In 2015, E. T. Nesterov et al. concluded that modulation instability limits the maximum optical pulse power, which, in turn, affects the sensing distance in DAS [13]. In 2019, Hugo F. Martins et al. conducted a review on the substitution of coherent light pulses with chirped light pulses in φ-OTDR systems, resulting in the development of chirped φ-OTDR systems [14]. This modification led to a significant enhancement in both the sensing distance and sensitivity of the system. In 2023, A.T. Turov et al. investigated the impacts of detection pulse parameters, as well as generator and amplifier parameters, on the spatial and spectral characteristics of DAS. This study also introduced methods aimed at reducing monitoring costs [15]. In the same year, Boris G. Gorshkov et al. increased the sensitivity of DAS by 1.3 times, eliminating spontaneous Brillouin scattering noise [16]. The current research mainly focuses on the influence of a certain parameter on a specific performance indicator in the DAS. However, there is a lack of research on the measurement and evaluation of the overall performance of DAS. In 2018, the Fiber Optic Monitoring Group disclosed the testing methods for some indicators of DAS, including the dynamic range test, frequency response test, fidelity test, self-noise test, spatial resolution test, and crosstalk test [17]. Building on this foundation, the paper introduces a method suitable for the on-site testing of DAS equipment. This method places minimal demand on the equipment and offers advantages such as low cost, simple operation, convenience, and feasibility.
In this work, we present the sensing principle of φ-OTDR systems. The fundamental indicators of DAS in commercial φ-OTDR devices can provide a basis for proposing methods and conducting experiments to systematically assess DAS indicators. The DAS underwent a series of tests to evaluate its performance in various aspects. These tests included the frequency response test, amplitude test, spatial resolution test, sensing distance test, multi-point perturbation test, and temperature influence test. A comprehensive performance evaluation method for DAS based on the hierarchical analysis process (AHP) is designed to systematically and comprehensively assess the performance of DAS devices.
In the application of DAS systems, two main types of optical fibers are commonly chosen as sensing fibers: the ordinary single-mode fiber (SMF) and fiber Bragg grating (wFBG) array or Rayleigh-enhanced points. In 2019, Peng Zhu et al. integrated a wFBG array into the φ-OTDR system to detect, in a quasi-distributed way, the partial discharge ultrasonic signal of the cable joint [18]. The detection signal covered a frequency range of 9–15 kHz. In 2022, Qirui Wang et al. successfully fabricated Rayleigh-enhanced points in the fiber under test (FUT) using the φ-OTDR system to detect guided wave ultrasounds [19]. This approach led to improvements in the performance and effectiveness of ultrasonic nondestructive monitoring. At the same time, this system, combined with a convolutional neural network, successfully monitored and identified internal pipeline defects with different damage degrees [20]. By employing a wFBG array or Rayleigh-enhanced points as the sensing fiber, significant improvements were observed in sensitivity, the signal-to-noise ratio, and other performance indicators. However, this shift transformed the system from distributed to quasi-distributed. The fabrication process of a wFBG array or Rayleigh-enhanced points is complex, and the associated costs are high, making it more suitable for short-distance condition monitoring. As this study involves the testing of the sensing distance indicator and is more inclined to analyze the performance indicators of distributed fiber sensing technology, ordinary SMF is selected as the sensing fiber.
2. Fundamental Theory
2.1. The Working Principle of φ-OTDR Coherent Detection System
The narrow linewidth laser (PL-NLWM-1550-C-2-SA-A-M) from LD-PD INC SINGAPORE generates continuous light with a narrow linewidth of <3 kHz, a wavelength of 1550 nm and a power of 60 mW. The continuous light is divided into two parts by the 90/10 coupler. The 90% part of it enters the acoustic-optic modulator (AOM, SGTF100-1550-1P) to modulate into a pulse signal with a frequency shift of Δf = 100 MHz [21,22]. The AOM is driven by an arbitrary waveform generator (AWG) to generate repetitive laser pulses. After being amplified by an erbium-doped fiber amplifier (EDFA), it enters the sensing fiber through an optical circulator (CIR) and undergoes Rayleigh scattering. The other 10% of the light passes through a polarizer scrambler (PS) and is used as the principal oscillator light with the backscatter Rayleigh (RBS) returning from the CIR to produce a beat-frequency signal in a 3 dB coupler. It is detected using a photodetector (PD, MBD-200M-AM) with a bandwidth of 200 MHz and converted into a high-gain electrical signal. The system schematic diagram is illustrated in Figure 1a. The voltage V(t) of the PD output beat signal can be simply expressed as follows:
Here, AL(t) represents the amplitude of the local oscillator. φt(t) represents the phase information that contains the vibration signal. In this process, several factors can influence the spatial resolution, sensitivity, and frequency response of the system, including the line width of the laser, the stability of the light source, the optical pulse width, and the bandwidth range of the PD. There are several demodulation methods available for φ-OTDR systems. Among them, the adoption of a digital in-phase and quadrature (IQ) demodulation scheme [23] can truly achieve phase demodulation, enabling the precise restoration of vibration signals and improving the signal-to-noise ratio (SNR) of the system. The demodulation schematic diagram is depicted in Figure 1b. The PD output signal performs IQ phase demodulation. After passing through a low-pass filter (LPF), the demodulated components, I(t) and Q(t) can be represented as follows:
The amplitude A(t) and phase φt(t) of the vibration signal can be represented as
According to the above formula, the phase φt(t) of RBS can be obtained. Given that the range of the arctangent function is (−π/2, π/2), the result needs to be transformed into a range (−π, π) based on the quadrants where I and Q are located. Through phase unwrapping, the final phase result can be achieved. The DAS tested in this paper was provided by Wuxi BuLiYuan Electronic Technology Co., Ltd., located in Wuxi, China, with the model identified as BLY pDAS-100P. The corresponding detection parameters are outlined in Table 2.
2.2. DAS Indicators
2.2.1. Frequency Response
The frequency response of a system is defined as the maximum signal frequency that the system can accurately detect or reproduce [24]. Following Nyquist’s sampling theorem, the frequency response can be expressed as
Here, fre denotes the frequency response of the system, and fm denotes the repetition frequency of the injected pulsed light. The frequency response of the system is determined by the repetition frequency of the injected pulsed light. At any given moment, only a single pulse of light can be transmitted within the fiber to generate effective optical interference. Therefore, the repetition frequency of the pulsed light is limited by the length of the fiber. This constraint can be expressed as follows:
Here, the length of the fiber is represented by L, the speed of light in a vacuum is denoted by c, and the refractive index of the fiber’s core is denoted by n. When the length of the fiber is 2 km, the theoretical maximum limit for the pulse repetition frequency is 50 kHz, and the theoretical maximum limit for the frequency response is 25 kHz.
2.2.2. Sensitivity
Sensitivity is a measure used to indicate the ability of a system to effectively respond to weak signals [25]. A higher sensitivity corresponds to a system that is capable of detecting smaller signal amplitudes, which indicates the better performance of the system. This paper evaluates the sensitivity of the DAS by conducting tests on the amplitude response.
2.2.3. Spatial Resolution
Spatial resolution refers to the minimum distance at which a system can distinguish and resolve adjacent perturbations. It can be expressed as follows:
Here, the spatial resolution is denoted by z, and the optical pulse width is represented by Tw. When the optical pulse width is 100 ns, the system achieves a spatial resolution of 10 m. In this spatial resolution test, the optical pulse width of the DAS device remains constant, while the length of the optical fiber in the sensing section varies.
2.2.4. Sensing Distance
The sensing distance denotes the maximum length of fiber that the system can accurately detect and monitor effectively. The dynamic range [26], denoted as R, represents the primary limiting factor for the sensing distance. It can be mathematically expressed as follows:
Here, Po denotes the Rayleigh-scattered light power at the first end, while Pn represents the Rayleigh-scattered light power at the tail end. The length of the sensing distance of a system tends to increase as the dynamic range becomes larger. The sensing distance can be determined by analyzing whether a stable vibration signal is measured at the end of the fiber. The characteristics of vibration signals primarily include frequency and amplitude. The frequency response test of Equation (2) can also be utilized to evaluate the sensing distance indicator. When the same fiber length is used, a more effective sensing distance test can be achieved when the measured frequency response closely matches the theoretical limit value.
In addition to testing the key indicators mentioned above, it is important to consider the impact of multi-point simultaneous perturbations and temperature variations on the sensing performance of DAS devices. This requires testing specific indicators and conducting a thorough analysis of the results.
2.3. The Performance Evaluation of Indicators
DAS devices involve numerous indicators, and these indicators are interrelated, which can lead to confusion for users in different application fields when selecting and using DAS. Conducting a comprehensive evaluation of DAS performance is crucial to provide users with a reference that meets their specific requirements.
The evaluation of DAS performance, indeed, requires both quantitative and qualitative analysis. This evaluation approach aligns with the concept of AHP [27], which is commonly used to evaluate comprehensive and complex problems. The AHP is a comprehensive evaluation approach that incorporates both quantitative and qualitative analysis. It is employed to tackle complex evaluation problems by breaking them down into multiple levels and elements. Within each level, the elements are compared, assessed, and computed against one another. By utilizing analytical methods, the weight parameters of each level can be determined [28]. This methodology provides a solution to the systemic problems encountered in scenarios involving multiple objectives, multiple levels, and challenges that cannot be entirely evaluated through quantitative methods.
In this paper, a set of AHP steps is designed specifically based on the characteristics of DAS indicators and engineering requirements. These steps are outlined as follows:
First, construct a hierarchical model. The comprehensive evaluation model of DAS performance is divided into the following three layers: the top layer (H), the middle layer (M), and the bottom layer (L). In the context of evaluating DAS indicators, the top layer is defined as the target layer. The target layer sets only one factor, which is typically referred to as the “DAS performance evaluation”. The middle layer consists of six factors that are crucial to consider, including M1 frequency response, M2 sensitivity, M3 spatial resolution, M4 sensing distance, M5 multi-point perturbation, and M6 temperature influence. The bottom layer, also referred to as the criterion layer, establishes the following three factors: K1 (excellent), K2 (fair), and K3 (poor). The AHP model, as illustrated in Figure 2, is designed to illustrate the evaluation process.
Next, the judgment matrix is constructed for a factor concerning the subsequent layer of associated factors. Let us take the construction of the judgment matrix for the target layer and the middle layer as an example. In this process, we compare two factors, Mi and Mj, from the middle layer at a time. The resulting judgment matrix is as follows:
Here, the relative importance of the factors Mi and Mj in the middle layer concerning the target layer is represented by the comparison scale aij. The quantization method in reference [20] was used to determine the value of aij. The value aij was determined simultaneously according to the given conditions: aij > 0, aji = 1/aij (i ≠ j), aii = 1(i, j = 1, 2, …, n).
We constructed judgment matrices B, C, D, E, F, G, and H to evaluate M1 frequency response, M2 sensitivity, M3 spatial resolution, M4 sensing distance, M5 multi-point perturbation, and M6 temperature influence concerning the criterion layer. The order of this judgment matrix was 3, indicating that it is a square matrix with dimensions of 3 rows and 3 columns.
After constructing the judgment matrices, we proceed with hierarchical single ranking and conduct a consistency test. To solve for the eigenvalues λ and eigenvectors WA of the judgment matrix A according to Equation (6), we needed to perform the following calculations. The weight value WA represents the weight value of all factors in the middle layer concerning the target layer.
Similarly, the eigenvalues and eigenvectors of the judgment matrices B, C, D, E, F, G, and H can be determined to complete the hierarchical single-sorting process.
A consistency check of the judgment matrix is necessary after the hierarchical single-sorting process. To calculate the stochastic consistency ratio CR, we can use Equation (7).
Here, the variable CR represents the consistency indicator, n denotes the order of the judgment matrix, and RI represents the average random consistency indicator. When the order of the judgment matrix is three, the consistency indicator is represented by RI as a value of 0.58. However, when the order is seven, the consistency indicator changes to a value of 1.32.
If the consistency indicator CI is less than 0.10, the consistency test of the judgment matrix is considered successful. However, if the CI exceeds 0.10, the judgment matrix needs to be readjusted until the CI is less than 0.10.
Finally, a hierarchical total ranking was performed. The weight values of all factors in the middle level and the criterion level, relative to the top level, were calculated separately to complete the hierarchical total ranking process. This process considers the importance of each factor at different levels and combines them to determine the DAS performance evaluation results.
3. Indicator Testing and Result Analysis
3.1. Frequency Response Test and Analysis
To assess the frequency response of DAS, this study utilizes the nominal maximum pulse repetition rate and minimum pulse width specified by the device, which are 26.64 kHz and 100 ns, respectively. A frequency response test optical path is constructed, as illustrated in Figure 3a, while the corresponding test setup is depicted in Figure 3b. A sheathed fiber with a diameter of 900 μm, measuring 2090 m in length, is connected to the DAS unit using an FC/APC connector. The L1 segment serves as a jumper connecting to the test optical fiber. To minimize the impact of environmental disturbances during the system testing, the L2 and L3 segments of the fiber were enclosed in sealed cartons to isolate air vibrations. Additionally, the foam was used to isolate the fiber segments from vibrations on the tabletop. The dimensions of the carton used were 470 mm in length, 390 mm in width, and 315 mm in height. The L2 and L3 optical fibers were coiled into optical fiber discs with a diameter of 180 mm and a height of 20 mm. Subsequently, they were affixed to the surface of the carton. The sound source was positioned in the center between the two optical fiber discs, maintaining a distance of 50 mm from the surface of the optical fibers. The sound had a frequency range spanning from 130 Hz to 18 kHz (±3 dB). The system signal-to-noise ratio (SNR) of ≥80 dB ensured a high-quality signal. Additionally, the distortion degree was maintained at less than 0.1%, ensuring signal fidelity. The system had an output power of 3 W. By controlling the COOL Edit Pro software 2.1, the sound generated sinusoidal signals with an amplitude of 0 dB and frequency of 8, 10, 12, and 13 kHz, respectively. These signals propagate through the air in the form of sound waves. The L2 and L3 fibers are positioned along the signal propagation path, resulting in a change in the phase of the backscattered light from L2 and L3. The device shown in Figure 3c remained unaltered.
The phase data at a distance of 1831 m along the sensing fiber were extracted, and its time-domain waveform was plotted, as depicted in Figure 4. When the applied signal frequency is 8 kHz, it is difficult to observe the waveform of the sine wave signal in Figure 4b. This is primarily because only 3.33125 points can be sampled within one cycle. Moreover, failures occur in the phase unwrapping process for certain points. At a signal frequency of 13 kHz, merely 2.05 points can be captured within one cycle. Moreover, failures occur in the phase unwrapping process for certain points. This results in the severe distortion of the demodulation waveform.
The spectrum was obtained through an FFT, as illustrated in Figure 5.
As observed in Figure 5, the FFT measurements accurately capture the frequency values of the signal being measured, particularly when the signal frequency does not exceed 12 kHz. When the frequency of the signal being measured surpasses 12 kHz, the FFT may not effectively identify or capture the signal within this frequency range. Therefore, the determined frequency response of the device is 12 kHz when the length of the sensing fiber is 2090 m. This value approaches the theoretical limit but does not reach the theoretical limit of 26.64/2 kHz.
3.2. Magnitude Response Test and Analysis
In practical applications of the φ-OTDR system, the amplitude response plays a crucial role in determining the sensing performance of the sensor. A system that can measure smaller amplitudes indicates higher sensitivity and better sensing performance. The optical path for the amplitude response test of the DAS is designed according to the configuration illustrated in Figure 3a. The parameters of the DAS device are set to match those used in the frequency response test. By controlling the COOL Edit Pro software, the sound produces sinusoidal signals with a frequency of 1 kHz and amplitude of 0, −10, −20, −30, −40, and −50 dB, respectively. These signals propagate through the air in the form of sound waves. The L2 and L3 fibers are positioned along the signal propagation path, resulting in a change in the phase of the backscattered light from L2 and L3. The device shown in Figure 3c remains unaltered.
The phase data at a distance of 1831 m along the sensing fiber were extracted. To minimize the impact of external disturbances on the amplitude response test results, the acquired phase data were divided into six groups. An FFT was applied to determine the amplitude of each 1 kHz signal. The curve shown in Figure 6 was generated by averaging the results from the six sets of data.
The obtained curve was fitted using exponential functions, and the fitted expression is as follows:
In formula (8), the variable x represents the input signal amplitude in decibels (dB), while the variable y represents the average value obtained from the six sets of 1 kHz signals. The goodness-of-fit value was 0.9949, which is close to 1, indicating a good fit between the fitted curve and the actual data. When the applied signal amplitude was greater than or equal to −40 dB, a clear 1 kHz signal could be observed in the spectrogram. However, when the applied signal amplitude was −50 dB, the signal collected by the fiber was overwhelmed by noise, making it impossible to identify the 1 kHz signal. Therefore, based on this analysis, the determined amplitude response of the device was −40 dB when the length of the sensing fiber was 2090 m.
3.3. Spatial Resolution Test and Analysis
To assess the spatial resolution indicator of DAS, a test optical path was designed according to the configuration depicted in Figure 7a. The light pulse repetition frequency was configured to be 26.64 kHz, while the pulse width was adjusted to 100 ns. Using Equation (3), the spatial resolution was calculated to be 10 m. Starting at 1088 m, the fiber was wound inward for 5 m, 10 m, and 20 m to ensure that the endpoint of the applied vibration signal was the same. These wound fibers were placed separately on a vibration platform, while the rest were sealed in a carton. The vibration platform comprised an aluminum plate, sound, and square tube, as shown in Figure 7b. The physical photograph of the vibration platform is shown in Figure 7c. The computer-controlled sound system produced a sinusoidal signal with a frequency of 1 kHz and an amplitude of 0 dB. The vibration signal was sensed using an optical fiber mounted on the insulated rigid plate, which acted as a vibration sensor. This fiber optic sensor captured the vibration signal. The resulting data were then visualized in the form of a waterfall diagram, also known as a position–time–energy image. This diagram, labeled as Figure 8, displays the distribution of the position, time, and energy of the measured vibrations over a specific period.
As the length of the sensing fiber increased, the width of the signal on the waterfall map became broader, denser, and more intense. When the length of the sensing fiber was 5 m, the signal width on the waterfall map became narrower, and the signal became intermittent, making it impossible to collect data continuously. When the sensing fiber’s length was 20 m, it became evident that the signal acquisition effect was improved when observed through the waterfall diagram.
3.4. Sensing Distance Test and Analysis
The sensing distance test optical path of the DAS sensor is shown in Figure 9. The fibers used in this test were all G652D single-mode bare fibers. The length of L2 was set to 4988.5 m and 9988.5 m, respectively. To eliminate the effect of Fresnel reflections, the end of the test fiber L3 was placed 10 m away from the end of the fiber, and the end of the fiber was knotted.
The length of L2 was set to 4988.5 m. The pulse repetition frequency of the DAS system was 13.32 kHz, and the pulse width was 100 ns. The L1, L2, and L4 segments of optical fibers were placed in sealed cartons. The computer-controlled sound system produced sinusoidal signals with an amplitude of 0 dB and frequencies of 1 kHz, 3 kHz, 5 kHz, and 6 kHz, respectively. The fiber optic on the insulated rigid plate sensed the vibration signal and performed the measurement. The measurement results are shown in Figure 10.
The length of L2 was set to 9988.5 m. The pulse repetition frequency of the DAS system was 9.99 kHz, and the pulse width was 100 ns.
The L1, L2, and L4 segments of optical fibers were placed in sealed cartons. The computer-controlled sound system produces sinusoidal signals with an amplitude of 0 dB and frequencies of 1 kHz and 2 kHz, respectively. The fiber optic on the insulated rigid plate senses the vibration signal and performs the measurement. The measurement results are shown in Figure 11.
The DAS device can effectively measure the signal at a distance of 10 m from the end of the fiber when the length of the sensing fiber is 10 km. Therefore, the sensing distance of the system is no less than 10 km. However, according to Equation (2), when the length of the sensing fiber is 5 km, the theoretical upper limit of the pulse repetition frequency is 20 kHz, and the frequency response limit that the system can measure is 10 kHz. According to the pulse repetition frequency and Nyquist’s sampling theorem, the system can measure a frequency response limit of 13.32/2 kHz. However, in actual measurements, the frequency response is only 5 kHz.
When the length of the sensing fiber is 10 km, according to Equation (2), the theoretical upper limit of the pulse repetition frequency is 7.992 kHz, and the frequency response limit that the system can measure is 5 kHz. However, according to Equation (1), the limit of frequency response that can be measured by the system is 7.992/2 kHz, and the actual measured frequency response is only 1 kHz. The ability of the device has room for improvement in terms of the signal-to-noise ratio and pulse repetition frequency. At the same time, the sensor distance measured to this DAS is only 10 km, and the sensor distance indicator needs to be improved.
3.5. Multi-Point Simultaneous Disturbance Test and Analysis
During vibration condition monitoring, simultaneous disturbances at multiple points often occur. Therefore, for practical condition monitoring applications, it is highly significant to carry out multi-point simultaneous perturbation tests. The design of an optical path for multi-point simultaneous perturbation testing is depicted in Figure 12. The light pulse repetition frequency was configured to be 10 kHz, while the pulse width was adjusted to 100 ns. The fiber segments, L2 and L3, were enclosed within two sealed containers. The box positioned at the L3 location was lightly tapped to observe the changes in the waterfall graph within the DAS software V0.6.10. The test results are depicted in Figure 13.
In Figure 13a of the waterfall diagram, when no signal is applied, a signal emerges at the position marked by the red box. This signal is a result of the influence of the flange at 60 m and the Fresnel reflection at 2750 m. When only the rear disc fiber is clapped, a signal is observed, as depicted in Figure 13b. Apart from the signal at the position indicated by the red box in Figure 13a, a significant vibration signal was detected in the waterfall diagram precisely 1100 m backward from the tapping location (i.e., the starting position of the second tray of fibers). This observation perfectly matches the actual tapping position. These findings demonstrate that the device successfully meets the requirements for the multi-point simultaneous perturbation measurement.
3.6. Temperature Influence Test and Analysis
In principle, the measurement results of the φ-OTDR system are relatively immune to temperature variations. To explore the impact of temperature variations on the sensing performance of the DAS device, a test optical path was designed, as depicted in Figure 14a. The corresponding test setup is illustrated in Figure 14b. The light pulse repetition frequency was configured to be 26.64 kHz, while the pulse width was adjusted to 100 ns. The fiber section L2 was placed in a thermostatic water bath, while L1 and L3 were enclosed in the sealed carton.
The initial water temperature of the thermostatic water bath was set to 50 °C, and the temperature was increased in 10 °C intervals using internal circulation until it reached 100 °C. Once the water temperature stabilized at 100 °C, the internal circulation was utilized to decrease the temperature in 10 °C intervals until reaching 70 °C.
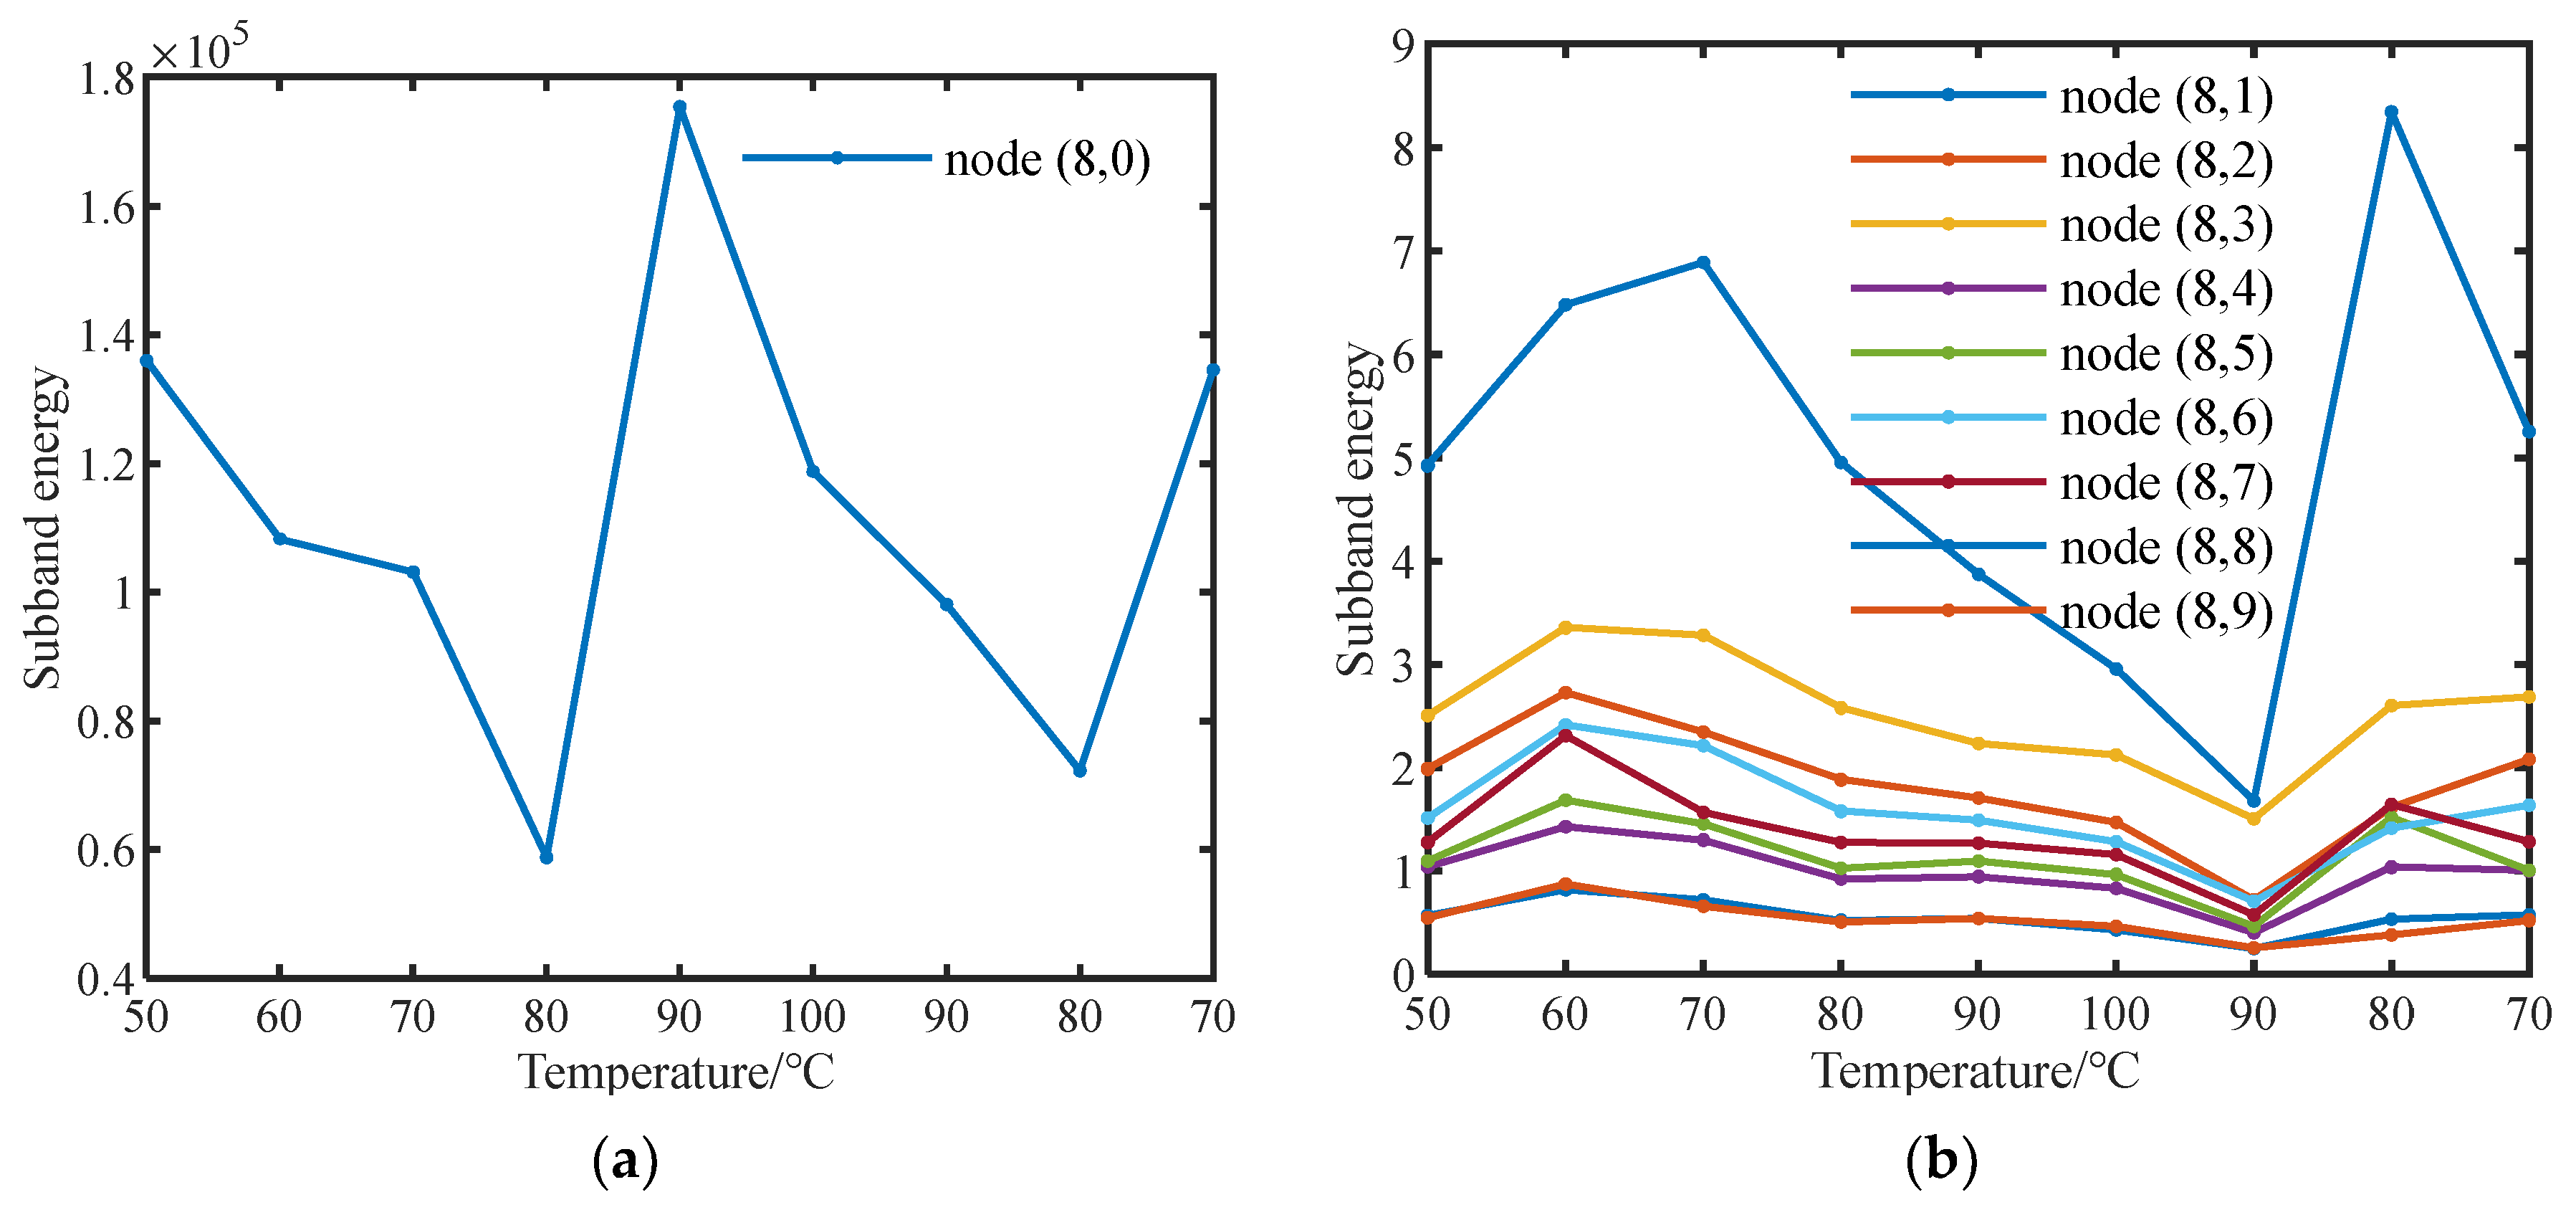
The DAS device has a data storage capacity of only 1.25 s. The phase data for 1 s were intercepted, resulting in a total of 333,000 data points being captured. The wavelet packet algorithm was employed to decompose the data into eight layers using the dB3 wavelet as the basis function. This process generated a total of 256 sub-bands, with a frequency interval of 650.4 Hz between each sub-band. The energy of the first 10 sub-bands, specifically nodes (8, 0), (8, 1), (8, 2), (8, 3), (8, 4), (8, 5), (8, 6), (8, 7), (8, 8), and (8, 9), were extracted. The frequency range covered by the first 10 sub-bands was from 0 to 6504 Hz. The energy variation curves with temperature for these ten nodes are plotted and illustrated in Figure 15.
During the process of warming and cooling operations, the internal circulation mode generated a low-frequency random vibration signal. Moreover, the remaining nodes located in the high-frequency range (greater than 1 kHz) were not impacted by this vibration signal. Their energy levels were low and remained constant regardless of temperature variations. This indicates that the measurement results of this DAS device are not affected by temperature, demonstrating excellent performance.
3.7. Example of Performance Evaluation
This paper aims to utilize DAS for high-frequency small signal measurements. The application under the test exhibits a vibration frequency greater than 10 kHz and a small vibration amplitude. This paper utilizes a comprehensive evaluation approach for the DAS system by incorporating the AHP method.
First, the judgment matrix is constructed for each factor in the middle layer concerning the target layer. The DAS is designed to measure high-frequency vibration signals, which typically have small amplitudes. The measurement should prioritize the frequency response and sensitivity indicators. Therefore, when constructing the judgment matrix, the importance of frequency response and sensitivity is given more weight. The judgment matrix is constructed, as shown in Table 3.
Using Equations (6) and (7), the calculation yields the following results: λmax = 6.00001, CI = 0.000003, RI = 1.24, CR = 0.0000023 < 0.1. Therefore, this judgment matrix satisfies the consistency test requirements. The relative weight values for frequency response, sensitivity, spatial resolution, sensing distance, multi-point perturbation, and temperature influence are determined to be 0.2963, 0.2963, 0.1481, 0.1487, 0.0741, and 0.0370, respectively.
Similarly, based on the test results of each indicator and the principle of the AHP, the comparative judgment matrix of the criterion layer (excellent, fair, poor) relative to the intermediate layer (frequency response, sensitivity) is presented in Table 4. Likewise, the assessments for spatial resolution, multi-point perturbation, and temperature influence are detailed in Table 5, while the sensing distance evaluations are provided in Table 6.
The weight calculation results of each judgment matrix were obtained. The judgment matrix for evaluating the performance of the DAS was derived. The hierarchical ranking process was completed, and the resulting judgment matrix is presented in Table 7.
The final weights obtained for DAS were 0.5757 for the “excellent” factor, 0.2628 for the “fair” factor, and 0.1621 for the “poor” factor. The weight for the “excellent” factor was the highest among the three.
4. Conclusions
Based on the φ-OTDR vibration sensing principle, this paper conducts both theoretical analysis and experimental studies to investigate the indicator testing method for distributed acoustic sensors. A performance evaluation method based on the AHP method is proposed for assessing the sensing performance of DAS. The following conclusions can be drawn:
- (1)
- Evaluating the performance of DAS involves the consideration of various factors such as frequency response, sensitivity, spatial resolution, sensing distance, multi-point perturbation, and temperature influence. These indicators are interconnected and mutually affect each other, leading to constraints and interdependencies in the evaluation process. As the amplitude of the applied vibration signal increases, the detected signal amplitude on the fiber tends to increase exponentially. φ-OTDR enables multi-point simultaneous positioning, and its measurement results remain unaffected by temperature variations. However, as the sensing distance increases, the actual measured frequency response of the fiber deviates from the theoretical limit value.
- (2)
- DAS indicators are analyzed qualitatively and quantitatively. The analytic hierarchy process (AHP) is adopted to evaluate complex problems. The above indicators are categorized into the following three levels: excellent, fair, and poor, for comprehensive evaluation. The weight parameters of each level are determined using the AHP method. The specific implementation process of this evaluation method is illustrated through a comprehensive evaluation example focused on high frequency. This example demonstrates the convenience and effectiveness of the evaluation method.
- (3)
- The proposed method for testing the indicators of DAS effectively captures the actual limit values of each indicator. The comprehensive evaluation method can derive performance and applicability evaluation results based on practical engineering applications. It addresses the challenge of evaluating multiple indicators of DAS concerning each other and provides an effective approach for device development and engineering applications.
Author Contributions
Z.X. and Y.S. conceived the idea and conducted the experiments. A.L. analyzed the experimental results. Q.X. reviewed the manuscript and supervised the project. All authors have read and agreed to the published version of the manuscript.
Funding
This research was funded by the National Natural Science Foundation of China, grant number 52177141.
Institutional Review Board Statement
Not applicable.
Informed Consent Statement
Not applicable.
Data Availability Statement
All data reported in the paper are presented in the main text. Any other data are provided on request.
Conflicts of Interest
The authors declare no conflicts of interest.
References
- Cheng, G.; Wang, Z.X.; Zhu, H.H.; Li, D.Y.; Ma, Q. Research review of rock and soil deformation monitoring based on distributed fiber optic sensing. Laser Optoelectron. Prog. 2022, 59, 51–70. [Google Scholar] [CrossRef]
- Zhang, X.P.; Zhang, Y.X.; Wang, F.; Shan, Y.Y.; Sun, Z.H.; Hu, Y.Z. The mechanism and suppression methods of optical background noise in phase-sensitive optical time domain reflectometry. Acta Phys. Sin. 2017, 66, 87–100. [Google Scholar] [CrossRef]
- Song, M.P.; Zhuang, S.W.; Wang, Y.X. High-frequency vibration detection of phase-sensitive optical time-domain reflectometer. Chin. J. Lasers 2020, 47, 449–453. [Google Scholar] [CrossRef]
- Zhang, X.P.; Ding, Z.W.; Hong, R.; Chen, X.H.; Liang, L.; Zhang, C.; Wang, F.; Zhou, N.M.; Zhang, Y.X. Phase sensitive optical time-domain reflective distributed optical fiber sensing technology. Guangxue Xuebao 2021, 41, 100–114. [Google Scholar] [CrossRef]
- Wang, Z.N.; Zhang, L.; Wang, S.; Xue, N.T.; Peng, F.; Fan, M.Q.; Sun, W.; Qian, X.Y.; Rao, J.R.; Rao, Y.J. Coherent φ-OTDR based on I/Q demodulation and homodyne detection. Opt. Express 2016, 24, 853–858. [Google Scholar] [CrossRef] [PubMed]
- Yang, Y.; Sun, A.; Fan, T.; Li, Q. Digitalized phase demodulation scheme of φ-OTDR based on cross-coherence between Rayleigh back-scattering beat signals. Opt. Fiber Technol. 2022, 71, 102896. [Google Scholar] [CrossRef]
- Zhong, X.; Gui, D.L.; Zhang, B.F.; Deng, H.X.; Zhao, S.S.; Zhang, J.; Ma, M.C.; Xu, M.J. Performance enhancement of phase-demodulation φ-OTDR using improved two-path DCM algorithm. Opt. Commun. 2021, 482, 126616. [Google Scholar] [CrossRef]
- Mestayer, J.; Cox, B.; Wills, P.; Kiyashchenko, D.; Lopez, J.; Costello, M.; Bourne, S.; Ugueto, G.; Lupton, R.; Solano, G.; et al. Field trials of distributed acoustic sensing for geophysical monitoring. Seg. Tech. Program Expand. 2011, 4253–4257. [Google Scholar] [CrossRef]
- Munn, J.D.; Coleman, T.I.; Parker, B.L.; Mondanos, M.J.; Chalari, A. Novel cable coupling technique for improved shallow distributed acoustic sensor VSPs. J. Appl. Geophys. 2017, 138, 72–79. [Google Scholar] [CrossRef]
- Peng, F.; Duan, N.; Rao, Y.J.; Li, J. Real-time position and speed monitoring of trains using phase-sensitive OTDR. IEEE Photonics Technol. Lett. 2014, 26, 2055–2057. [Google Scholar] [CrossRef]
- Lv, A.Q.; Li, J. On-line monitoring system of 35 kV 3-core submarine power cable based on φ-OTDR. Sens. Actuators A Phys. 2018, 273, 134–139. [Google Scholar] [CrossRef]
- Juarez, J.C.; Taylor, H.F. Field test of a distributed fiber-optic intrusion sensor system for long perimeters. Appl. Opt. 2007, 46, 1968–1971. [Google Scholar] [CrossRef] [PubMed]
- Nesterov, E.T.; Zhirnov, A.A.; Stepanov, K.V.; Pnev, A.B.; Karasik, V.E.; Tezadov, Y.A.; Kondrashin, E.V.; Ushakov, A.B. Experimental study of influence of nonlinear effects on phase-sensitive optical time-domain reflectometer operating range. J. Phys. Conf. Ser. 2015, 584, 012028. [Google Scholar] [CrossRef]
- Fernandez-Ruiz, M.R.; Costa, L.; Martins, H.F. Distributed acoustic sensing using Chirped-Pulse Phase-Sensitive OTDR technology. Sensors 2019, 19, 4368. [Google Scholar] [CrossRef] [PubMed]
- Turov, A.T.; Barkov, F.L.; Belokrylov, M.E.; Claude, D.; Konstantinov, Y.A. Investigation of signal reception–transmission parameters in a distributed acoustic sensor. Instrum. Exp. Tech. 2023, 66, 802–808. [Google Scholar] [CrossRef]
- Gorshkov, B.G.; Simikin, D.E.; Alekseev, A.E.; Taranov, M.A.; Zhokov, K.M.; Potapov, V.T. Brillouin-Scattering induced noise in DAS: A case study. Sensors 2023, 23, 5402. [Google Scholar] [CrossRef] [PubMed]
- Fiber Optic Monitoring Group. Measuring Sensor Performance-DAS Parameter Definitions and Tests. 2018. Available online: https://seafom.com/mdocuments-library/ (accessed on 12 January 2021).
- Zhu, P.; Wen, H.Q.; Che, Q.; Li, X.Y.; Liu, X. Disturbed partial discharge detection system based on an improved Φ-OTDR assisted by a wFBG array. Appl. Opt. 2020, 59, 4367–4370. [Google Scholar] [CrossRef] [PubMed]
- Wang, Q.; Zhao, K.; Zhong, S.; Yi, X.; Zhao, J.; Gribok, A.V.; Chen, K.P. Detection of Ultrasonic Guided Waves Using Fiber Optical Sensors Toward Nondestructive Evaluation. In Proceedings of the 27th International Conference on Optical Fiber Sensors, Alexandria, VA, USA, 29 August–2 September 2022. [Google Scholar] [CrossRef]
- Wu, Z.K.; Wang, Q.R.V.; Gribok, A.P.; Chen, K. Pipeline degradation evaluation based on distributed fiber sensors and convolutional neural networks (CNNs). In Proceedings of the 27th International Conference on Optical Fiber Sensors, Alexandria, VA, USA, 29 August–2 September 2022. [Google Scholar] [CrossRef]
- Zhao, Z.Y. Research on Optimal Design of φ-OTDR Distributed Optical Fiber Sensing System. Master’s Thesis, Harbin Engineering University, Harbin, China, 2020. [Google Scholar] [CrossRef]
- Zhong, X.; Zhao, S.S.; Deng, H.X.; Zhang, J.; Ma, M.C. Review of research on φ-OTDR system based on pulse modulation. Infrared Laser Eng. 2020, 49, 193–202. [Google Scholar]
- Hu, Z.C. φ-OTDR Sensing Technology Application in Railway Safety Monitoring. Master’s Thesis, University of Science and Technology of China, Hefei, China, 2021. [Google Scholar] [CrossRef]
- Li, K. Research on Signal Enhancement and Processing of Fiber Distributed Acoustic Sensor System. Master’s Thesis, University of Electronic Science and Technology of China, Chengdu, China, 2016. [Google Scholar]
- Zhou, Y. Based on Gated Raman Amplification Method Applying to the Phase-Sensitive Optical Time-Domain Reflectometer System. Master’s Thesis, University of Electronic Science and Technology of China, Chengdu, China, 2015. [Google Scholar] [CrossRef]
- Yuan, Q. Phase Sensitive Optical Time Domain Reflectometry Based on Frequency Drift Compensation. Master’s Thesis, Nanjing University, Nanjing, China, 2018. [Google Scholar]
- Wang, Y.Y.; Yuan, Y.; Chen, W.G.; Yang, J.; He, Y.C. Fault probability evaluation method of power transformer based on multi-characteristic parameters. Chin. J. Sci. Instrum. 2011, 32, 1697–1703. [Google Scholar] [CrossRef]
- Li, B.; Zhu, T.; Zhang, Y.T.; Li, L.H. The equivalence analysis of ship rudder based on analytic hierarchy process. Chin. J. Sci. Instrum. 2013, 34, 434–440. [Google Scholar] [CrossRef]
Figure 1.
Schematic diagram of (a) coherent detection φ-OTDR system and (b) IQ phase demodulation.

Figure 2.
Hierarchical model.
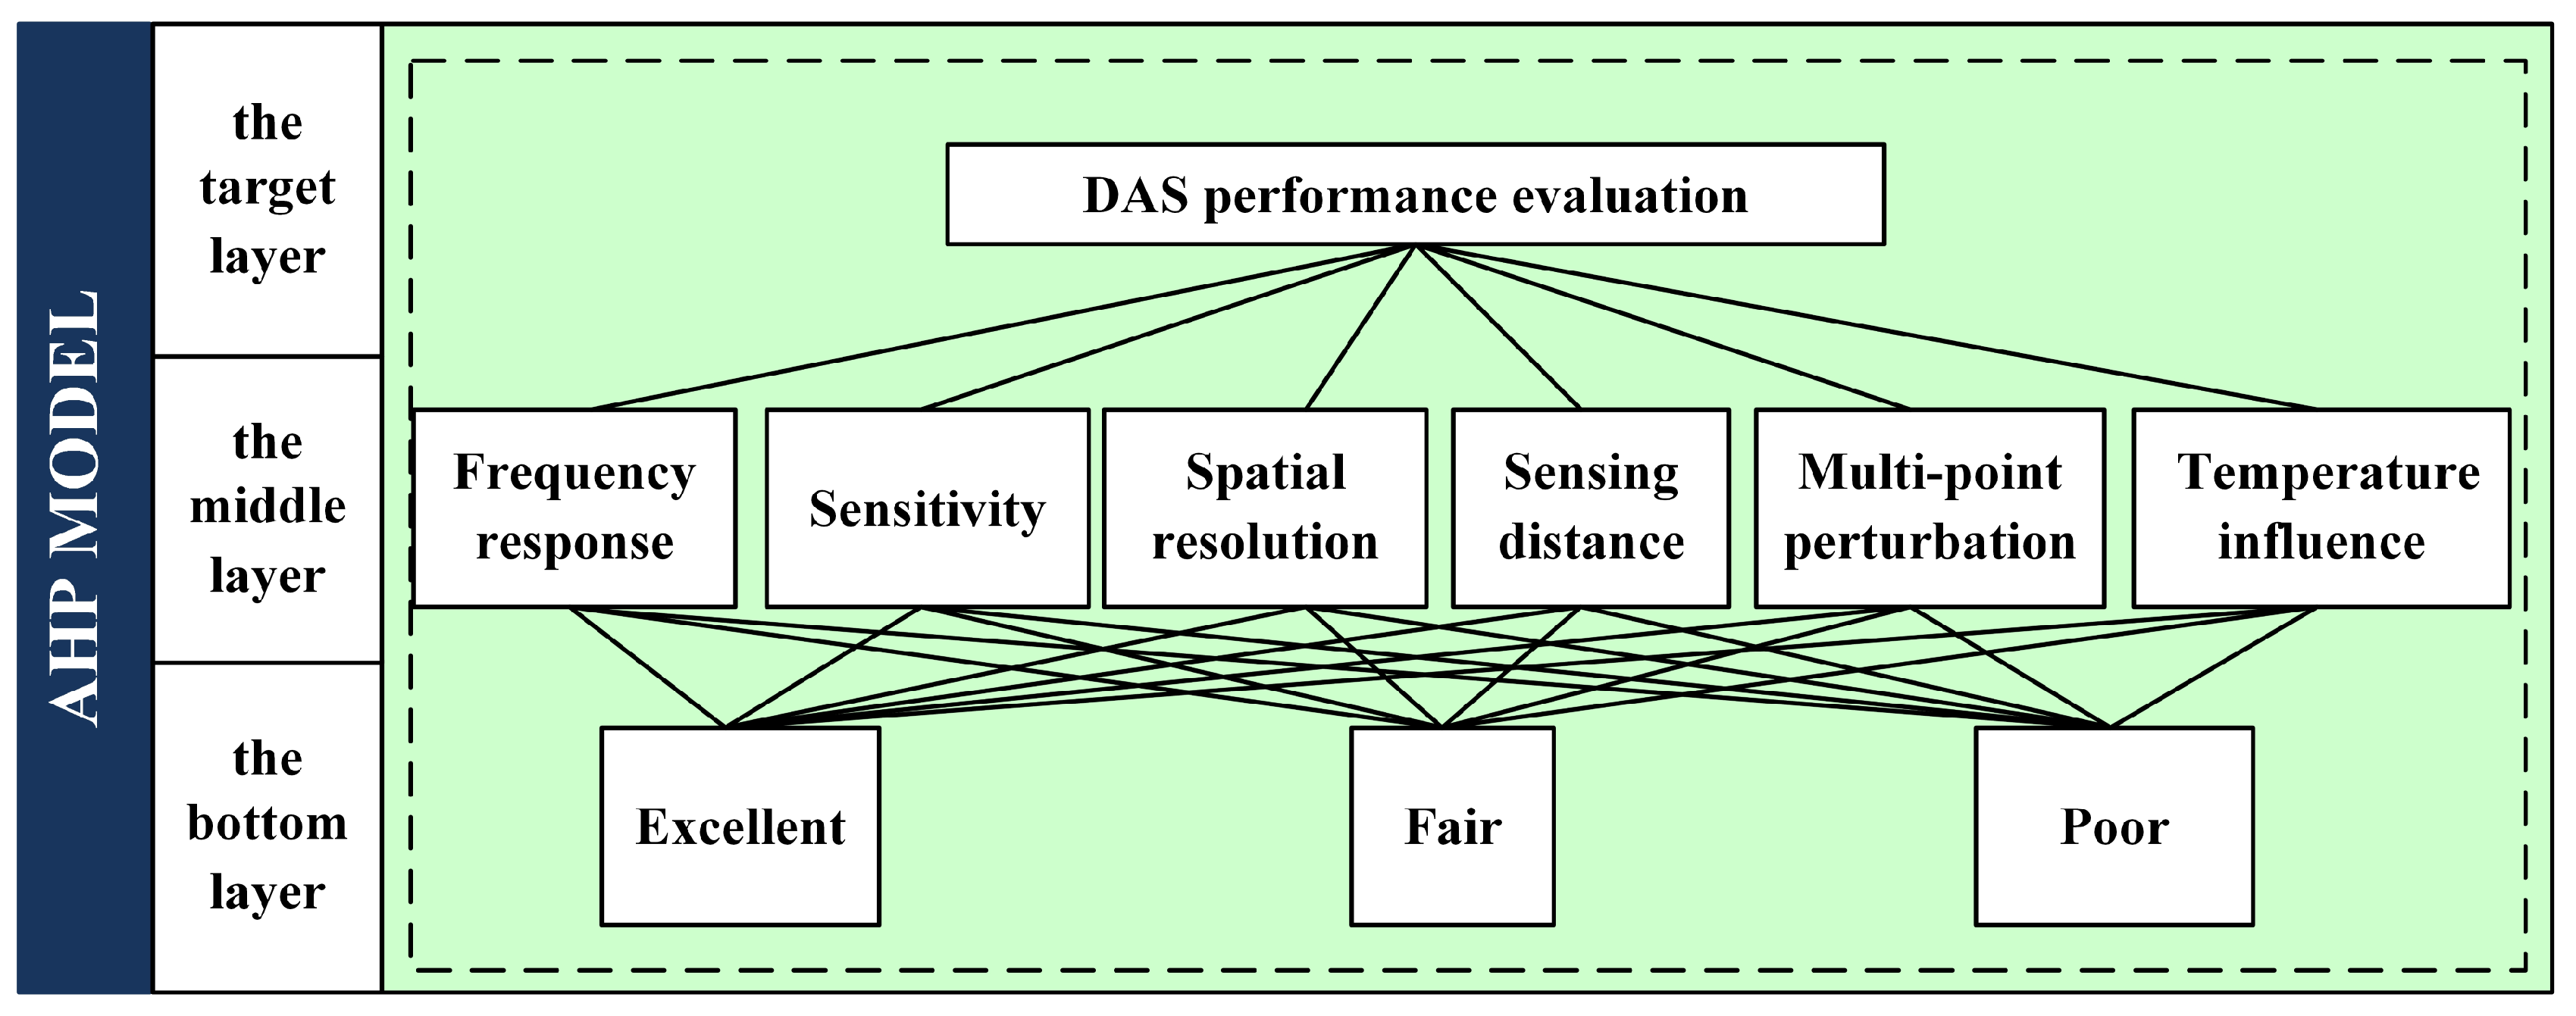
Figure 3.
Frequency response testing. (a) Frequency response testing optical path; (b) frequency response testing device; and (c) geometric diagram of optical fiber and sound source.
Figure 3.
Frequency response testing. (a) Frequency response testing optical path; (b) frequency response testing device; and (c) geometric diagram of optical fiber and sound source.
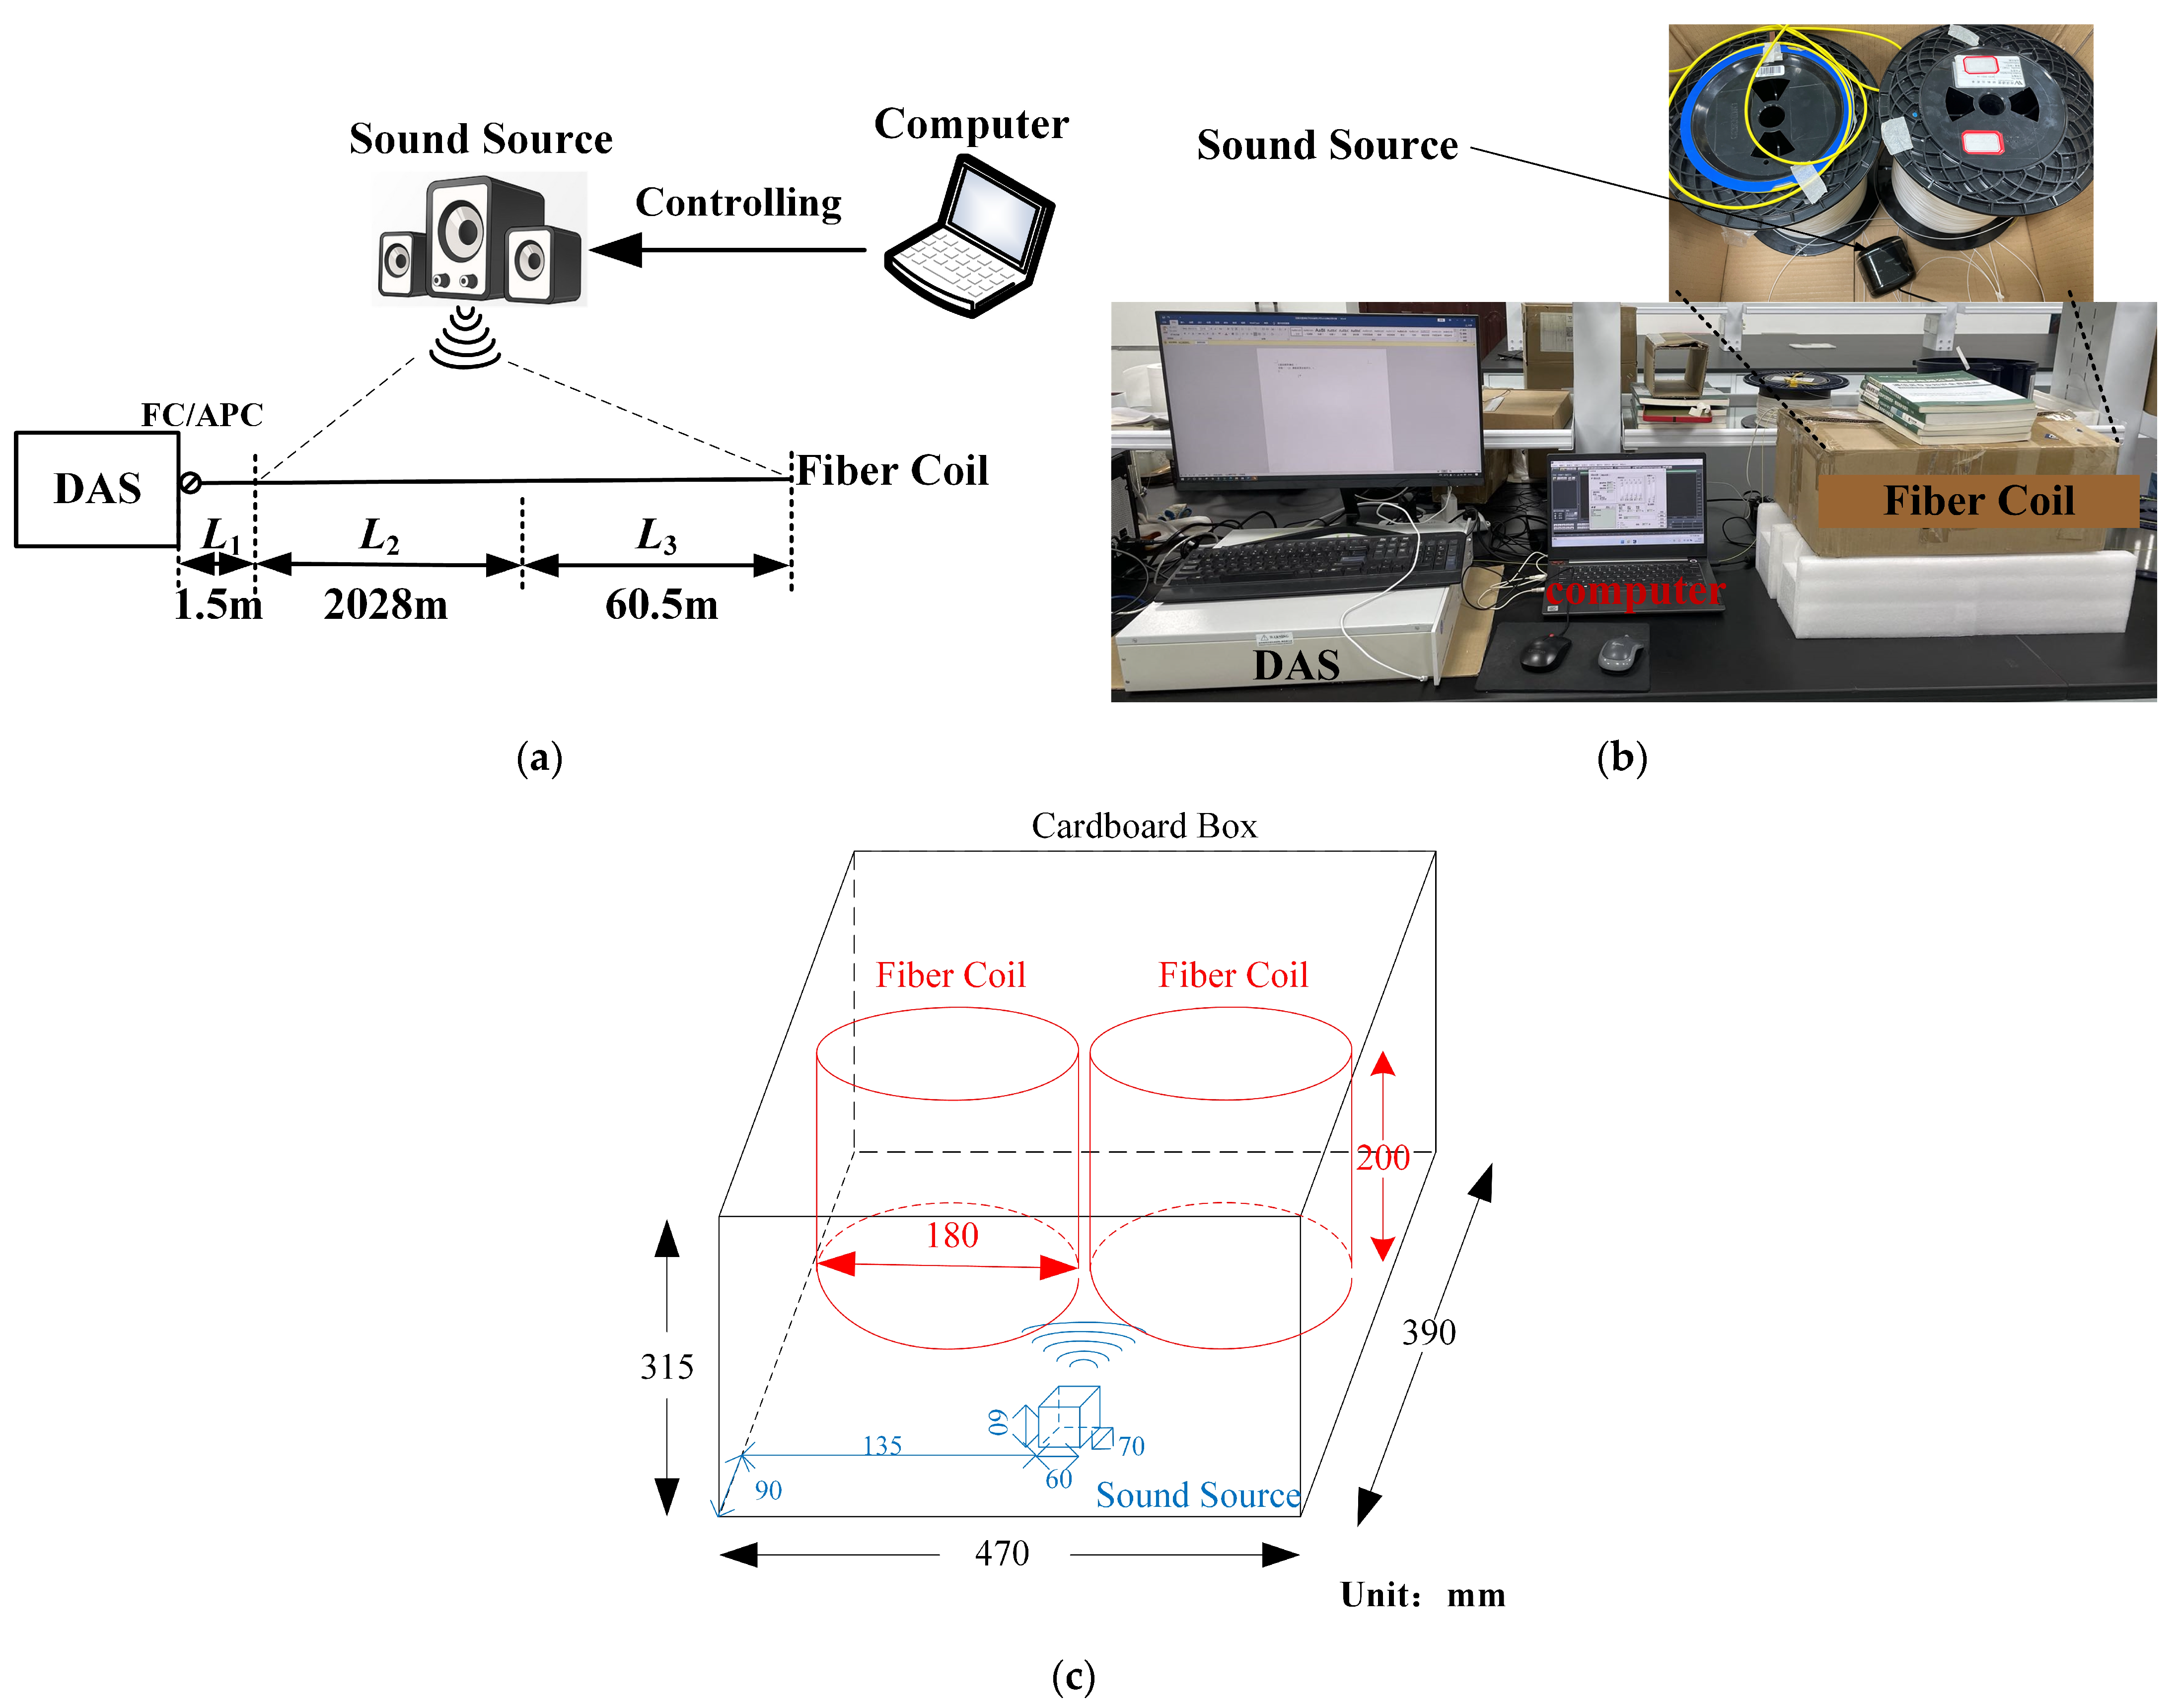
Figure 4.
Time domain waveform obtained from frequency response testing. (a) Global time−domain waveform; (b) local time−domain waveform of 8 kHz and 13 kHz.
Figure 4.
Time domain waveform obtained from frequency response testing. (a) Global time−domain waveform; (b) local time−domain waveform of 8 kHz and 13 kHz.
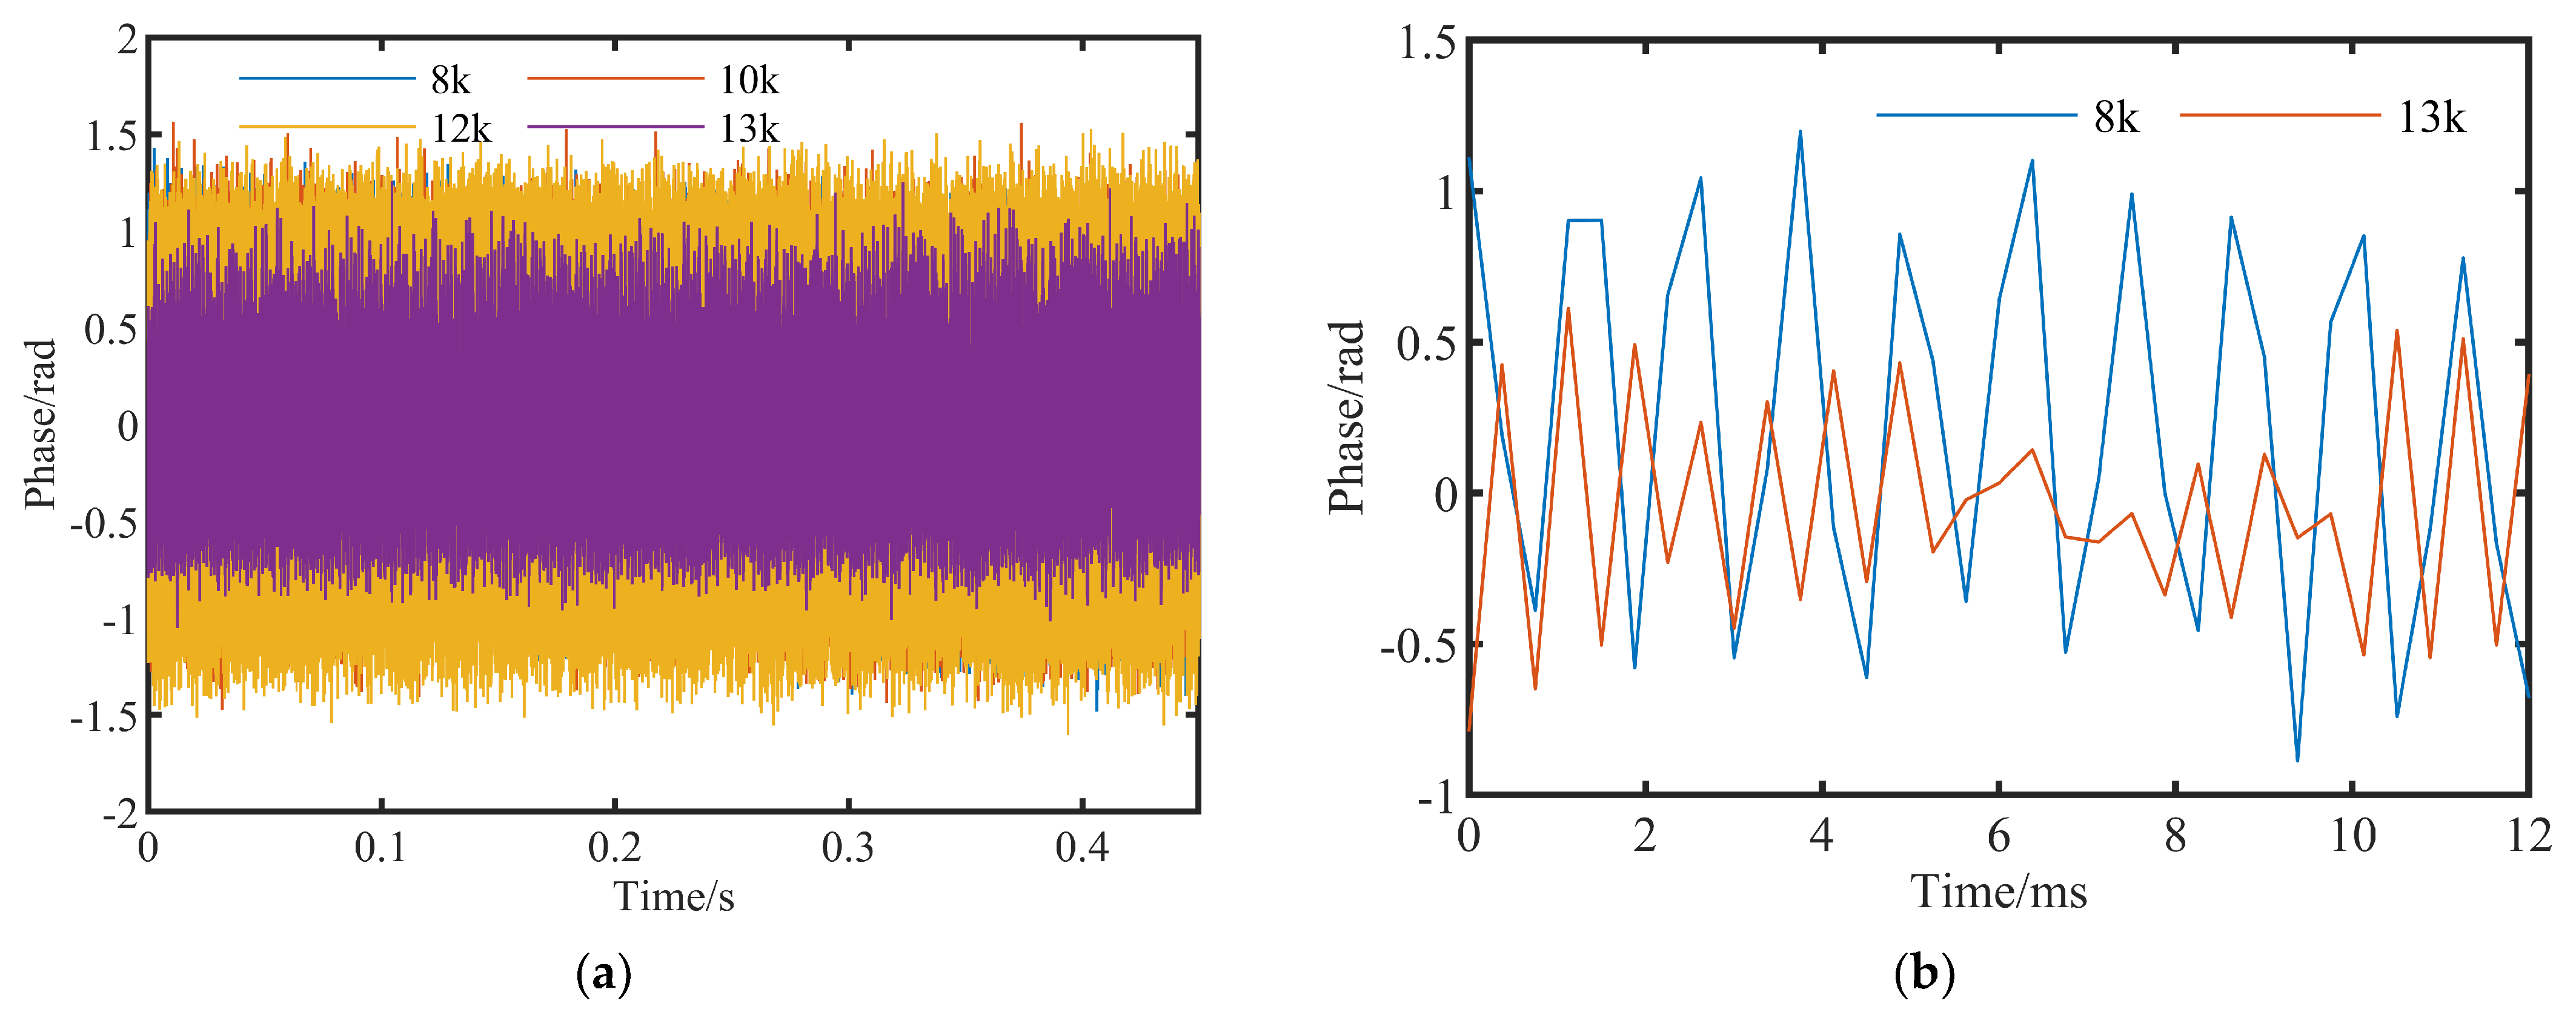
Figure 5.
Spectrogram obtained from frequency response testing. (a) When the applied frequency was 4, 6, 8, 10, 12 kHz, respectively; (b) and when the applied frequency was 13 kHz.
Figure 5.
Spectrogram obtained from frequency response testing. (a) When the applied frequency was 4, 6, 8, 10, 12 kHz, respectively; (b) and when the applied frequency was 13 kHz.

Figure 6.
Amplitude response test results.
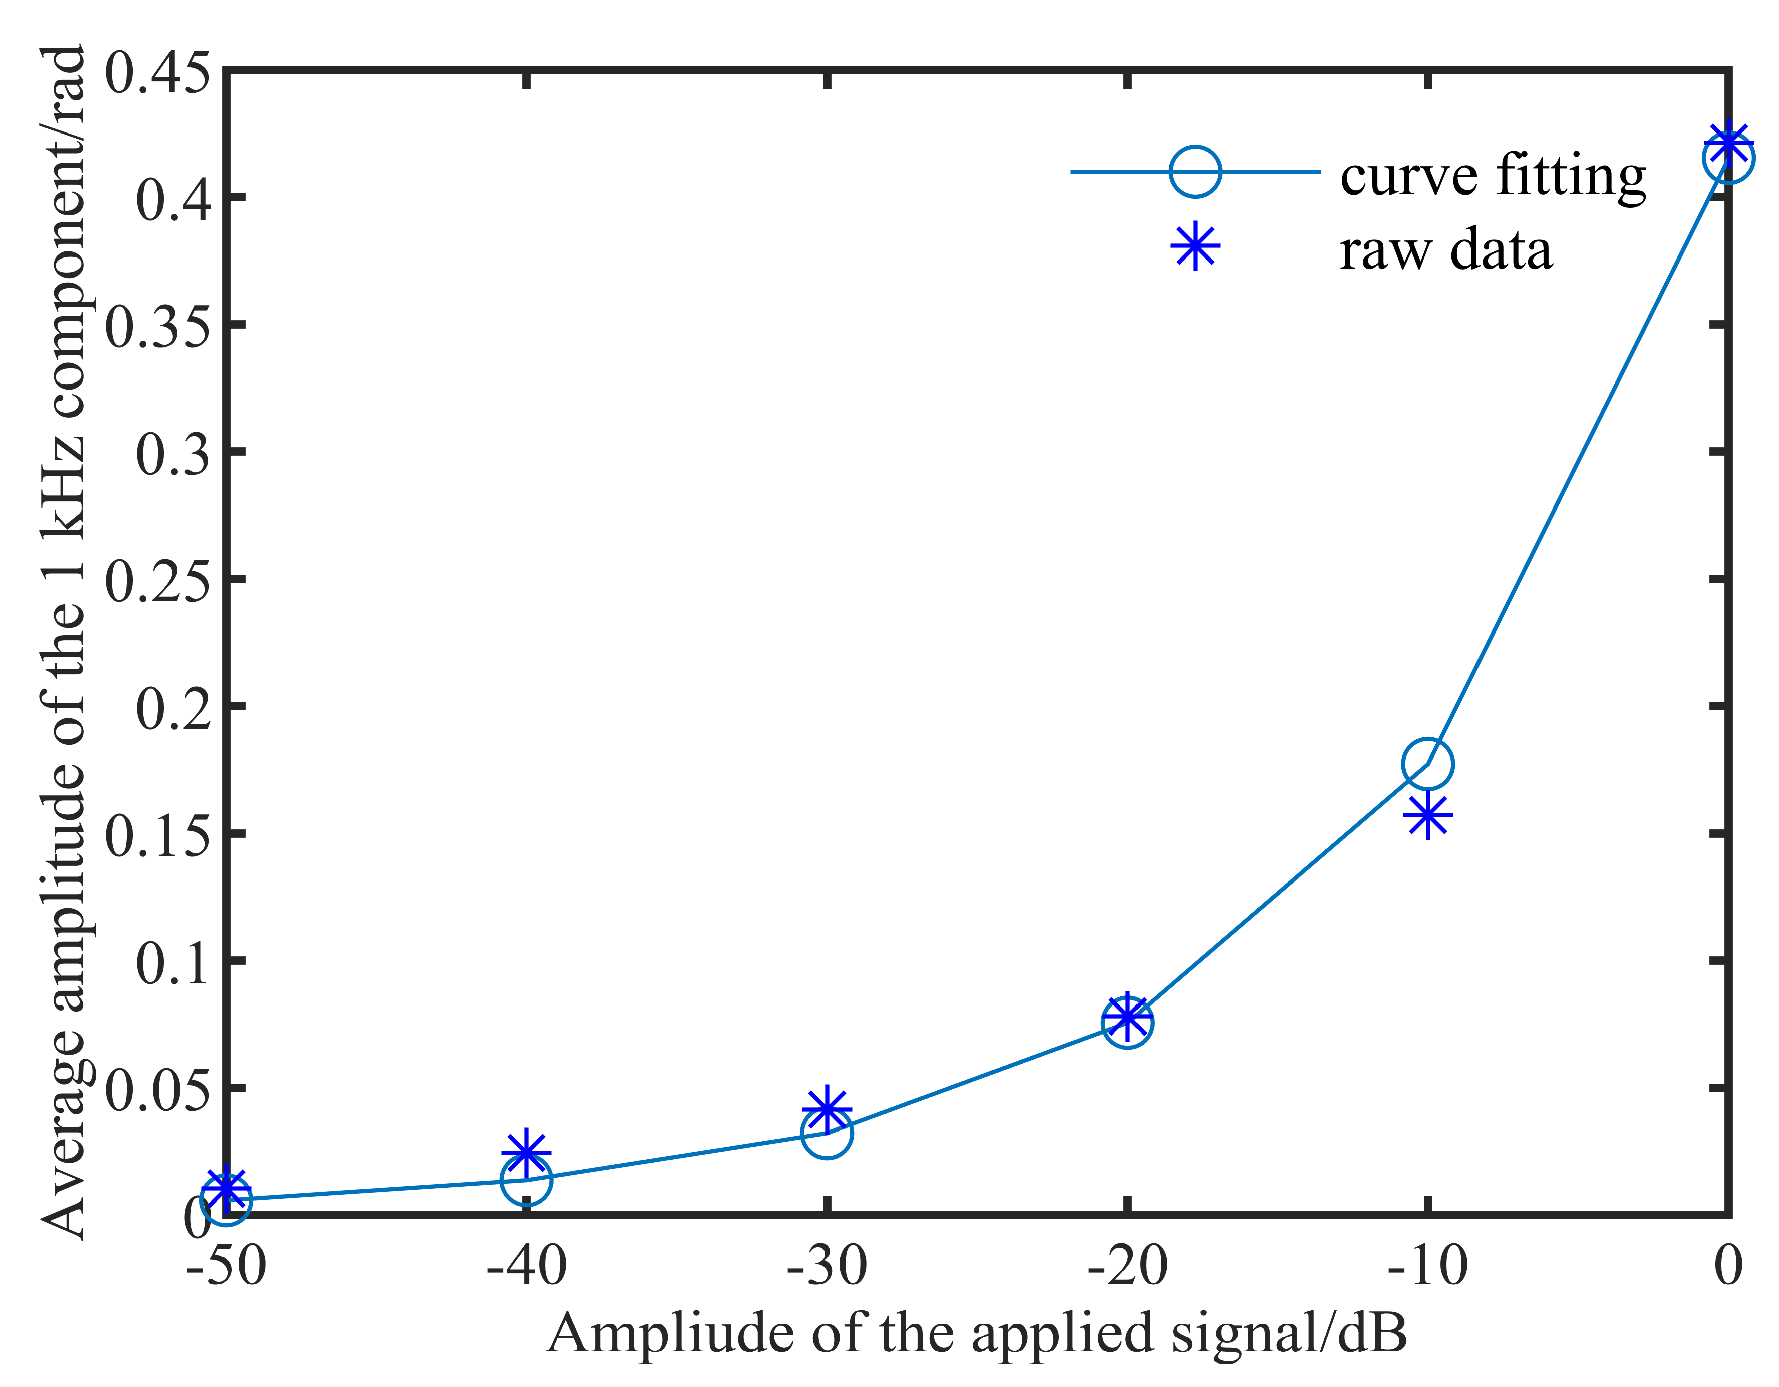
Figure 7.
Spatial resolution testing. (a) Optical path; (b) vibration platform diagram; and (c) the physical photograph of the vibration platform.
Figure 7.
Spatial resolution testing. (a) Optical path; (b) vibration platform diagram; and (c) the physical photograph of the vibration platform.
Figure 8.
Waterfall plot of spatial resolution testing at (a)5 m; (b) 10 m; and (c) 20 m.
Figure 9.
Sensing distance testing optical path.
Figure 10.
Frequency response testing results when the sensing distance is 5 km. (a) Spectrogram at 1, 3, and 5 kHz, respectively; (b) spectrogram at the applied frequency of 6 kHz.
Figure 10.
Frequency response testing results when the sensing distance is 5 km. (a) Spectrogram at 1, 3, and 5 kHz, respectively; (b) spectrogram at the applied frequency of 6 kHz.
Figure 11.
Frequency response testing results when the sensing distance is 10 km. (a) Spectrogram at the applied frequency of 1 kHz; (b) spectrogram at the applied frequency of 2 kHz.
Figure 11.
Frequency response testing results when the sensing distance is 10 km. (a) Spectrogram at the applied frequency of 1 kHz; (b) spectrogram at the applied frequency of 2 kHz.
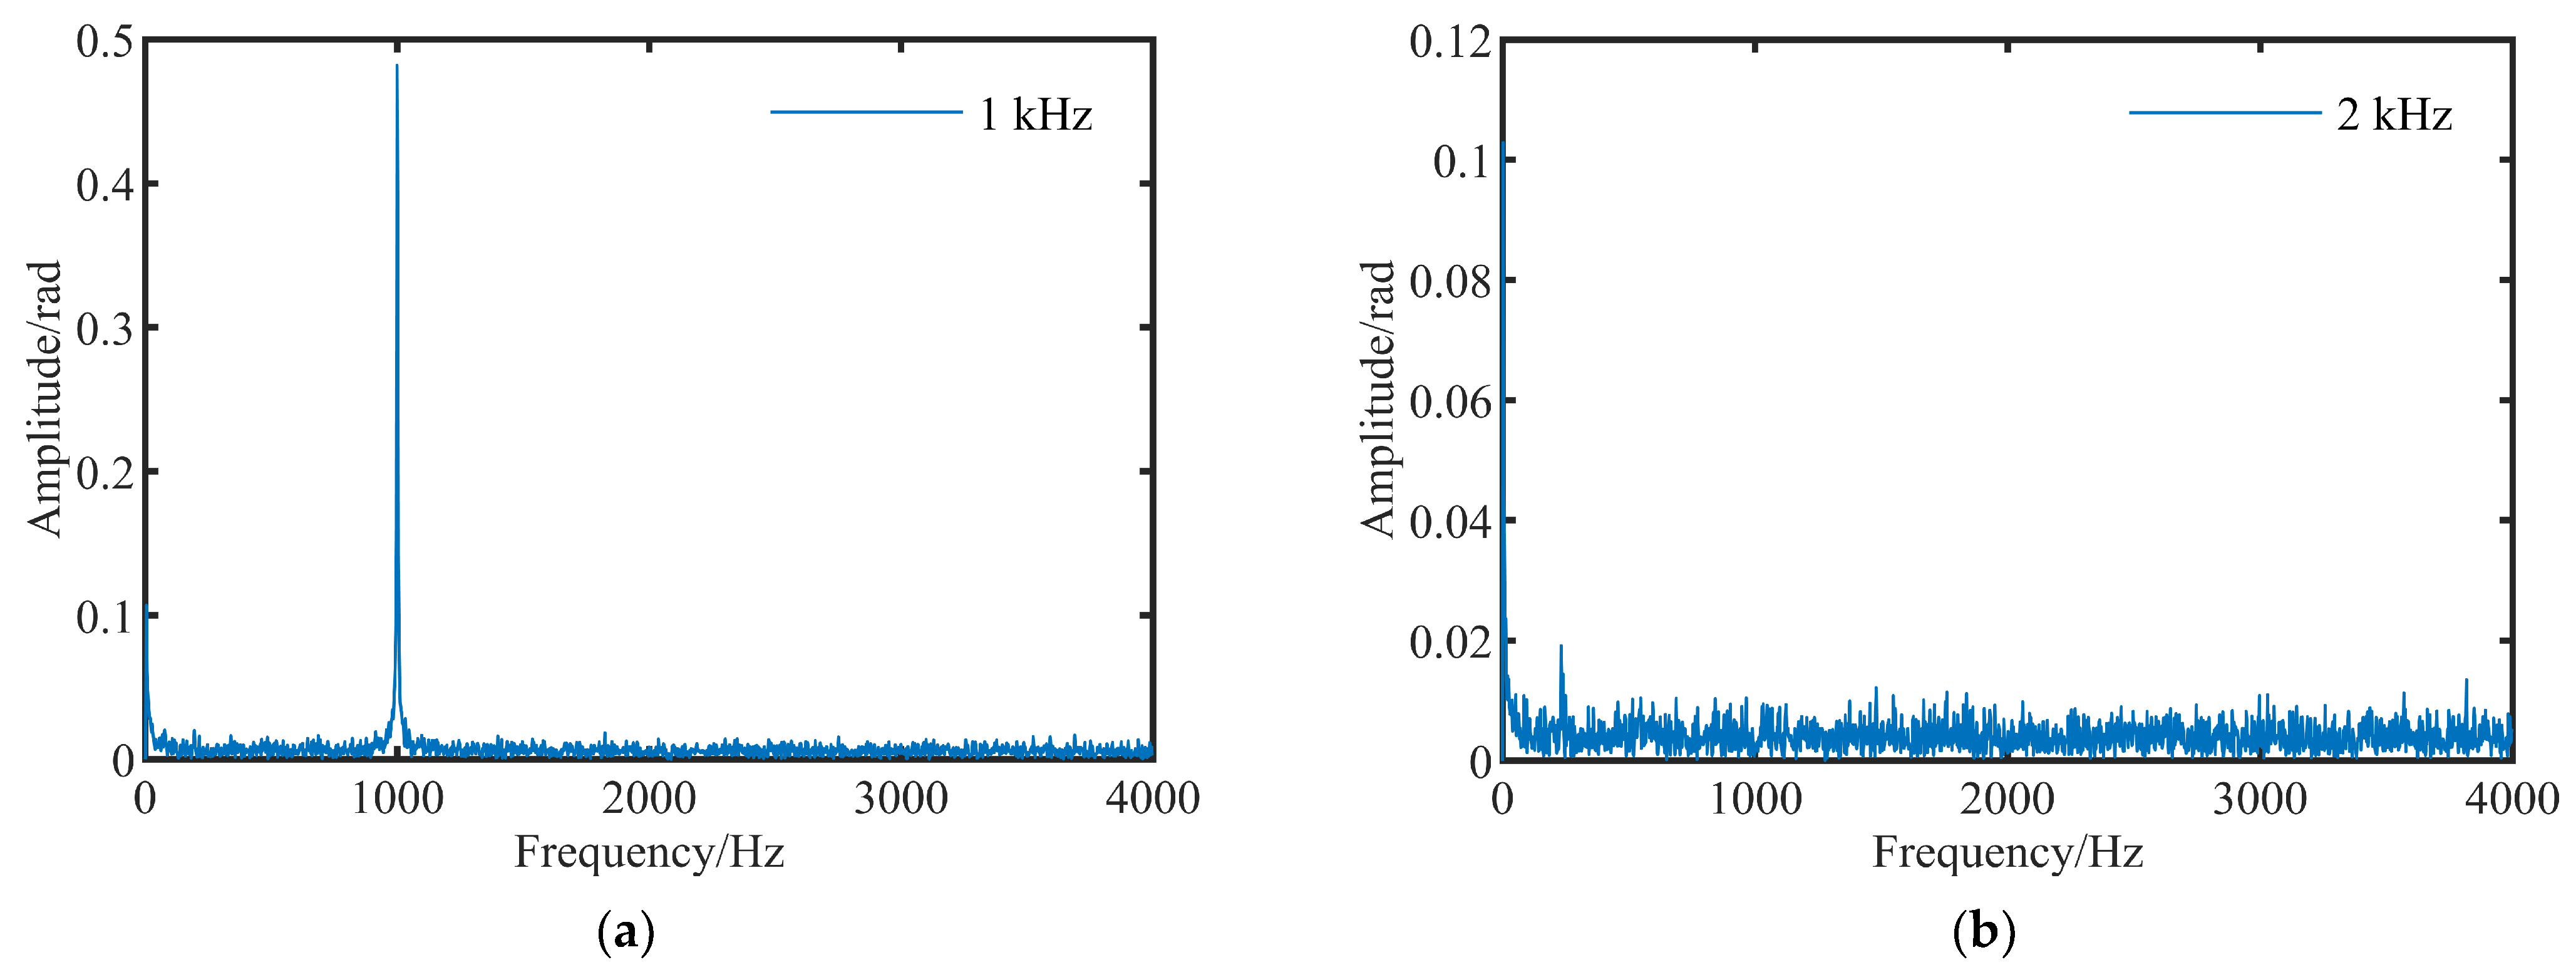
Figure 12.
Multi-point simultaneous perturbation testing optical path.
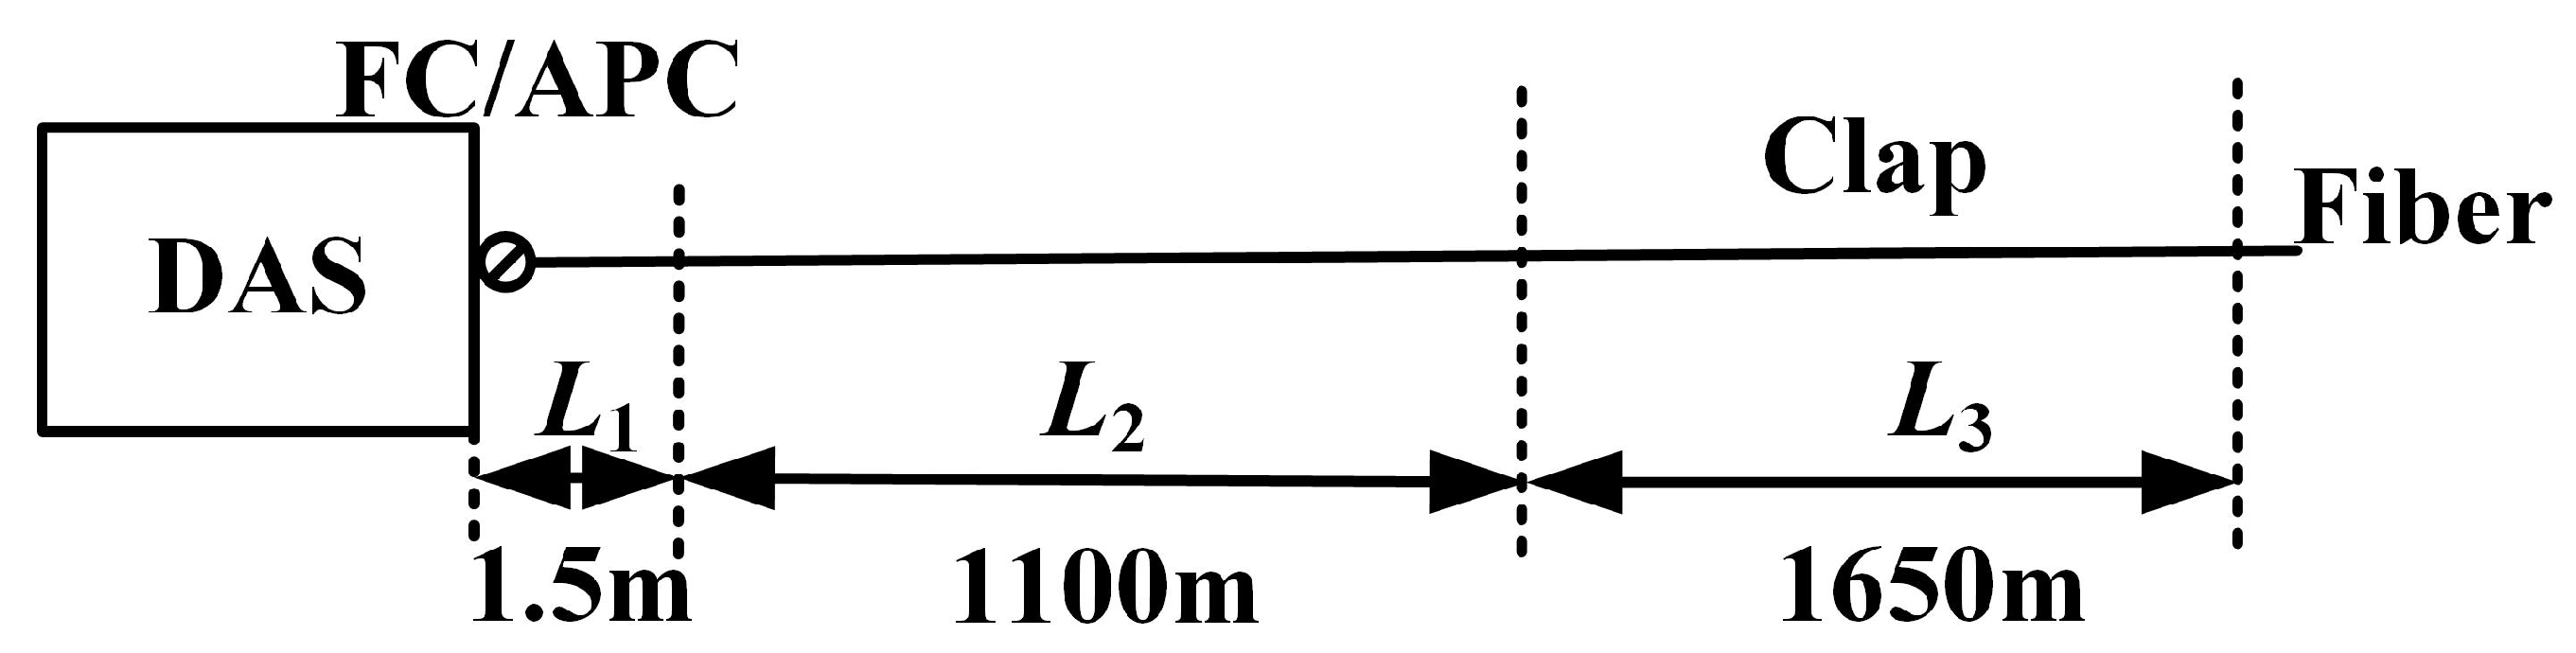
Figure 13.
Multi-point simultaneous perturbation testing results. (a) Waterfall plot chart when no signal is applied; (b) waterfall plot when clapping the second box.
Figure 13.
Multi-point simultaneous perturbation testing results. (a) Waterfall plot chart when no signal is applied; (b) waterfall plot when clapping the second box.

Figure 14.
Temperature influence testing. (a) Optical path; (b) device.

Figure 15.
Variation in sub-band energy with temperature (a) at node (8, 0); (b) at other nodes.

Table 1.
Test/evaluation requirements for DAS in different application areas.
| Application Area | Research Content | Testing/Evaluation Requirements | Reference |
|---|---|---|---|
| Oil and gas exploration and development | Measure the dynamic strain on Vertical Seismic Profile | (1) Coupling degree between optical cable and the wall; (2) Sensitivity | [8,9] |
| Rail transportation | Monitor long-distance train position and speed | Spatial resolution | [10] |
| Submarine cable state monitoring | Monitor anchor drag and anchor drop faults | Frequency response | [11] |
| Perimeter security | Monitor and locate invasion points in real-time in the desert | Sensitivity | [12] |
Table 2.
Judgment matrix of each factor in the middle layer relative to the target layer.
| Sensing Distance | Spatial Sampling Interval | Frequency Response | Response Time | Fiber Type | Measurement Channel |
|---|---|---|---|---|---|
| 0–10 km | 1.25 m | <40 kHz | 1 s | SMF | 1-channel |
Table 3.
Judgment matrix of each factor in the middle layer relative to the target layer.
| DAS Performance Evaluation | Frequency Response | Sensitivity | Spatial Resolution | Sensing Distance | Multi-Point Perturbation | Temperature |
|---|---|---|---|---|---|---|
| frequency response | 1 | 1 | 2 | 2 | 4 | 8 |
| sensitivity | 1 | 1 | 2 | 2 | 4 | 8 |
| spatial resolution | 1/2 | 1/2 | 1 | 1 | 2 | 4 |
| sensing distance | 1/2 | 1/2 | 1 | 1 | 2 | 4 |
| multi-point perturbation | 1/4 | 1/4 | 1/2 | 1/2 | 1 | 2 |
| temperature | 1/8 | 1/8 | 1/4 | 1/4 | 1/2 | 1 |
Table 4.
Judgment matrix of the criterion layer relative to the middle layer (frequency response and sensitivity).
Table 4.
Judgment matrix of the criterion layer relative to the middle layer (frequency response and sensitivity).
| Excellent | Fair | Poor | |
|---|---|---|---|
| excellent | 1 | 2 | 9 |
| fair | 1/2 | 1 | 7 |
| poor | 1/9 | 1/7 | 1 |
Table 5.
Judgment matrix of the criterion layer relative to the middle layer (spatial resolution, multi-point perturbation and temperature influence).
Table 5.
Judgment matrix of the criterion layer relative to the middle layer (spatial resolution, multi-point perturbation and temperature influence).
| Excellent | Fair | Poor | |
|---|---|---|---|
| excellent | 1 | 9 | 9 |
| fair | 1/9 | 1 | 1 |
| poor | 1/9 | 1 | 1 |
Table 6.
Judgment matrix of the criterion layer relative to the middle layer (sensing distance).
| Excellent | Fair | Poor | |
|---|---|---|---|
| excellent | 1 | 1/4 | 1/8 |
| fair | 4 | 1 | 1/4 |
| poor | 8 | 4 | 1 |
Table 7.
Judgment matrix of the criterion layer relative to the middle layer (sensing distance).
| Factors | The Target Layer Weight | Excellent Weight | Fair Weight | Poor Weight |
|---|---|---|---|---|
| frequency response | 0.2963 | 0.5955 | 0.3468 | 0.0577 |
| sensitivity | 0.2963 | 0.5955 | 0.3468 | 0.0577 |
| spatial resolution | 0.1481 | 0.8182 | 0.0909 | 0.0909 |
| sensing distance | 0.1487 | 0.0718 | 0.2267 | 0.7015 |
| multi-point perturbation | 0.0741 | 0.8182 | 0.0909 | 0.0909 |
| temperature | 0.0370 | 0.8182 | 0.0909 | 0.0909 |
| final weights | 0.5757 | 0.2628 | 0.1621 |
Disclaimer/Publisher’s Note: The statements, opinions and data contained in all publications are solely those of the individual author(s) and contributor(s) and not of MDPI and/or the editor(s). MDPI and/or the editor(s) disclaim responsibility for any injury to people or property resulting from any ideas, methods, instructions or products referred to in the content. |
© 2024 by the authors. Licensee MDPI, Basel, Switzerland. This article is an open access article distributed under the terms and conditions of the Creative Commons Attribution (CC BY) license (https://creativecommons.org/licenses/by/4.0/).
Share and Cite
MDPI and ACS Style
Xie, Z.; Sun, Y.; Lv, A.; Xu, Q. Measurement and Evaluation Method of Distributed Optical Fiber Acoustic Sensing Performance. Photonics 2024, 11, 166. https://doi.org/10.3390/photonics11020166
AMA Style
Xie Z, Sun Y, Lv A, Xu Q. Measurement and Evaluation Method of Distributed Optical Fiber Acoustic Sensing Performance. Photonics. 2024; 11(2):166. https://doi.org/10.3390/photonics11020166
Chicago/Turabian StyleXie, Zhiyuan, Yuwei Sun, Anqiang Lv, and Qian Xu. 2024. "Measurement and Evaluation Method of Distributed Optical Fiber Acoustic Sensing Performance" Photonics 11, no. 2: 166. https://doi.org/10.3390/photonics11020166
Note that from the first issue of 2016, this journal uses article numbers instead of page numbers. See further details here.