Article

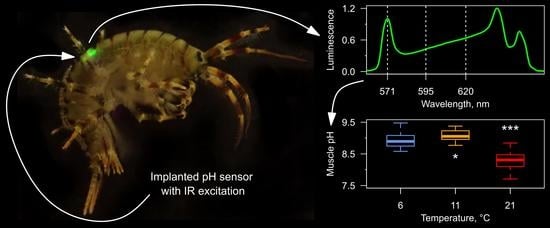
Turn a Shrimp into a Firefly: Monitoring Tissue pH in Small Crustaceans Using an Injectable Hydrogel Sensor with Infrared Excitation and Visible Luminescence

1
Institute of Biology, Irkutsk State University, Irkutsk 664025, Russia
2
Baikal Research Centre, Irkutsk 664003, Russia
3
EnergyLab, ITMO University, Saint Petersburg 197101, Russia
*
Authors to whom correspondence should be addressed.
Photonics 2023, 10(6), 697; https://doi.org/10.3390/photonics10060697
Submission received: 18 May 2023 / Revised: 15 June 2023 / Accepted: 16 June 2023 / Published: 20 June 2023
(This article belongs to the Special Issue Women’s Special Issue Series: Photonics)

Abstract

:
Various implantable optical sensors are an emerging tool in animal physiology and medicine that may provide real-time information about body fluids without tissue extraction. Such sensors are often fluorescence-based and require strong visible external illumination during signal acquisition, which causes anxiety or even stress for small animals and thus may influence the physiological parameters being measured. In order to overcome this obstacle, here, we combined a fluorescent molecular pH probe with upconverting particles within a hydrogel fiber suitable for injection into small crustaceans. The green luminescence of the particles under non-visible infrared illumination excited fluorescence of the molecular probe and allowed for pH measurements after correction of the probe readout for luminescence intensity. The developed optical setup based on a common microscope ensured effective visualization of the sensor and spectral pH measurements through the translucent exoskeleton of the amphipod (Amphipoda, Crustacea) Eulimnogammarus verrucosus, endemic to ancient Lake Baikal. Testing the sensors in these cold-loving crustaceans under environmentally relevant temperature increases showed alkalization of amphipod internal media by 0.2 soon after the start of the experiment, while further increases led to acidification by 0.5. The applied approach for simple sensor preparation can be useful in building other implantable optical sensors for light-sensitive organisms.

Graphical Abstract

1. Introduction

Implantable optical sensors are an emerging tool in the fields of animal physiology and medical diagnostics that may provide the possibility for real-time monitoring of such critical parameters as low-molecular weight metabolites, hormones, medicines and ions [1,2,3]. Currently, these parameters are mostly measured only after blood or tissue sampling, which often does not provide the necessary resolution [4]. Any implantable device, in order to prolong its contact with the organism fluids, requires a carrier reducing the foreign body response, which is usually some hydrogel [5,6] permeable to the molecule of interest and anchoring the functional component. The implantable optical sensors are mostly based on some sensitive component dispersed within the biocompatible hydrogel and rely on external device detecting and analyzing the light obtained through the tissues [3,7,8]. The parameter of interest is usually determined via ratiometric changes in the light spectrum, although there are alternative approaches available for certain parameters such as phosphorescence lifetime measurement in the case of oxygen [7].
Fluorescent sensors are one of the most common types of implantable optical sensors due to the relative simplicity of their preparation and their bright luminescence [8,9,10,11,12]. The fluorescent component in such sensors, after interaction with the target molecule, significantly changes either its spectrum or the intensity of fluorescence; in the last case, an insensitive reference fluorescent dye is needed for the ratiometric measurements. However, implantable fluorescent sensors require strong visible illumination during signal acquisition, which is sub-optimal for any small animal that can see it and is not anesthetized during the measurement. In the best case, the illumination causes some anxiety in the animal, while light-sensitive species can experience stress under these conditions or even eye damage [13,14]. Additionally, external illumination also excites autofluorescence of the tissues, which may complicate signal acquisition and analysis [15], and blue illumination may even be phototoxic [16].
Upconverting particles are anti-Stokes luminophores that can be excited by infrared (IR) illumination of about 980 nm and emit visible light. Due to their relatively effective photon upconversion and high stability, upconverting particles were proposed as components of various sensors for secondary excitation of fluorescent molecular probes [17,18,19]. Usually, the main motivation for combining fluorophores with upconverting particles is eliminating the autofluorescence of biological objects or background fluorescence within various biochemical in vitro analyses.
Importantly, the 980 nm light is invisible for practically all animals and does not have phototoxic effects apart from local temperature increase. However, examples of studies introducing upconverting particles into implantable sensors designed specifically for application inside animals are fairly absent despite there being plenty of similar works utilizing the particles for bioimaging, mostly on cellular cultures [20].
Crustaceans are an important group of invertebrates both in aquaculture and in natural ecosystems [21,22]. Amphipods (Amphipoda, Crustacea) are a large order of crustaceans that are morphologically similar to shrimps and prawns (and sometimes informally called “freshwater shrimps”, which is taxonomically incorrect) and play significant roles in various water ecosystems around the globe, including freshwater reservoirs [23]. This is especially true for ancient Lake Baikal, comprising about one fifth of all fresh water readily available to humanity [24]. Taxonomically and morphologically diverse amphipods of Baikal are important to the lake ecosystem [25,26], which stability is crucial for maintaining the high quality of the lake water.
In this study we successfully combined a fluorescent molecular pH probe with upconverting particles in a hydrogel carrier using a simple preparation protocol. Extracellular pH is among the main physiological parameters influencing many factors in any animal organism, for example, activities of enzymes and transmembrane ion channels or oxygen transport by such proteins as hemoglobin or hemocyanin in the case of crustaceans. The developed IR-excited injectable pH sensor was tested on an endemic amphipod species Eulimnogammarus verrucosus, which is common in the littoral zone of Lake Baikal and used as a model object in various studies [27]. Since amphipods are morphologically close to shrimps, the proposed techniques for acquisition of the sensor optical signal are readily applicable to these and similar crustaceans as well and eliminate excessive animal stress during the procedure.

2. Materials and Methods

2.1. Sensor Preparation

The implantable sensors were based on the pH-sensitive molecular probe SNARF-1 with orange fluorescence and upconverting microparticles with green luminescence combined within filamentous polyacrylamide hydrogels with a diameter of about 400 μm. The fluorophore was used in the form of conjugate with dextran (70 kDa, D-3304, Thermo Fisher Scientific, Waltham, MA, USA) for tight immobilization within the hydrogel, and the microparticles were PTIR545/F (Phosphor Technology, Stevenage, UK) with a size of about several microns. The following components were mixed for the hydrogel polymerization: 5 mg of upconverting particles PTIR545/F, 20.8 μL of 24 mg/mL SNARF-1-dextran solution, 30 μL of glycerol, 18 μL of solution containing 45% acrylamide (A1089, AppliChem, Darmstadt, Germany) and 9% N,N′-methylenebisacrylamide (A3636, AppliChem, Germany), 0.2 μL of N,N,N′,N′-tetramethylethylenediamine (Acros-13845, Acros Organics, Geel, Belgium) and 1 μL of 10% ammonium persulfate solution. Glycerol was added to the mixture in order to increase its viscosity and ensure more homogeneous distribution of upconverting particles during polymerization. Immediately after mixing, the mixture was transferred to smooth glass capillaries with an internal diameter of ~0.4 mm that were kept constantly rotating on the capillary axis in order to equally distribute the upconverting particles. The polymerized hydrogels were manually extracted from the capillaries and washed of unpolymerized components for at least 30 min at least 3 times in copious amounts of water.
For verification of autofluorescence excitation by the upconverting particles, we prepared a separate batch of hydrogels with PTIR545/F but without SNARF-1-dextran (exchanged with water) according to the same protocol. For toxicity tests we used the following mixture for hydrogel preparation: 30 μL of 100 mg/mL PTIR545/F suspension in water, 60 μL of solution containing 30% acrylamide and 0.8% N,N′-methylenebisacrylamide, 45 μL of water, 1 μL of N,N,N′,N′-tetramethylethylenediamine and 2 μL of 10% ammonium persulfate solution. In this case, the concentration of upconverting particles was about three times lower than in the sensors. The hydrogels for testing the dextran immunogenicity were prepared from the following mixture: 50 μL of solution containing 45% acrylamide and 9% N,N′-methylenebisacrylamide, 12 μL of 5 mg/mL dextran (70 kDa, 31390, Sigma-Aldrich, St. Louis, MO, USA) solution in water, 0.2 μL of N,N,N′,N′-tetramethylethylenediamine and 1 μL of 10% ammonium persulfate solution. Thus, dextran concentration was about eight times lower than in the sensors. In the case of the control group for the experiment, the dextran solution was replaced with water.

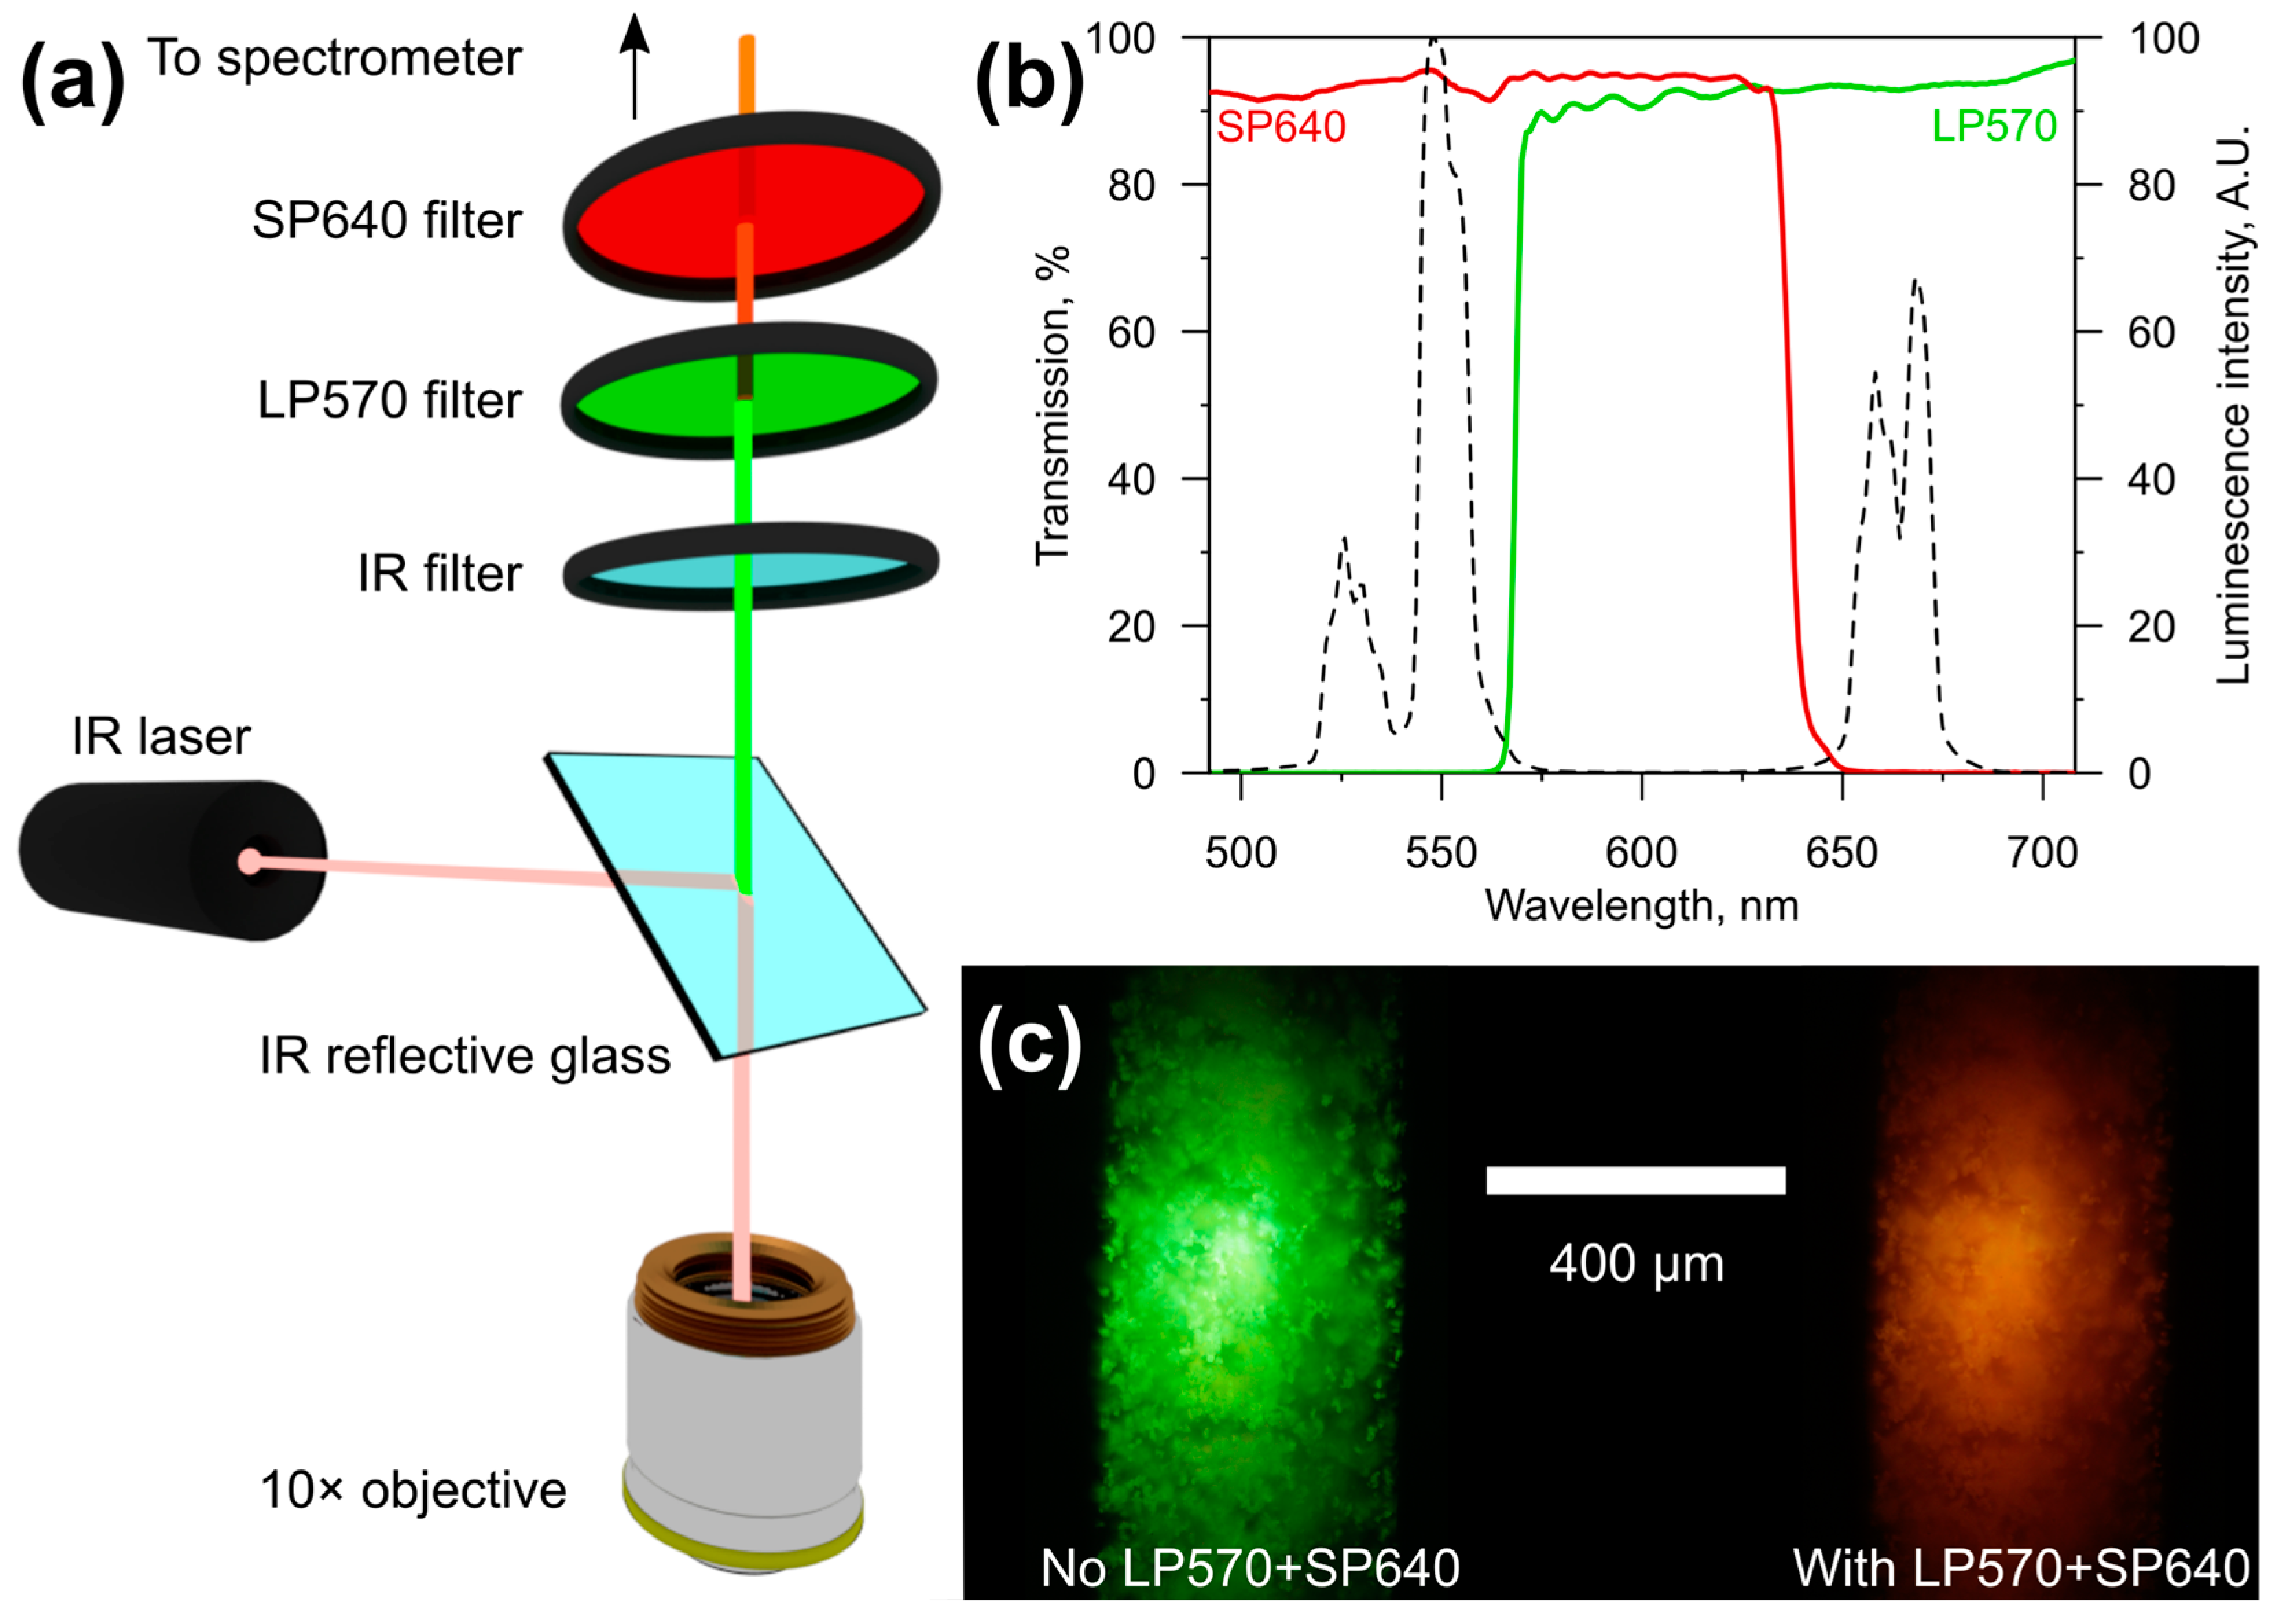
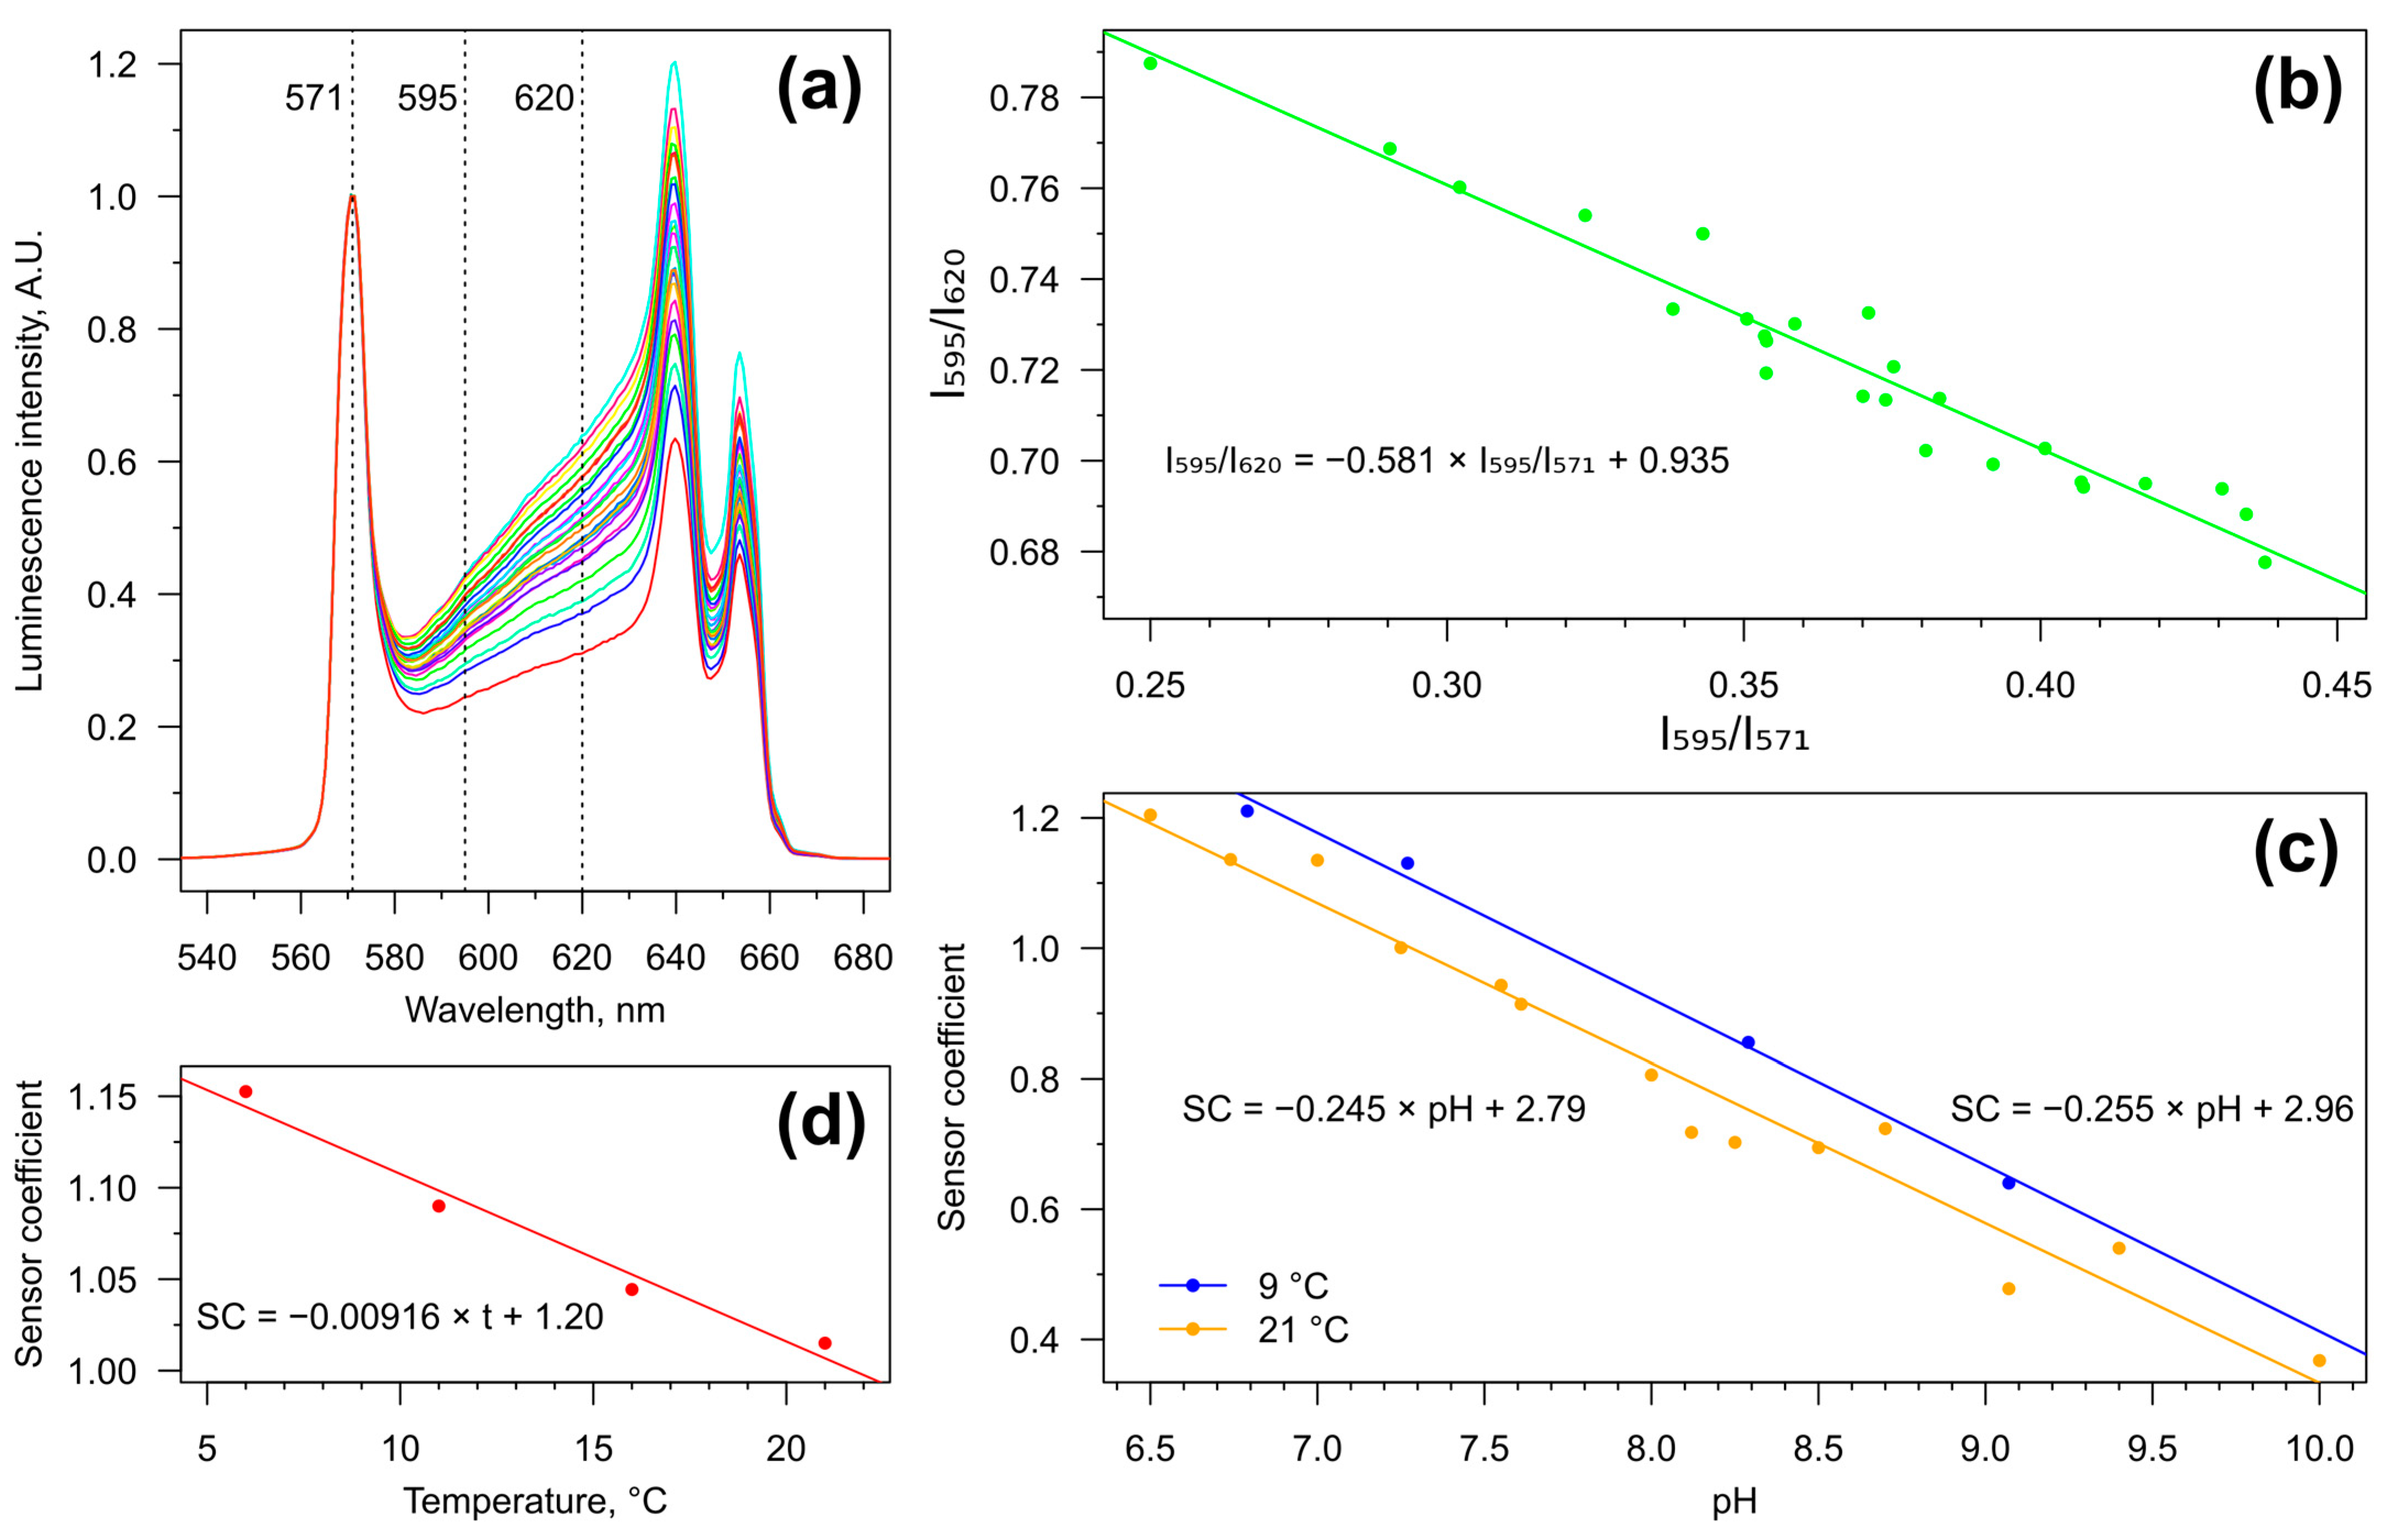
2.2. Signal Acquisition and Sensor Calibration

The prepared pH sensors (Figure 1c) combining SNARF-1 and PTIR545/F were visualized under a modified fluorescent microscope Mikmed-2 (LOMO, St. Petersburg, Russia); the principal optical scheme is presented in Figure 1a. A compact laser Scope-980-100-GD (Wuhan Lilly Electronics, Wuhan, China) with a power of about 100 mW and peak wavelength of about 980 nm was installed as the illuminator at the fluorescence module. This specific laser has relatively low power, but direct eye exposure should be strictly avoided; wearing IR protective glasses is also recommended, especially with higher-power lasers. IR reflective glass (Beijing Bodian Optical Technology, Beijing, China) was incorporated instead of a dichroic mirror, while an IR cut filter FL-IR-25 L1-9-5 (Wuhan Lilly Electronics, China) was used as the emission filter. Additional filters decreasing the intensity of PTIR545/F luminescence, LP570 and SP640 (Beijing Bodian Optical Technology, China), were also installed during sensor calibration and pH measurements (Figure 1b). Transmission spectra of LP570 and SP640 were evaluated with the spectrophotometer Cary 50 (Varian, Palo Alto, CA, USA). For luminescence spectrum acquisition we used QE Pro fiber spectrometer (OceanOptics, Orlando, FL, USA; INTSMA-200 optical slit) attached to the photo port of the microscope as previously described [28]. Analyses of the spectra were performed in Scilab v5.5.2 (ESI Group, Ringis, France).
Calibration of the sensors to external pH and different temperatures was performed in the series of sodium phosphate buffers. Before spectrum acquisition, we waited for at least 10 min after contact of the sensor with any buffer in order to equilibrate the hydrogel pH with the media. In most cases, the buffers with the sensors were kept at room temperature or refrigerated right before the measurements, but specifically for sensor calibration to temperature changes we used a chamber with an external temperature control system filled with ~500 mL of buffer.
As the sensor readout for pH measurements, we used the sensor coefficient (SC) calculated from the obtained spectra as following:
SC = I595/I620 + 0.581 × I595/I571
where In represents the sensor luminescence intensity (in counts, i.e., arbitrary units) at the wavelength n.
Final pH measurements in muscle interstitial fluid were performed according to the following formula, taking into account the influences of both pH and temperature on the SC:
pH = (2.98 − SC − 0.00916 × t)/0.245
where t is the sensor temperature in °C.

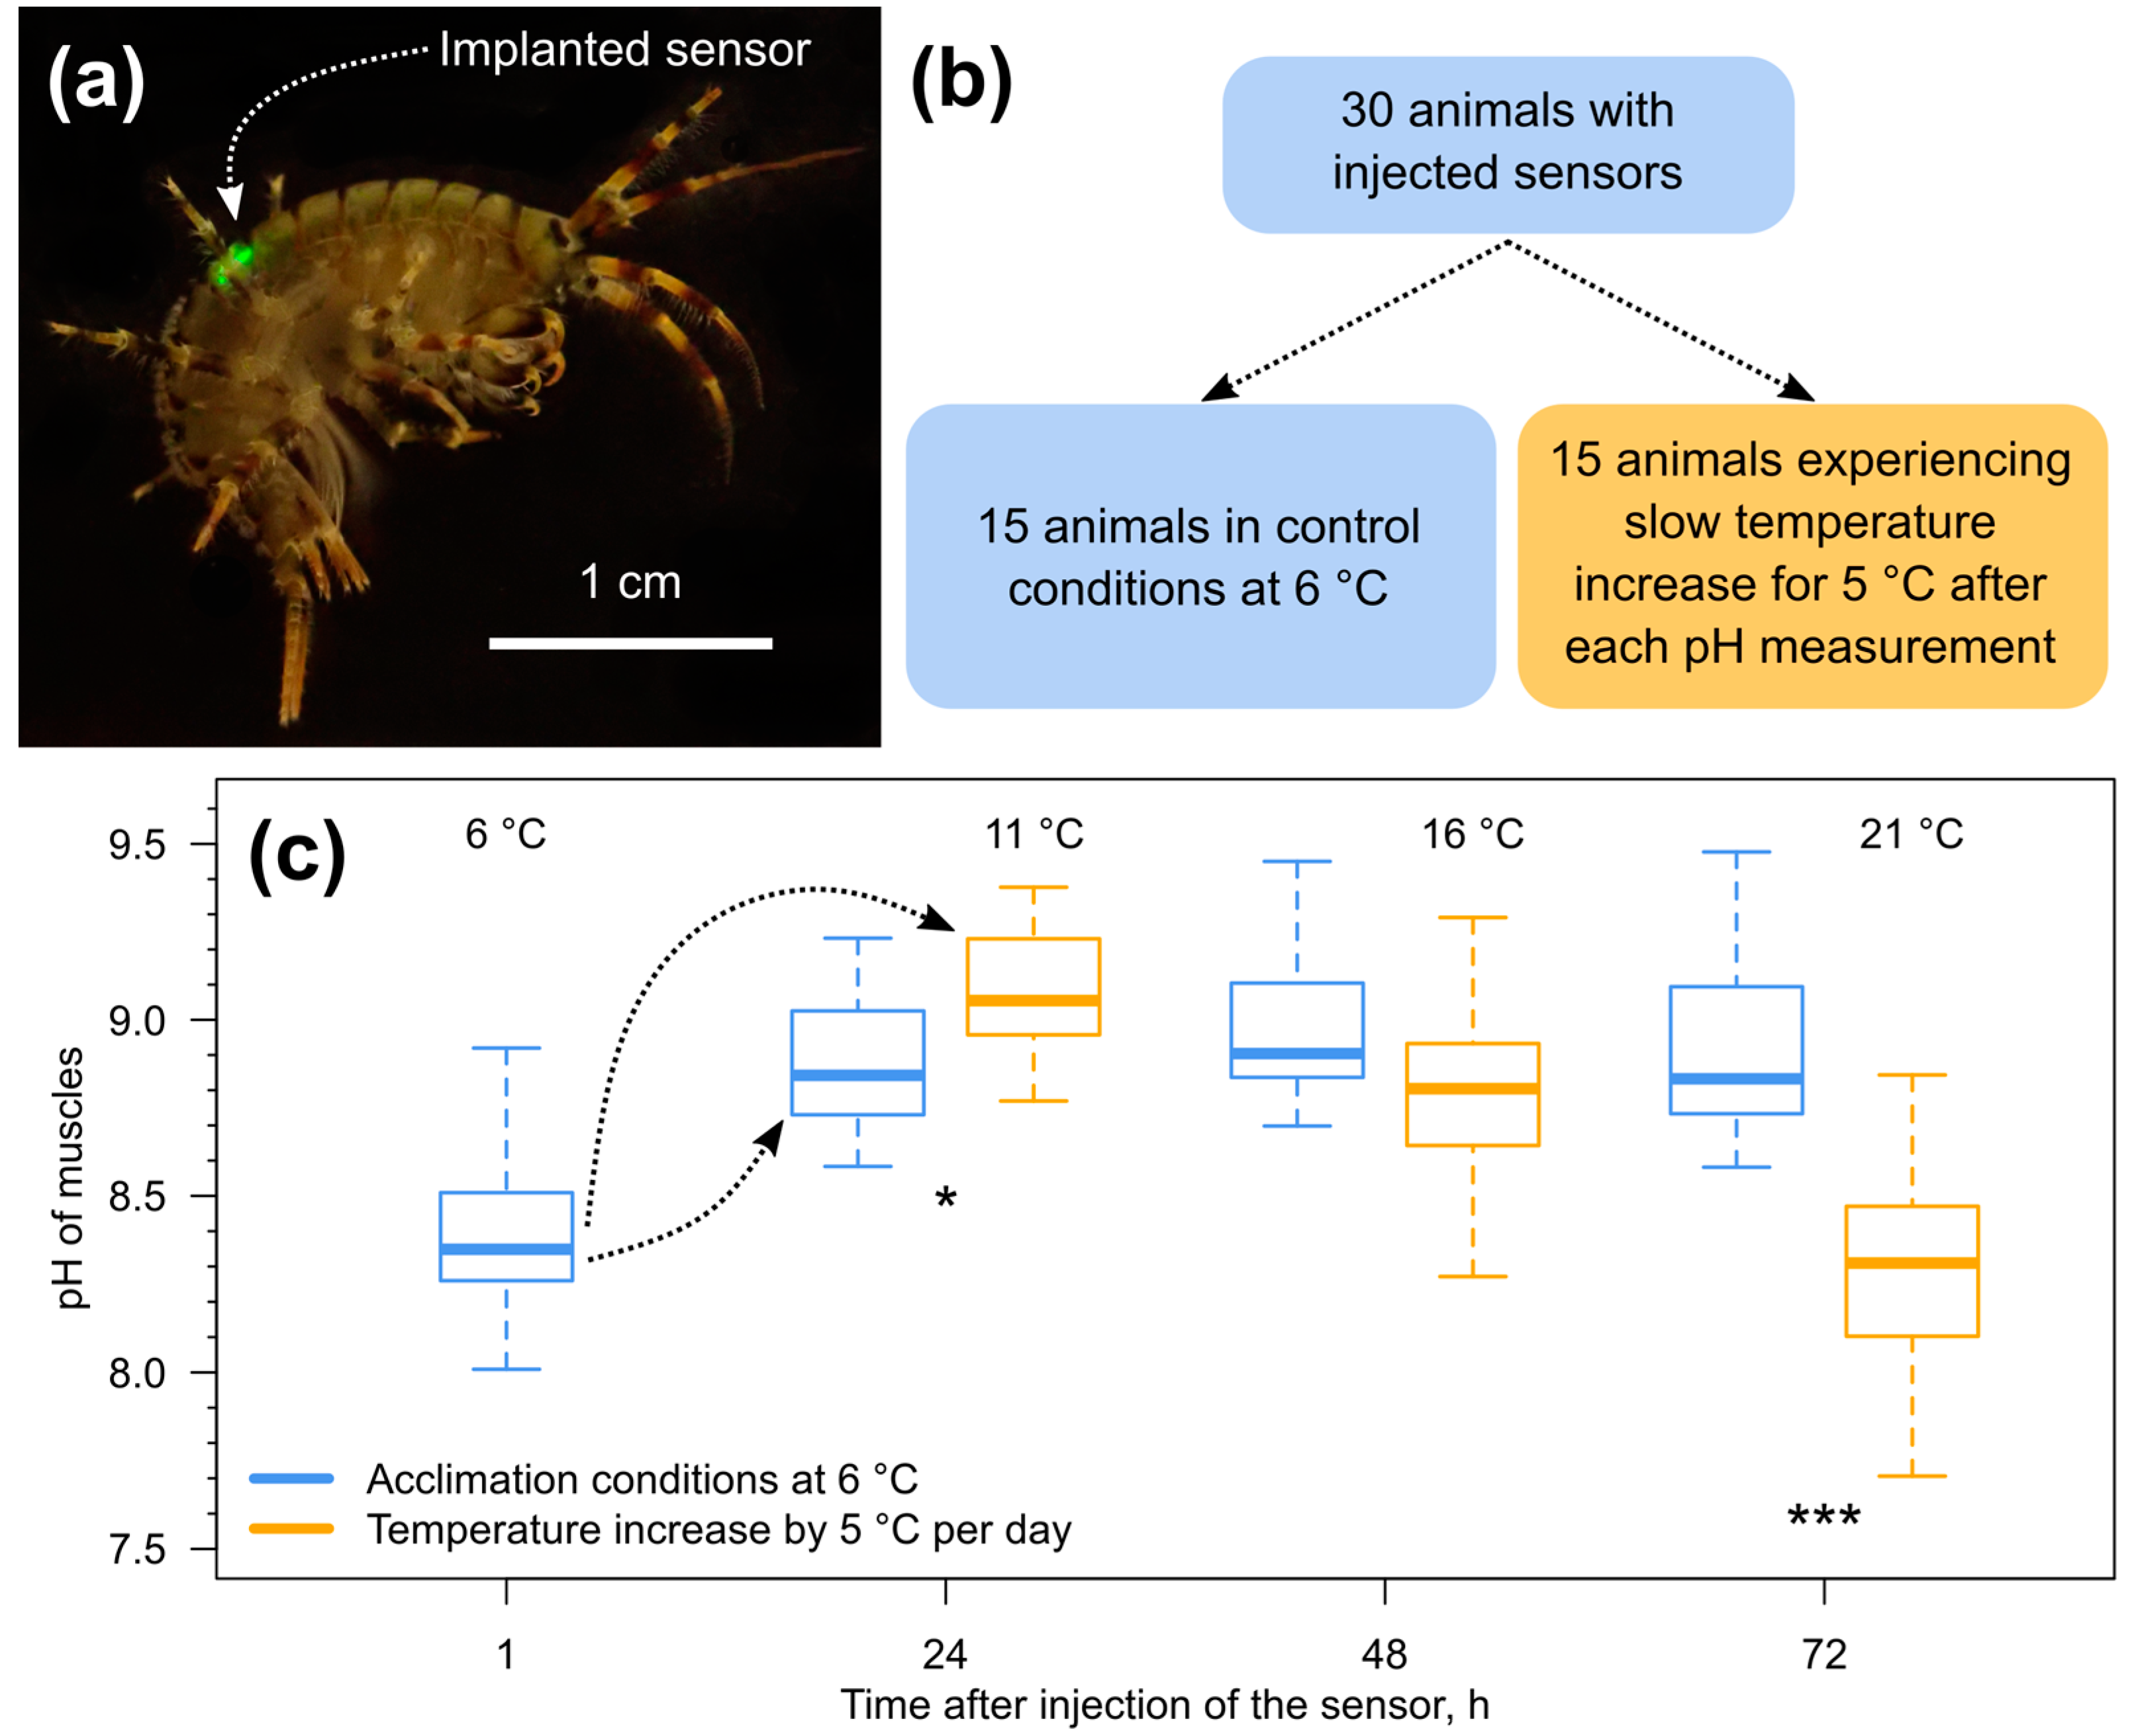
2.3. Amphipod Sampling and Performed Experiments

All procedures and experiments with animals were conducted in accordance with the EU Directive 2010/63/EU for animal experiments and the Declaration of Helsinki. The protocol of the study was registered and approved before the start of the experiments by the Animal Subjects Research Committee of the Institute of Biology at Irkutsk State University (Protocol #2022/10).
Amphipods Eulimnogammarus verrucosus (Gerstfeldt, 1858) were collected at the littoral zone of Lake Baikal near the Listvyanka village (the animals belong to the W barcoding species [27]) with a hand net and kept in laboratory conditions for at least 3 days prior to any experiments. Each aquarium was filled with 2.5 L of Baikal water with a temperature of about 6 °C under constant aeration, and was used for keeping 10–15 amphipods presented with 2–3 large stones under which to hide. Water exchange and feeding with a dried and ground mixture of algae and amphipods from the sampling location was performed every 2–3 days.
The hydrogel filaments were implanted using sterile needles (outer diameter 600 μm) and a plastic fishing line (diameter 400 μm) applied as a plunger during the injection. In the main experiment with temperature increases, the hydrogels were implanted into the dorsal muscles near the 6th segment of the amphipod mesosome. Specifically in the experiment monitoring animal mortality, the hydrogels were injected into the large hemolymph (analog to blood and lymph in crustaceans) lacuna located in the amphipod urosome in order to intensify the contact of the gel containing PTIR545/F with hemolymph.
The main experiment with in vivo pH monitoring in E. verrucosus included the following steps. Thirty animals were injected with sensors, transferred to acclimation conditions and their muscle pH was individually measured under the built optical setup (Figure 1a) one hour post injection. For the measurement, each amphipod was immobilized under the microscope objective as described previously [29] with constant temperature control. Next, animals were randomly separated into two groups: 15 animals at acclimation conditions at 6 °C (the control group) and 15 animals experiencing a slow temperature increase in 5 °C steps after each pH measurement (the experimental group). Each temperature increase took several hours after switching the incubator MIR-254 (Sanyo, Osaka, Japan) to the new settings. In the experimental group on day four post injection at 26 °C, we observed mortality of 60% of individuals. Survival in the control group was 100% during seven days post injection, after which hemolymph of the amphipods was extracted for phenoloxidase measurements and the animals were fixed for histological analysis.
Additionally, we monitored amphipod survival in the three weeks after injection of hydrogels with PTIR545/F but without SNARF-1-dextran into the amphipod urosome.

2.4. Obtaining Hemocyte Primary Culture and Performed Tests

Hemocytes are the cells circulating in crustacean hemolymph and performing mostly immune functions. Here we extracted and the kept these cells as described previously [30] with modifications. Prior to the hemolymph extraction the dorsal surface of the amphipod exoskeleton was sterilized with 70% ethanol, and the exoskeleton was punctured between the sixth and seventh segments. The extracted hemolymph was collected with a glass capillary and mixed 1:1 with anticoagulant solution (150 mM NaCl, 5 mM Na2HPO4, 30 mM sodium citrate, 10 mM ethylenediaminetetraacetic acid with pH 8.0).
The experiment testing the influence of dextran on immune reaction to the hydrogels was independently repeated six times. Each replicate was performed from the pooled hemolymph of six individuals used for the control group (no added gels), polyacrylamide hydrogels and polyacrylamide hydrogels with dextran tested in parallel. Each hemolymph sample was placed with ~1.5 mm-long hydrogel (or no hydrogel at all) into a polystyrol spectrophotometric cuvette that was covered with parafilm. For the imitation of hemolymph circulation, the cuvettes were constantly rotated at 6 °C. Hemocytes can either aggregate around the gel or open up (a process called degranulation) as part of the immune reaction to the foreign body, so we calculated the number of free hemocytes per field of view after placing the cuvette into the inverted microscope Celena S (Logos Biosystems, Anyang, Republic of Korea).
For cytotoxicity tests, polyacrylamide hydrogels with PTIR545/F were placed into Leibovitz’s L-15 medium with L-glutamine (L4386-10X1L, Sigma-Aldrich) containing 15% fetal bovine serum (FBS-HI-11A, Capricorn Scientific) under constant rotation at 6 °C. After one, three or seven days of extraction, the hydrogels were removed and the medium was used for keeping amphipod hemocytes (50 μL of medium per sample). Before mixing with the medium, hemocytes were separated from the humoral hemolymph fraction by centrifugation and washed with a sterile buffer solution (150 mM NaCl, 5 mM Na2HPO4, pH 8.0) twice. The cells were kept in the medium in a 96-well plate at 6 °C for 24 h, and their survival was estimated after staining with 100 mg/mL propidium iodide (81845-100MG, Sigma-Aldrich) under the Celena S inverted microscope.

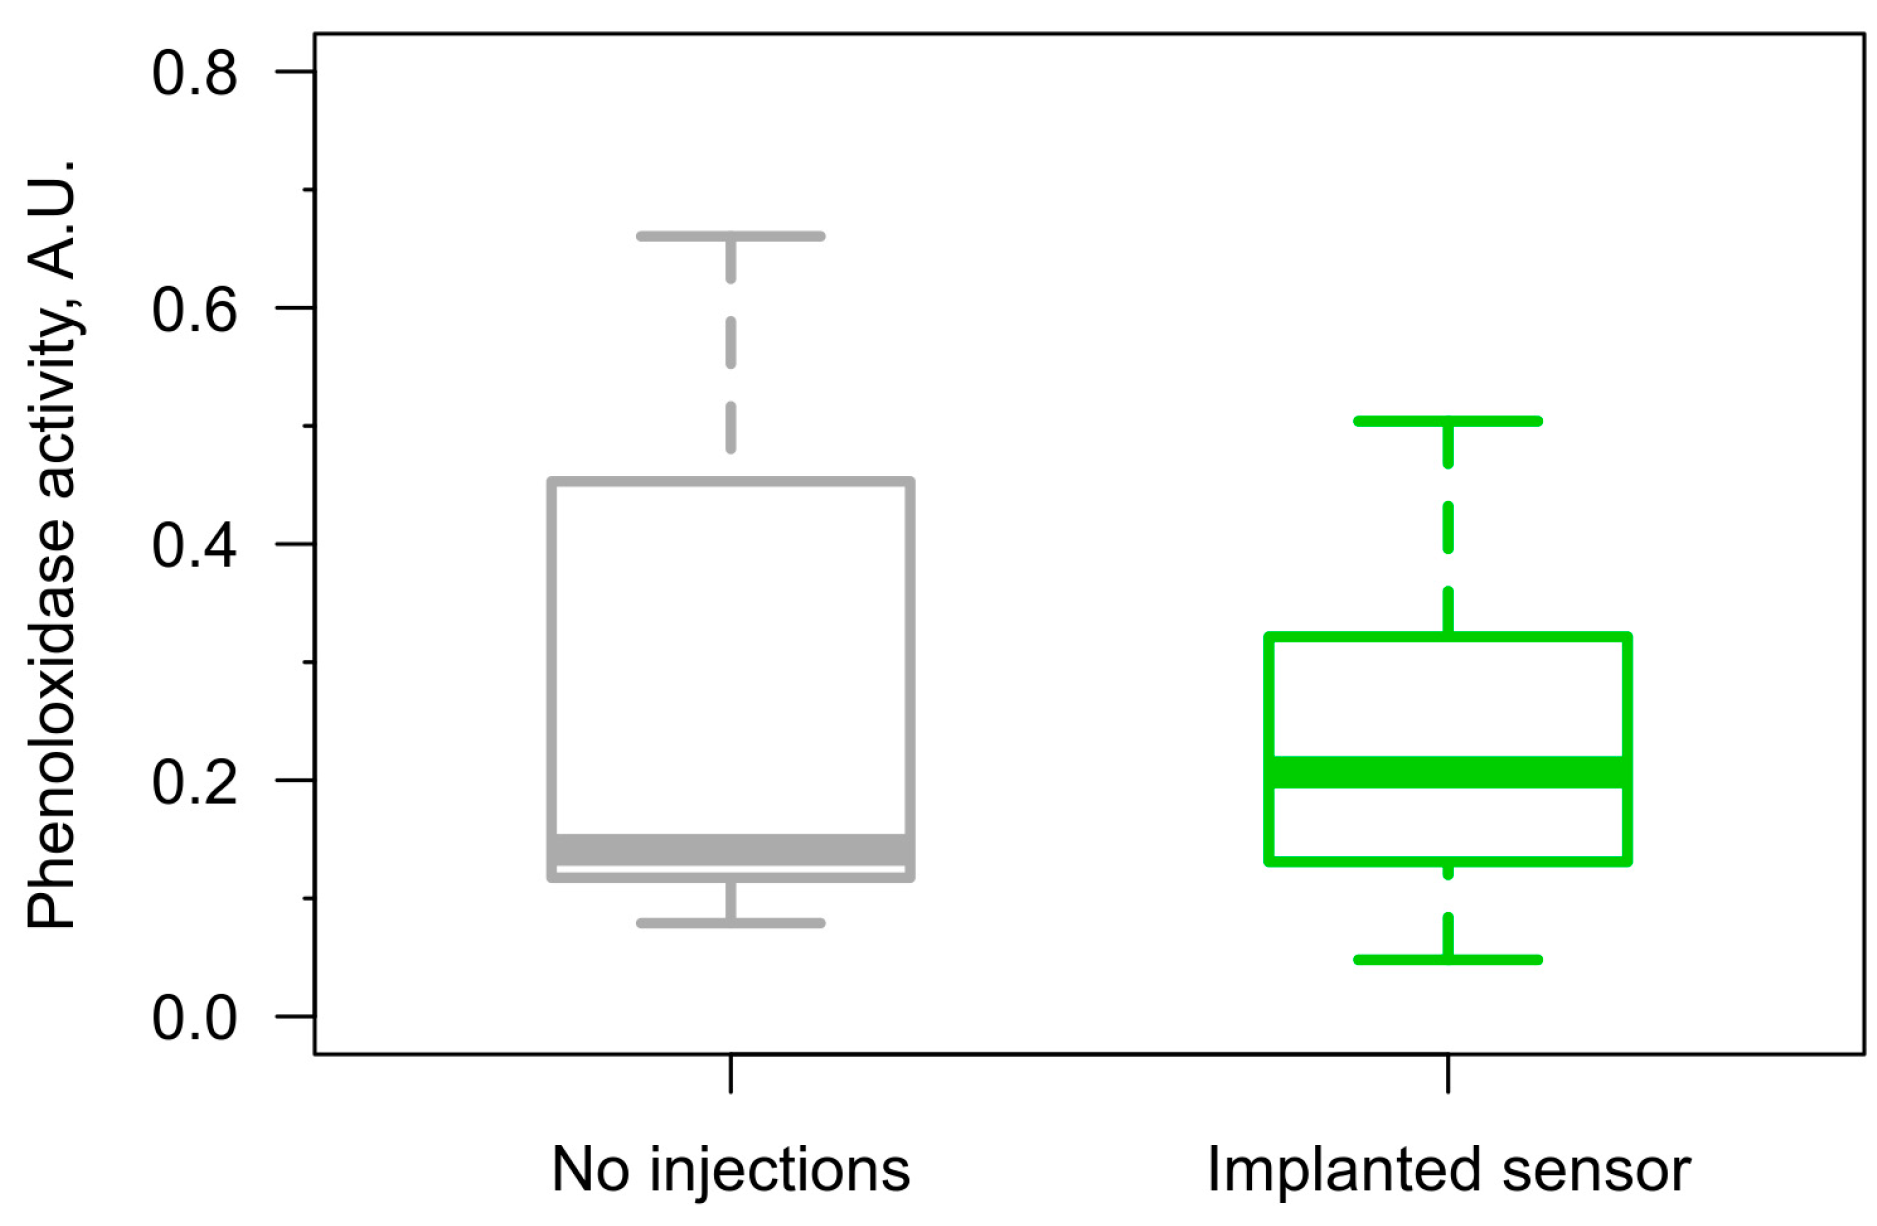
2.5. Phenoloxidase Assay

Phenoloxidase is the main enzyme of the crustacean immune system and was measured as previously described [30]. Hemolymph was collected from the seventh segment of the mesosome as described above, mixed 1:1 with a buffer solution (150 mM NaCl, 10 mM Na2HPO4, 7 mg/mL phenylmethanesulfonyl fluoride, pH 8.0) and frozen at −80 °C;. Before measurement, the samples were centrifuged for 10 min at 500 g and 4 °C in order to precipitate the cellular components. Next, 5 µL of hemolymph extract was mixed with 20 µL of buffer solution, 140 µL of distilled water, and 20 µL of 4 mg/mL 3,4-dihydroxy-L-phenylalanine. Measurements were performed with the CLARIOstar Plus microplate reader (BMG Labtech, Germany) at 490 nm (absorbance) for 40 min. The activity of phenoloxidase was assessed in arbitrary units as the slope of the reaction curve during the linear reaction phase.

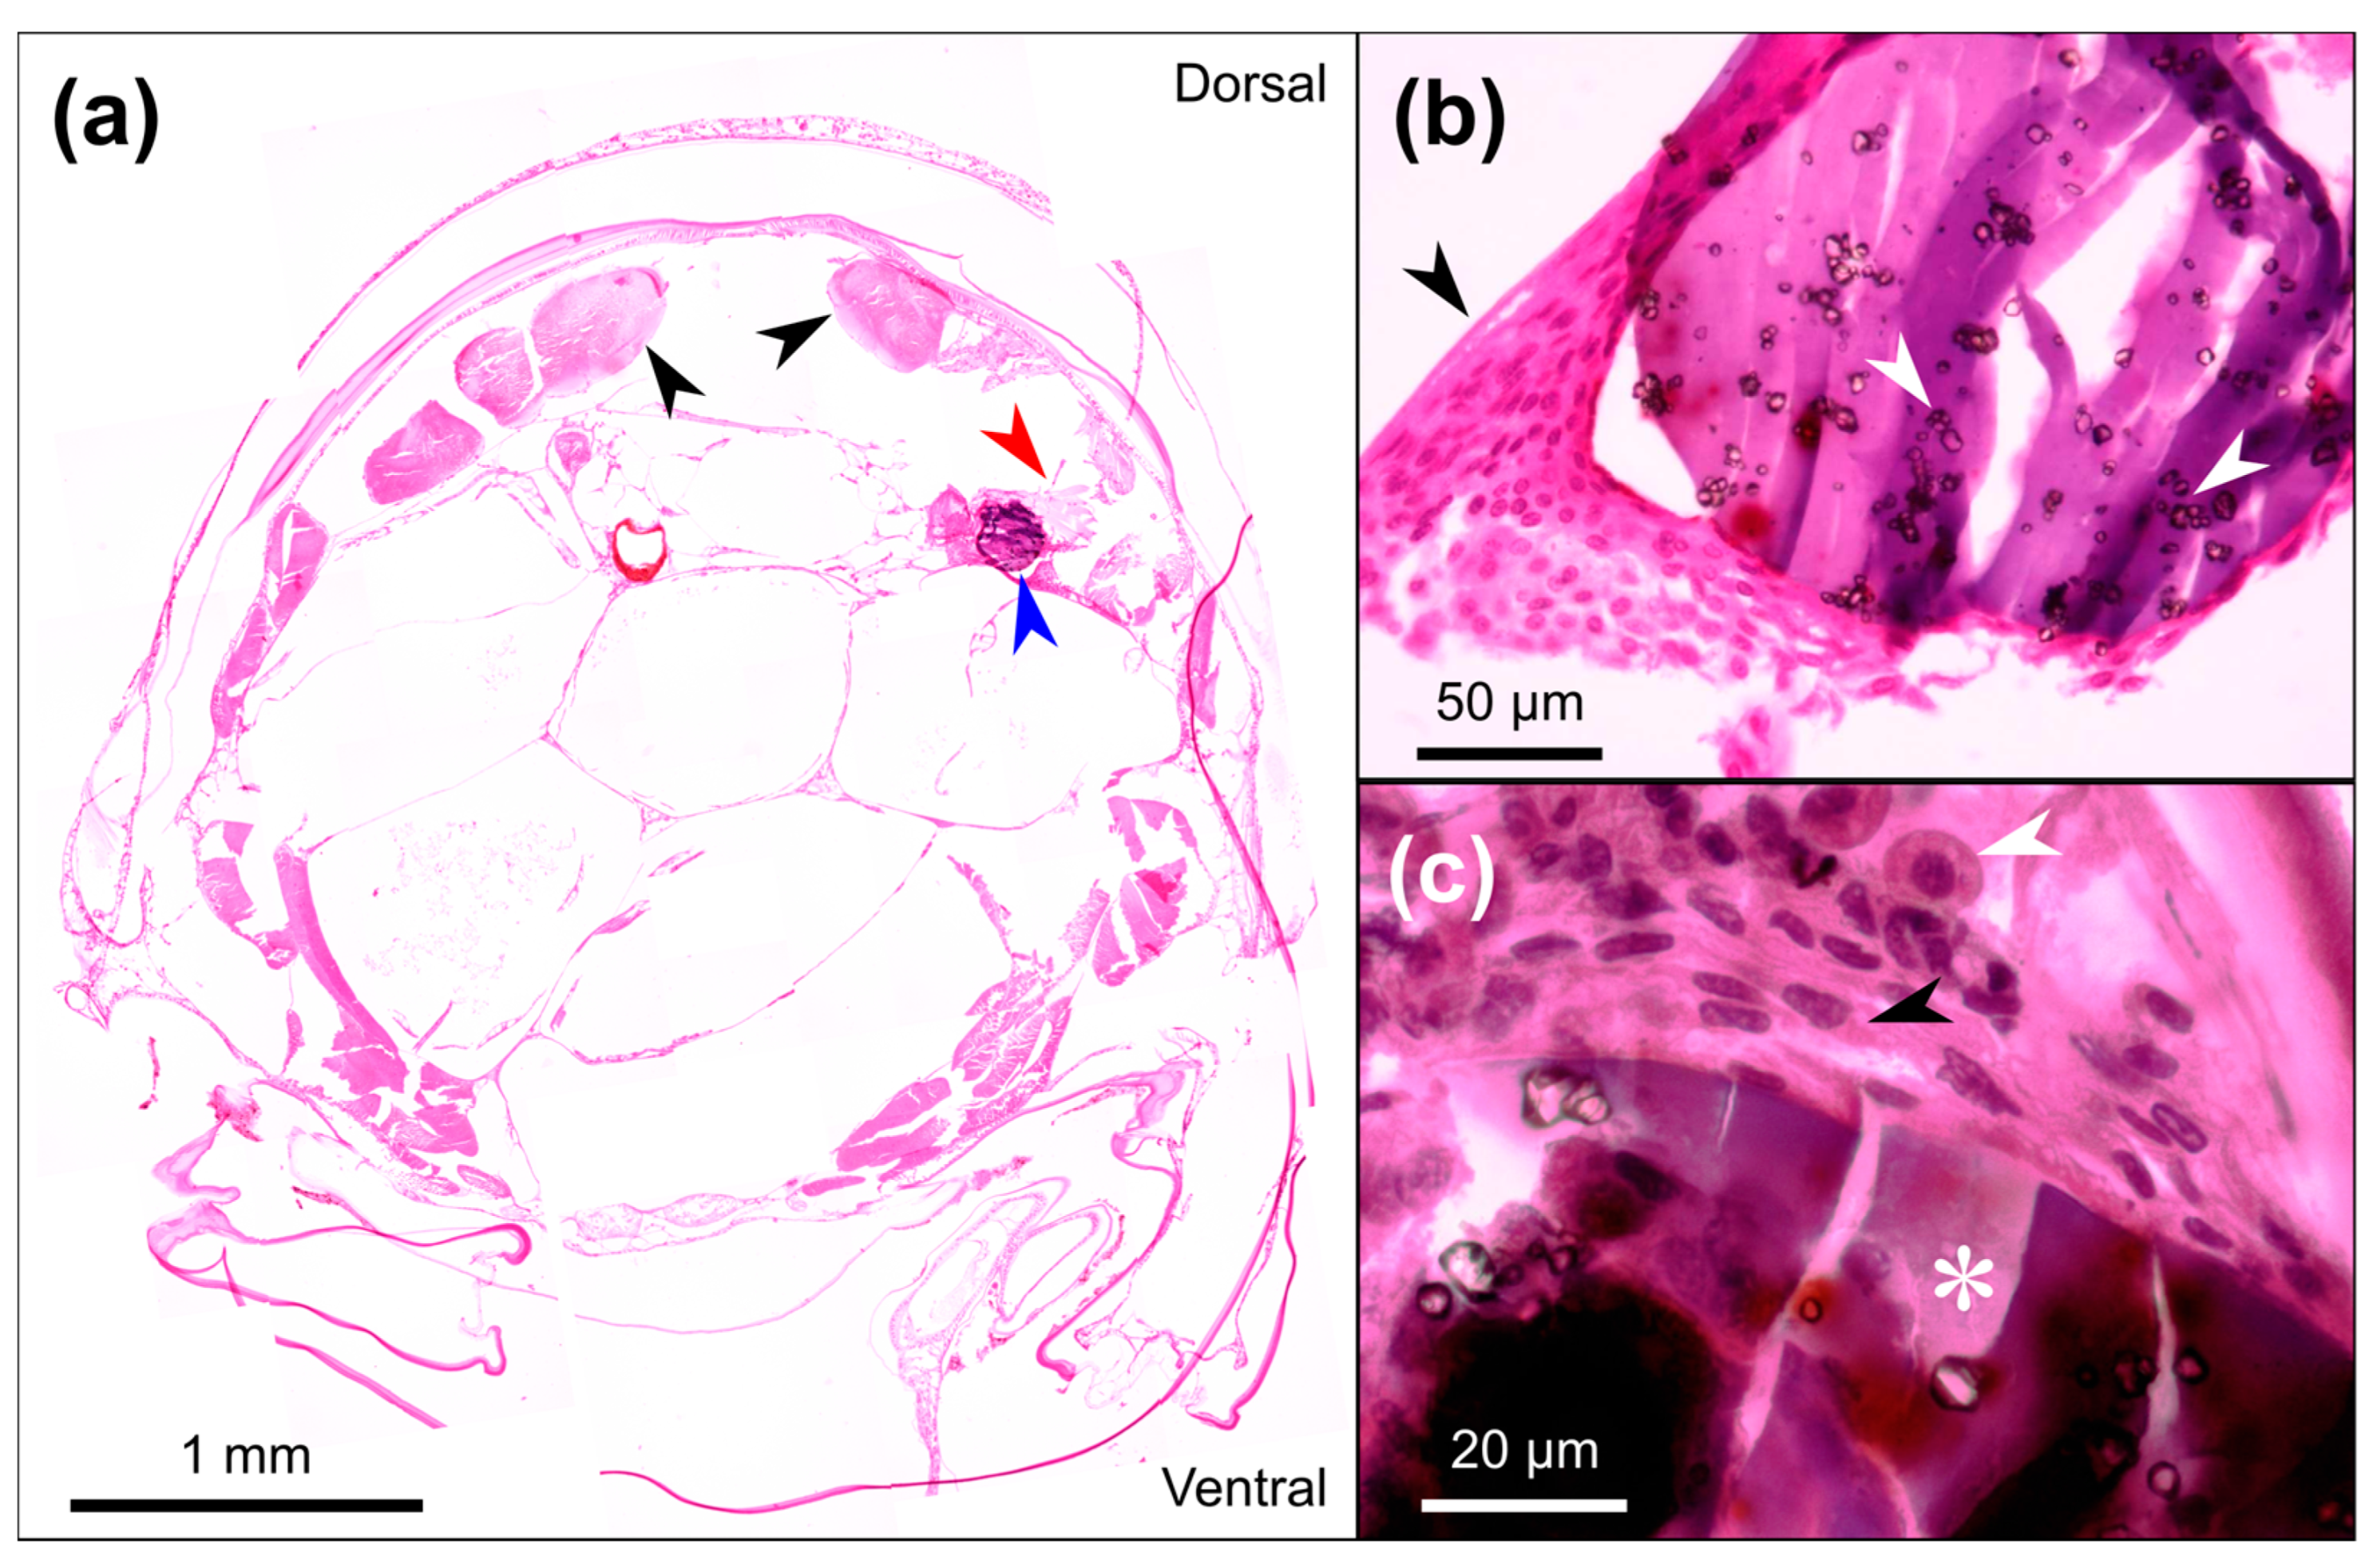
2.6. Histological Analysis

For histological analysis, the animals were fixed in Hartman’s solution (1200 mL of 95% ethanol, 800 mL of 37% formaldehyde, 1200 mL of tap water and 400 mL of acetic acid) at 25 °C (urosomes were removed for better penetration of the solution) and after 30 days the fixing solution was changed to 70% ethanol. To dehydrate the samples, they were placed in the Isoprep Plus solution (BioVitrum, Moscow, Russia) three times for 15 min. Next, the samples were kept in paraffin (BioVitrum, Moscow, Russia) three times for 30 min at 65 °C. Sections of the paraffin blocks (6 µm thick) were made on a Minux S700 microtome (RWD Life Science, Shenzhen, China). Tissue slides were stained by immersing them in the following solutions: twice in xylene for 5 min, twice in Isoprep for 5 min, tap water for 10 min, hematoxylin (BioVitrum, Moscow, Russia) for 4 min, tap water for 9 min, eosin (BioVitrum, Moscow, Russia) for 1 min, 98% ethanol for 1 min, Deol (Labiko, Saint Petersburg, Russia) for 1 min and xylene for 5 min. The resulting samples were embedded in Vitro gel epoxy resin (BioVitrum, Moscow, Russia). Histological sections were examined and visualized using the DMLB microscope (Leica Microsystems Wetzlar GmbH, Wetzlar, Germany) with the U3CMOS05100KPA camera (Altami, St. Petersburg, Russia). Representative photos were automatically stacked using the Zerene Stacker software v.1.04 (Zerene Systems LLC, Richland, WA, USA), if necessary. The programs GIMP v.2.10.20 (The GIMP Team) and Inkscape v.1.0.2 (Inkscape’s Contributors) were used for image correction.

2.7. Statistical Analysis

All statistical analyses were performed in R v4.0.2 [31] using the built-in functions. In the hemocyte experiments, statistically significant differences between groups were verified using the Kruskal–Wallis rank sum test. Differences between the experimental and parallel control groups in the pH measurements, as well as for phenoloxidase activity, were checked using the Mann–Whitney test with the Holm correction for multiple comparisons.

3. Results and Discussion

3.1. Calibration of the IR-Excited pH-Sensors

Here, we managed to combine pH-sensitive SNARF-1 with PTIR545/F upconverting microparticles within a hydrogel carrier and visualize fluorescence of the molecular probe using the built optical setup with IR illumination (Figure 1). Besides the main green peak of luminescence at ~550 nm exciting SNARF-1, the particles have secondary peaks at the red zone of 650–675 nm (Figure 1b), and both green and red luminescence of PTIR545/F had to be largely eliminated in order to acquire the SNARF-1 spectrum without saturation of the spectrometer. The obtained spectra of the sensors have the main peaks corresponding to luminescence of upconverting particles at 571 and 639 nm, while own SNARF-1 fluorescence lies between them within the range of about 590–625 nm (Figure 2a). Fluorescence of SNARF-1 also partially influences the 639 nm peak of the spectra.
Importantly, the local ratio between SNARF-1 and microparticles (varying mainly due to inhomogeneity in PTIR545/F distribution, see Figure 1c) changes the slope of the SNARF-1 fluorescence spectrum (Figure 2a). This visual observation is supported by the clearly linear dependence between the intensity ratios I595/I620 and I595/I571 (Figure 2b). This is an important issue since, in practice, the I595/I620 ratio represents the ratio between the fluorescence of protonated and deprotonated fluorophores, which is usually used as a pH indicator with SNARF-1. Thus, SNARF-1 behaves like this as the local pH within the hydrogel is dependent on local PTIR545/F concentration. We cannot fully explain this phenomenon, but at least two factors could lead to it. (i) Microparticles PTIR545/F bear positive charges due to lanthanide ions in their structure, which may influence the local ionic strength within the hydrogel and thus shift the SNARF-1 readout. (ii) Additionally, after certain preparation processes, upconverting particles can bear some surface groups such as hydroxyls [32] that may indeed directly influence local pH within the hydrogel. We were not able to find any useful information regarding PTIR545/F surface parameters, so the last hypothesis requires further investigation.
However, accounting for the I595/I571 ratio according to the linear regression (Figure 2b) at the formula (1) allowed us to introduce the sensor coefficient (SC) as the satisfactory proxy for measurements of environmental pH from the sensor luminescence spectra (Figure 2c). According to the literature [33], the SNARF-1 readout is clearly dependent on the solution temperature, and some spectral changes in the luminescence of upconverting particles at different temperatures are also possible [34]. Comparison of calibration lines for SC at 21 and 9 °C showed that the line fully shifts at different temperatures, but the slope of pH dependence practically does not change (Figure 2c). In order to obtain the quantitative temperature dependence, we checked SCs of the same sensors inside the same buffer at different temperatures, and the dependence was found to be nearly linear (Figure 2d) in agreement with the previous data on the linear relation between temperature and the dissociation constant of a dye similar to SNARF-1 [33].
Finally, after accounting for the temperature influence according to the linear regression on Figure 2d in the calibration line at 21 °C (Figure 2c) we obtained the formula (2) for calculating pH from SC within the tested temperature range. Calculations from the formula (2) also coincide with the calibration line at 9 °C.

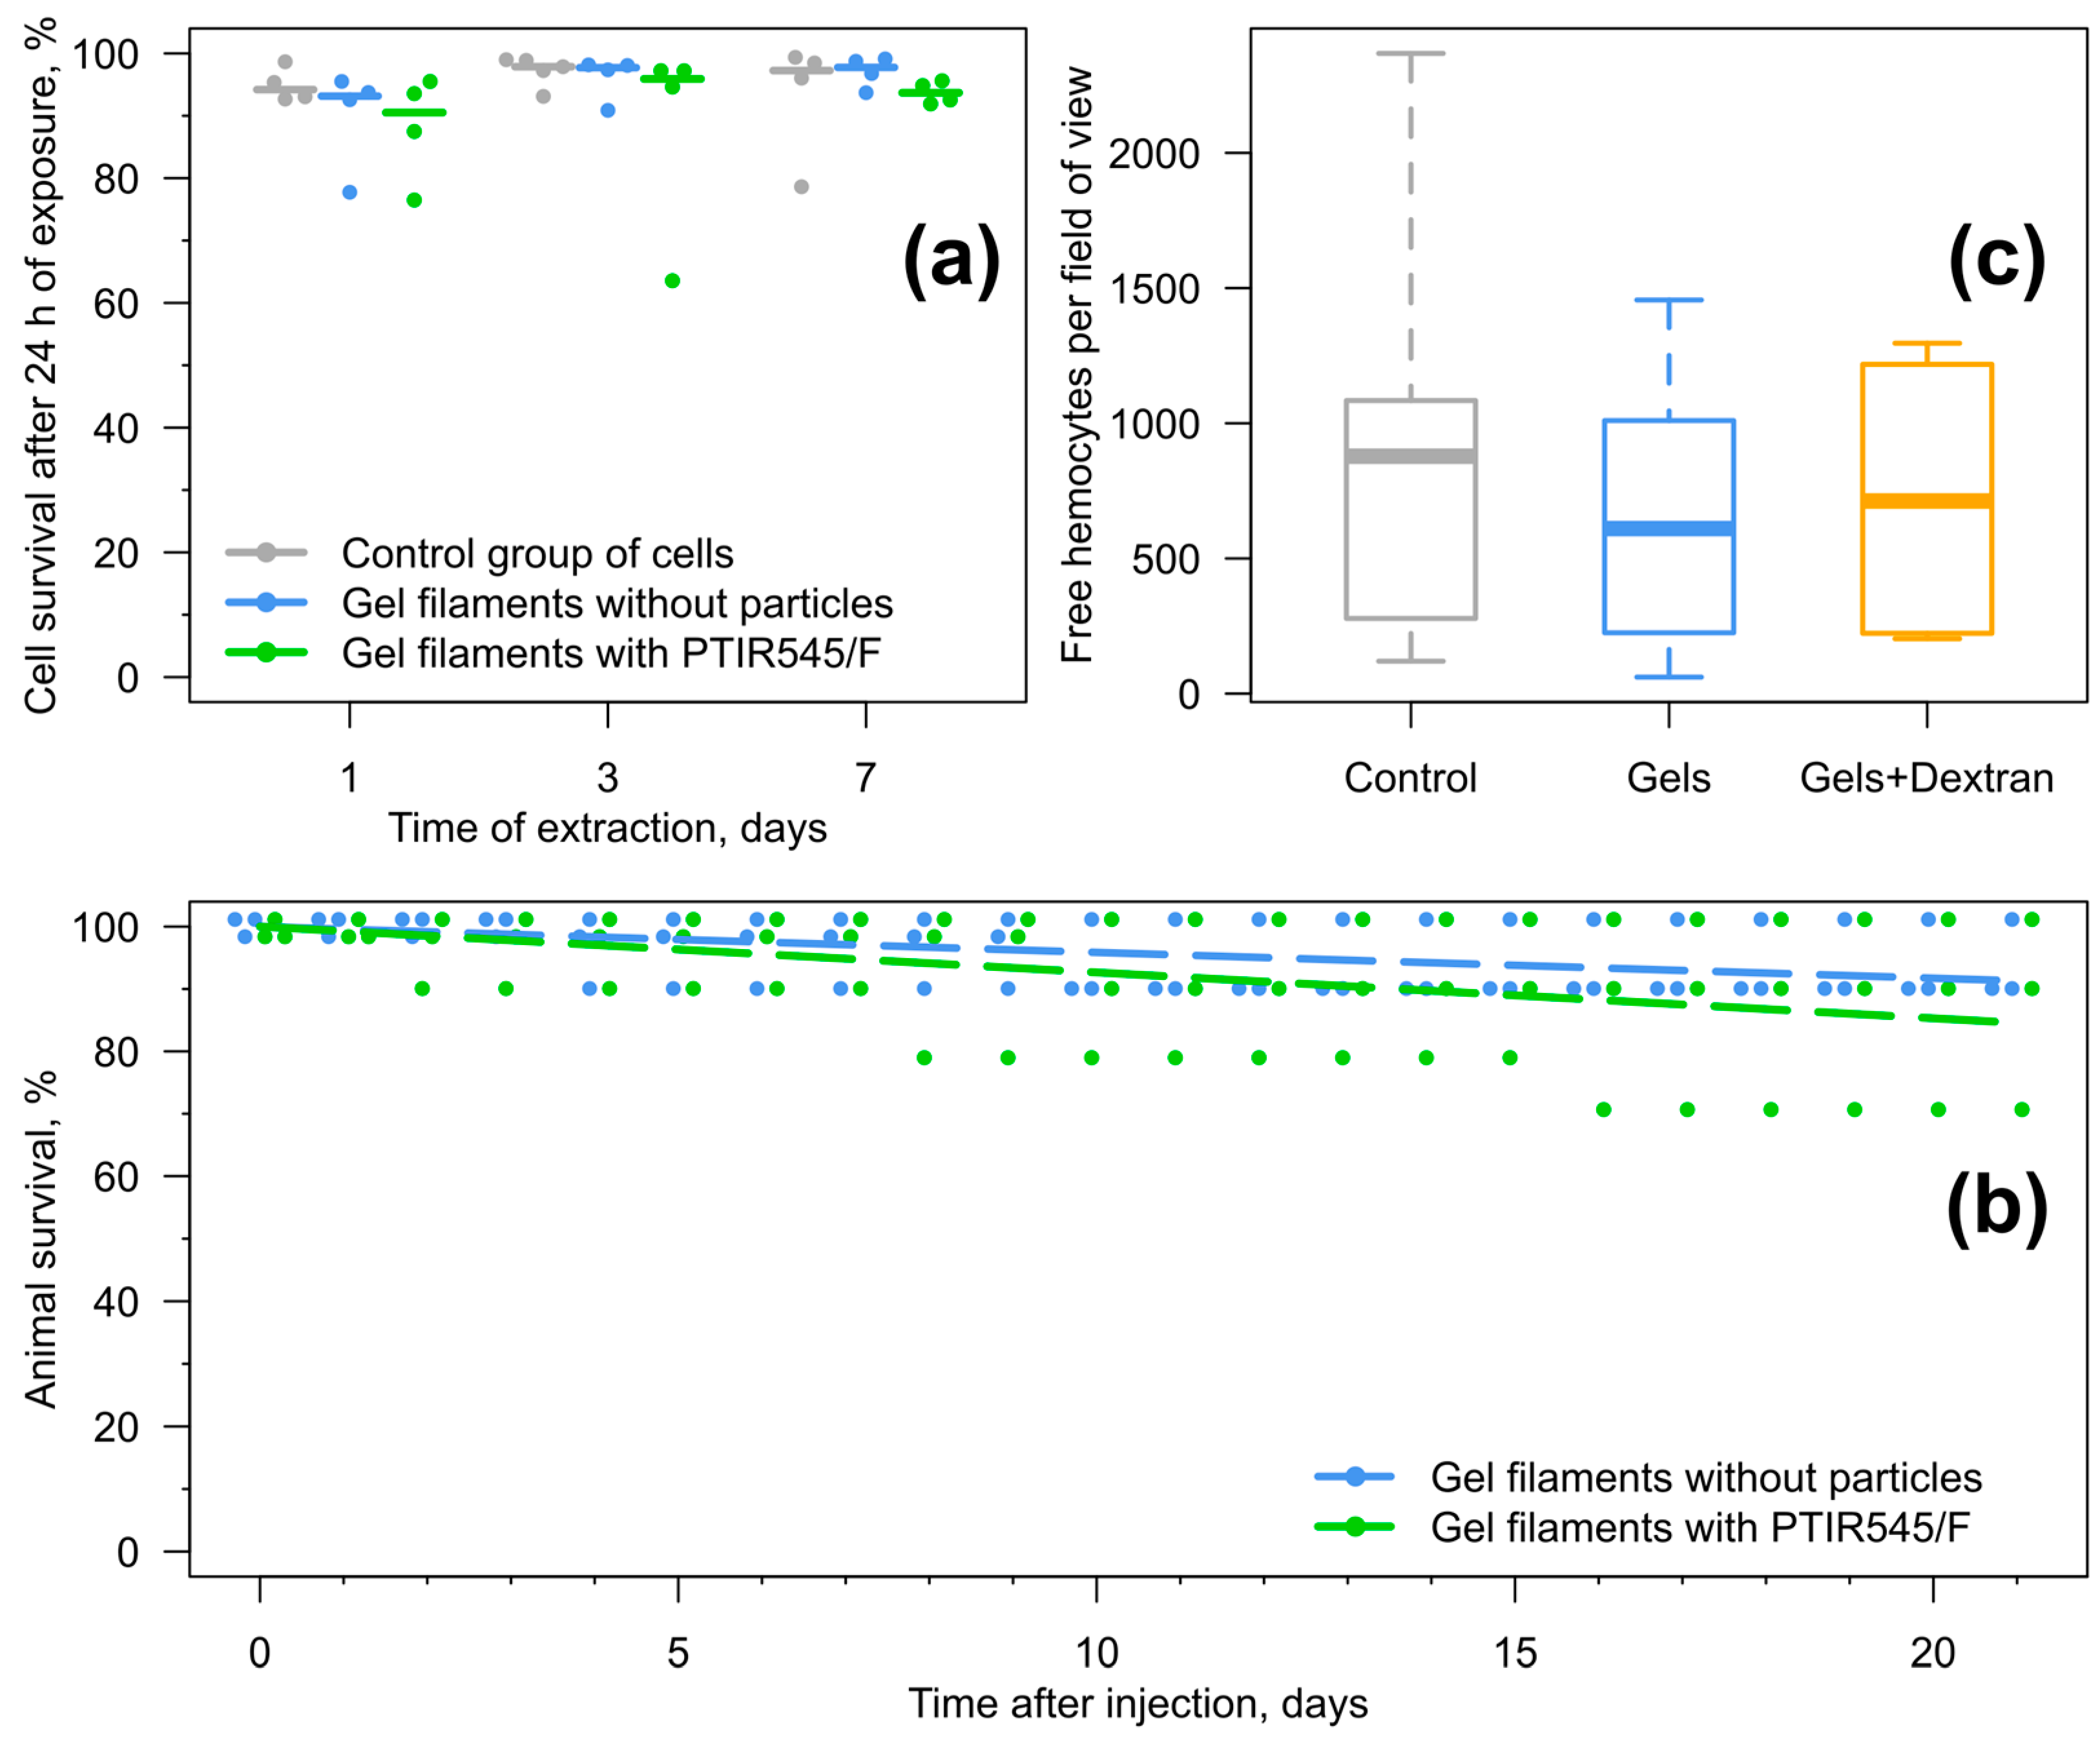
3.2. Testing Influence of the Sensor Components on Amphipods

For the sake of simplicity of the sensor preparation protocol, in this study we used upconverting microparticles PTIR545/F as received from the manufacturer without further modifications. Despite research on vertebrates and mammalian cell cultures showing generally low toxicity of upconverting particles, there are concerns about the influence of lanthanide ions, which potentially may leave the particles if they are not covered with an additional shell [35,36]. Since the effects of upconverting particles in invertebrates are practically unstudied, here we started from testing the reactions of amphipods E. verrucosus to the sensor components.
First, we checked the cytotoxicity of extracts from the hydrogels containing PTIR545/F (Figure 3a). The hydrogels were incubated in the culture medium for several days, removed, and the mortality of amphipod hemocytes was measured after 24 h of contact with the medium. We found no statistically significant changes in cell survival between the experimental groups after up to seven days of extraction.
Second, we verified the potential effects of the hydrogels containing PTIR545/F on animal mortality (Figure 3b). Survival of amphipods with injected hydrogels with and without PTIR545/F was very similar over a period of three weeks.
Finally, SNARF-1 was immobilized within the prepared sensors via conjugation to dextran, a bacteria-derived substance that may intensify the immune response to the hydrogels [37,38]. Thus, we also compared the immune reaction of amphipod hemocytes to hydrogels with and without dextran (Figure 3c). We observed no statistically significant tendency of the amphipod immune cells to concentrate around any hydrogels or degranulate in comparison to the control group during the 6 h exposure.
Summarizing, although concentrations of PTIR545/F and dextran were several times lower than in the case of the final version of the sensors, we found no signs of substantial risks for application of the prepared sensors inside the amphipods E. verrucosus.

3.3. Tissue pH Monitoring under Temperature Increase

In order to test the applicability of the prepared pH sensors for in vivo studies, we injected them into dorsal muscles of E. verrucosus (Figure 4a). The sensors have visible green luminescence with a slight yellow tinge similar to the bioluminescence of fireflies. The luminescence spectra were easily detectable from under the amphipod exoskeleton using the prepared optical setup (Figure 1a). After injections of hydrogels with PTIR545/F but without SNARF-1, no autofluorescence of amphipod tissues was detected in the acquired spectra, which was an issue with external fluorescence excitation of SNARF-1 [15].
One hour after the injection, the sensors indicated a median pH of muscle interstitial fluid of 8.35, while later, at control conditions the value stabilized at around 8.8–8.9 for the next three days (Figure 4c). The more acidic pH immediately after implantation into muscles is similar to what we observed in fish [39] and may be related to cell opening during the injection as cytosol and some cell compartments have lower pH. Since median hemolymph pH of E. verrucosus was previously found to be about 8.2 [15,40], we also cannot exclude the opposite possibility of compensatory muscle alkalization after the tissue injury. However, median pH remained at the level of 8.8–8.9 for about 48 h, which suggests these values to be the most probable normal pH for the interstitial fluid of E. verrucosus muscles.
These animals are cold loving, with adult individuals avoiding temperatures over 12 °C by migration [40]. With this context in mind, we modeled the calm shoreline of Lake Baikal during a sunny summer with a slow temperature increase from 6 °C in 5 °C steps each day (Figure 4b), which is close to an environmentally realistic scenario [41]. At 11 °C, median muscle pH statistically significantly increased to 9.05 (Figure 4c). With a further temperature rise, median tissue pH decreased in the experimental group, and at 21 °C it was 8.3 (Figure 4c). At 26 °C, we observed high mortality and stopped the main experiment; however, in six living individuals, median pH decreased further down to 8.1 at this temperature. Tissue acidification is a known marker for switching to an anaerobic metabolism under stressful conditions leading to the accumulation of organic acids instead of full glucose oxidation to carbon dioxide [42]. Overall, the results clearly indicate substantial sublethal metabolic disturbance for E. verrucosus already at 21 °C.
Thus, the developed techniques allowed us to easily monitor pH changes in medium-sized crustaceans with a highly translucent exoskeleton. Sensor excitation by IR instead of visible illumination decreased the animal’s intention to escape during signal acquisition and their respective locomotor activity, which also could influence extracellular pH via partial tissue switch to anaerobic metabolism. The observed alkalization of tissue pH at 11 °C is probably a preventive physiological reaction to compensate for the upcoming acidification at increasing temperature and deserves further research.

3.4. Long-Term Immune Response to the Injected Sensors

In order to investigate the long-term immune response of E. verrucosus to the implanted sensors, we further kept the control group of amphipods at acclimation conditions and fixed them seven days after the injection. We closely checked these individuals visually and observed no damage to the exoskeleton by the IR laser near the injected sensors.
As an indicator of global immune reaction, we measured the total activity of hemolymph phenoloxidase, which plays a critical role in the melanization of foreign bodies, i.e., covering them with a dark polymer melanin of irregular chemical structure. The obtained results do not show a statistically significant increase in the enzyme activity (Figure 5), which indicates no substantial changes in the amphipod immune status.
On the contrary, histologic analysis showed clear local immune reaction around implanted hydrogels seven days post injection (Figure 6). Each sensor (n = 15) was fully covered with a capsule of immune cells, which probably prevents quick reactions to tissue pH changes. Hemocytes appeared either as one layer around the hydrogel or as several layers of cells (Figure 6b,c). Before staining, we also observed a dark brown color of the capsules, indicating melanization around the sensors.

4. Conclusions

In this study, we developed protocols for the simple preparation and application of injectable optical sensors to pH with infrared excitation and visible luminescence. Besides decreasing animal anxiety during the optical signal acquisition, which may influence the tissue pH, the sensor design allowed us to avoid the necessity to correct the signal for autofluorescence of animal tissues. The sensors to pH, a fundamental physiological parameter, allowed us to monitor the reactions of a cold-loving endemic amphipod from ancient and pristine Lake Baikal under temperature increases. The animal demonstrated not only an expected pH decrease under elevated temperatures, but also tissue pH increase when the temperature only started to rise, which is probably a preventive compensatory reaction. We found no risks of the sensor application in the short term, while later, the amphipod developed a local immune reaction to the sensor. Despite the fact that long-term application would require a more biocompatible hydrogel carrier, the proposed sensor can already be used for several days after the implantation. It is also important to mention that here we used an animal object with a highly translucent exoskeleton, and choosing another crustacean with a less translucent exoskeleton, especially a species with variable spectra of tissue transmittance, would require some additional protocols for correction of the ratiometric sensor readout to the tissue transmittance spectra.

Author Contributions

Conceptualization, A.G. and M.T.; methodology, A.N., Y.R., E.S., A.M., A.D. and N.B.; software, A.G. and A.S.; validation, A.N., E.S., Y.R., A.D. and A.G.; formal analysis, A.N., P.K. and A.G.; investigation, Y.R., E.S., N.B. and A.M.; resources, M.T.; data curation, A.N., A.G. and E.S.; writing—original draft preparation, A.N., A.G. and E.S.; writing—review and editing, Y.R., A.M., A.S., P.K. and M.T.; visualization, A.N., A.G. and E.S.; supervision, A.G. and M.T.; project administration, M.T.; funding acquisition, M.T. All authors have read and agreed to the published version of the manuscript.

Funding

This research was funded by the Russian Science Foundation. Initial stages of the study were supported by project #20-64-46003, while project #20-64-47011 (interdisciplinary project performed in association with Petrozavodsk State University, Petrozavodsk, Russia; link to information about the project: https://rscf.ru/en/project/20-64-47011/, accessed on 15 June 2023) funded the completion of the research, including full analysis of long-term immune response to the hydrogel implants with dextran.

Institutional Review Board Statement

All experimental procedures were conducted in accordance with the EU Directive 2010/63/EU for animal experiments and the Declaration of Helsinki; the protocol of the study was registered and approved before the start of the experiments by the Animal Subjects Research Committee of the Institute of Biology at Irkutsk State University (Protocol #2022/10).

Informed Consent Statement

Not applicable.

Data Availability Statement

All obtained data are available within the manuscript.

Acknowledgments

The authors acknowledge the help of Polina Drozdova and Ekaterina Borvinskaya in proofreading the manuscript.

Conflicts of Interest

The authors declare no conflict of interest. The funder had no role in the design of the study; in the collection, analyses, or interpretation of data; in the writing of the manuscript; or in the decision to publish the results.

References

  1. Rong, G.; Tuttle, E.E.; Neal Reilly, A.; Clark, H.A. Recent developments in nanosensors for imaging applications in biological systems. Annu. Rev. Anal. Chem. 2019, 12, 109–128. [Google Scholar] [CrossRef] [PubMed]
  2. Lee, M.A.; Wang, S.; Jin, X.; Bakh, N.A.; Nguyen, F.T.; Dong, J.; Silmore, K.S.; Gong, X.; Pham, C.; Jones, K.K.; et al. Implantable Nanosensors for Human Steroid Hormone Sensing In Vivo Using a Self-Templating Corona Phase Molecular Recognition. Adv. Healthc. Mater. 2020, 9, 2000429. [Google Scholar] [CrossRef] [PubMed]
  3. Kaefer, K.; Krüger, K.; Schlapp, F.; Uzun, H.; Celiksoy, S.; Flietel, B.; Heimann, A.; Schroeder, T.; Kempski, O.; Sonnichsen, C.; et al. Implantable sensors based on gold nanoparticles for continuous long-term concentration monitoring in the body. Nano Lett. 2021, 21, 3325–3330. [Google Scholar] [CrossRef]
  4. Bian, S.; Zhu, B.; Rong, G.; Sawan, M. Towards wearable and implantable continuous drug monitoring: A review. J. Pharm. Anal. 2021, 11, 1–14. [Google Scholar] [CrossRef]
  5. Zhang, D.; Chen, Q.; Shi, C.; Chen, M.; Ma, K.; Wan, J.; Liu, R. Dealing with the foreign-body response to implanted biomaterials: Strategies and applications of new materials. Adv. Funct. Mater. 2021, 31, 2007226. [Google Scholar] [CrossRef]
  6. Yuk, H.; Wu, J.; Zhao, X. Hydrogel interfaces for merging humans and machines. Nat. Rev. Mater. 2022, 7, 935–952. [Google Scholar] [CrossRef]
  7. Kanick, S.C.; Schneider, P.A.; Klitzman, B.; Wisniewski, N.A.; Rebrin, K. Continuous monitoring of interstitial tissue oxygen using subcutaneous oxygen microsensors: In vivo characterization in healthy volunteers. Microvasc. Res. 2019, 124, 6–18. [Google Scholar] [CrossRef] [PubMed]
  8. Lee, M.A.; Jin, X.; Muthupalani, S.; Bakh, N.A.; Gong, X.; Strano, M.S. In-Vivo fluorescent nanosensor implants based on hydrogel-encapsulation: Investigating the inflammation and the foreign-body response. J. Nanobiotechnol. 2023, 21, 133. [Google Scholar] [CrossRef]
  9. Balaconis, M.K.; Luo, Y.; Clark, H.A. Glucose-sensitive nanofiber scaffolds with an improved sensing design for physiological conditions. Analyst 2015, 140, 716–723. [Google Scholar] [CrossRef] [Green Version]
  10. Rong, G.; Corrie, S.R.; Clark, H.A. In vivo biosensing: Progress and perspectives. ACS Sens. 2017, 2, 327–338. [Google Scholar] [CrossRef] [Green Version]
  11. Lee, M.A.; Nguyen, F.T.; Scott, K.; Chan, N.Y.; Bakh, N.A.; Jones, K.K.; Pham, C.; Garcia-Salinas, P.; Garcia-Parraga, D.; Fahlman, A.; et al. Implanted nanosensors in marine organisms for physiological biologging: Design, feasibility, and species variability. ACS Sens. 2018, 4, 32–43. [Google Scholar] [CrossRef] [PubMed]
  12. Rzhechitskiy, Y.; Gurkov, A.; Bolbat, N.; Shchapova, E.; Nazarova, A.; Timofeyev, M.; Borvinskaya, E. Adipose Fin as a Natural “Optical Window” for Implantation of Fluorescent Sensors into Salmonid Fish. Animals 2022, 12, 3042. [Google Scholar] [CrossRef]
  13. Herring, P.J.; Gaten, E.; Shelton, P.M. Are vent shrimps blinded by science? Nature 1999, 398, 116. [Google Scholar] [CrossRef] [Green Version]
  14. Feldmann, T.; Yakovleva, M.; Lindström, M.; Donner, K.; Ostrovsky, M. Eye adaptation to different light environments in two populations of Mysis relicta: A comparative study of carotenoids and retinoids. J. Crust. Biol. 2010, 30, 636–642. [Google Scholar] [CrossRef] [Green Version]
  15. Gurkov, A.; Shchapova, E.; Bedulina, D.; Baduev, B.; Borvinskaya, E.; Meglinski, I.; Timofeyev, M. Remote in vivo stress assessment of aquatic animals with microencapsulated biomarkers for environmental monitoring. Sci. Rep. 2016, 6, 36427. [Google Scholar] [CrossRef] [PubMed] [Green Version]
  16. Tao, J.X.; Zhou, W.C.; Zhu, X.G. Mitochondria as potential targets and initiators of the blue light hazard to the retina. Oxidative Med. Cell. Longev. 2019, 2019, 6435364. [Google Scholar] [CrossRef] [Green Version]
  17. Achatz, D.E.; Meier, R.J.; Fischer, L.H.; Wolfbeis, O.S. Luminescent sensing of oxygen using a quenchable probe and upconverting nanoparticles. Angew. Chem. Int. Ed. 2011, 50, 260–263. [Google Scholar] [CrossRef]
  18. Arppe, R.; Näreoja, T.; Nylund, S.; Mattsson, L.; Koho, S.; Rosenholm, J.M.; Soukka, T.; Schäferling, M. Photon upconversion sensitized nanoprobes for sensing and imaging of pH. Nanoscale 2014, 6, 6837–6843. [Google Scholar] [CrossRef]
  19. Tajon, C.A.; Yang, H.; Tian, B.; Tian, Y.; Ercius, P.; Schuck, P.J.; Chan, E.M.; Cohen, B.E. Photostable and efficient upconverting nanocrystal-based chemical sensors. Opt. Mater. 2018, 84, 345–353. [Google Scholar] [CrossRef]
  20. Mahata, M.K.; De, R.; Lee, K.T. Near-infrared-triggered upconverting nanoparticles for biomedicine applications. Biomedicines 2021, 9, 756. [Google Scholar] [CrossRef]
  21. Rabet, N. Crustaceans. In Handbook of Marine Model Organisms in Experimental Biology, 1st ed.; Agnes, B., Bernd, S., Eds.; CRC Press: Boca Raton, MA, USA, 2021; pp. 271–287. [Google Scholar]
  22. Odeyemi, O.A.; Dabade, D.S.; Amin, M.; Dewi, F.; Waiho, K.; Kasan, N.A. Microbial diversity and ecology of crustaceans: Influencing factors and future perspectives. Curr. Opin. Food Sci. 2021, 39, 140–143. [Google Scholar] [CrossRef]
  23. Väinölä, R.; Witt, J.D.S.; Grabowski, M.; Bradbury, J.H.; Jazdzewski, K.; Sket, B. Global diversity of amphipods (Amphipoda; Crustacea) in freshwater. Hydrobiologia 2008, 595, 241–255. [Google Scholar] [CrossRef]
  24. Brown, K.P.; Gerber, A.; Bedulina, D.; Timofeyev, M.A. Human impact and ecosystemic health at Lake Baikal. Wiley Interdiscip. Rev. Water. 2021, 8, e1528. [Google Scholar] [CrossRef]
  25. Takhteev, V.V.; Berezina, N.A.; Sidorov, D.A. Checklist of the amphipoda (Crustacea) from continental waters of Russia, with data on alien species. Arthropoda Sel. 2015, 24, 335–370. [Google Scholar] [CrossRef] [Green Version]
  26. Karnaukhov, D.Y.; Dolinskaya, E.M.; Biritskaya, S.A.; Teplykh, M.A.; Ermolaeva, Y.K.; Pushnica, V.A.; Kuznetsova, I.V.; Okholina, A.I.; Bukhaeva, L.B.; Rusanovskaya, O.O.; et al. New data regarding ecology of freshwater pelagicamphipod Macrohectopus branickii (Dybowsky, 1874) (Amphipoda: Macrohectopodidae) and other crustaceans of plankton from the southern part of Lake Baikal (Russia, Southern Siberia). Acta Biol. Sib. 2021, 7, 39–48. [Google Scholar]
  27. Drozdova, P.; Saranchina, A.; Madyarova, E.; Gurkov, A.; Timofeyev, M. Experimental Crossing Confirms Reproductive Isolation between Cryptic Species within Eulimnogammarus verrucosus (Crustacea: Amphipoda) from Lake Baikal. Int. J. Mol. Sci. 2022, 23, 10858. [Google Scholar] [CrossRef] [PubMed]
  28. Borvinskaya, E.; Gurkov, A.; Shchapova, E.; Karnaukhov, D.; Sadovoy, A.; Meglinski, I.; Timofeyev, M. Simple and effective administration and visualization of microparticles in the circulatory system of small fishes using kidney injection. J. Vis. Exp. 2018, 136, e57491. [Google Scholar]
  29. Gurkov, A.; Borvinskaya, E.; Shchapova, E.; Timofeyev, M. Restraining small decapods and amphipods for in vivo laboratory studies. Crustacean 2018, 91, 517–525. [Google Scholar] [CrossRef]
  30. Shchapova, E.; Nazarova, A.; Gurkov, A.; Borvinskaya, E.; Rzhechitskiy, Y.; Dmitriev, I.; Meglinski, I.; Timofeyev, M. Application of PEG-covered non-biodegradable polyelectrolyte microcapsules in the crustacean circulatory system on the example of the amphipod Eulimnogammarus verrucosus. Polymers 2019, 11, 1246. [Google Scholar] [CrossRef] [Green Version]
  31. The R Project for Statistical Computing. Available online: https://www.R-project.org/ (accessed on 15 May 2023).
  32. Zhou, L.; He, B.; Huang, J.; Cheng, Z.; Xu, X.; Wei, C. Multihydroxy dendritic upconversion nanoparticles with enhanced water dispersibility and surface functionality for bioimaging. ACS Appl. Mater. Interfaces 2014, 6, 7719–7727. [Google Scholar] [CrossRef]
  33. Whitaker, J.E.; Haugland, R.P.; Prendergast, F.G. Spectral and photophysical studies of benzo[c]xanthene dyes: Dual emission pH sensors. Anal. Biochem. 1991, 194, 330–344. [Google Scholar] [CrossRef]
  34. Volkova, E.K.; Yanina, I.Y.; Popov, A.P.; Bykov, A.V.; Gurkov, A.N.; Borvinskaya, E.V.; Timofeyev, M.A.; Meglinski, I.V. Ecophotonics: Assessment of temperature gradient in aquatic organisms using up-conversion luminescent particles. Quantum Electrodyn. 2017, 47, 153. [Google Scholar] [CrossRef]
  35. Wang, K.; Ma, J.; He, M.; Gao, G.; Xu, H.; Sang, J.; Wang, Y.; Zhao, B.; Cui, D. Toxicity assessments of near-infrared upconversion luminescent LaF3: Yb, Er in early development of zebrafish embryos. Theranostics 2013, 3, 258. [Google Scholar] [CrossRef] [PubMed] [Green Version]
  36. Gnach, A.; Lipinski, T.; Bednarkiewicz, A.; Rybka, J.; Capobianco, J.A. Upconverting nanoparticles: Assessing the toxicity. Chem. Soc. Rev. 2015, 44, 1561–1584. [Google Scholar] [CrossRef]
  37. Bamberger, D.; Hobernik, D.; Konhäuser, M.; Bros, M.; Wich, P.R. Surface modification of polysaccharide-based nanoparticles with PEG and dextran and the effects on immune cell binding and stimulatory characteristics. Mol. Pharm. 2017, 14, 4403–4416. [Google Scholar] [CrossRef]
  38. Díaz-Montes, E. Dextran: Sources, structures, and properties. Polysaccharides 2021, 2, 554–565. [Google Scholar] [CrossRef]
  39. Borvinskaya, E.; Gurkov, A.; Shchapova, E.; Baduev, B.; Shatilina, Z.; Sadovoy, A.; Meglinski, I.; Timofeyev, M. Parallel in vivo monitoring of pH in gill capillaries and uscles of fishes using microencapsulated biomarkers. Biol. Open 2017, 6, 673–677. [Google Scholar] [CrossRef] [Green Version]
  40. Jakob, L.; Axenov-Gribanov, D.V.; Gurkov, A.N.; Ginzburg, M.; Bedulina, D.S.; Timofeyev, M.A.; Luckenbach, T.; Lucassen, M.; Sartoris, F.J.; Pörtner, H.O. Lake Baikal amphipods under climate change: Thermal constraints and ecological consequences. Ecosphere 2016, 7, e01308. [Google Scholar] [CrossRef] [Green Version]
  41. Lipaeva, P.; Vereshchagina, K.; Drozdova, P.; Jakob, L.; Kondrateva, E.; Lucassen, M.; Bedulina, D.; Timofeyev, M.; Stadler, P.; Luckenbach, T. Different ways to play it cool: Transcriptomic analysis sheds light on different activity patterns of three amphipod species under long-term cold exposure. Mol. Ecol. 2021, 30, 5735–5751. [Google Scholar] [CrossRef]
  42. Sokolova, I.M.; Frederich, M.; Bagwe, R.; Lannig, G.; Sukhotin, A.A. Energy homeostasis as an integrative tool for assessing limits of environmental stress tolerance in aquatic invertebrates. Mar. Environ. Res. 2012, 79, 1–15. [Google Scholar] [CrossRef]
Figure 1. Main features of the optical setup used for visualizing the prepared sensors combining upconverting particles and pH-sensitive fluorescent probe SNARF-1. (a) General optical scheme of the setup. Note that the depicted colors of the long-pass filter LP570 and short-pass filter SP640 are indicative and do not reflect their optical properties. (b) Transmission spectra of the filters LP570 and SP640 (solid lines) overlaying luminescence spectrum of upconverting particles PTIR545/F (dashed line). (c) Example photos of the prepared sensors in the form of hydrogel filaments with a thickness of about 400 µm. Here, an additional scatterer was added in front of the laser in order to achieve more diffuse IR illumination. Note that the camera exposure settings were drastically different for two images with and without filters LP570 and SP640.
Photonics 10 00697 g001
Figure 2. Calibration of the prepared pH-sensors with the built optical setup. (a) Luminescence spectra of the sensors at the same pH of about 7.6. Different colors indicate individual spectra. All spectra are aligned at the peak of 571 nm corresponding to green luminescence of upconverting particles PTIR545/F. Note the slope variability in the range 590–625 nm corresponding to fluorescence of SNARF-1. (b) Dependence of the ratio I595/I620 (indicate local ratio between protonated and deprotonated SNARF-1) on the ratio I595/I571 (indicate local ratio of SNARF-1 and PTIR545/F within the sensor) at the same pH. Each dot represents individual spectrum. (c) Calibration lines for the sensors to pH at two temperatures. The sensor coefficient (SC) denotes the expression SC = I595/I620 + 0.581 × I595/I571. Each dot represents the median SC value obtained from at least 10 individual spectra at 21 °C and at least 6 spectra at 9 °C. (d) Dependence of the sensor coefficient on temperature at the same pH of about 7.8. Each dot represents the median SC value obtained from at least 5 individual spectra.
Photonics 10 00697 g002
Figure 3. Influence of the sensor components on E. verrucosus. (a) Comparison of cytotoxicity of extracts from polyacrylamide hydrogel filaments and the filaments with upconverting particles PTIR545/F on amphipod hemocytes. (b) Comparison of animal survival after injection of polyacrylamide hydrogel filaments and the filaments with PTIR545/F. (c) Analysis of immune reaction of amphipod hemocytes to polyacrylamide hydrogel filaments and the filaments containing dextran after 6 h of contact (n = 10–12).
Photonics 10 00697 g003
Figure 4. pH monitoring in amphipod muscles under environmentally realistic temperature increase using the prepared sensors. (a) Photo of amphipod E. verrucosus with green firefly-like luminescence of the injected sensor. Here the sensor is illuminated externally only with an IR laser. (b) General scheme of the experiment. (c) Results of repeated pH measurements in amphipod muscles under temperature increase in comparison to the control group. * indicates statistically significant difference from the parallel control group with p < 0.05; *** indicates statistically significant difference from the parallel control group with p < 0.001.
Photonics 10 00697 g004
Figure 5. Phenoloxidase activity in the hemolymph of E. verrucosus without any injections and seven days after the injection of the pH sensors (n = 11 and 14 respectively). No statistically significant difference found with p < 0.05.
Photonics 10 00697 g005
Figure 6. Histological analysis of the 5th mesosome segment of E. verrucosus 7 days post injection of the pH sensors. All dorsal sections are semi-thin (6 µm) slices upon H&E staining (n = 15). (a) Overview of the 5th segment. Black arrows indicate healthy dorsal muscles; the red arrow shows the area of damaged amphipod muscle after the injection; the blue arrow indicates the injected sensor. (b) Several layers of hemocytes (i.e., amphipod immune cells; black arrow) encapsulating the polyacrylamide hydrogel containing SNARF-1-dextran and upconverting particles PTIR545/F (white arrow). (c) Hemocytes within the formed capsule (black arrow) and attached to the capsule (white arrow) encircling the hydrogel (white asterisk).
Photonics 10 00697 g006
Disclaimer/Publisher’s Note: The statements, opinions and data contained in all publications are solely those of the individual author(s) and contributor(s) and not of MDPI and/or the editor(s). MDPI and/or the editor(s) disclaim responsibility for any injury to people or property resulting from any ideas, methods, instructions or products referred to in the content.

