Time Coding-Based Single-Photon-Counting Lidar for Obtaining Spatial Location


1
Changchun Institute of Optics, Fine Mechanics and Physics, Chinese Academy of Sciences, Changchun 130033, China
2
University of Chinese Academy of Sciences, Beijing 100049, China
3
Jilin Provincial Key Laboratory of Intelligent Wavefront Sensing and Control, Changchun 130033, China
4
Key Laboratory of Space Object and Debris Observation, Chinese Academy of Sciences, Nanjing 210000, China
*
Authors to whom correspondence should be addressed.
Photonics 2023, 10(4), 457; https://doi.org/10.3390/photonics10040457
Submission received: 17 March 2023
/
Revised: 12 April 2023
/
Accepted: 12 April 2023
/
Published: 15 April 2023
(This article belongs to the Special Issue Advanced Photonic Sensing and Measurement)
Abstract
:This paper proposes a single-photon-counting lidar based on time coding that can obtain the target’s spatial location and measure the distance and azimuth angle in real time without needing a scanning device. Multiple optical fibers were used to introduce laser echo photons into a single-pixel single-photon detector. According to the deviation in the detection time of the echo photons passing through different optical fibers, multiple distances can be obtained simultaneously. Combining the measured distances with the fiber spacing allows the calculation of the distance, azimuth angle, and spatial coordinates of the target. This lidar has the advantages of high photon detection efficiency, short signal acquisition time, and low cost compared to array detectors.
1. Introduction
In recent years, lidar has shown great application potential in various fields such as remote sensing [1,2,3,4], non-line-of-sight imaging [5,6], single-pixel imaging [7,8,9], wind speed measurement [10], pose estimation [11], and target tracking [12]. Lidar detectors mainly include charge-coupled devices (CCD), avalanche photodiodes (APD), and single-photon avalanche diodes (SPAD). CCD- and APD-related technologies are relatively mature; however, their photon detection sensitivity are relatively low. Owing to the large loss of the laser during the transmission process, the echo signal light is weak when the target is faint; therefore, the requirements for the single pulse energy of the laser and the aperture of the telescope are extremely high. SPAD has the ability for single-photon detection, high sensitivity, and can detect weak echo signals. By combining the two technologies of single-photon detection and time-correlated single-photon counting (TCSPC), laser energy consumption and telescope aperture size can be significantly reduced when detecting faint targets [13,14,15,16,17,18,19,20]. Employing point-by-point scanning [21], Buller et al. used a single-pixel SPAD to successfully detect nylon and terrain at the distance of approximately 6.8 and 10.5 km, respectively [22]. Using lidar with single-pixel SPAD as the detector and sub-pixel scanning, Feihu Xu et al. successfully performed 3D imaging detection on a mannequin model [21] and a Shanghai building [23] at the distance of 8.2 km and 45 km, respectively. Feihu Xu et al. finally detected a mountain at the distance of 200 km in 2021, breaking the world record [24]. Currently, the majority of photon-counting lidar systems employ a point-by-point scanning mode, and only one distance can be obtained in a single scan.
Lidar systems utilizing SPAD array detectors have been rapidly developed to avoid excessive scanning times and increase the speed of signal photon acquisition. Each pixel of the SPAD array detector is integrated with a time-to-digital converter (TDC) that can simultaneously obtain multiple distance information. A spaceborne lidar surface topography (LIST) scheme for global mapping aims to split 10 laser beams into 1000 beams and emit them to the target. The echo signal photons are received by the SPAD array detector containing 1000 pixels to achieve rapid signal acquisition [25]. MIT Lincoln Laboratory used a 32 × 32 SPAD array as the detector of the lidar system, which was built on a UH-1 helicopter to detect hidden targets in the wood [26]. Guang Wu et al. used a diffractive optical element to split the 532 nm sub-nanosecond pulsed laser into a line array containing 100 beams. The echo signal photons of each laser beam were introduced into a 100-pixel SPAD array detector through an optical fiber array containing 100 multimode fibers, and the building in Shanghai was successfully detected [1]. The ICESat-2 carries a single-photon lidar called the Advanced Topographic Laser Altimeter System (ATLAS). Its main purpose is to map the earth, and its main function is to measure altitude. A beam of light from the laser is divided into six beams by a diffraction active optical element. The telescope focuses the returning light on the focal plane, where the corresponding echo beams are coupled into six fibers. Additionally, the detector uses an array detector [27]. In general, SPAD is widely used as a detector for single photon detection. Using a SPAD array detector allows you to avoid the scanning process; however, due to the limitations of the current technology, SPAD array detectors are expensive, difficult to integrate, and have multiple hot pixels.
To eliminate the shortcomings of long-time scanning and poor real-time performance of lidar using single-pixel SPAD as the detector, as well as the high price and multiple hot pixels of SPAD array detectors, we considered another dimension (time dimension) to encode the information in the temporal domain [28]. Furthermore, time coding will label and distinguish different information to obtain multiple distances simultaneously, with only one SPAD detector. Subsequently, combined with the prior fiber arrangement position, the parameter information regarding the target position is obtained by calculation.
This study presents a new photon-counting lidar system. The system introduces laser echo photons using multiple optical fibers into a single-pixel SPAD detector, obtains multiple distances based on the inconsistency of the detection time distribution of echo photons passing through each optical fiber, and then combines the measured distances through different optical fibers. The distance information was combined with the spacing between the fibers to calculate the target’s distance and azimuth angle and obtain the target’s exact position. Compared to other lidars using a single laser beam and single-pixel detectors, the laser echo photons will cause losses when passing through optical fibers. However, this system has several notable advantages. First, data acquisition can be performed using a single-photon detector with a high photon efficiency when the laser echo signal is extremely weak, allowing for laser ranging, angle measurement, and tracking faint targets. Second, the lidar system does not require scanning. According to the time distribution characteristics of photons echoed through different fibers, the system can simultaneously collect and identify multiple distances, significantly reducing the acquisition time. Third, the system requires only single-pixel detectors, which reduces the number of SPADs, avoids high integration costs, and lowers costs. Finally, the target’s spatial location can be locked through a calculation using the fiber spacing and the measured distances using TCSPC technology, which provides a new idea for faint target tracking. This system paves the way for lidars with high photon detection efficiency, low energy consumption, low acquisition time, and low cost for tracking faint targets.
The remainder of this paper is organized as follows. Section 2 introduces the point target lidar equation and the single-photon detection model. The calculation of the target distance, azimuth angle, and spatial position of the target is also discussed here. Section 3 describes the experimental device and its composition. In Section 4, experiments were used to determine the target’s spatial position and measure the lidar’s performance index, demonstrating the viability of the suggested approach. Finally, Section 4 gives the conclusion of the study.
2. Principles
2.1. Lidar Equation
For non-cooperative targets, diffuse reflection occurs after the emitted pulsed laser irradiates the target. The backscattered light is transmitted back to the photodetector through the atmosphere. Owing to the large loss of the laser energy, the signal light returned to the photodetector is at the photon level. Therefore, the TCSPC technique was used to detect the photon arrival time, and the target distance was calculated using the photon arrival time data.
Because of the laser divergence, the target object is equivalent to the point target. According to the lidar equation of point target detection, the photon counts detected by the photodetector is as follows [29]:
where represents one-way atmospheric transmittance; is the receiving optical efficiency of the lidar system; is the transmission optical efficiency of the lidar system; is the quantum efficiency of the detector; is the laser energy of a single pulse; is the laser wavelength; is the speed of light; is the Planck constant; is the target reflectivity; is the target reflection cross-sectional area; is the receiving area of the telescope; is the solid angle of laser emission; is the target distance; and is the laser emission angle.
2.2. Single-Photon Detection Model
The number of photons received by the detector in a pulse repetition period follows a Poisson distribution [32]:
where is the number of photons detected in a pulse repetition period; is the background photon flux, is the detector dark count rate, and is the pulse repetition period.
The number of noise photons in a pulse repetition period is
The probability that no photon is detected during a pulse repetition period is
Since the detector has a dead time, the single-photon detector detects at most one photon per pulse-repetition period. Therefore, the number m of photons detected by N laser pulses follows a binomial distribution:
Here, represents the arrival time of the first photon, and its probability distribution function is expressed as follows [33]:
where represents the photon flux waveform of the laser pulse emitted at time and represents the total distance from the laser to the target and back to the detector.
2.3. Target Space Coordinate Position, Distance and Azimuth Calculation
The purpose of the proposed single-photon-counting lidar is to obtain the spatial position of the target and provide this information for the target tracking. Figure 1a illustrates the target tracking simplified into a two-dimensional diagram. represents the laser divergence angle, and the yellow area is the laser irradiation region. represents the angle of view of the receiving subsystems, and the pink and blue areas are the regions that one receiving subsystem can detect. represents the target distance in the z-axis direction, as shown in Figure 1b, and represents the baseline distance of the receiving subsystems. For this system, only when , the field of view of the detector has an overlapping area. denotes the region of interest for the target to be detected. The common part of the laser irradiation region and the field of view of the receiving subsystems must be larger than . The Figure 1a shows a special case when the two are equal. In practical application, should be satisfied to ensure target detection. The main purpose of the system proposed in this paper is to detect long-distance faint targets, so the value of is required to be high. According to , a large is beneficial for remote detection. As shown in Figure 2, a large is also required for the best resolution. Therefore, a large is conducive to both remote detection and high resolution. The overlapping area is related to and . To obtain a larger overlapping area, can be increased. In engineering application, considering the requirements of , the overlapping area, and required resolution, and shall be reasonably determined.
When the target enters the region of interest, its spatial position can be calculated to provide information for target tracking. Like all lidars, it needs to be used together with other systems. The target situation can be known according to the prior information of other systems. When the targets are in dense formation flight, the targets can be regarded as one. The distances measured by different collecting ports are separated by the time coding method, and then the multiple range echoes measured by each collecting port are averaged. According to the averaged distances, the space position of the “one target” can be calculated. After obtaining the approximate center position coordinates of the targets, this information can be provided to other systems as a priori for further processing. When the targets’ spacing is large and the targets pass through the detection area one by one, the target position can be calculated separately. The detector needs a larger detection field of view to ensure that the overlapping area meets the needs of the detection target, resulting in large background noise. This problem can be solved by adding filters, changing the laser wavelength, etc.
As shown in Figure 1b, represents the target, and , , and are the spatial distribution positions of three optical fibers (simplified receiving subsystems), respectively. represents the distance between optical fibers and , and represents the distance between optical fibers and . represents the spatial location of another receiving subsystem. Points , , , and form a rectangle. Three receiving subsystems can collect all the data required to calculate the spatial position of the target. When there are more than three receiving subsystems, the additional receiving subsystems can be used as a supplement to expand the detection region. This article uses three receiving subsystems as an example. The , , and three-point connection constitutes a right triangle. The corresponding distances of the target measured by three optical fibers are , , and , respectively. The coordinate system is constructed by , , and the vector direction perpendicular to the plane , and the target coordinate is assumed to be . is perpendicular to the plane , and they intersect at point . is perpendicular to and intersects at point . Further, is perpendicular to and intersects at point .
In the triangle ,
In the triangle , ; thus,
In the triangle ,
In the triangle , ; thus,
In the triangle ,
In the triangle , ; thus,
Combining (11) and (13), (16) can be obtained:
Combining (11) and (14), (17) can be obtained:
Combining (11), (16), and (17), (18) can be obtained:
According to the transformation between Cartesian coordinates and spherical coordinate system,
Substituting (11) into (19), (20) can be obtained:
Substituting (16), (17) and (18) into (19), (21) and (22) can be obtained:
According to the coordinate system established in the study, represents the distance from the origin point to the target; represents the complementary angle of the angle between the line from the origin point to the target point and the positive z-axis; represents the angle between the projection of the line from the origin point to the target point on the plane XOY and the positive x-axis.
Therefore, the distance, azimuth angle, and spatial coordinate position of the target can be obtained.
2.4. Simulation of the Error of the Target Spatial Position Obtained by Calculation in Long Distance and Atmosphere
We ran a Monte Carlo simulation (100,000 samples) to simulate the error between the calculated target position and the actual position under the conditions of atmospheric disturbance and long distance. We added a distance error (selected based on [34]) to the distances measured through three receiving subsystems and combined these three distance values with the distances between the receiving subsystems to calculate the spatial coordinate position of the target. Compare the position coordinates with errors with the target spatial positions calculated under the no ranging error of three receiving subsystems and obtain the spatial coordinate error. Assuming that the target is approximately 200 km away, at present, the accuracy of single-photon ranging is better than 3 cm [34]. Since the target of the single-photon-counting lidar proposed in this study is in the atmosphere, the laser may transmit laterally in the atmosphere, which is more influenced, so the ranging error is assumed to be 6 cm. Figure 2 shows the relationship between the position error and the spacing of the receiving subsystems.
3. Experimental Setup
In this study, a new type of single-photon-counting lidar based on time coding is proposed that can detect the distance, azimuth angle, and spatial position of the target using only a single-pixel SPAD detector.
The schematic of the system is shown in Figure 3. The laser and detector are triggered synchronously through the Field Programmable Gate Array (FPGA) at a trigger frequency of 20 MHz. The laser wavelength is 637.5 nm, and the laser pulse width is 480 ps. The laser divergence angle is 0.007° and the diameter of the light spot size is about 1 cm in this experiment. The receiving subsystem is arranged according to a right triangle. The mutually perpendicular sides are 22 cm and 18 cm in length (the distances between the subsystems). In practical applications, it is necessary to balance the laser divergence angle and the receiving subsystem’s angle of view. We used 10% of the maximum power of the laser, which is adjustable up to 7.1 mw. A SPAD array detector with integrated TDC is used in the experiment to better explore the spatiotemporal characteristics of laser echoes. The type of the detector is Si-SPADs, and the SPAD is not gated. The hold-off time is 50 ns. The active area of the SPAD is 6.95 µm in diameter and the efficiency of the detector is approximately 22% at wavelength 637.5 nm. When the photon arrives, TDC starts the time measurement until it is triggered by the next pulse signal to stop; the timing resolution is 55 ps. The timing jitter of the system is 934 ps. To avoid photons loss caused by dead time, we used fibers of varying lengths and ensured that the difference in the running time of the light was greater than the dead time. The optical fiber length difference in the experiment is 1.5 m. The NA of the fibers is 0.22, the fiber core diameter is 50 . We used Thorlabs F110FC-633 as the fiber collimation. In the experiment, we created a dark environment in the laboratory to ensure that there were few background photons.
After the laser irradiates the target, the echoed photons passing through the fibers are detected using a single-pixel SPAD detector. To simplify, we used two optical fibers to receive echo photons to demonstrate the feasibility of the time coding method as an example. The signal photons received by the two fibers are mixed and coupled to a single fiber. The two-in-one photon flow is jointly transmitted to the detector through the fiber. As shown in Figure 4, two counting pulses can be obtained at pixels where two light spots overlap, according to the time distribution characteristics of the returned photons. This proved the feasibility of time coding to measure two distances using a single pixel without scanning.
The light spot generated by the echo photon transmitted through the optical fiber has a certain spatial area. The deviation of the distance measured at different positions of the light spot is analyzed. The distances are measured at four positions at the edge and center of the spot. Taking the center of the light spot as the origin, the relative distances of the other four position points are −6.60 cm, −4.95 cm, −6.60 cm, and −6.60 cm, respectively, as shown in Figure 5. Owing to the inhomogeneity of the distances measured at different positions of the light spot, the distance information measured at the center of the light spot is applied.
4. Results
4.1. Lidar Performance Index
To explore the performance index of the lidar, we performed the following experiments to obtain the lidar’s depth precision and ranging accuracy corresponding to one collecting port. This is a necessary step before the experiment to obtain the spatial position of the target. The experiment using three collection ports will be carried out only when the precision corresponding to a single collection port is appropriate. This step guarantees the feasibility of the next experiment to obtain the target position accurately.
In the experiment, the data were collected 50 times, all one-time data were collected, and a depth measurement was completed. The standard deviation of the average peak value of the data collected by the TCSPC technique was used as the depth precision of the lidar system [32]. The acquisition time was modified to change the number of detected photons and to investigate the relationship between the depth precision and photon counts. As shown in Figure 6b, the depth precision of the lidar system was measured with various photon counts. When the photon count increased, the depth precision of the system gradually increased until it tended to be constant. Each time the target was moved by 2 cm to change the target position, the detector acquisition time was modified to obtain the depth precision at different positions when the number of detected photons was 15, 55, and 95, respectively. The measured depth and the depth precision at each position are shown in Figure 6a,c, respectively. It can be observed that even if the target position changes, the trend remains the same.
To explore the ranging accuracy of lidar, the deviation between the measured distance and the real distance under different photon counts was obtained through experiments. The number of detected photons was changed by changing the acquisition time, and the data acquisition was repeated 30 times to obtain the root mean square error (RMSE) between the measured distance and the real distance under different photon counts. The RMSE is used as the ranging accuracy [1]. The formula for calculating the RMSE is as follows:
where represents the measured distance and represents the real distance.
The ranging accuracy under different photon counts is shown in Figure 6d.
4.2. Results and Analysis of the Target Position Calculation Experiment
In the experiment, we used fibers to obtain multiple distances needed to calculate the target’s spatial coordinate position. The target moves along the trajectory shown in Figure 7a. The total integration time in the experiment is set to 1500 microseconds to collect enough photons for calculating the target position. In this study, the target’s spatial position was calculated using the experimental data and compared with the real spatial position, as shown in Figure 7.
5. Conclusions
Compared to the traditional frame, there is no need for sweeping and motion components. Our completely solid system has the advantages of low cost and high stability. It can quickly obtain a target’s range, azimuth angle, and spatial position compared to the scanning method. The lidar adopts a single-photon detector that can detect returning photons of the target when the laser echo signal is extremely weak and can detect the range, azimuth angle, and spatial position of the faint target. The lidar receives echo-signal photons through multiple optical fibers and adopts a single-pixel SPAD as the detector. Using time coding and the temporal distribution characteristics of echo photons passing through different optical fibers, multiple distances can be extracted simultaneously, and the range, azimuth angle, and spatial position of the target can thus be calculated. This has two advantages. First, unlike other photon-counting lidars that use a single-pixel detector, multiple ranges, target azimuth, and target spatial position can be obtained without scanning, significantly reducing the acquisition time. Second, multiple distances can be obtained from a single-pixel single-photon detector using the time coding technology, reducing the number of single-photon detectors and the cost of lidar. Following the experiment, the performance index of the lidar was investigated, and the target’s distance and spatial position were calculated, verifying the feasibility of the idea. The system can be extended to target-tracking lidar and has great potential for application in target tracking.
Author Contributions
Methodology, H.Z. and Q.A.; software, H.Z.; validation, H.Z.; writing-original draft: H.Z.; writing: review & editing: H.Z.; project administration, J.L. and J.W.; funding acquisition, J.W. All authors have read and agreed to the published version of the manuscript.
Funding
This research was funded by the Natural Science Foundation of China, grant number 12133009, 62005279, the Youth Innovation Promotion Association of the Chinese Academy of Sciences, grant 2020221, and the Jilin Science and Technology Development Program under grant no. 20220402032GH.
Institutional Review Board Statement
Not applicable.
Informed Consent Statement
Not applicable.
Data Availability Statement
Data underlying the results presented in this study are not publicly available at this time but may be obtained from the authors upon reasonable request.
Conflicts of Interest
The authors declare no conflict of interest.
References
- Li, Z.; Wu, E.; Pang, C.; Du, B.; Tao, Y.; Peng, H.; Zeng, H.; Wu, G. Multi-beam single-photon-counting three-dimensional imaging lidar. Opt. Express 2017, 25, 10189–10195. [Google Scholar] [CrossRef] [PubMed] [Green Version]
- Araki, H.; Tazawa, S.; Noda, H.; Ishihara, Y.; Goossens, S.; Sasaki, S.; Kawano, N.; Kamiya, I.; Otake, H.; Oberst, J.; et al. Lunar global shape and polar topography derived from Kaguya-LALT laser altimetry. Science 2009, 323, 897–900. [Google Scholar] [CrossRef] [PubMed]
- Schwarz, B. Lidar: Mapping the world in 3D. Nat. Photon. 2010, 4, 429–430. [Google Scholar] [CrossRef]
- Glennie, C.L.; Carter, W.E.; Shrestha, R.L.; Dietrich, W.E. Geodetic imaging with airborne LiDAR: The Earth’s surface revealed. Rep. Prog. Phys. 2013, 76, 86801. [Google Scholar] [CrossRef]
- Cao, R.; de Goumoens, F.; Blochet, B.; Xu, J.; Yang, C. High-resolution non-line-of-sight imaging employing active focusing. Nat. Photon. 2022, 16, 462–468. [Google Scholar] [CrossRef]
- O’Toole, M.; Lindell, D.B.; Wetzstein, G. Confocal non-line-of-sight imaging based on the light-cone transform. Nature 2018, 555, 338–341. [Google Scholar] [CrossRef]
- Sun, B.; Edgar, M.P.; Bowman, R.; Vittert, L.E.; Welsh, S.; Bowman, A.; Padgett, M.J. 3D computational imaging with single-pixel detectors. Science 2013, 340, 844–847. [Google Scholar] [CrossRef] [Green Version]
- Sun, M.-J.; Edgar, M.P.; Gibson, G.M.; Sun, B.; Radwell, N.; Lamb, R.; Padgett, M.J. Single-pixel three-dimensional imaging with time-based depth resolution. Nat. Commun. 2016, 7, 12010. [Google Scholar] [CrossRef]
- Duarte, M.F.; Davenport, M.A.; Takhar, D.; Laska, J.N.; Sun, T.; Kelly, K.F.; Baraniuk, R.G. Single-pixel imaging via com-pressive sampling. IEEE Signal Process. Mag. 2008, 25, 83–91. [Google Scholar] [CrossRef] [Green Version]
- Liang, C.; Wang, C.; Xue, X.; Dou, X.; Chen, T. Meter scale and sub-second resolution coherent doppler wind lidar and hyperfine wind observation. Opt. Lett. 2022, 47, 3179–3182. [Google Scholar] [CrossRef]
- Raviv, D.; Barsi, C.; Naik, N.; Feigin, M.; Raskar, R. Pose estimation using time-resolved inversion of diffuse light. Opt. Express 2014, 22, 20164–20176. [Google Scholar] [CrossRef] [PubMed]
- Wu, C.; Xing, W.; Feng, Z.; Xia, L. Moving target tracking in marine aerosol environment with single photon lidar system. Opt. Lasers Eng. 2020, 127, 105967. [Google Scholar] [CrossRef]
- Ren, M.; Gu, X.; Liang, Y.; Kong, W.; Wu, E.; Wu, G.; Zeng, H. Laser ranging at 1550 nm with 1-GHz sine-wave gated InGaAs/InP APD single-photon detector. Opt. Express 2011, 19, 13497–13502. [Google Scholar] [CrossRef] [Green Version]
- McCarthy, A.; Krichel, N.J.; Gemmell, N.R.; Ren, X.; Tanner, M.G.; Dorenbos, S.N.; Zwiller, V.; Hadfield, R.H.; Buller, G.S. Kilometer-range, high resolution depth imaging via 1560-nm wavelength single-photon detection. Opt. Express 2013, 21, 8904–8915. [Google Scholar] [CrossRef] [Green Version]
- Liang, Y.; Huang, J.; Ren, M.; Feng, B.; Chen, X.; Wu, E.; Wu, G.; Zeng, H. 1550-nm time-of-flight ranging system employing laser with multiple repetition rates for reducing the range ambiguity. Opt. Express 2014, 22, 4662–4670. [Google Scholar] [CrossRef] [PubMed] [Green Version]
- Kirmani, A.; Venkatraman, D.; Shin, D.; Colaço, A.; Wong, F.N.C.; Shapiro, J.H.; Goyal, V.K. First-photon imaging. Science 2014, 343, 58–61. [Google Scholar] [CrossRef]
- Maccarone, A.; McCarthy, A.; Ren, X.; Warburton, R.E.; Wallace, A.M.; Moffat, J.; Petillot, Y.; Buller, G.S. Underwater depth imaging using time-correlated single-photon counting. Opt. Express 2015, 23, 33911–33926. [Google Scholar] [CrossRef] [PubMed]
- Moussavi, M.S.; Abdalati, W.; Scambos, T.; Neuenschwander, A. Applicability of an automatic surface detection approach to micro-pulse photon-counting lidar altimetry data: Implications for canopy height retrieval from future ICESat-2 data. Int. J. Remote Sens. 2014, 35, 5263–5279. [Google Scholar] [CrossRef]
- Shin, D.; Xu, F.; Venkatraman, D.; Lussana, R.; Villa, F.; Zappa, F.; Goyal, V.K.; Wong, F.N.C.; Shapiro, J.H. Photon-effificient imaging with a single-photon camera. Nat. Commun. 2016, 7, 12046. [Google Scholar] [CrossRef] [Green Version]
- Du, B.; Pang, C.; Wu, D.; Li, Z.; Peng, H.; Tao, Y.; Wu, E.; Wu, G. High-speed photon-counting laser ranging for broad range of distances. Sci. Rep. 2018, 8, 4198. [Google Scholar] [CrossRef] [Green Version]
- Li, Z.-P.; Huang, X.; Jiang, P.-Y.; Hong, Y.; Yu, C.; Cao, Y.; Zhang, J.; Xu, F.; Pan, J.-W. Super-resolution single-photon imaging at 8.2 kilometers. Opt. Express 2020, 28, 4076–4087. [Google Scholar] [CrossRef] [PubMed] [Green Version]
- Pawlikowska, A.M.; Halimi, A.; Lamb, R.A.; Buller, G.S. Single-photon three-dimensional imaging at up to 10 kilometers range. Opt. Express 2017, 25, 11919–11931. [Google Scholar] [CrossRef] [PubMed]
- Li, Z.-P.; Huang, X.; Cao, Y.; Wang, B.; Li, Y.-H.; Jin, W.; Yu, C.; Zhang, J.; Zhang, Q.; Peng, C.-Z.; et al. Single-photon computational 3D imaging at 45 km. Photonics Res. 2020, 8, 1532. [Google Scholar] [CrossRef]
- Li, Z.-P.; Ye, J.-T.; Huang, X.; Jiang, P.-Y.; Cao, Y.; Hong, Y.; Yu, C.; Zhang, J.; Zhang, Q.; Peng, C.-Z.; et al. Single-photon imaging over 200 km. Optica 2021, 8, 344–349. [Google Scholar] [CrossRef]
- Yu, A.W.; Krainak, M.A.; Harding, D.J.; Abshire, J.B.; Sun, X.; Valett, S.; Cavanaugh, J.; Ramos-Izquierdo, L. Spaceborne laser instruments for high-resolution mapping. Proc. SPIE 2010, 7578, 757802. [Google Scholar] [CrossRef]
- Marino, R.M.; Jigsaw, W.R.D. A foliage-penetrating 3D imaging laser radar system. Linc. Lab. J. 2005, 15, 23–36. [Google Scholar]
- Markus, T.; Neumann, T.; Martino, A.; Abdalati, W.; Brunt, K.; Csatho, B.; Farrell, S.; Fricker, H.; Gardner, A.; Harding, D.; et al. The ice, cloud, and land elevation satellite-2 (ICESat-2): Science requirements, concept, and implementation. Remote Sens. Environ. 2017, 190, 260–273. [Google Scholar] [CrossRef]
- Wu, D.; Zheng, T.; Wang, L.; Chen, X.; Yang, L.; Li, Z.; Wu, G. Multi-beam single-photon LiDAR with hybrid multiplexing in wavelength and time. Opt. Laser Technol. 2022, 145, 107477. [Google Scholar] [CrossRef]
- Luo, Y.; He, Y.; Geng, L.; Wang, M.; Lei, L.; Wu, Y.; Hu, S.; Hou, X.; Chen, W. Long-distance laser ranging lidar based on photon counting technology. Chin. J. Lasers 2016, 43, 514001. [Google Scholar]
- Chen, F.F.; Geng, R.; Lü, Y. Research on the transmittance model of laser infrared atmospheric transmission. Infrared Technol. 2015, 37, 496–501. [Google Scholar]
- Kim, I.I.; McArthur, B.; Korevaar, E.J. Comparison of laser beam propagation at 785 nm and 1550 nm in fog and haze for optical wireless communications. Proc. SPIE-Int. Soc. Opt. Eng. 2001, 4214, 26–37. [Google Scholar] [CrossRef]
- Lawrance, A.J.; Snyder, D.L. Random point processes. J. R. Stat. Soc. Ser. A (Gen.) 1975, 139, 547. [Google Scholar] [CrossRef]
- Shin, D.; Kirmani, A.; Goyal, V.K.; Shapiro, J.H. Photon-efficient computational 3-D and reflectivity imaging with single-photon detectors. IEEE Trans. Comp. Imaging 2015, 1, 112–125. [Google Scholar] [CrossRef] [Green Version]
- Zheng, X.; Guo, R.; Li, Y.; Li, Z.; Fu, H.; Xiong, Y. Research and experiment on the lunar laser ranging in China. Astron. Res. Technol. 2007, 4, 231–237. [Google Scholar]
Figure 1.
Schematic diagrams of target detection and calculating the position of the target. (a) Illustration of the target detection. (b) Schematic diagram of calculating the spatial position of the target.
Figure 1.
Schematic diagrams of target detection and calculating the position of the target. (a) Illustration of the target detection. (b) Schematic diagram of calculating the spatial position of the target.
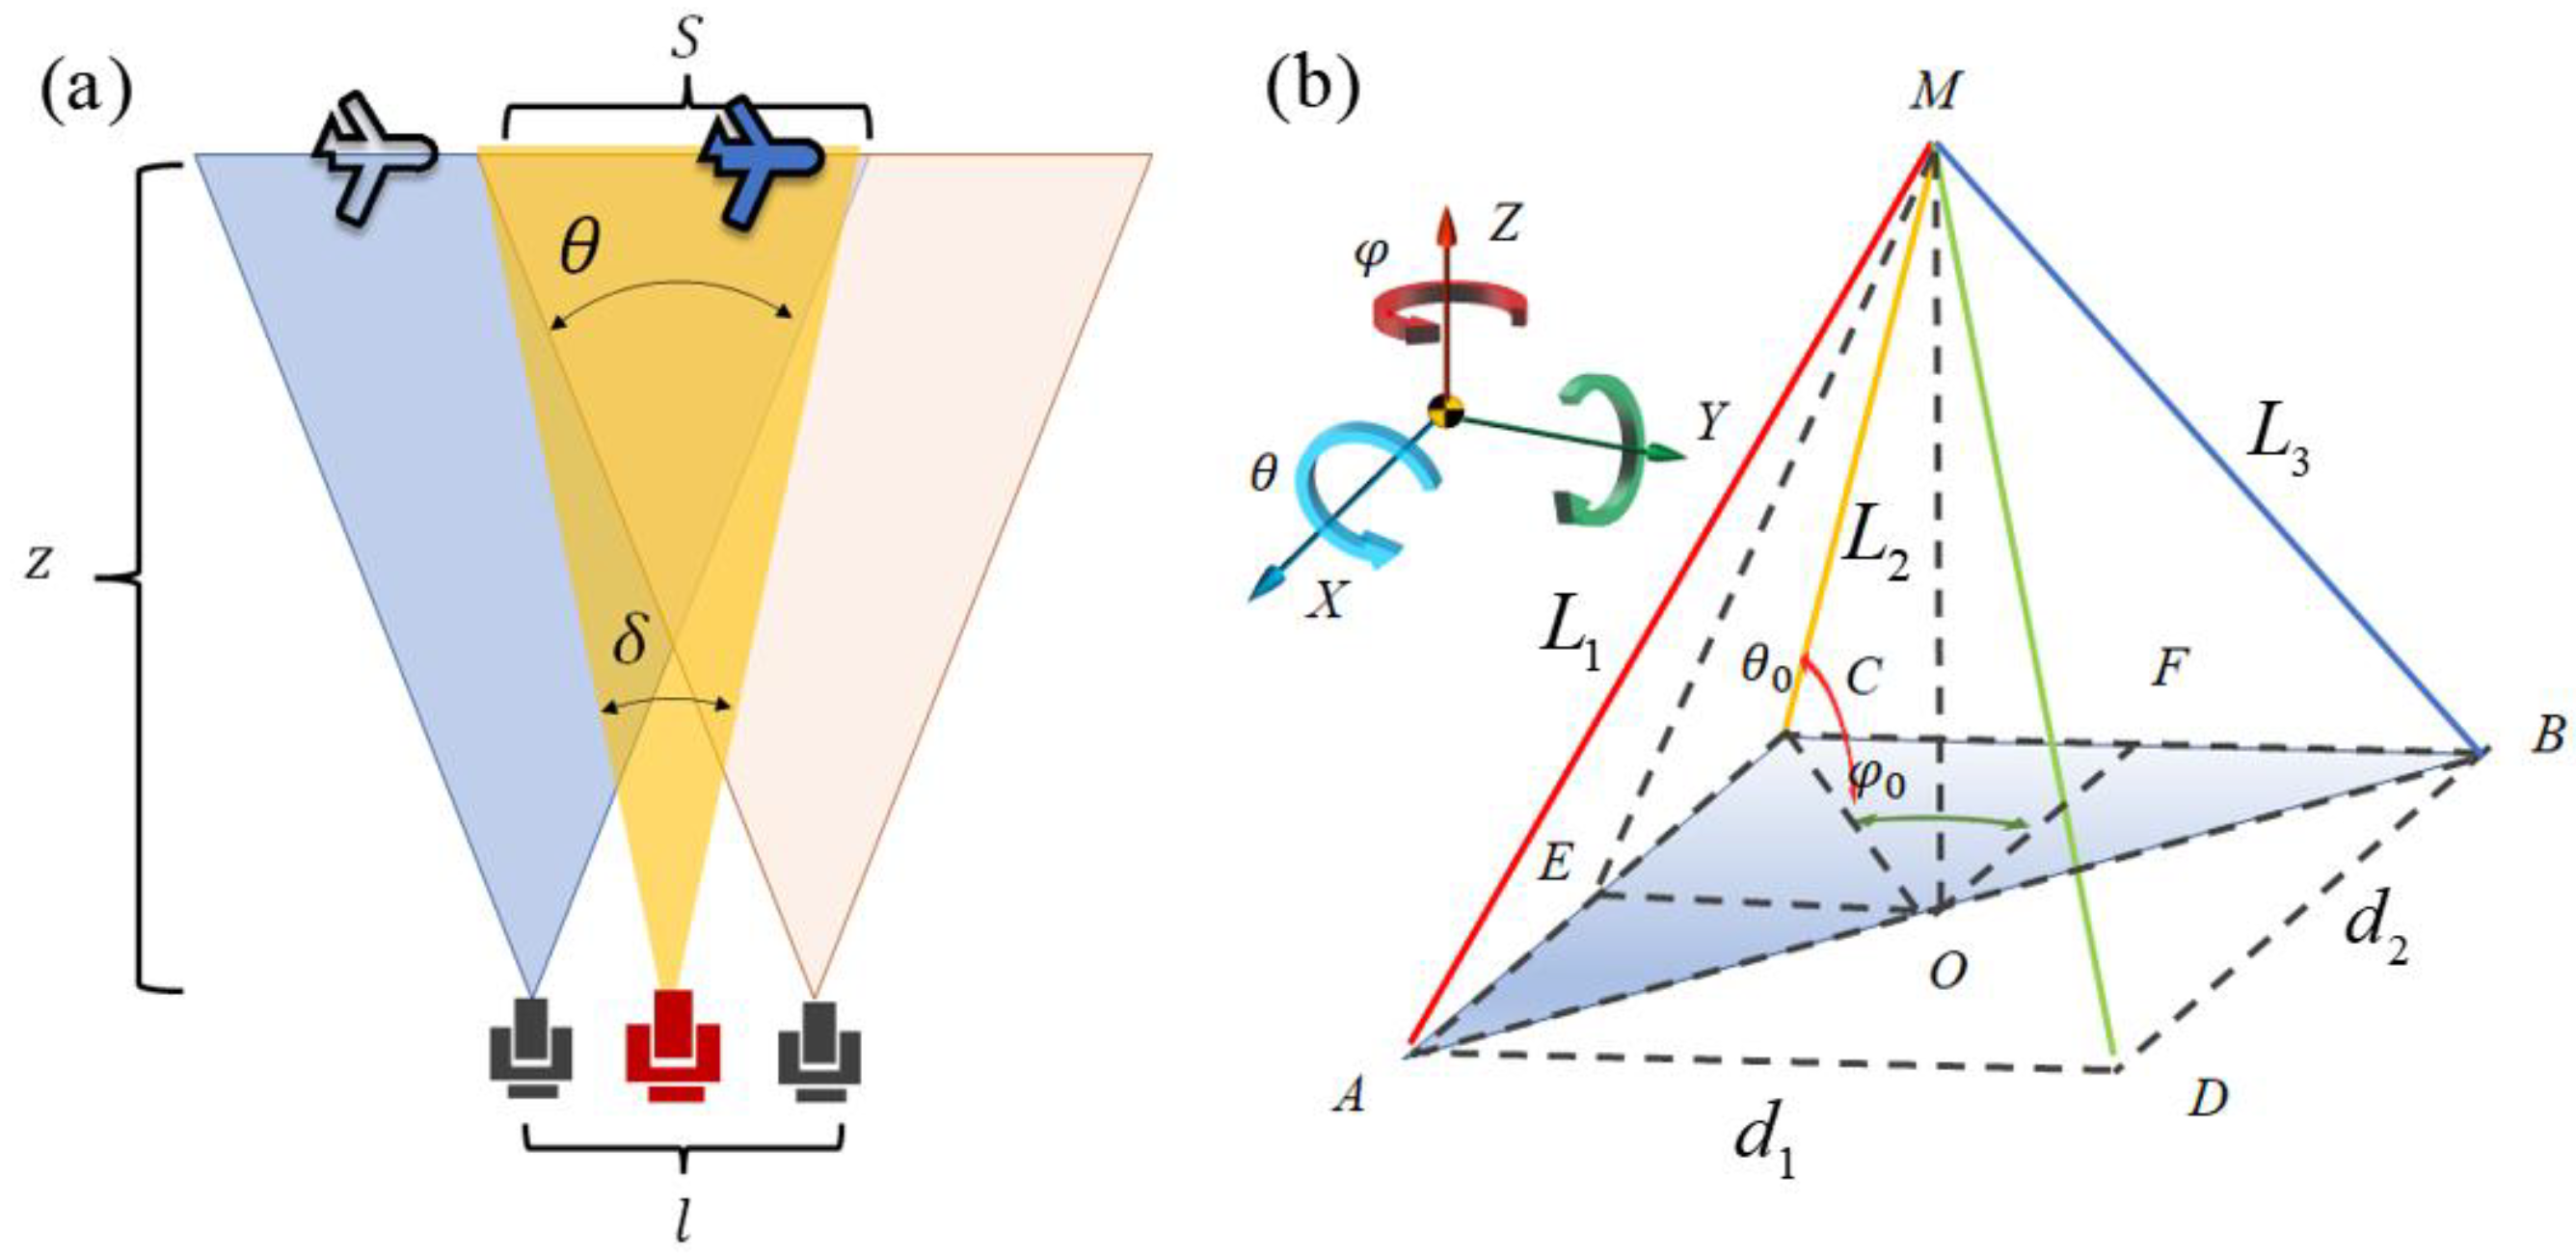
Figure 2.
Relationship between the position errors and the spacing of the receiving subsystems. (a) The error in the direction of the x-axis. (b) Error in the direction of the y-axis. (c) Error in the direction of the z-axis. (d) Magnitude of the errors.
Figure 2.
Relationship between the position errors and the spacing of the receiving subsystems. (a) The error in the direction of the x-axis. (b) Error in the direction of the y-axis. (c) Error in the direction of the z-axis. (d) Magnitude of the errors.

Figure 3.
(a) Schematic of the experimental setup. (b) Layout of the instruments on the lab bench.
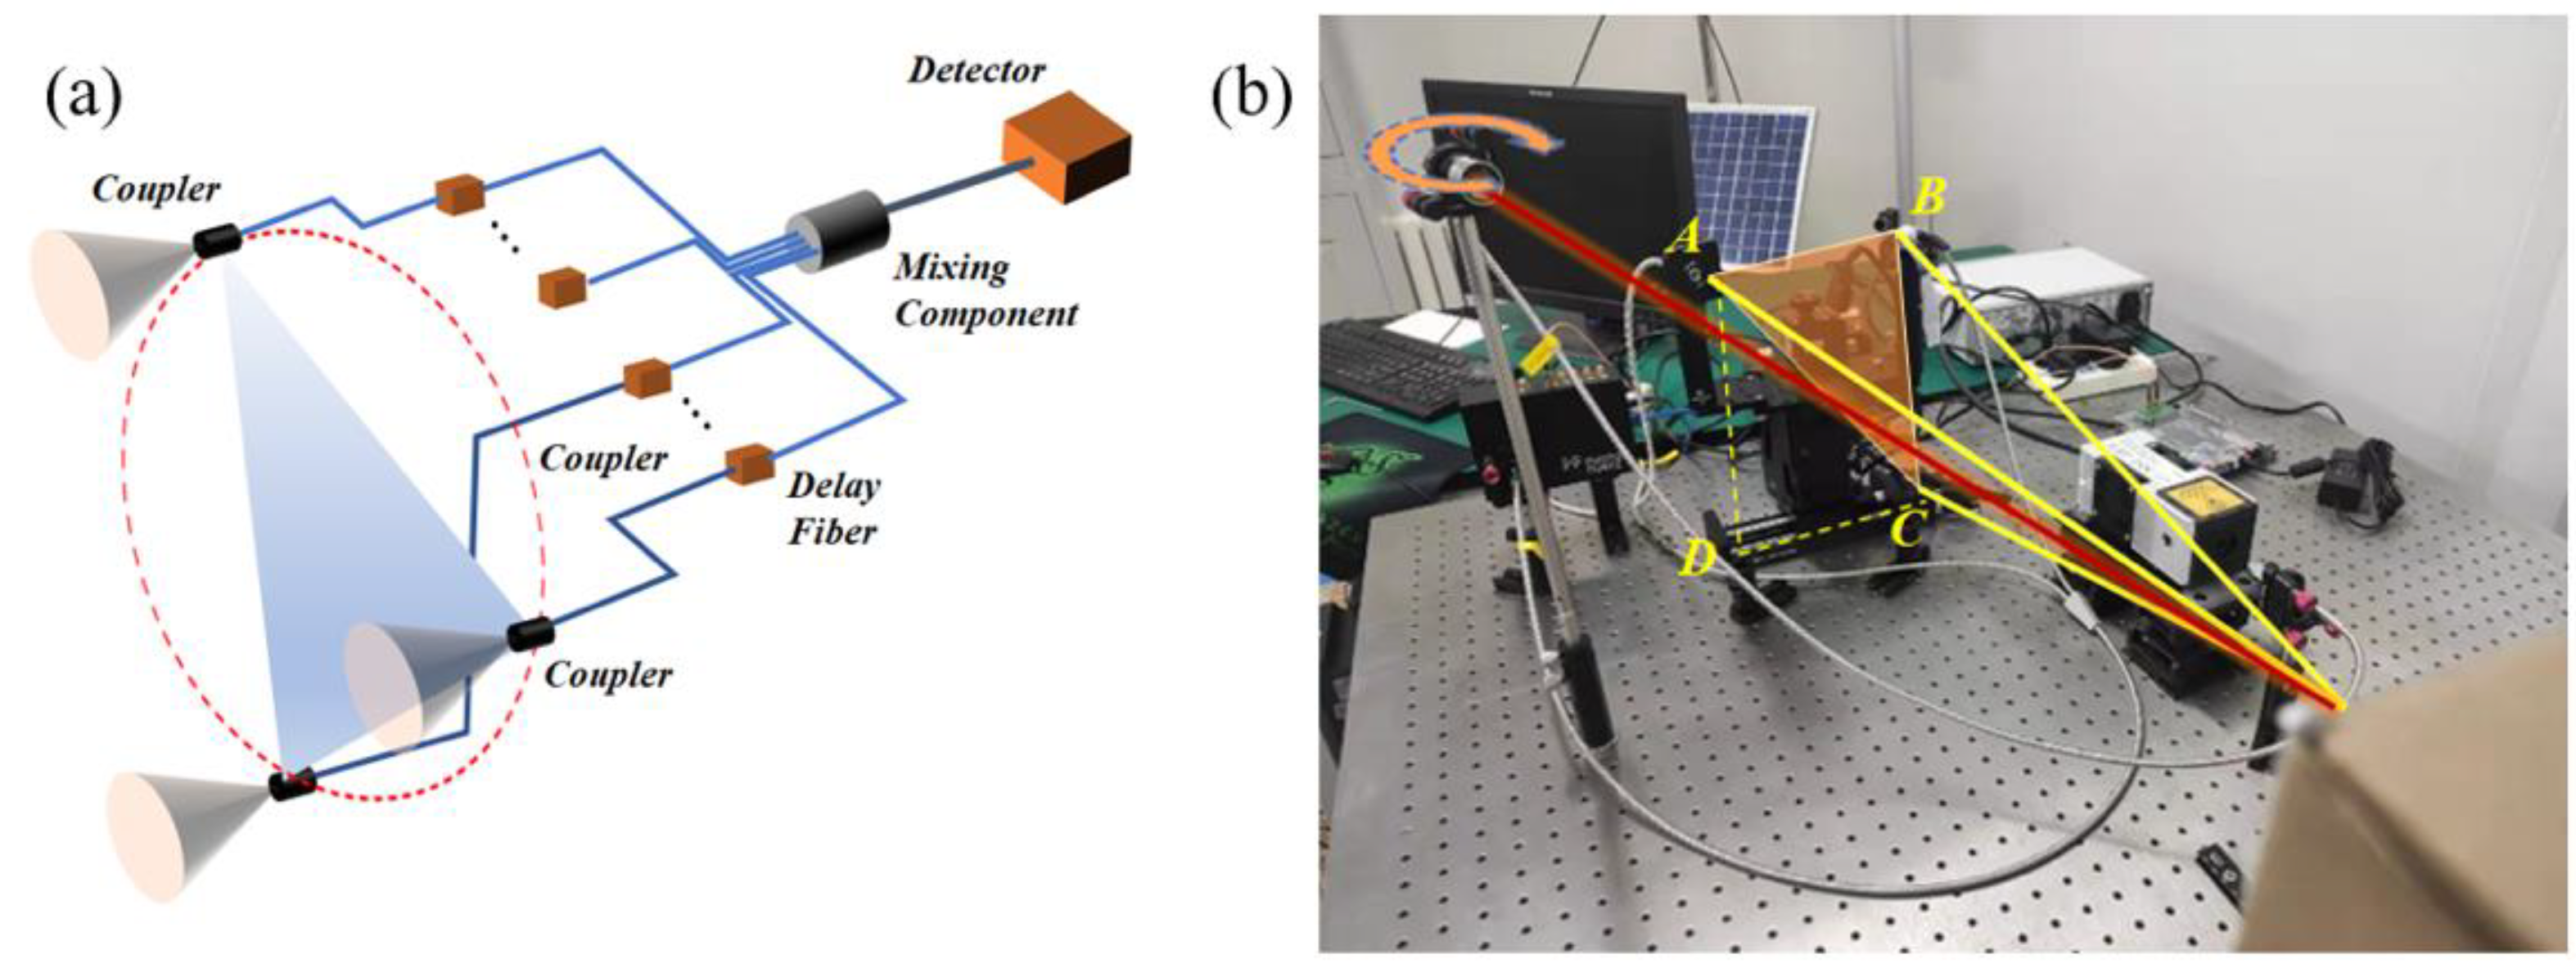
Figure 4.
(a–d) Simulation diagram of simultaneously obtaining two distances based on time coding.
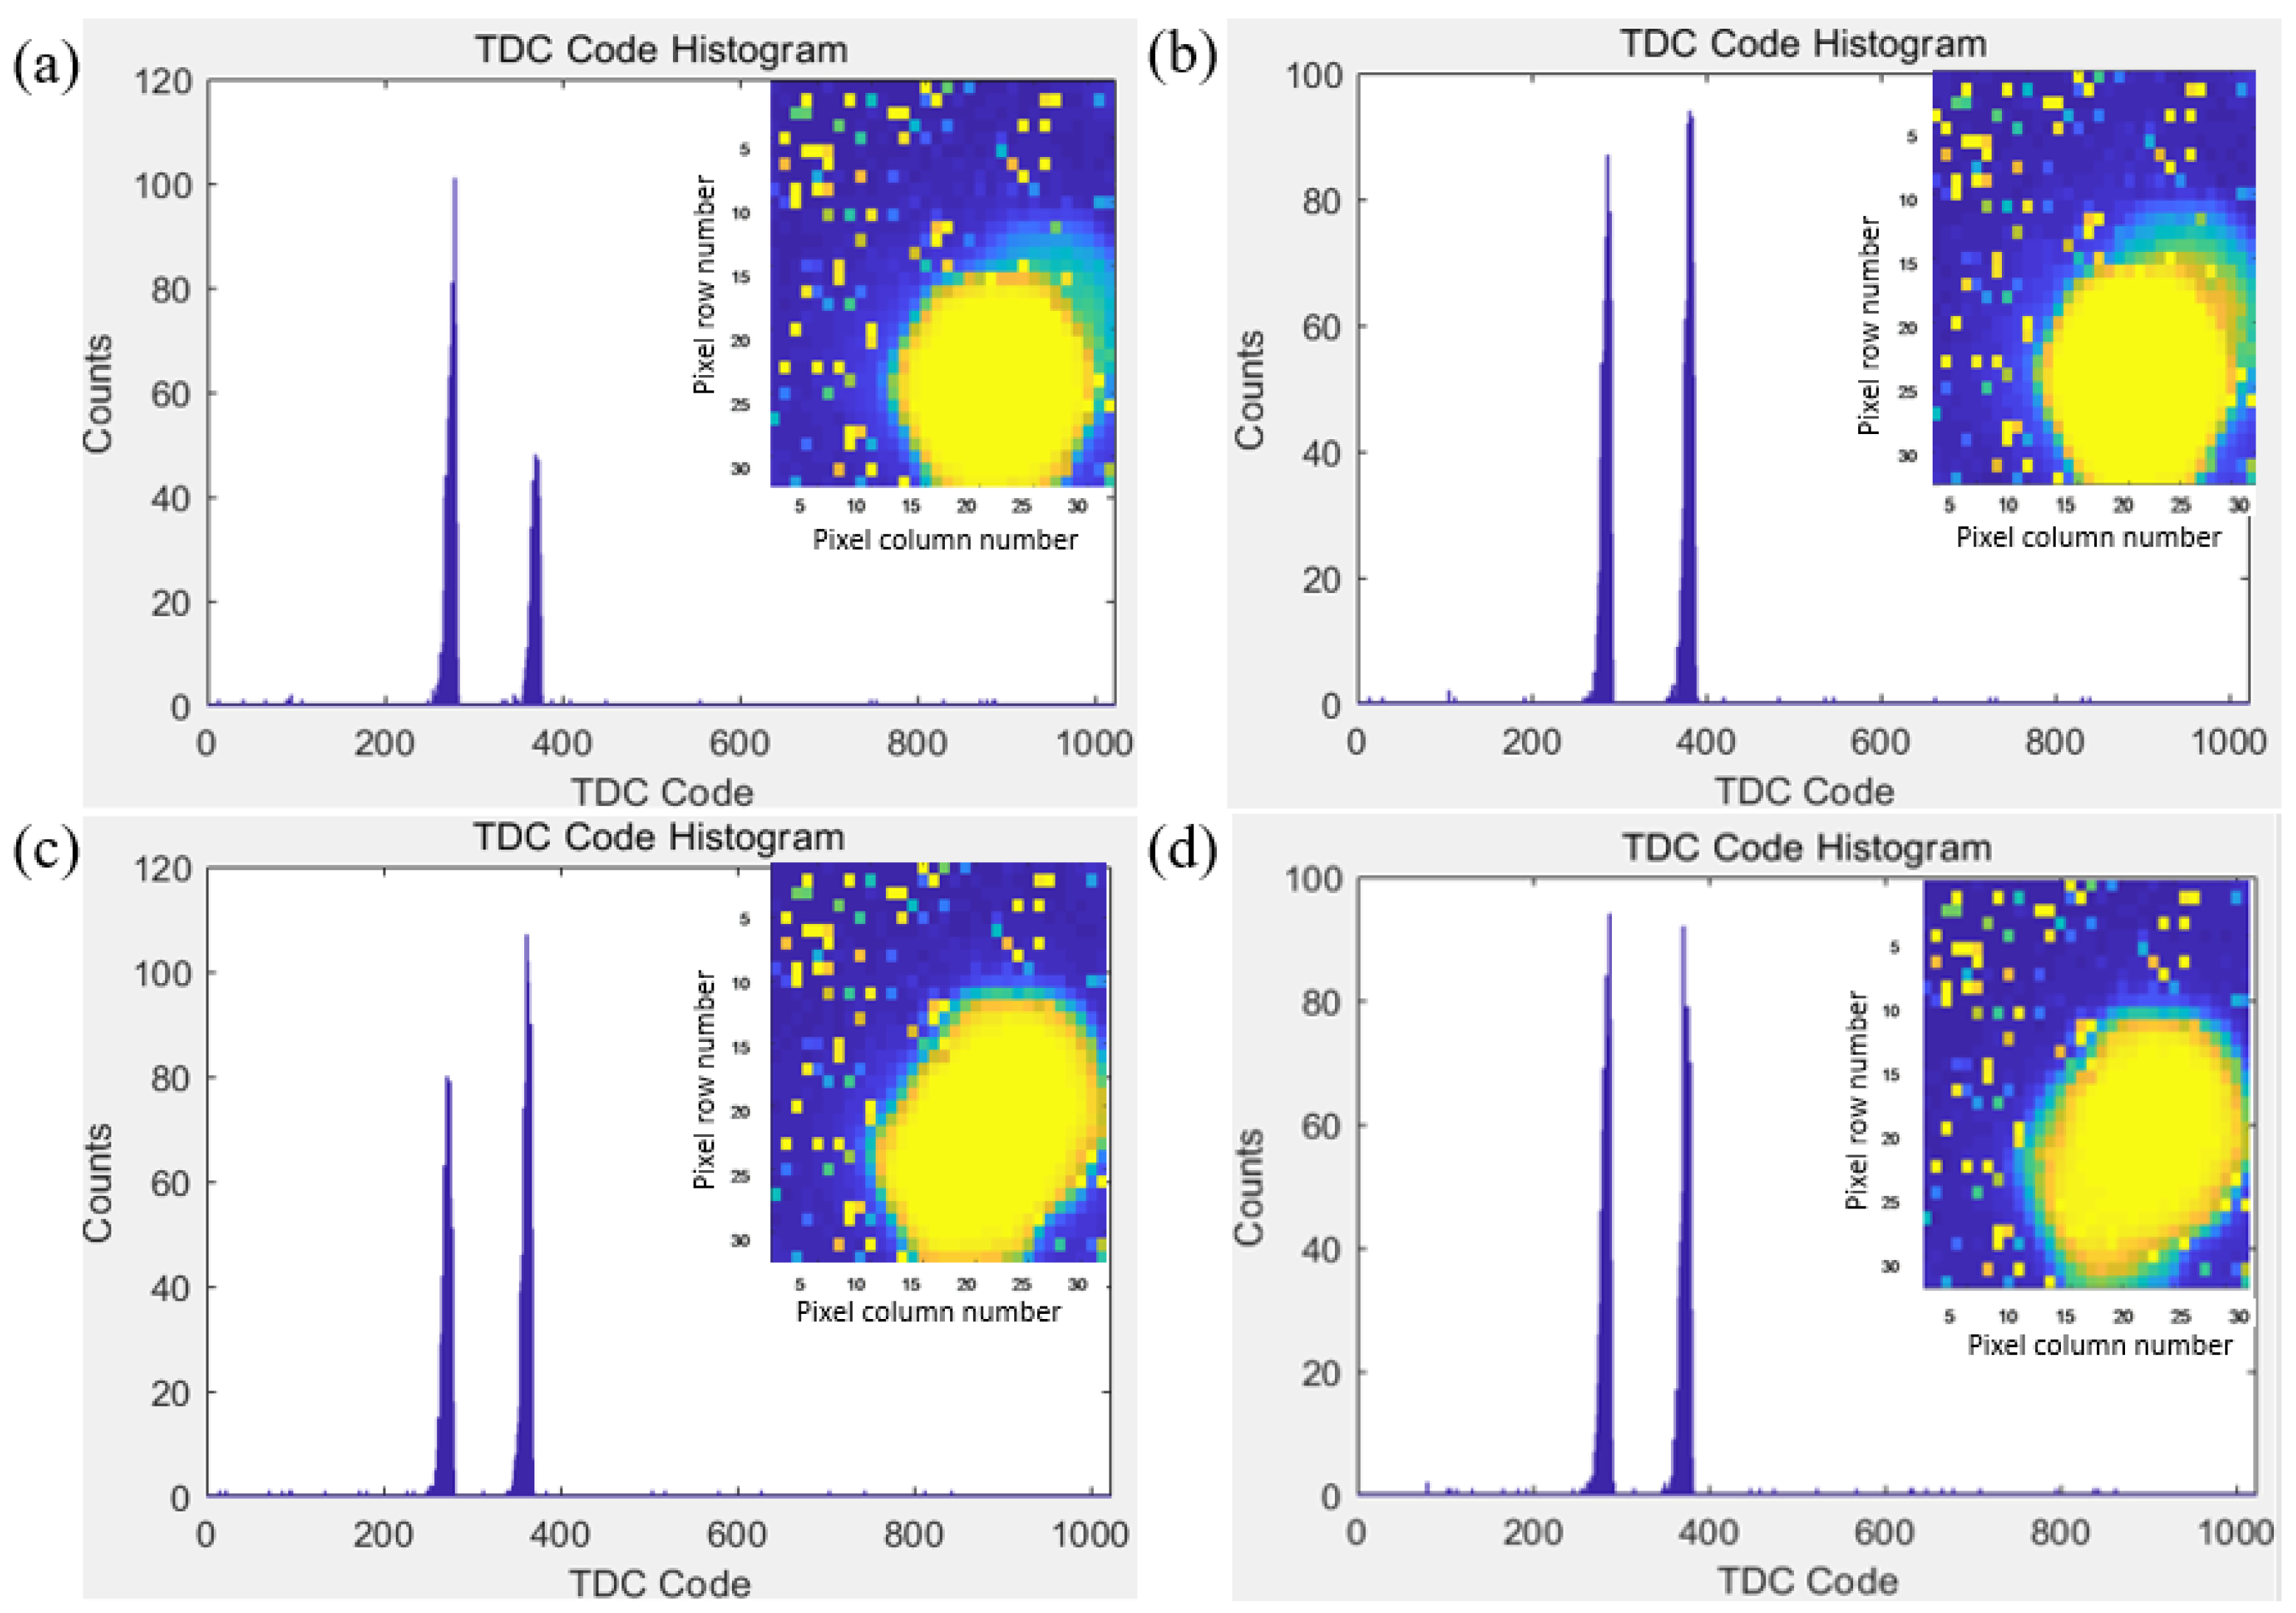
Figure 5.
(a) Schematic diagram of the deviation of the measured distance at different positions of the light spot. (b–e) TCSPC distribution reflecting the distance information of the typical location of the spot boundary.
Figure 5.
(a) Schematic diagram of the deviation of the measured distance at different positions of the light spot. (b–e) TCSPC distribution reflecting the distance information of the typical location of the spot boundary.

Figure 6.
(a) Distances were measured at different locations with photon counts of 15, 55, and 95. (b) Single-photon-counting lidar depth precision under different photon counts. (c) Relationship between photon counts and depth precision at different positions. (d) Deviation between the measured and real distances (ranging accuracy) under different photon counts.

Figure 7.
(a) 3D view, (b) top view, (c) front view, and (d) distance of the target.

Disclaimer/Publisher’s Note: The statements, opinions and data contained in all publications are solely those of the individual author(s) and contributor(s) and not of MDPI and/or the editor(s). MDPI and/or the editor(s) disclaim responsibility for any injury to people or property resulting from any ideas, methods, instructions or products referred to in the content. |
© 2023 by the authors. Licensee MDPI, Basel, Switzerland. This article is an open access article distributed under the terms and conditions of the Creative Commons Attribution (CC BY) license (https://creativecommons.org/licenses/by/4.0/).
Share and Cite
MDPI and ACS Style
Zhang, H.; Liu, J.; An, Q.; Wang, J. Time Coding-Based Single-Photon-Counting Lidar for Obtaining Spatial Location. Photonics 2023, 10, 457. https://doi.org/10.3390/photonics10040457
AMA Style
Zhang H, Liu J, An Q, Wang J. Time Coding-Based Single-Photon-Counting Lidar for Obtaining Spatial Location. Photonics. 2023; 10(4):457. https://doi.org/10.3390/photonics10040457
Chicago/Turabian StyleZhang, Hanfu, Jie Liu, Qichang An, and Jianli Wang. 2023. "Time Coding-Based Single-Photon-Counting Lidar for Obtaining Spatial Location" Photonics 10, no. 4: 457. https://doi.org/10.3390/photonics10040457
Note that from the first issue of 2016, this journal uses article numbers instead of page numbers. See further details here.