Theoretical Analysis of Thermal Distribution and Waveform Evolution in Pulsed Ytterbium-Doped Fiber Amplifier with Extra Feedback


School of Physical Science and Technology, Inner Mongolia University, Inner Mongolia Autonomous Region, Hohhot 010021, China
*
Author to whom correspondence should be addressed.
Photonics 2023, 10(4), 437; https://doi.org/10.3390/photonics10040437
Submission received: 20 March 2023
/
Revised: 9 April 2023
/
Accepted: 11 April 2023
/
Published: 12 April 2023
(This article belongs to the Special Issue Narrow Linewidth Laser Sources and Their Applications)
Abstract
:Pulsed ytterbium-doped fiber amplifiers (YDFA) with ns-level signal width are important devices for obtaining high-power pulsed lasers. When some components in the amplifier are ineffective, e.g., the isolator or fiber is damaged, extra feedback light is generated and coupled into the gain fiber. The dynamic thermal distribution and waveform evolution of amplifiers with extra continuous-wave (CW) or pulse-wave (PW) feedback are theoretically analyzed in this work. The CW feedback can not only reduce the gain of the amplifier but can also change the thermal distribution of the gain fiber, while the PW feedback can reduce the leading or trailing edge of the output pulse by 3–4 ns, depending on the direction of the feedback light transmission. The theoretical analysis provides a reference for optimizing the thermal management and the fault diagnosis of a typical fiber amplifier with an output of several tens of watts.
1. Introduction
The ytterbium-doped fiber amplifier (YDFA) is the most widely used amplifier in the industrial, medical, and scientific research fields because of its wide absorption spectrum, high quantum efficiency, and lack of concentration quenching [1,2,3]. YDFAs with easy tunability, high interference immunity, and a flexible output direction are well suited for laser processing, e.g., laser coating, welding, cutting, and sensing [4,5]. Master oscillator power amplifiers (MOPAs) with double-cladding ytterbium-doped fiber (YDCF) have become the main technical way to obtain ns-level laser pulses with tunable pulse width and repetition frequency. In 2012, Zhang et al. worked an all-fiberized high-pulse-energy pulse fiber MOPA at 1064 nm [6]. An amplifier with an arbitrary waveform seed laser can launch an average output power of more than 62 W and a pulse energy of 6.2 mJ at a 10 kHz repetition rate. In 2013, Fang et al. obtained a pulsed-wave (PW) laser output with a single pulse energy of 11 mJ and a pulse width of 660 ns at 3 kHz by using cascaded YDFAs [7]. In 2014, Zhang et al. built a pulsed-pumped cascaded pulsed ytterbium-doped double-cladding fiber MOPA. The single pulse energy of the output laser was 55 mJ and the pulse width was 10 ns [8]. They also obtained a high-energy pulsed laser output with a repetition frequency of 10 Hz, a pulse width of 10 ns, and a pulse energy of 100 mJ in 2017 by optimizing this experimental system [9]. Although the pulse energy obtained by a fiber amplifier can be up to 100 mJ, one of the most important difficulties in scaling larger output powers from YDFAs is thermal control. The large surface-to-volume ratio of the fibers naturally improves their heat dissipation, but the thermal loading in high-power fiber amplifiers should still be managed [10]. Although the core temperature is always below the melting point of quartz, the low-index polymer coatings of typical double-clad fibers are always so sensitive to high thermal loads that they sustain thermal damage when the temperature nears 150 °C [11]. Lower fiber temperatures may needed if the long-term stability of the amplifier is to be improved.
However, besides the direct heat dissipation conditions, the amplifier working parameters, including seed power, pump power, amplified spontaneous emission (ASE), and so on, can change the thermal load through the gain propriety of the amplifier [12,13]. The residual upper-level population would have a great chance of transitioning through the thermal relaxation, which can increase the thermal load on the gain fiber if the amplifier gain decreases under the same pumping conditions. As a result, the fiber temperature would be significantly impacted by the unstable gain property. In cascade amplifiers, the isolator is used to block extra forward- and backward-transmitted lights between each stage, such as the forward ASE generated in the pre-amplifier or seed laser, or the backward ASE generated in the following amplifier. However, insufficient isolation or sudden damage caused by an accident can result in the extra ASE being injected into the gain fiber. It is also possible to reduce the gain and the thermal stability. The isolator is sometimes ignored to increase the output power or suppress the ASE at long wavelengths [14]. In addition, the backward- or forward-reflected light caused by Rayleigh scattering, the nonlinear effect, and end port reflection contribute to fluctuations in thermal load. Isolators or angle-cleaved output ends are often used in fiber amplifiers to prevent end interference. However, reflected light cannot entirely be avoided due to the limitations of isolation, improper fusion splicing between the heterogeneous fibers, or the refractive index (RI) change caused by the stress of coiled fiber. The forward- or backward-reflected light, which works as an extra feedback signal, can affect the output property through gain competition. Variations in gain are negatively impacted by the unstable pulses through the gain fiber thermal distribution, leading to the amplifier discharge phenomenon [15,16] or the mode instability phenomenon [17,18].
Therefore, a typical pulsed ytterbium-doped fiber amplifier with an output of several tens of watts was used as a theoretical model for this investigation. The dynamic characteristics of a square seed pulse amplification with repetition frequencies of 20 kHz are considered in this work. A theoretical analysis based on the rate equation and the heat conduction equation was carried out to explore the influence of forward or backward extra feedback light on the temperature distribution of the gain fiber and the output pulse envelope. The simulated results demonstrate that the peak temperature and peak position of the gain fiber will be changed by the feedback of the forward- or backward-injected continuous-wave (CW) light, and that the amplified pulse waveform correlates with the strength of the end reflection. This theoretical analysis will help achieve the efficient thermal management of fiber amplifiers and improve their thermal stability.
2. Theoretical Models and Methods
The theoretical YDFA model is shown in Figure 1a. The model only illustrates the YDCF and, for convenience, ignores the passive components of the amplifier, such as the seed laser, the pump LDs, the combiner, and the cladding light stripper. The YDCF is assumed to be Yb-doped double-cladding fiber (LMA-YDF-10/130-VIII, Coherent, USA) whose core and inner cladding diameters are 10 µm and 130 µm, respectively. The length L of the YDCF is 3 m in the simulation. The thermal modal instability has an important influence on the output power of multimode gain fibers [11,19]. However, we ignore the effect of thermal mode instability in the following simulations because only 11 modes are allowed to exist in this fiber core, and the signal power is not sufficient to cause thermal mode instability [20]. A square pulsed seed signal with a repetition frequency of 20 kHz, a peak power of 1 W, and a pulse width of 50 ns is coupled from point z = 0, and a CW pump light with a power of 40 W is assumed. These are the seed laser parameters of a typical pulsed Yb-doped fiber amplifier with several tens of watts of output power. The Yb-ions are the quasi-three-level system, so the excited-state absorption (ESA) is eliminated [18,19,20,21]. The dynamic evolution of the ns-level pulsed signal and pump is described by the simplified dynamic rate equations and power transfer equations of the YDFA, which are shown in Equations (1)–(6) [22,23].
Equations (1)–(4) are the power transmission equations for the pump, signal, feedback light, and ASE, respectively, where z and t represent spatial and temporal coordinates, respectively. A is the effective area of the fiber core. ΓS is the overlap factor of the core light, including the signal, the extra feedback light, and the ASE. Its value is 0.82 in the simulation. The overlap factor Γp is 0.0024 for the pump laser in the inner cladding. h is the Planck constant and c is vacuum light speed. α is the attenuation coefficient of the fiber. SαRS is the Rayleigh scattering coefficient, and its value is 1.2 × 10⁻⁷ m−1 [23]. σa(λ) and σe(λ) are the absorption and emission cross sections at wavelength λ (the values are from Coherent Inc., Santa Clara, CA, USA), respectively. The signal wavelength λs is 1064 nm, and the pump light wavelength λp is 976 nm. The amplifier is forward-pumped by a CW pump LD with a power of 40 W. The simulated ASE spectra range from 1000 to 1100 nm. The ASE spectrum is divided into 50 channels with central wavelengths of λk, k = 1, ···, 50, and even spacing of Δλ = 2 nm. The spectral widths of the pump and signal are both set to 1 nm. The signal and the pump have very narrow spectral widths, and these are approximated by their wavelengths λs and λp. Equations (5) and (6) are the rate equations for a simplified two-energy system in the YDFA [23]. N0 is the ytterbium dopant concentration which is assumed to be 3.53 × 1025 m−3. N1 and N2 are the lower-level and upper-level populations, respectively. τ is the lifetime of the Yb-ions, and its value is 880 ns. The other parameters in the simulation are referred to in the literature [23].
The output evolutions of the amplifiers with continuous-wave (CW) and pulsed-wave (PW) feedback light are considered separately. For one thing, a damaged or missing isolator cannot prevent externally generated ASE coupling into the amplifier. Although the ASE in the pulsed amplifier is temporally discontinuous, the ASE light has a broader spectrum and a slower time-domain variation than the signal. It is reasonable to assume that the CW feedback lights are the extra ASEs generated by other devices. For convenience, the extra forward and backward CW feedback lights in the following text are simply named FL and BL, respectively, as in Figure 1a. Since both the feedback light and the signal are transmitted in the core, the action process of the extra CW feedback light is equated to the amplification of an extra CW signal which is co-amplified with the signal. Its effect on the upper-level population N2 is manifested through the last term in Equation (6). The power of FL and BL at z = 0 and z = L are represented by and , respectively. Here, λe is the wavelength of the CW feedback light and is assumed to be 1030 nm. The light in the amplifier will be strongly reflected when the end face or the fusion point is abnormal, such as in the case of plane cutting, fusion bubbles, or fiber breakages. In the direction of the signal, the reflected light is primarily the signal because the peak power of the amplified signal is much larger than the ASE. In the backward direction, most of the reflected light is still the signal caused by backward Rayleigh scattering. To analyze the influence of these reflections on the amplifier, extra feedback parameters are introduced to describe the power proportion of the reflections at both ends of the gain fiber, which are marked as “Backward Refection (BR)” and “Forward Refection (FR)” in Figure 1a, respectively. These parameters, BR and FR, are named according to the direction of the reflected light. For example, BR indicates the proportion of power reflected at z = L. The boundary conditions for analyzing the influence of end reflection are shown in Equation (7):
On the basis of the output simulation, the thermal distribution of the gain fiber can be analyzed by combining the heat conduction equations and rate equations. The thermal distribution model is illustrated in Figure 1b. The radii of the fiber core, cladding, and coating layer are denoted by a, b, and c, respectively. Since the surface-to-volume ratio of the fiber is large, the thermal distribution in the length direction should be considered. The heat conduction equation in column coordinates is simplified in Equation (8) [24]:
T, K, and Q are the temperature, thermal conductivity, and heat density distribution in the fiber, respectively. Compared with the rapidly changing optical field, the thermal effect generated by PW light with low average power can be ignored because of the slow heat transfer process. In the CW feedback condition, the doped core of the gain fiber is the main heat source, and its heat density is expressed as (9):
S is the heat-producing area within the fiber, which is approximated as the core area. ω is the mode field radius. β is the normalization constant whose expression is referred to in [24]. The linear heat density QL(z) is defined as the heat generated along the entire length. The expression is , where ηc is the quantum efficiency, ηc ≈ λp/λs. ΔPabs is the absorbed pump within the fiber length determined by z and z + dz. The temperature at the center r = 0 should be a finite value, and the temperature and its gradient at the interface of each layer are continuous. The temperature between the surface of the outer cladding and the external ambient temperature satisfies Newton’s cooling law, and the temperature distribution of the gain fiber can be simply expressed as follows:
where T0 is the ambient temperature, H is the surface heat transfer coefficient, and Kac is the thermal conductivity of the cladding and the outside space. The other parameters of the thermal simulation are referred to in the literature [24]. The rate equation and the temperature distribution equation are solved together by the modified L-W finite difference method [25]. Several iterations are required for the analysis of the reflection situation. The boundary conditions (7) should be taken into account for each calculation, except the first. The iterative calculation is stopped until the difference in the output power is less than 10−4.
3. Results and Discussion
3.1. The Temperature Distribution with CW Signal Feedback
The influence of the CW feedback signal with mW-level power on the gain of the amplifier and the thermal distribution is analyzed, assuming extra CW signal feedback caused by a broken isolator. The comparison of the waveform between the seed and the amplified signal without feedback is shown in Figure 2a. The seed signal is a square wave with a pulse width of 50 ns, while the pulse width of the amplified signal at 40 W pump power is 32 ns. The average power evolution with different forward feedback light (FL) power is plotted in Figure 2b. Because the thermal effect is mainly related to the average power, and the feedback light is less than the peak power of the signal, the simulation focuses on the average output power. The launched average power of the amplifier without the CW feedback signal is 31.1 W, and the corresponding optical-to-optical conversion efficiency is about 75%. However, the amplification efficiency drops sharply as more FL enters the gain fiber. Just 1 mW of FL injected into the amplifier can reduce the average power to 22.06 W. The reduction trend of the average power is positively correlated with the FL power. When the FL increases over 50 mW, the launched output power is 2.17 W, and the corresponding efficiency is only 5.4%.
The thermal distributions of the gain fiber with different FL power along the fiber length are calculated and shown in Figure 3a. The core temperature of the gain fiber in normal conditions shows a trend of rising and then falling. The highest temperature position is located 25.3 cm from the signal input end z = 0. The peak value of the temperature curve is 106.6 °C. When the FL is coupled to the fiber, the position of the peak temperature moves toward the input end as the FL power increases, and the peak temperature also rises with the FL power. The peak temperature and its location are plotted as a function of the FL power in Figure 3b. The peak temperature and its corresponding position display an approximately opposite trend when the FL power increases. When the injected optical power exceeds 500 mW, the temperature peak point appears at the z = 0 position and the maximum temperature reaches 125.4 °C. The consumption of the upper-level population by the FL is the primary reason for this phenomenon, since it reduces gain and leads to more heat generation. Higher FL power means more pump consumption and a faster speed of consumption. The extra heat generated in this process causes the temperature distribution to move toward the input end. It should be noted that Figure 3a,b only give the core temperature results. Figure 3c illustrates the temperature distribution in the radial direction at the highest temperature position. Even if the axial temperature changes under the influence of injected light, the radial temperature will change in equal proportion under constant external heat dissipation conditions. Therefore, the following temperature analysis focuses on the gain fiber axial temperature distribution.
The temperature distribution of the amplifier with the backward CW signal feedback is theoretically analyzed and shown in Figure 4. The power variations in the signal along the fiber length with different BL power are shown in Figure 4a. Like the FL injection, the CW backward feedback lights can also reduce the gain of the amplifier. The output signal power decreases from 30 W to 28 W when 10 mW of BL is injected into the gain fiber. Only 7.87 W of signal light can be launched when the BL power is 500 mW. The influence of BL in reducing the gain is less than that of FL due to the limited number of residual upper-level populations at the end of the gain fiber. The degree of output power reduction is positively associated with feedback intensity because of the gain competition between the signal and CW feedback light [26]. The further influence of BL on the temperature distribution is analyzed and shown in Figure 4b. The temperature at z = 0 increases by more than 100 °C when the BL power grows from 0 mW to 500 mW. Additionally, the temperature value at the hottest position increases from 106 °C to 141 °C. The position of the highest temperature moves slowly toward the input end during this temperature increase process. It is worth noting that during this process two extreme temperature points will appear on the fiber when the BL power is about 10 mW. This means there are two simultaneous “heat spots” separated by a distance of over 20 cm on the fiber. As Figure 4b shows, the temperature is 99 °C at the two extreme points of the fiber at z = 0 and z = 28 cm when the BL power is 10 mW. This situation should be considered in the thermal management of the fiber amplifier. By analyzing the influence of FL and BL injection on fiber temperature, it can be demonstrated that the injected light will reduce gain and move the position of the highest temperature either forward or backward. This result provides a theoretical reference for optimizing the design of the thermal management structures of high-power fiber amplifiers.
3.2. The Pulse Waveform Evolution with PW Signal Feedback
In the case of extra PW signal feedback caused by the end reflection, the boundary condition (7) is considered in the calculation. In general, substandard end-face cutting, fiber stress damage, fusion bubbles, excessive material differences between the two fused fiber segments, etc., will cause a sudden change in RI. The reflection caused by the interface of changed RI is not selective for wavelength. When the reflection is generated at z = L, the main reflected light is the signal light because the power of the signal is much higher than that of the ASE. The reflected light includes the reflected signal and the Rayleigh scattered signal light. The extra feedback caused by the end reflection can be considered as the extra PW signal feedback. The power evolution of an amplified pulsed signal sequence with a frequency of 20 kHz, when taking the FR and the BR as 0.5, is shown in Figure 5a. The amplified signal has a peak power of 48.6 kW in a normal situation (without reflection feedback). The peak powers with backward and forward reflection are 23.4 kW and 40.2 kW, respectively. The PW signal feedback reduces the gain significantly because of gain competition [26]. Because the gain reduction due to forward reflection is weaker than that of backward reflection, the intensity of the forward-reflected light from the Rayleigh scattering is lower. The pulse waveform is expanded in the time domain when the time exceeds the upper-level lifetime of Yb, which is shown in Figure 5b. The forward and backward reflection feedback signals have opposite effects on the pulse shape. Forward reflection makes the leading edge steeper and causes the peak position to appear earlier, while backward reflection makes the trailing edge steeper and the peak of the pulse appears later. This is related to the differences in the residual population inversion at both ends of the fiber. The forward reflection case is analyzed here as an example. There are two main reasons for the evolution of pulse shape. First, the signal power is boosted along the propagation direction, and the signal power near the input end is relatively low. A sufficient residual population inversion near the input end can provide enough gain to mitigate the influence of the forward-reflected feedback signal. Second, the forward-reflected feedback signal at the input end has a relatively low power because it is generated by the backscattered signal lights. The low power and weak gain competition allow for little power reduction with forward-reflected feedback and limited amplification only at the trailing edge. In contrast, the backward-reflected feedback signal generated at the output end has a relatively high power and a stronger gain competition environment than that of the forward-reflected feedback signal. If backward reflection occurs, the signal gain is reduced more obviously and the gain reduction phenomenon exists throughout the pulse duration.
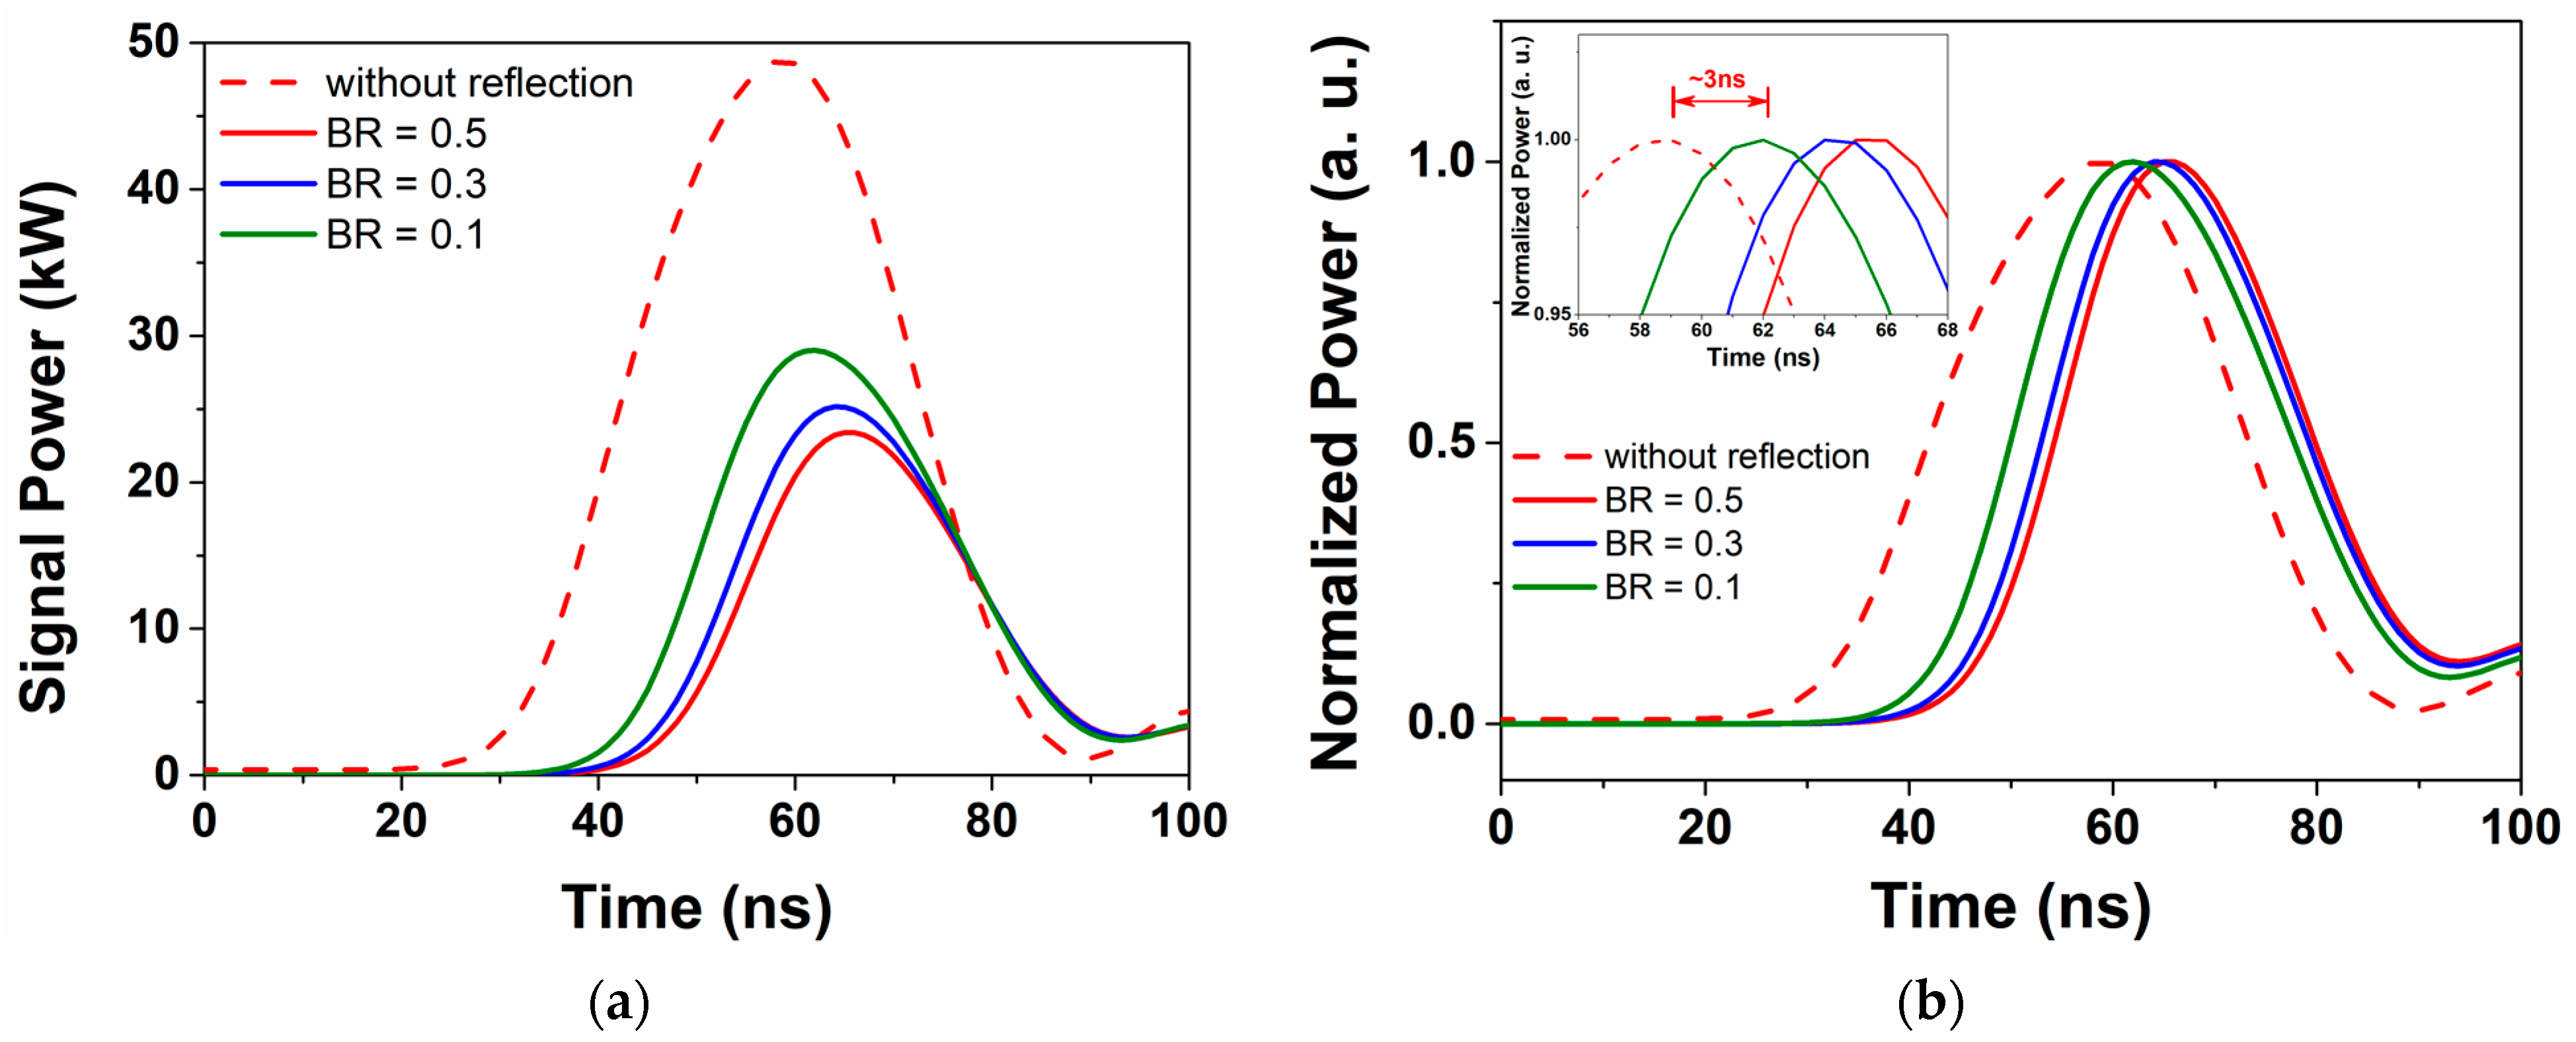
The evolutions of the pulse waveform with different FR are analyzed and shown in Figure 6a. During the reduction of FR from 0.1 to 0.5, the peak power of the amplified pulse decreases by 7%, from 42.9 kW to 40.2 kW. The gain attenuation is proportional to the intensity of the reflection feedback. A stronger PW feedback light means a higher number of upper-level population inversions being consumed. The pulse waveforms are normalized and magnified in the time domain for comparison, as shown in Figure 6b. The insertion is the magnified waveform near the pulse peak. The forward PW feedback makes the peak of the pulse appear earlier. The peak of the amplified pulse exceeds what is typical by about 4 ns, and for every 20% increase in FR, the pulse peak moves forward by about 1 ns. The influence of backward reflection on the evolution of the pulse waveform is analyzed in the same way. The backward-reflected feedback has the same effect as the forward-reflected feedback on the gain of the amplifier, as is shown in Figure 7a. Backward reflection has more of an influence on the gain than forward reflection. When the BR is 0.5, the peak power of the pulsed output is 23.4 kW, which is 16.8 kW lower than the peak power at FR = 0.5. This is mainly due to the stronger feedback signal power and the lower residual upper-level population inversion, which has been discussed above. The backward reflection feedback also has an obvious influence on the waveform. The output pulse waveforms for different BR are normalized and compared in Figure 7b. The expanded waveform near the peak is plotted in the insertion. The peak position is delayed by more than 3 ns compared with what is normal. The delay of the pulse peak is positively correlated with the BR feedback intensity.
Because of the influence of the PW feedback signal on the waveform and the gain, the position and peak power of the output will temporally jitter if there is a reflection on the fiber. The stability of the amplifier drastically decreases as a result of the vibration of the output pulse. Similarly, if the real working amplifier were to suffer an incident that caused extra reflections, such as fiber breakage, stress damage, or thermal fusion, this pulse instability would provide an optional path for amplifier stability diagnosis. According to the jitter of the output pulse, the damage from the accident could be reduced by dynamic adjustment of the seed laser, pump power, or heat dissipation conditions. This would help to improve the robustness and stability of the amplifier. In addition, the influence of the PW feedback signal on the temperature distribution of the gain fiber can be analyzed by using the CW feedback signal calculation method mentioned above. The temperature distribution can be calculated by converting the PW signal intensity into the average power of the CW signal. The conclusions obtained from the CW signal feedback also apply to the PW signal feedback.
4. Conclusions
In conclusion, extra feedback signals, either CW or PW, will appear in the real operating fiber amplifier when one or more fiber components have lost efficacy. The stability of the amplifier is significantly decreased by these extra signals. The influence of these feedback lights on fiber temperature and pulse waveform was investigated in this work while considering the actual working situation of the amplifier. The simulation results demonstrate that the extra feedback light decreases the gain. Moreover, the gain fiber temperature is mostly influenced by the CW feedback light. The temperature peak moves toward the input end when there is a CW feedback light in the fiber, and the thermal distribution may have two extreme points if the feedback light is propagating in the backward direction. The pulse feedback light primarily impacts the output pulse waveform, and the forward PW feedback light can narrow the leading edge of the pulse while the trailing edge can be reduced by the backward PW feedback light. The results of this theoretical analysis demonstrate the reasons for the deterioration of amplifier output which occur following accidents, and they provide a reference for optimizing the heat dissipation structures of amplifiers. In addition, the influence of component failure on the output characteristics was analyzed, providing a reference for amplifier fault diagnosis.
Author Contributions
Conceptualization, X.B.; software, X.B. and M.W.; investigation, X.B., X.C. and C.T.; writing—original draft, X.C.; writing—review and editing, X.B. All authors have read and agreed to the published version of the manuscript.
Funding
This work was supported by the National Natural Science Foundation of China (62265013), the Key Technology Research Projects in the Inner Mongolia Autonomous Region (2021GG0274), and the Natural Science Foundation of the Inner Mongolia Autonomous Region of China (2020BS06002, 2021BS06002).
Institutional Review Board Statement
Not applicable.
Informed Consent Statement
Not applicable.
Data Availability Statement
Data will be made available on request.
Conflicts of Interest
The authors declare no conflict of interest.
References
- Shi, W.; Fang, Q.; Zhu, X.; Norwood, R.A.; Peyghambarian, N. Fiber lasers and their applications. Appl. Opt. 2014, 53, 6554–6568. [Google Scholar] [CrossRef] [PubMed]
- Zervas, M.N.; Codemard, C.A. High Power Fiber Lasers: A Review. IEEE J. Sel. Top. Quantum Electron. 2014, 20, 219–241. [Google Scholar] [CrossRef]
- Fu, S.; Shi, W.; Feng, Y.; Zhang, L.; Yang, Z.; Xu, S.; Zhu, X.; Norwood, R.A.; Peyghambarian, N. Review of recent progress on single-frequency fiber lasers. J. Opt. Soc. Am. B 2017, 34, A49–A62. [Google Scholar] [CrossRef]
- Li, Y.; Deng, X.; Fu, S.; Sheng, Q.; Shi, C.; Zhang, J.; Zhang, L.; Shi, W.; Yao, J. High-power, high-efficiency single-frequency DBR fiber laser at 1064 nm based on Yb(3+)-doped silica fiber. Opt. Lett. 2023, 48, 598–601. [Google Scholar] [CrossRef]
- Meijer, J. Laser beam machining (LBM), state of the art and new opportunities. J. Mater. Process. Technol. 2004, 149, 2–17. [Google Scholar] [CrossRef]
- Zhang, H.; Wang, X.; Zhou, P.; Gong, Z.; Xu, X. 6 mJ, high-average-power, all-fiberized Q-switched fiber master oscillator power amplifier with low repetition rate. Appl. Opt. 2012, 29, 6933–6936. [Google Scholar] [CrossRef]
- Fang, Q.; Qin, Y.; Wang, B.; Shi, W. 11 mJ all-fiber-based activelyQ-switched fiber master oscillator power amplifier. Laser Phys. Lett. 2013, 10, 115103. [Google Scholar] [CrossRef]
- Zhang, H.; Shen, X.; Chen, D.; Zheng, C.; Yan, P.; Gong, M. High Energy and High Peak Power Nanosecond Pulses Generated by Fiber Amplifier. IEEE Photonics Technol. Lett. 2014, 26, 2295–2298. [Google Scholar] [CrossRef]
- Shen, X.; Zhang, H.; Gong, M. High Energy (100 mJ) and High Peak Power (8 MW) Nanosecond Pulses Delivered by Fiber Lasers and Self-Focusing Analysis Based on a Novel Mode Decomposition Method. IEEE J. Sel. Top. Quantum Electron. 2018, 24, 1–6. [Google Scholar] [CrossRef]
- Yong, W. Heat dissipation in kilowatt fiber power amplifiers. IEEE J. Quantum Electron. 2004, 40, 731–740. [Google Scholar] [CrossRef]
- Brown, D.C.; Hoffman, H.J. Thermal, stress, and thermal-optic effects in high average power double-clad silica fiber lasers. IEEE J. Quantum Electron. 2001, 37, 207–217. [Google Scholar] [CrossRef]
- Fan, Y.; He, B.; Zhou, J.; Zheng, J.; Liu, H.; Wei, Y.; Dong, J.; Lou, Q. Thermal effects in kilowatt all-fiber MOPA. Opt. Express 2011, 19, 15162–15172. [Google Scholar] [CrossRef] [PubMed]
- Pask, H.; Carman, R.; Hanna, D.; Tropper, A.; Mackechnie, C.; Barber, P.; Dawes, J. Ytterbium-doped silica fiber lasers versatile sources for the 1–1.2 μm region. IEEE J. Quantum Electron. 1995, 1, 2–13. [Google Scholar] [CrossRef] [Green Version]
- Yu, W.; Yan, P.; Qi, T.; Wu, Y.; Li, D.; Xiao, Q.; Gong, M. High-power and high-brightness Er:Yb codoped fiber MOPA operating at 1535 nm. Opt. Express 2022, 30, 16837. [Google Scholar] [CrossRef]
- Shuto, Y. Evaluation of High-Temperature Absorption Coefficients of Ionized Gas Plasmas in Optical Fibers. IEEE Photonics Technol. Lett. 2010, 22, 134–136. [Google Scholar] [CrossRef]
- Facao, M.; Rocha, A.M.; de Brito Andre, P.S. Traveling Solutions of the Fuse Effect in Optical Fibers. J. Light. Technol. 2011, 29, 109–114. [Google Scholar] [CrossRef]
- Otto, H.-J.; Stutzki, F.; Jansen], F.; Eidam], T.; Jauregui, C.; Limpert, J.; Tünnermann, A. Temporal dynamics of mode instabilities in high-power fiber lasers and amplifiers. Opt. Express 2012, 20, 15710–15722. [Google Scholar] [CrossRef] [Green Version]
- Jauregui, C.; Otto, H.J.; Stutzki, F.; Limpert, J.; Tunnermann, A. Simplified modelling the mode instability threshold of high power fiber amplifiers in the presence of photodarkening. Opt. Express 2015, 23, 20203–20218. [Google Scholar] [CrossRef]
- Smith, A.V.; Smith, J.J. Overview of a Steady-Periodic Model of Modal Instability in Fiber Amplifiers. IEEE J. Sel. Top. Quantum Electron. 2014, 20, 472–483. [Google Scholar] [CrossRef]
- Zhu, X.; Schülzgen, A.; Li, H.; Li, L.; Han, L.; Moloney, J.V.; Peyghambarian, N. Detailed investigation of self-imaging in largecore multimode optical fibers for application in fiber lasers and amplifiers. Opt. Express 2008, 16, 16632–16645. [Google Scholar] [CrossRef]
- Kelson, I.; Amos, A. Hardy. Strongly pumped fiber lasers. J. Light. Technol. 1998, 34, 1570–1577. [Google Scholar] [CrossRef]
- Yong, W.; Hong, P. Dynamic characteristics of double-clad fiber amplifiers for high-power pulse amplification. J. Light. Technol. 2003, 21, 2262–2270. [Google Scholar] [CrossRef]
- Liu, M.; Shum, P.P.; Xiong, Z.; Zhang, B.M.; Cheng, X. Dynamics of nanosecond pulsed pump ytterbium-doped double-clad fiber amplifier. Opt. Commun. 2017, 403, 325–329. [Google Scholar] [CrossRef]
- Mohammed, Z.; Saghafifar, H.; Soltanolkotabi, M. An approximate analytical model for temperature and power distribution in high-power Yb-doped double-clad fiber lasers. Laser Phys. 2014, 24, 115107–115118. [Google Scholar] [CrossRef]
- Han, Q.; Liu, T.; Lü, X.; Ren, K. Numerical methods for high-power Er/Yb-codoped fiber amplifiers. Opt. Quantum Electron. 2014, 47, 2199–2212. [Google Scholar] [CrossRef]
- Bi, M.; Zhang, H.; Zhao, Y.; Xue, L.; Jiang, P.; Bai, Y.; Miao, Y.; Shi, W.; Yao, J. Theoretical and Experimental Investigation of Intracavity Displacement-Sensor Based on All-Single-Mode Fiber. J. Light. Technol. 2022, 40, 2585–2593. [Google Scholar] [CrossRef]
Figure 1.
(a) Theoretical YDFA model shown in the axial direction. (b) Temperature distribution model shown in the radius direction of the gain fiber.
Figure 1.
(a) Theoretical YDFA model shown in the axial direction. (b) Temperature distribution model shown in the radius direction of the gain fiber.
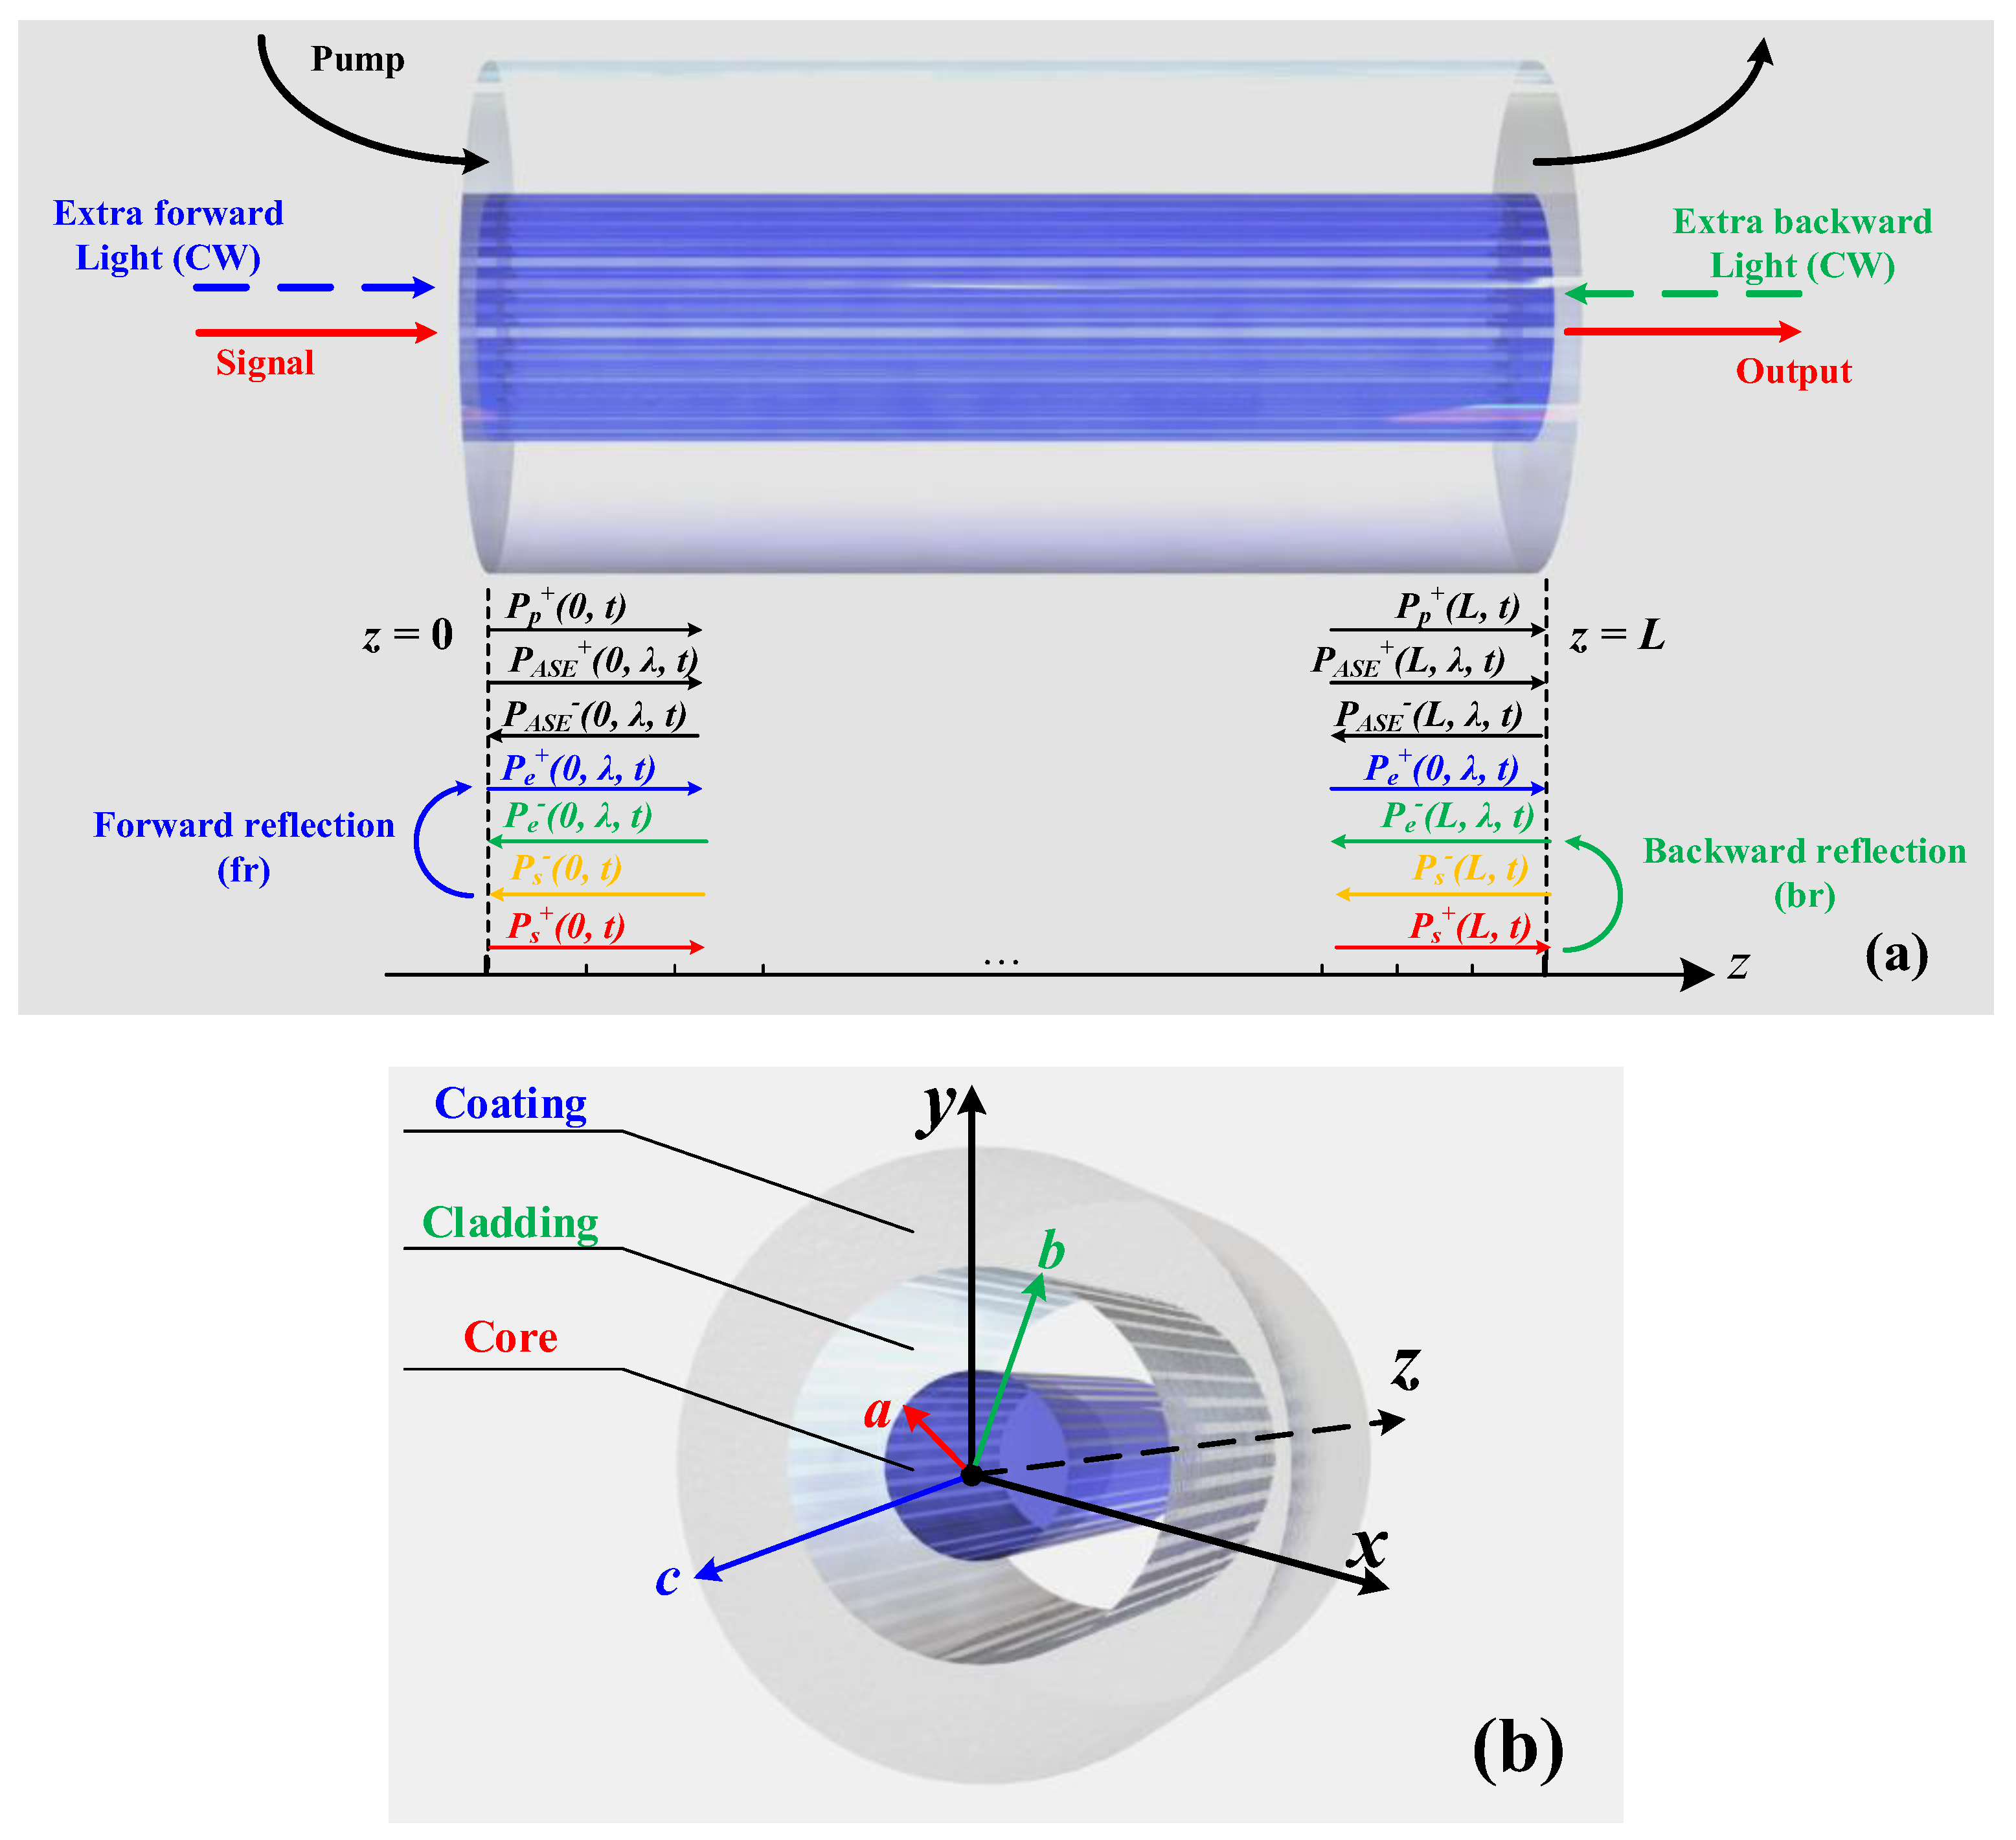
Figure 2.
(a) The waveform of the seed and the amplified signal. (b) The average power evolution with varying FL power.
Figure 2.
(a) The waveform of the seed and the amplified signal. (b) The average power evolution with varying FL power.
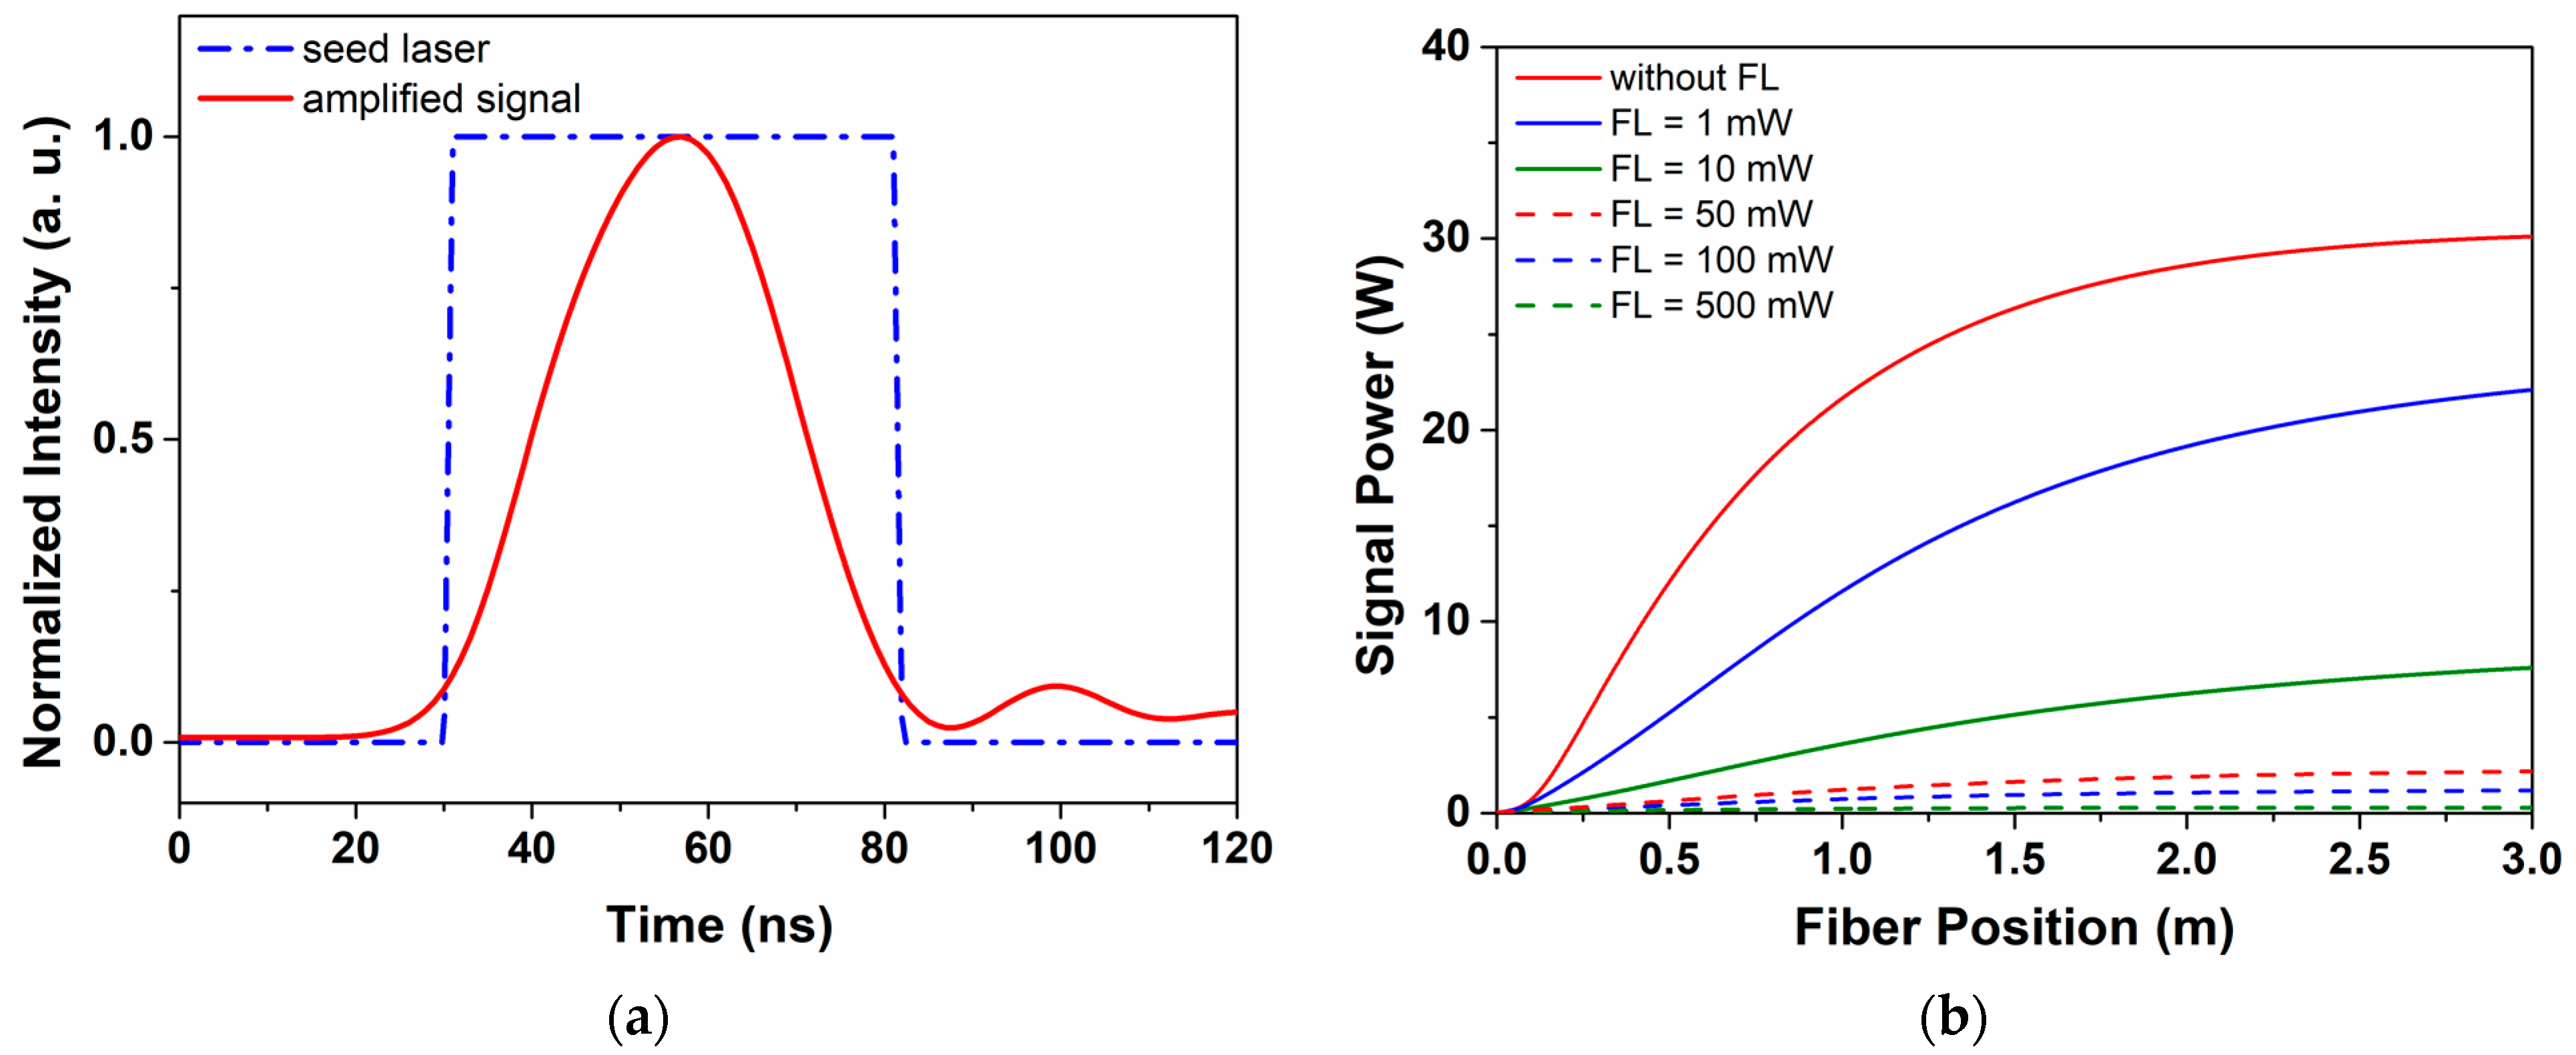
Figure 3.
(a) The core temperature distributions of the gain fiber with different FL power. (b) Peak temperature and its location as a function of the FL power. (c) Fiber radial temperature distribution in the absence of the FL.
Figure 3.
(a) The core temperature distributions of the gain fiber with different FL power. (b) Peak temperature and its location as a function of the FL power. (c) Fiber radial temperature distribution in the absence of the FL.

Figure 4.
(a) the average power evolution with different BL power. (b) Temperature distribution of gain fiber with different BL power.
Figure 4.
(a) the average power evolution with different BL power. (b) Temperature distribution of gain fiber with different BL power.
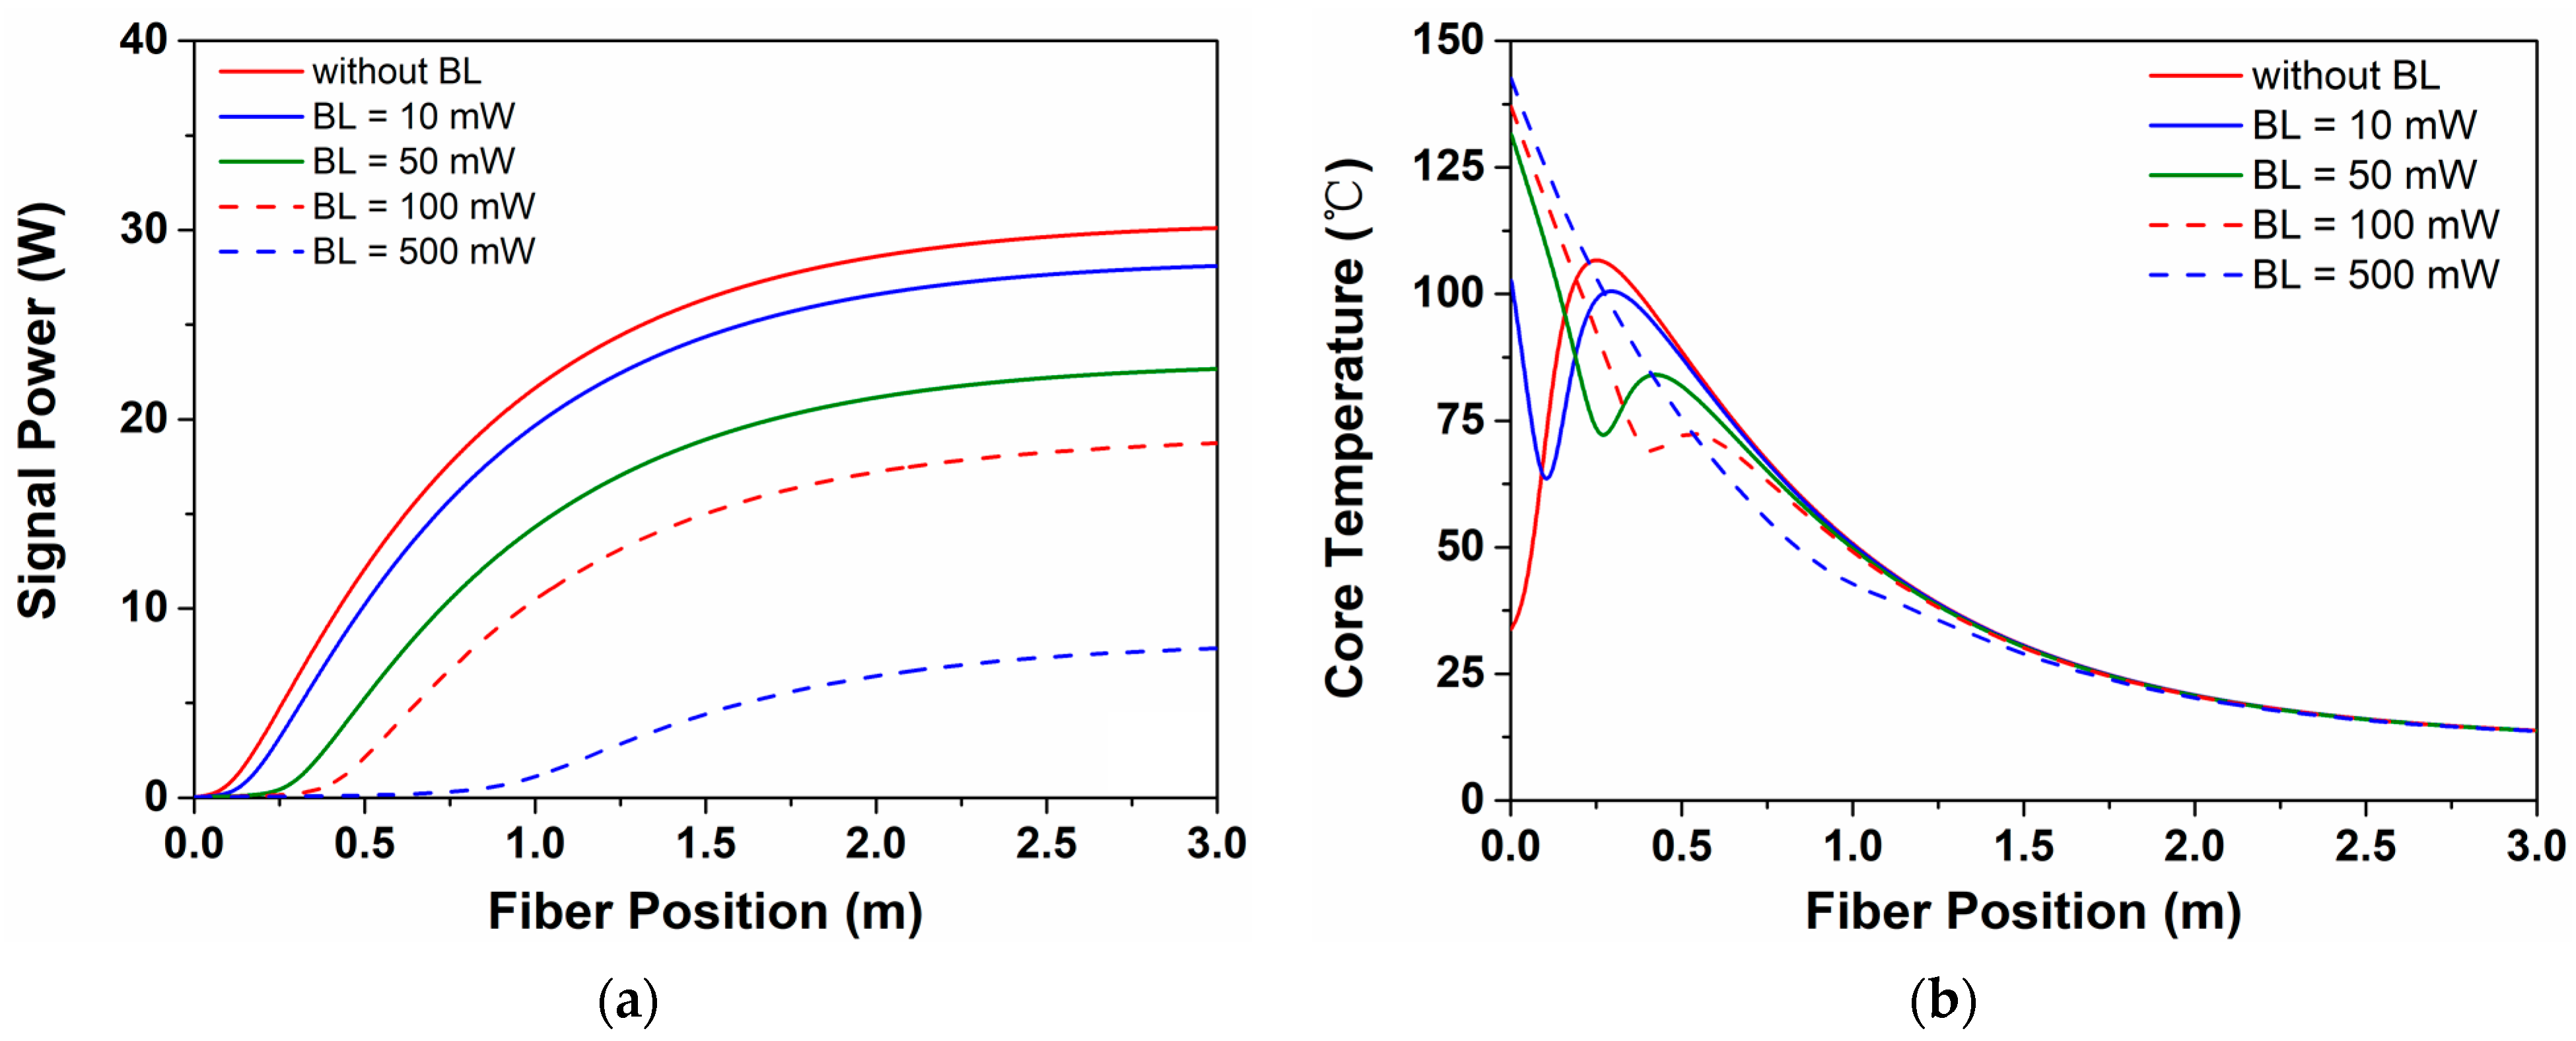
Figure 5.
(a) The power evolution of the amplified pulsed signal sequence with and without reflection. (b) The waveform of the amplified pulsed with and without reflection.
Figure 5.
(a) The power evolution of the amplified pulsed signal sequence with and without reflection. (b) The waveform of the amplified pulsed with and without reflection.

Figure 6.
(a) The evolutions of the pulse waveforms with different FR. (b) The normalized pulse waveforms with different FR. The insertion is a magnification of the waveform near the pulse peak.
Figure 6.
(a) The evolutions of the pulse waveforms with different FR. (b) The normalized pulse waveforms with different FR. The insertion is a magnification of the waveform near the pulse peak.

Figure 7.
(a) The evolutions of the pulse waveforms with different BR. (b) The normalized pulse waveforms with different BR. The insertion is a magnification of the waveform near the pulse peak.
Figure 7.
(a) The evolutions of the pulse waveforms with different BR. (b) The normalized pulse waveforms with different BR. The insertion is a magnification of the waveform near the pulse peak.
Disclaimer/Publisher’s Note: The statements, opinions and data contained in all publications are solely those of the individual author(s) and contributor(s) and not of MDPI and/or the editor(s). MDPI and/or the editor(s) disclaim responsibility for any injury to people or property resulting from any ideas, methods, instructions or products referred to in the content. |
© 2023 by the authors. Licensee MDPI, Basel, Switzerland. This article is an open access article distributed under the terms and conditions of the Creative Commons Attribution (CC BY) license (https://creativecommons.org/licenses/by/4.0/).
Share and Cite
MDPI and ACS Style
Bai, X.; Chen, X.; Tian, C.; Wang, M. Theoretical Analysis of Thermal Distribution and Waveform Evolution in Pulsed Ytterbium-Doped Fiber Amplifier with Extra Feedback. Photonics 2023, 10, 437. https://doi.org/10.3390/photonics10040437
AMA Style
Bai X, Chen X, Tian C, Wang M. Theoretical Analysis of Thermal Distribution and Waveform Evolution in Pulsed Ytterbium-Doped Fiber Amplifier with Extra Feedback. Photonics. 2023; 10(4):437. https://doi.org/10.3390/photonics10040437
Chicago/Turabian StyleBai, Xiaolei, Xuening Chen, Chuan Tian, and Meng Wang. 2023. "Theoretical Analysis of Thermal Distribution and Waveform Evolution in Pulsed Ytterbium-Doped Fiber Amplifier with Extra Feedback" Photonics 10, no. 4: 437. https://doi.org/10.3390/photonics10040437
Note that from the first issue of 2016, this journal uses article numbers instead of page numbers. See further details here.