1. Introduction
Microwave parameter measurement plays an indispensable role in radar, military operations, and communication systems [
1,
2,
3,
4]. Doppler frequency shift (DFS) and angle of arrival (AOA) are two important variables among the different parameters of microwave signals. By using these two parameters, the direction, position and velocity of targets can be obtained [
1]. DFS and AOA measurements based on microwave photonics have received widespread attention in recent years. Due to the inherent characteristics of the electro-optical crystal, compared with the microwave system, the microwave photonic link has problems such as large insertion loss, which requires progress in materials to compensate. However, microwave photonics also have great advantages, such as large bandwidth and anti-electromagnetic interference characteristics, which will obtain higher accuracy in high-frequency measurement. This cannot be achieved by microwave systems. Therefore, conducting research on microwave photonic measurement technology is of great significance.
Due to such technical bottlenecks as poor system stability, electromagnetic interference, and limited bandwidth, traditional microwave methods feature limited operating frequency range and measurement accuracy. The microwave photonic method combines the superiorities of photonics and electronics, and exhibits the characteristics of low-frequency dependent loss, wide operating bandwidth, and anti-electromagnetic interference [
5].
Recently, scholars have undertaken a lot of work on microwave photonic measurement technology. In the schemes of simultaneous measurement of DFS and AOA [
6,
7,
8,
9,
10,
11,
12,
13,
14,
15], by frequency downconversion, the DFS value is obtained from intermediate-frequency (IF) signals, and there are two main methods for determining the DFS direction. The first way is based on a reference signal with a frequency shift, which adds a small frequency shift to the transmitted signal [
6,
7,
8,
9,
10,
11]. However, the flexibility and adjustability of the system are thus affected. In addition, due to the limitations of the extinction ratio and bias control accuracy of the modulator, low-frequency interference is likely to be introduced along with the reference signal, especially in multitarget detection. Another method is to determine the direction of DFS by performing phase waveform analysis between the two generated electrical signals [
12,
13,
14,
15], which requires complex back-end waveform analysis and increases the complexity of the system. The optical phase shift controlled by polarization can also reduce the stability of the system.
In terms of AOA measurement, two main methods have gained widespread attention. The first way is to compare the phase relationship between the two generated electrical IF signals [
10,
12,
13,
14,
15], which can mostly be used for DFS direction determination simultaneously. The second method is to construct an amplitude comparison function (ACF). In [
7,
8], an ACF is constructed based on the power ratio of the IF signals, forming a mapping relationship related to the phase difference, thereby obtaining the AOA. In [
9], the AOA is calculated based on the power of two IF signals, with one channel serving as the measurement channel, while the other channel is used to solve the phase ambiguity problem. The AOA measurement is achieved by calculating the electrical signal power in [
11], which introduces an additional phase shift between reference signals. However, the structure is complex and has not been experimentally verified. In addition, there are some other problems, including phase imbalance and carrier leakage [
8].
In electronic warfare applications, the microwave receiver is faced with the danger of being detected by the enemy; however, the distance between the remote antenna unit (RAU) and the central office (CO) of most measurement systems is relatively close. On this condition, the entire measurement system may be destroyed. Therefore, through long-distance optical fiber transmission, the microwave signal receiving system can be effectively isolated from the central station.
In this paper, a microwave photonic measurement scheme based on an integrated dual-parallel dual-drive Mach–Zehnder modulator (DP-DDMZM) is proposed. The main advantages are as follows. Firstly, the scheme does not require additional frequency shift reference signals or complex back-end waveform analysis to identify the direction of DFS. Secondly, the scheme is suitable for long distance links and is immune to the periodic power fading. Thirdly, the structure is simple and stable, as none of the polarization devices are used in the system. In the experimental demonstration of DFS measurement, a measurement error lower than 0.25 Hz is achieved. The AOA can also be estimated with a maximum phase difference error of ±1.5 degree. The proposed scheme has great application prospects in electronic warfare and military operations.
2. Principle
The proposed photonic microwave measurement system is shown in
Figure 1. A continuous-wave light is generated from a laser diode (LD) as the optical carrier, and the carrier is then sent to the DP-DDMZM. The DP-DDMZM includes two dual-drive Mach–Zehnder modulators (DDMZMs): an optical splitter and an optical coupler. In the DDMZM1, the carrier is modulated by two echo radio frequency (RF) signals, while in the DDMZM2, the carrier is modulated by the transmitted RF signal. The main modulator of the DP-DDMZM works at the maximum point to combine the two light waves, then an optical band pass filter (OBPF) is used to filter out the optical carrier and one of the sidebands, and finally, after transmission over the single-mode fiber (SMF), the optical signal is detected by a photodiode (PD).
The optical carrier can be written as
Ein(
t) =
Ec exp(
j2
πfct), where
fc and
Ec are the frequency and amplitude. The two echo signals can be expressed as
Ve cos(2
πfet) and
Ve cos(2
πfet +
φ), where
Ve is the amplitude,
fe is the frequency, and
φ represents the phase difference of the two echo signals. The DDMZM1 works at the minimum point, so the modulated optical signal output from the DDMZM1 can be given by:
where
αD1 represents the optical insertion loss of the DDMZM1,
me =
πVe/
Vπ is the modulation index in the DDMZM1,
Vπ is the half wave voltage, and
Jn (·) represents the
nth-order Bessel function of the first kind. Considering the limited modulation index, the higher-order Bessel functions are ignored.
The DC port of DDMZM2 is driven by a low-frequency sawtooth wave, which has an amplitude twice of the half-wave voltage to implement the optical frequency shift. The transmitted signal is injected into the DDMZM2 to modulate the optical carrier and achieve a frequency shift, which uses only one RF port and the other RF port is left empty. The transmitted signal is expressed as
Vt cos(2
πftt), where
Vt is the amplitude and
ft is the frequency. Then, the modulated signal after the DDMZM2 can be expressed as:
where
αD1 is the optical insertion loss of the DDMZM2,
mt =
πVt/
Vπ is the modulation index of the transmitted signal in the DDMZM2 and
fr is the frequency shift introduced by the sawtooth wave.
The main modulator of the DP-DDMZM works at the maximum point to combine the two light waves, then the combined signal is injected into the OBPF. The optical carrier and the negative first-order sideband of the optical signal are filtered out, so the system is immune to the power fading, which is introduced by the destructive interference of the two sidebands. The signals can be rewritten as:
where
αOBPF is the optical insertion loss of the OBPF. After transmission over the SMF, the optical field can be given by:
where
γ1 and
γ2 are the dispersion-induced phases of the modulated echo signals and transmitted signals.
Then, the optical signal enters the PD for photodetection, and the output photocurrent can be expressed as:
where
η represents the responsivity of PD and
A +
B(1 − cos
φ) represents the DC component, which contains the phase difference.
C =
αD1αD2 J1 (
mt)
J1 (
me) represents the amplitude of the IF signal, and
fIF =
ft −
fe +
fr represents the IF signals.
According to Equation (5), we can see that the IF terms obtained after frequency conversion contain the information of DFS. By sampling the IF signal and calculating its frequency value, the DFS information can be calculated by the following equation:
According to the above equation, the direction can be clearly determined while acquiring the DFS value, and it is not necessary to use additional reference signals or complex waveform analysis to distinguish the direction of the DFS.
On the other hand, the AOA is related to the phase difference
, which can be given by:
where
ꞇ is the relative time delay of two echo signals,
d is the distance of two antennas,
c is the light speed and
Ɵ is the AOA to be measured.
d is commonly designed as
λ/2, where
λ is the wavelength of the echo signals. Therefore, the AOA can be calculated by:
The DC component obtained after frequency downconversion is directly related to the phase difference. The phase difference, or the AOA, can be obtained by measuring the value of the DC component, as described in the following equation:
where the coefficient is expressed as
,
.
3. Experiment Results
The experiment of the proposed system is set up according to
Figure 1. A low-noise narrow-linewidth tunable laser (Pure photonics (San Jose, CA, USA), PPCL500) is used to obtain a continuous optical carrier with an optical power of 23 mW and connected to the DP-DDMZM (Fujitsu (Tokyo, Japan), FTM7960EX). The half-wave voltage of the DP-DDMZM is 3.5 V, and the operating bandwidth is larger than 30 GHz. Two RF signal sources (Ceyear (Chengdu, China), 1435F) are used to simulate the transmitted signal and echo signal, respectively. The echo signal is then divided into two equal parts. The phase difference can be adjusted by an RF phase shifter, and the two echo signals are injected to the two RF input ports of DDMZM1 in the DP-DDMZM, respectively, as shown in
Figure 1. The transmitted signal is sent to the DDMZM2. An arbitrary waveform generator (Siglent (Shenzhen, China), SDG7102A) is used to generate a 1 MHz sawtooth wave signal, which is injected into the DC port of DDMZM2. Then, the two modulated signals are combined and travel out of the DP-DDMZM. The OBPF (Kylia (Paris, France), mics-PM-8/6.25/F) is used to remove out the optical carrier and the negative-order sideband. Finally, the filtered signal is sent to the PD (Feibo Optoelectronics (Shanghai, China), MPD-M-40-2.92-FA) through an SMF, the length of the SMF is 29.706 km. The DFS information can be calculated after the analogue-to-digital conversion (ADC) of the IF signals.
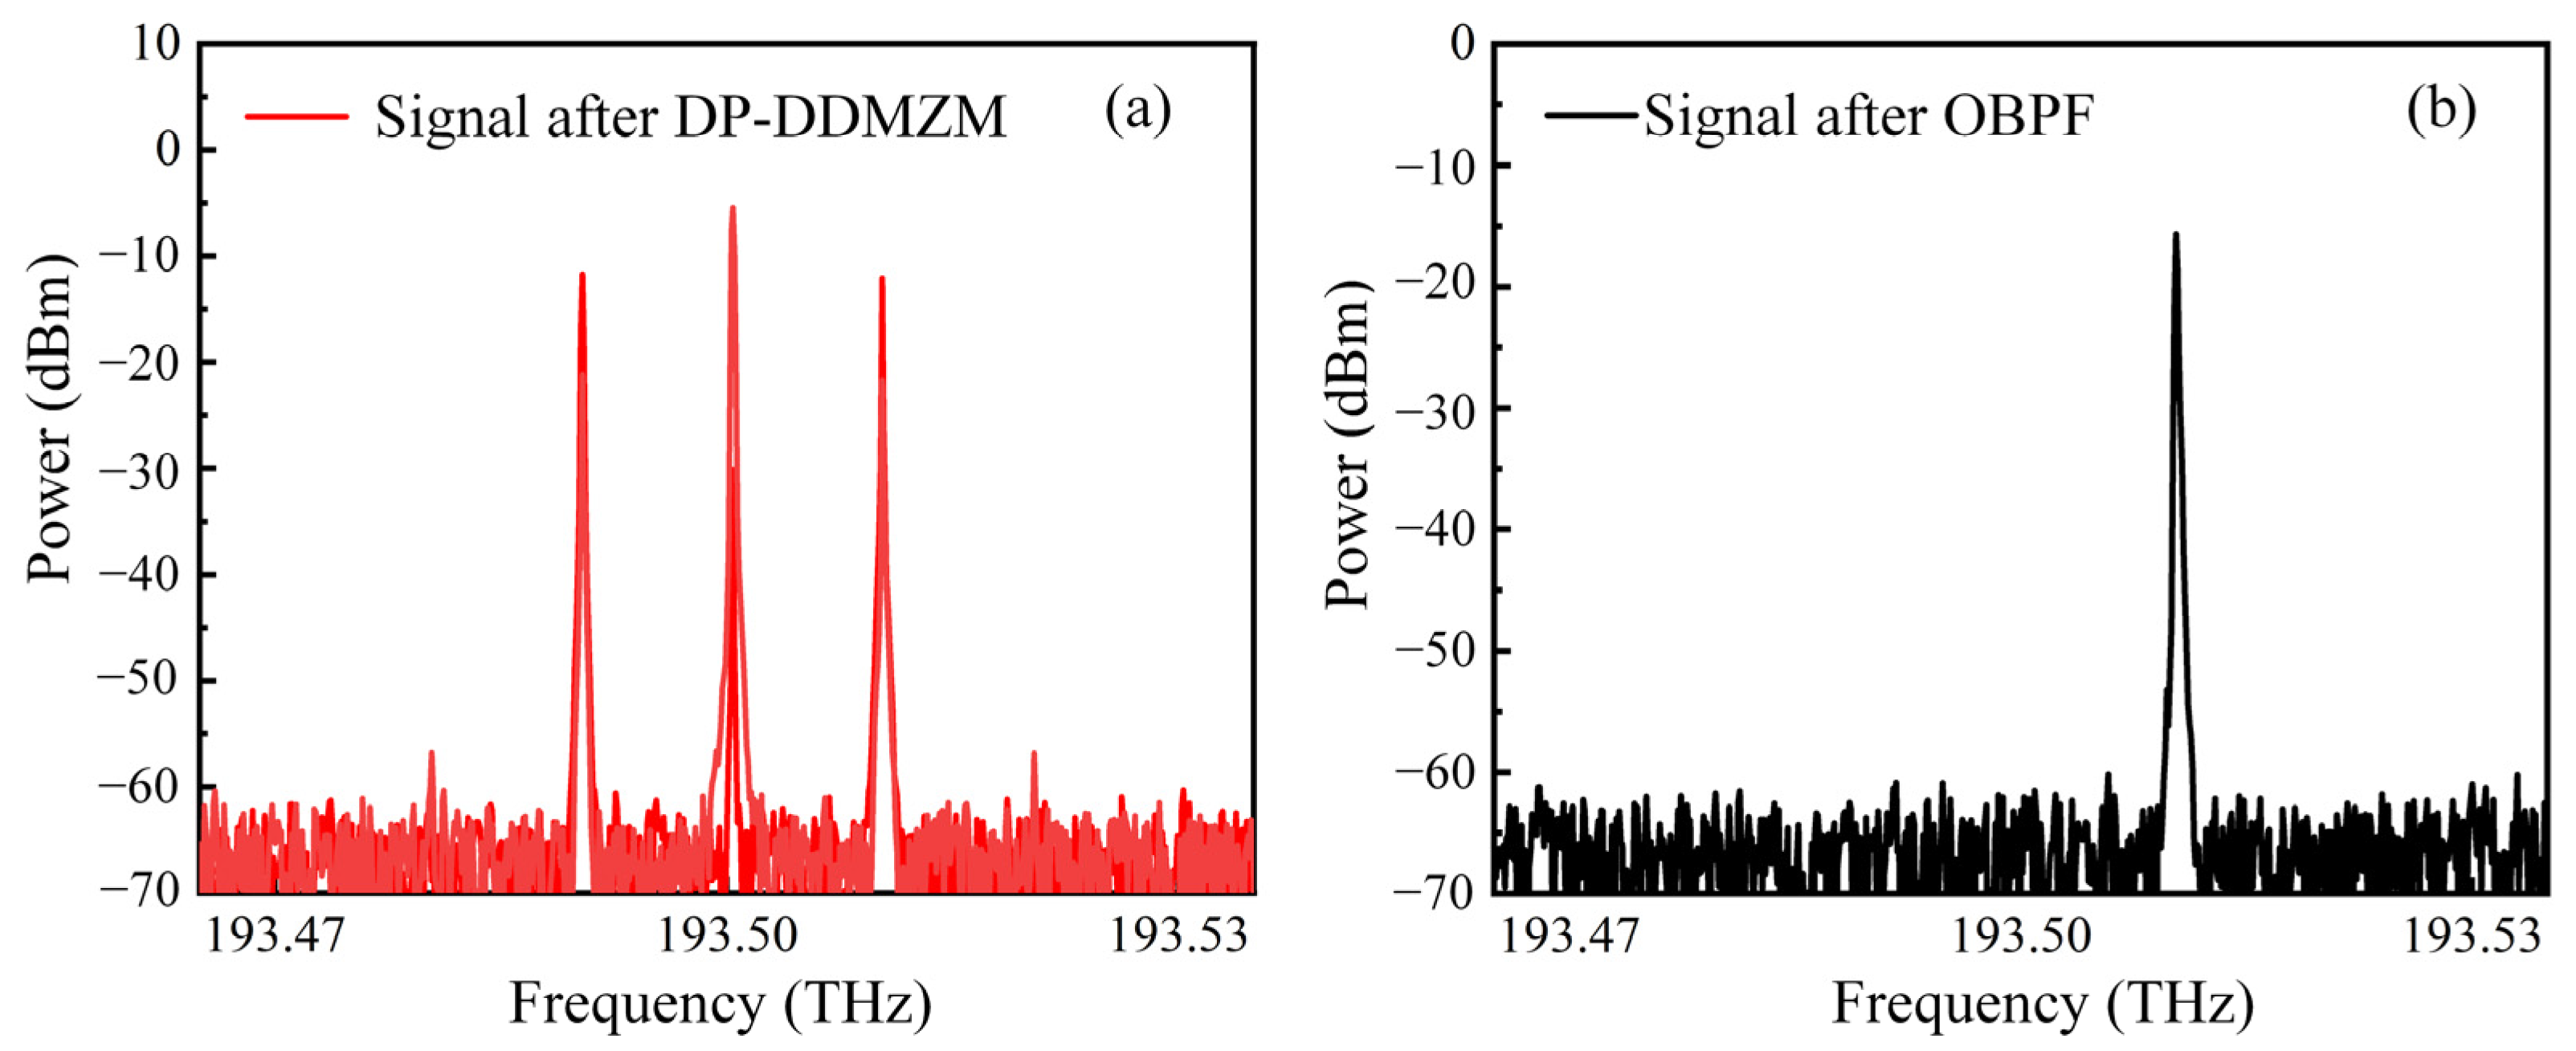
The frequency and power of the transmitted signal are 12 GHz and 10 dBm, respectively. An optical spectrum analyzer (Finisar (San Jose, CA, USA), WaveAnalyzer1500S) is used to analyze the optical spectra. The spectrum after DP-DDMZM is shown in
Figure 2a, and the spectrum after OBPF is shown in
Figure 2b. It can be observed from
Figure 2b that the first positive-order sideband is kept and the optical carrier and the negative-order sideband is removed.
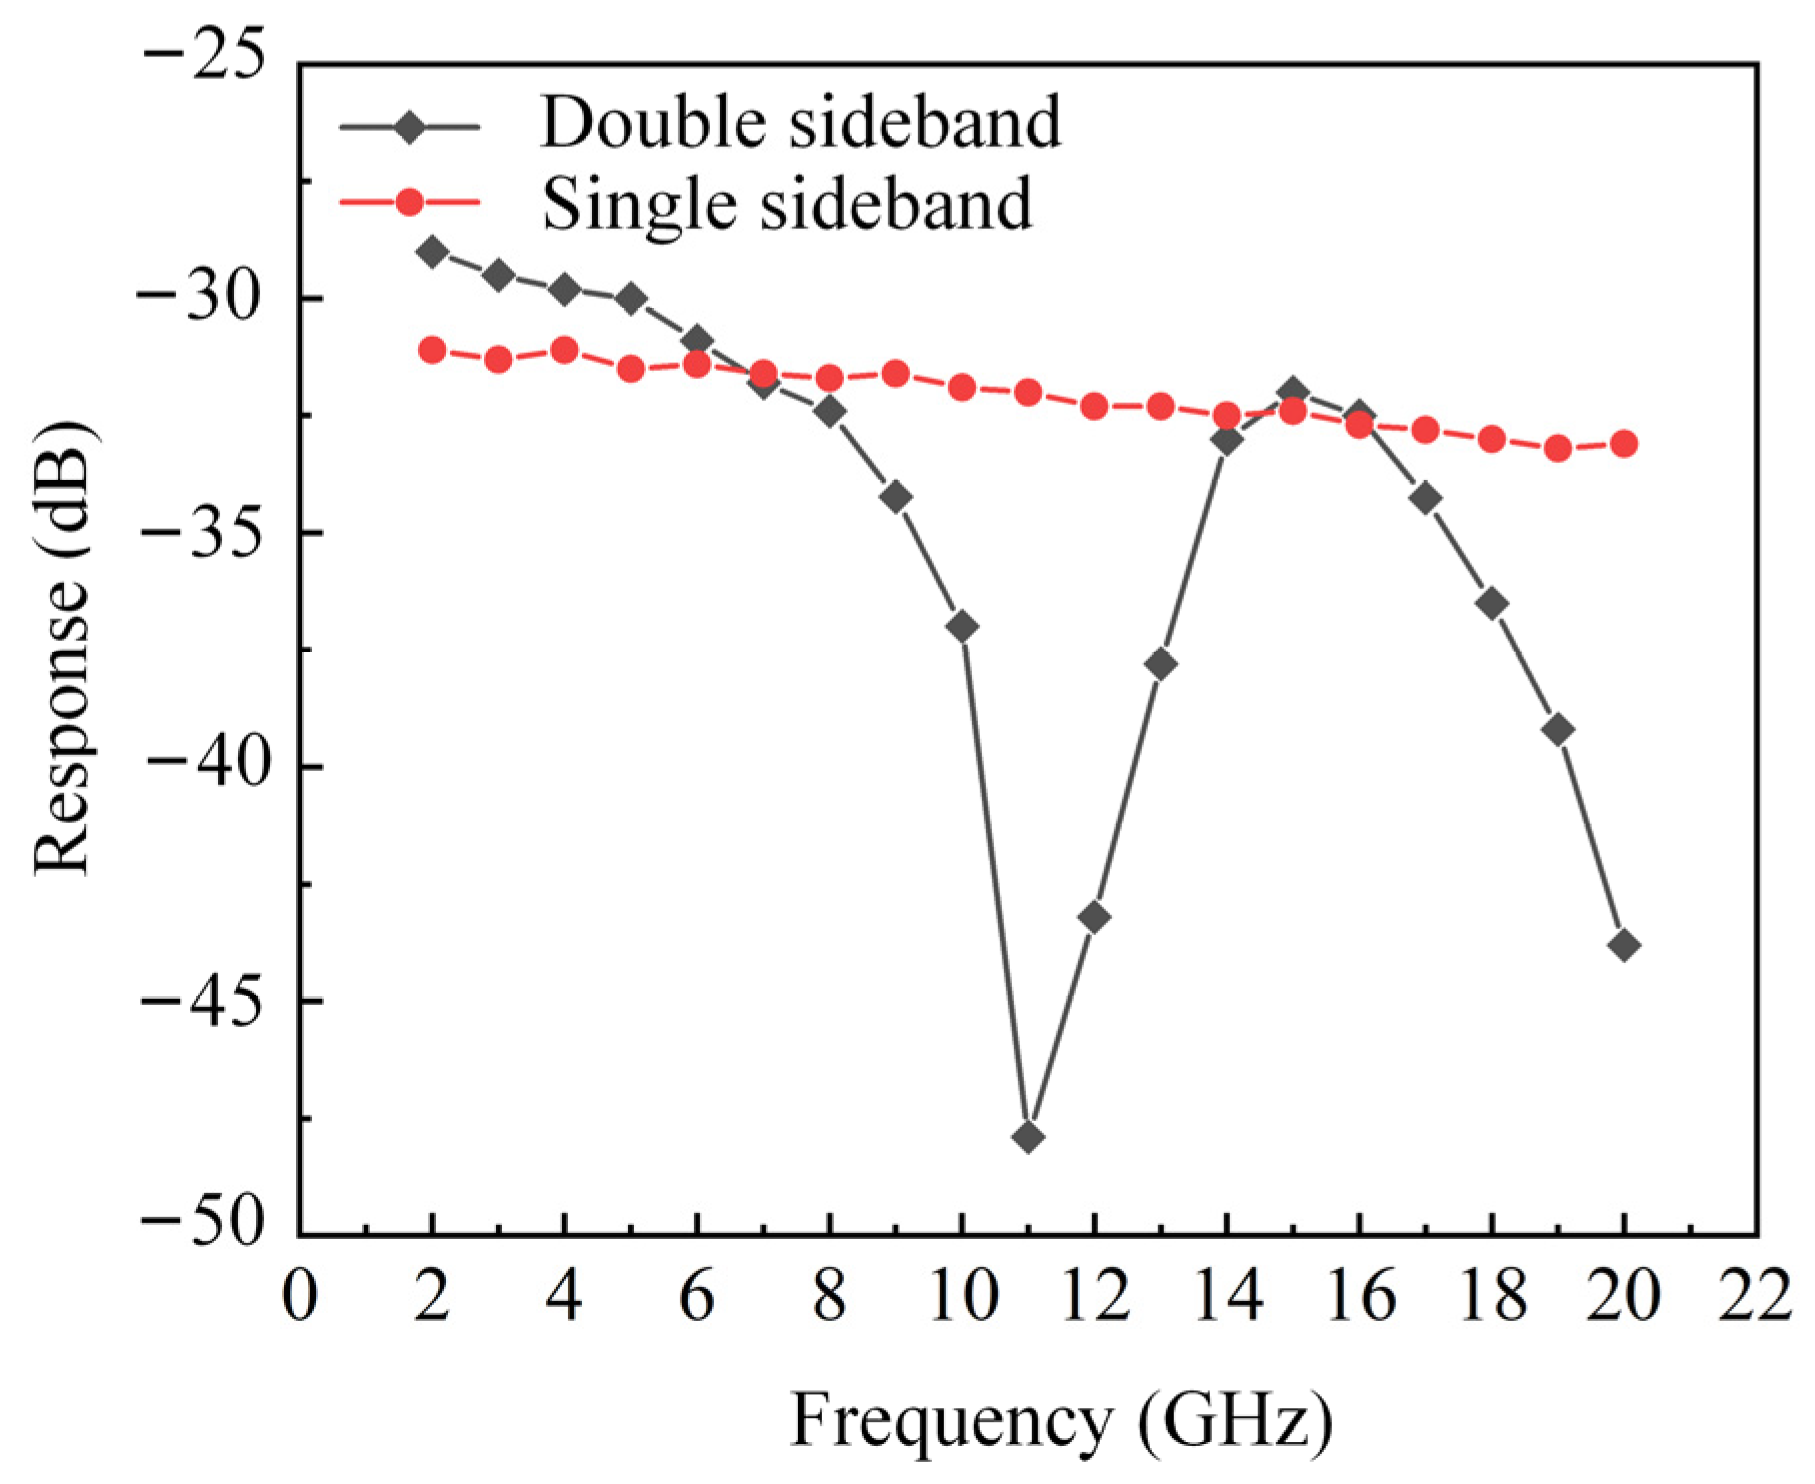
Single-sideband modulation can avoid periodic power fading. In order to verify this, the frequency of the transmitted signal is gradually changed from 2 GHz to 20 GHz in steps of 1 GHz, and the frequency of the echo signal is the same as that of the transmitted signal. The corresponding output RF power is recorded and the response curve is drawn in
Figure 3. The black line in
Figure 3 is the experimental result without OBPF, that is, double-sideband transmission, and the red line represents single-sideband transmission. As can be seen from
Figure 3, an obvious power fading point is produced when the double-sideband signal transmits through the SMF. In the single-sideband transmission, the cancellation interference between two sidebands is avoided, and the frequency response changes smoothly. Therefore, the system can also achieve long-distance signal transmission without being affected by periodic power fading.
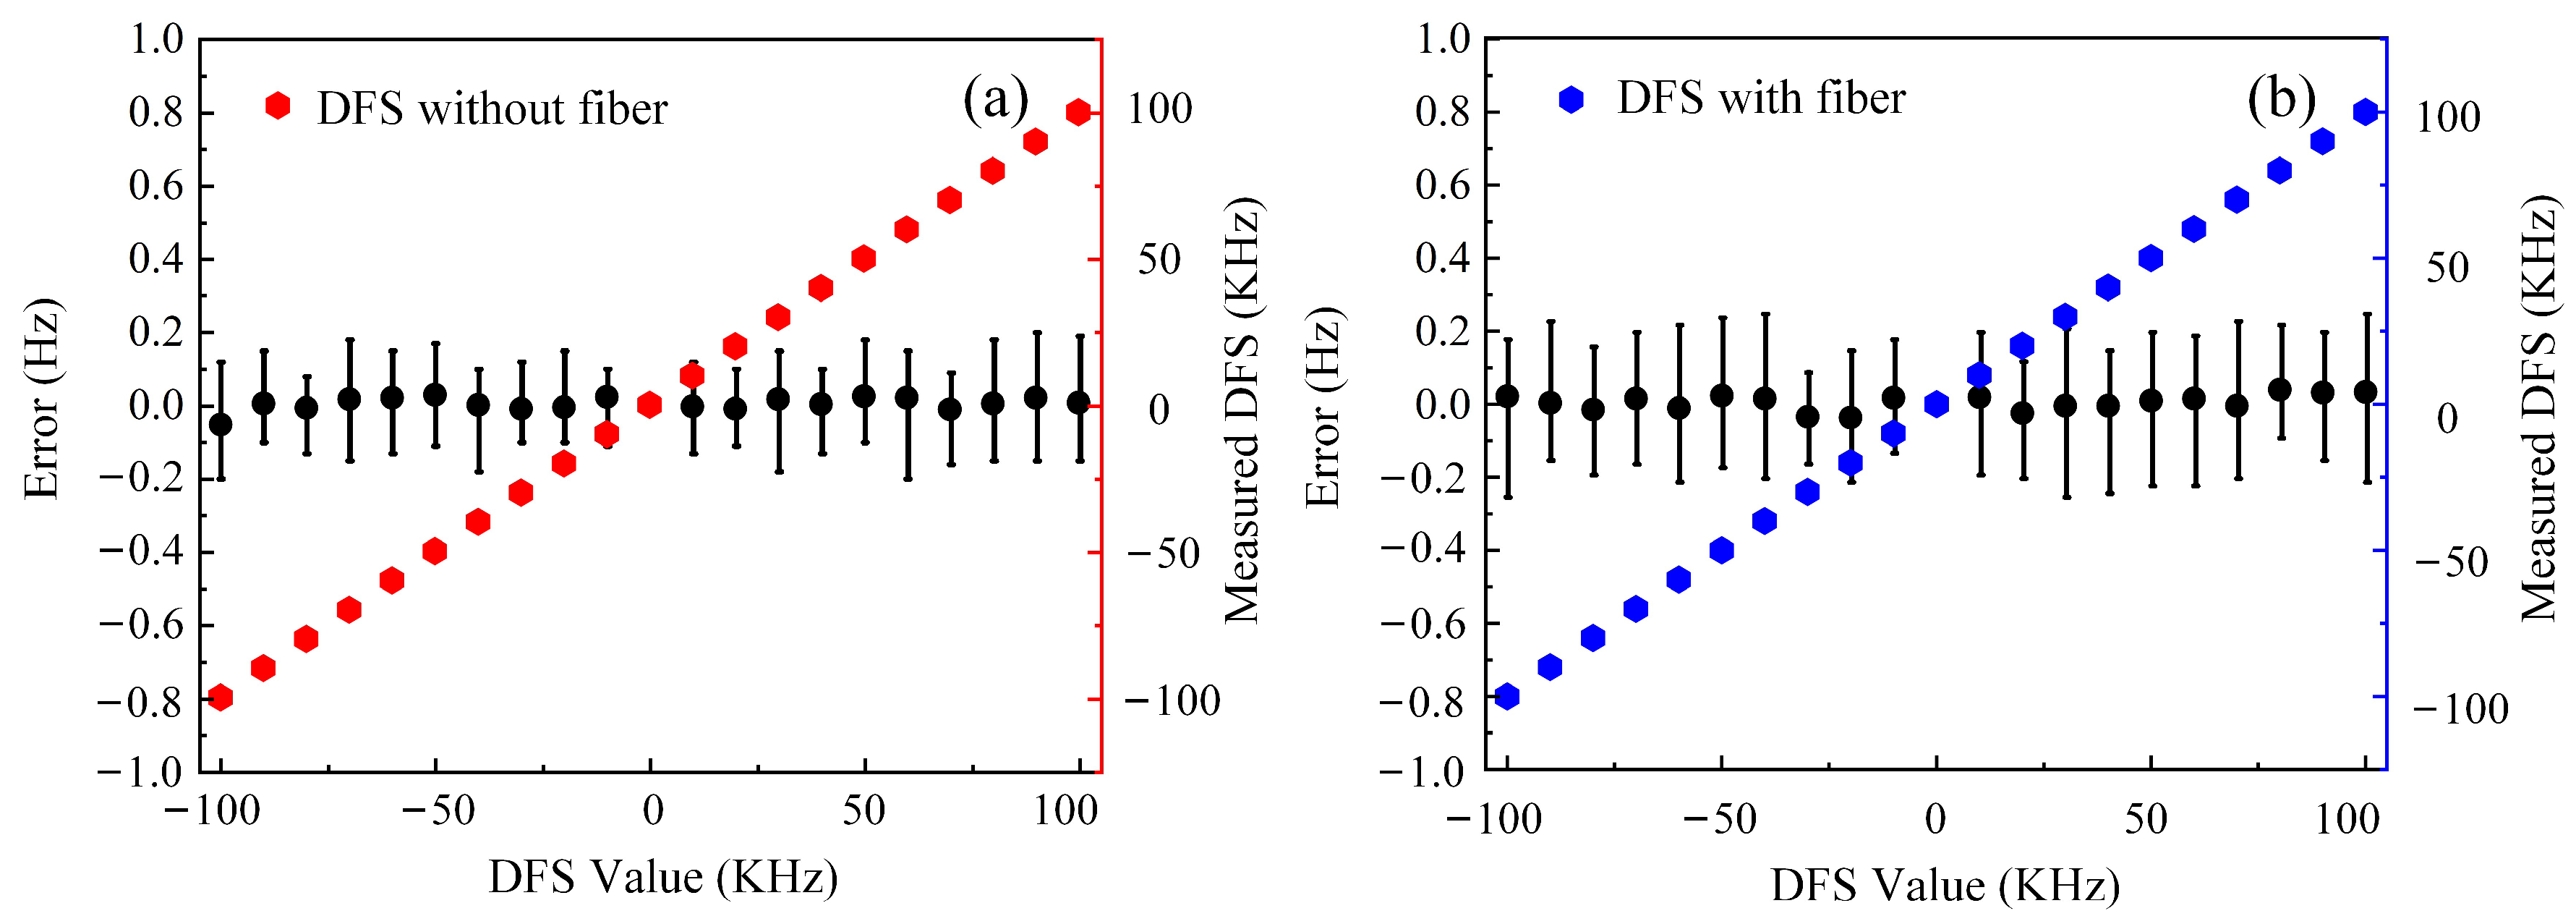
In order to calculate the measurement errors, the frequency of the transmitted signal is set to 12 GHz with a power of 10 dBm in the experiment, and then the frequency of the echo signal is gradually adjusted to simulate different DFS values. The DFS value starts from −100 KHz and is adjusted to 100 KHz in steps of 10 KHz, and the power of the echo signal is set to 5 dBm. The waveform of the output signal is recorded by an oscilloscope (Siglent (Shenzhen, China), SDS6204). Then, the frequency spectrum is calculated by the fast Fourier transform (FFT) algorithm, and thus the corresponding DFS values are obtained. In the experiment, the DFS values are measured five times at each frequency point, as in
Figure 4, and the average value is plotted with a solid block. The measurement error is represented by a vertical line in
Figure 4. Firstly, the DFS measurement without SMF is verified, and the results can be observed from
Figure 4a. As observed from
Figure 4a, the measurement error of the DFS is between −0.2 Hz and 0.2 Hz. Then, an SMF is added to the system with a length of 29.706 km. The experimental results are plotted in
Figure 4b, the error range of the DFS in
Figure 4b is −0.25 to 0.25 Hz. The experimental results prove that this system can achieve DFS measurement over long distances and achieve isolation between the microwave signal receiving system and the central station, which has great application prospects in electronic warfare.
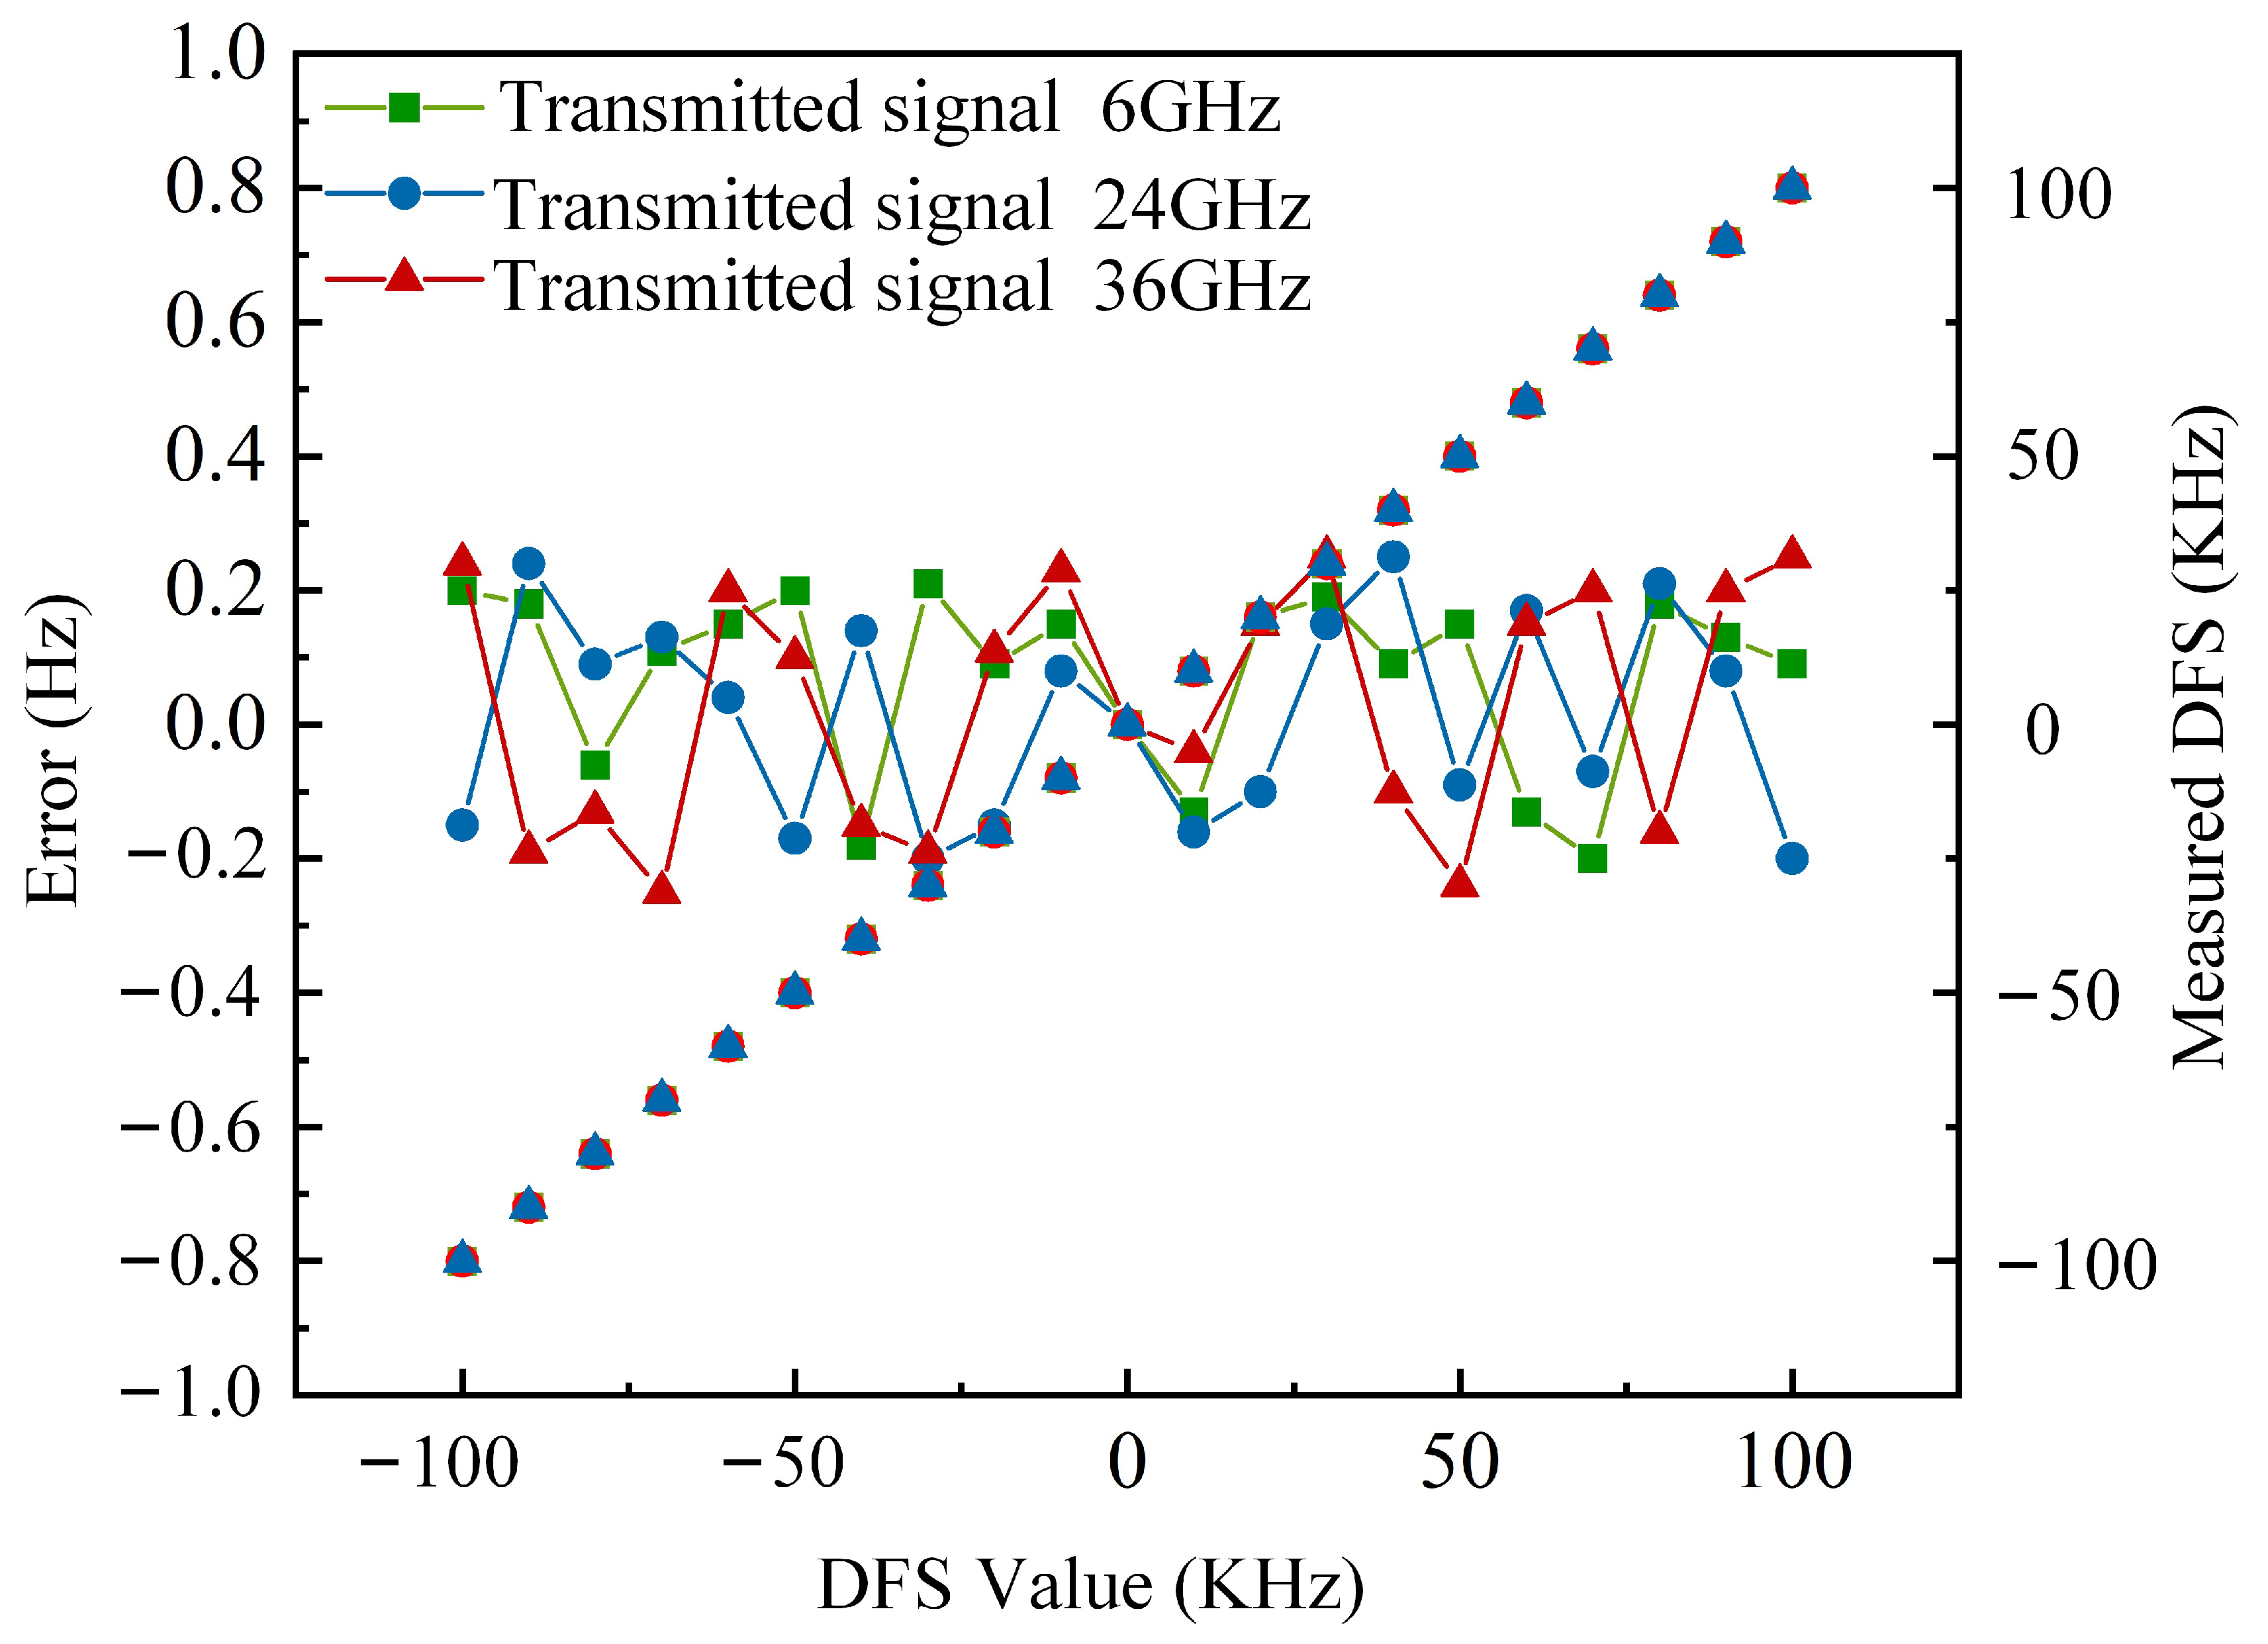
To verify the frequency adjustable characteristics of the system. In the following experiment, the transmitted signal is changed to 6 GHz, 24 GHz and 36 GHz, respectively, and the corresponding DFS errors are calculated. The DFS value starts from −100 KHz and is adjusted to 100 KHz in steps of 10 KHz. The results are given in
Figure 5: the measurement error of DFS fluctuates from −0.25 to 0.25 Hz with different frequencies. The experimental results indicate that the proposed system performs well in DFS measurement over a wide frequency range.
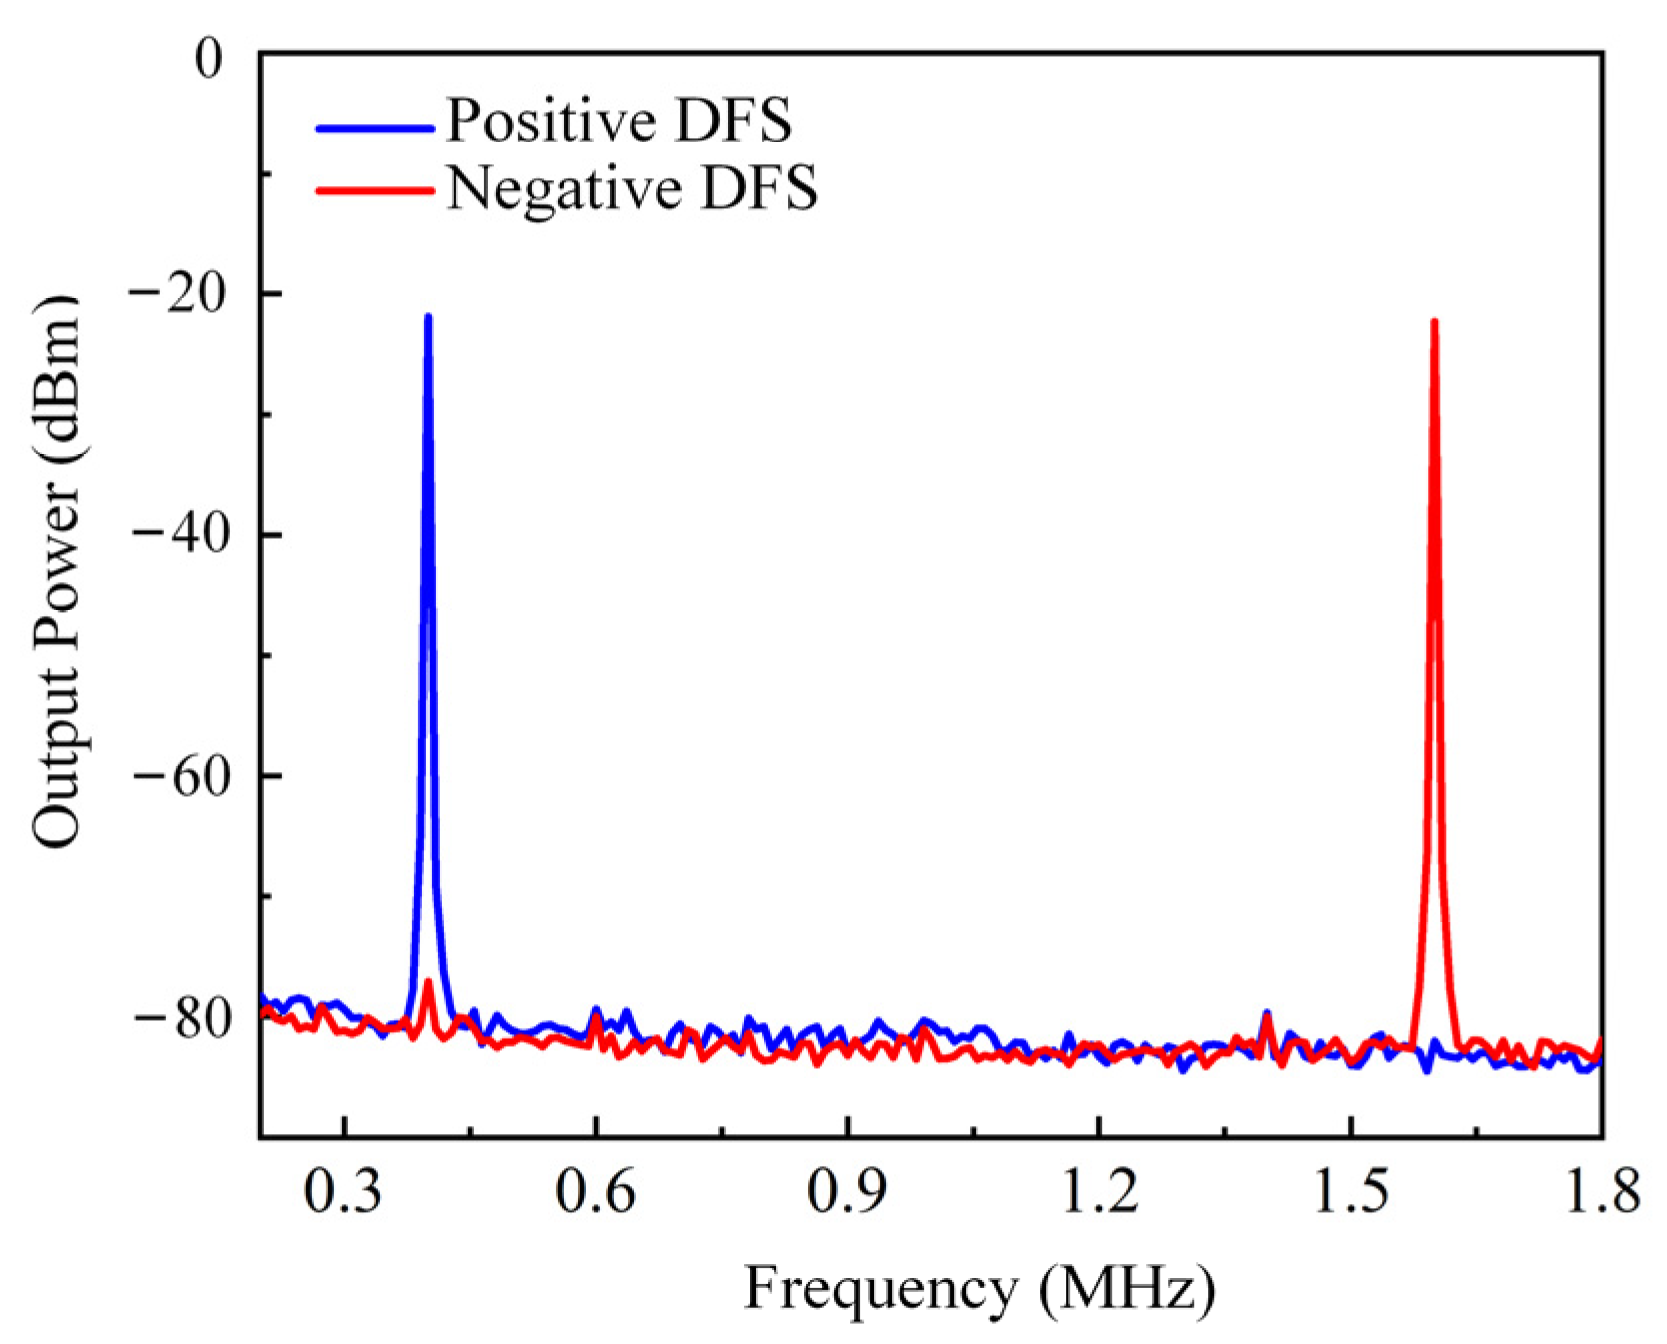
To verify the DFS direction discrimination ability of the system. In the experiment, the transmitted signal and the echo signal are changed to 12 GHz and 12.0006 GHz, respectively, which means the DFS value is +0.6 MHz. The spectrum is plotted by the blue line in
Figure 6. Then, the echo signal is adjusted to 11.9994 GHz to achieve a DFS of −0.6 MHz. The spectrum is plotted as the red line in
Figure 6. From
Figure 6, it can be seen that by adding a 1 MHz sawtooth wave signal to the DC port of DDMZM2, the frequency shift of the transmitted signal is achieved, thereby achieving DFS direction discrimination.
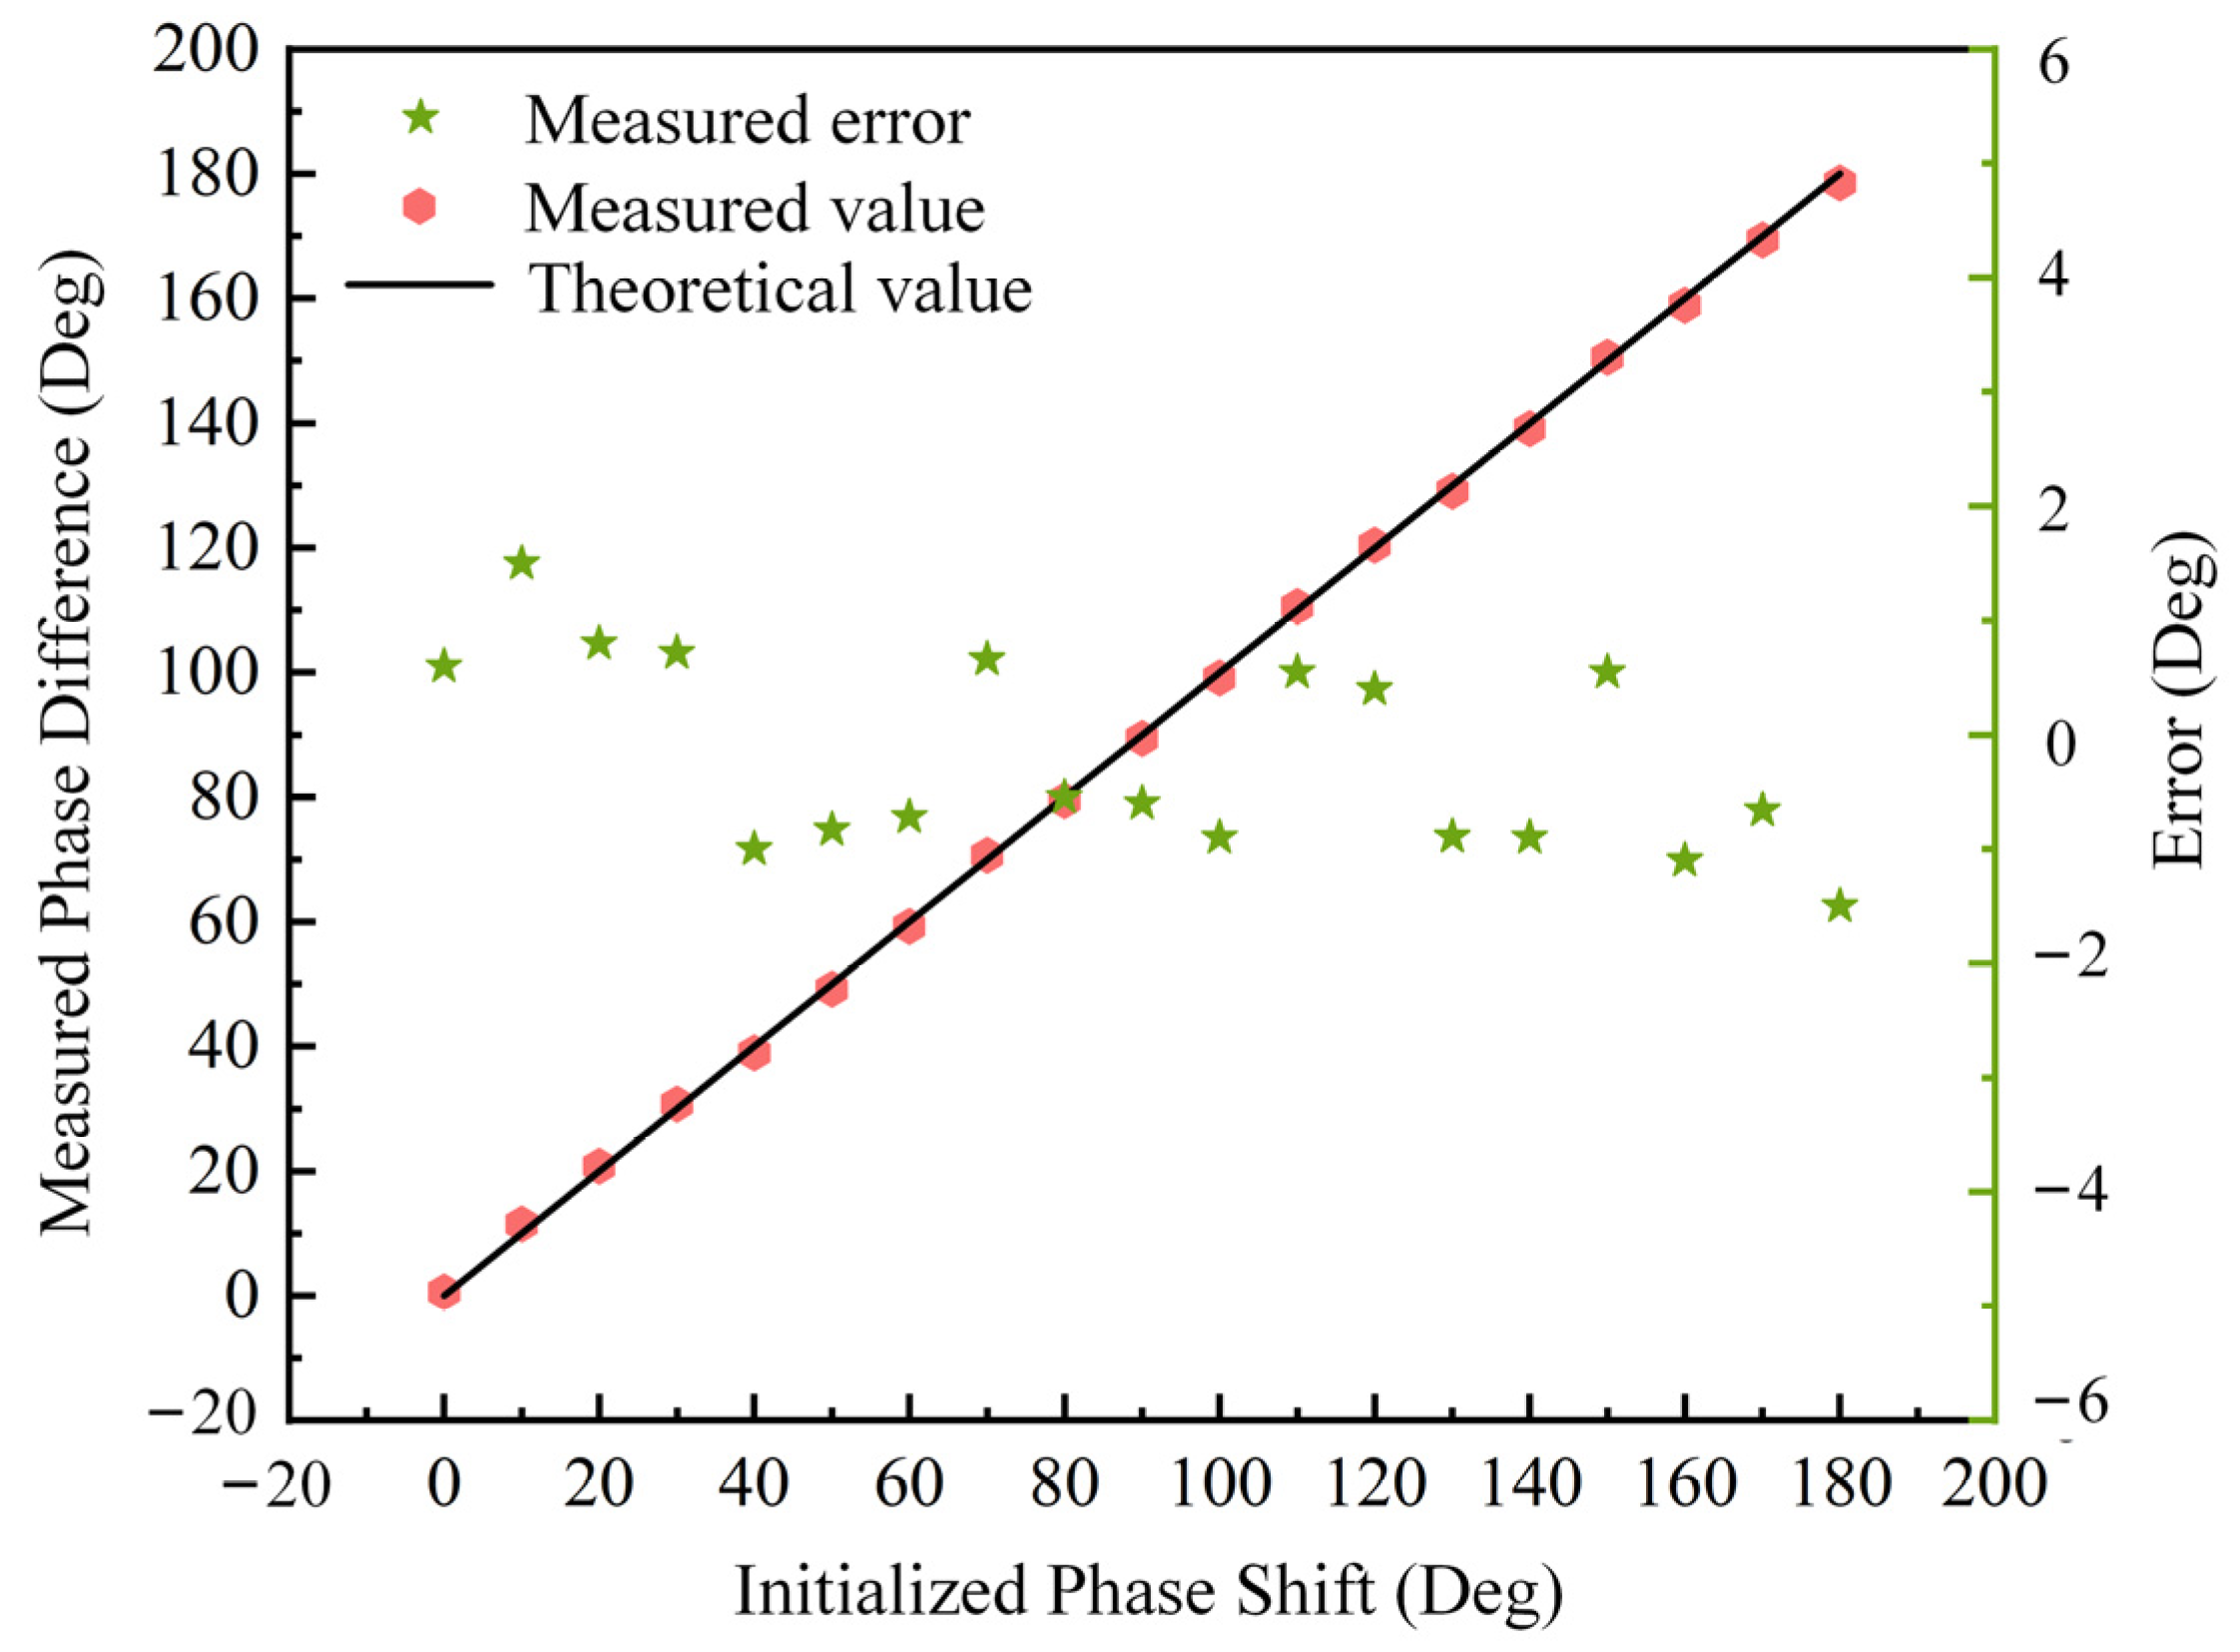
In the following experiments, the AOA measurement performance is further evaluated. The transmitted signal frequency is set to 12 GHz and the power is 15 dBm. The frequency of the echo signal is changed to 12.1 GHz with the same power. The echo signal is evenly divided into two channels. One channel is injected to the phase shifter before injecting to one RF port of the DDMZM1, while the other channel is injected to the other RF port of the DDMZM1. The phase shifter is changed from 0 to 180 degrees in 10 degrees steps to simulate the phase difference of the two antennas. As shown in Equation (8), the unambiguous AOA measurement can be achieved within the range of 0 to 90 degrees when the phase difference φ alters from 0 to 180 degrees.
The DC voltage is measured by the digital multimeter, and the DC value with different phase difference is shown in
Figure 7 with stars. To show the agreement of the theory and measurement, the theoretical voltage curve as a function of phase difference is also shown with a purple solid line. The measured phase difference is drawn in
Figure 8 with red dots. For comparison, the theoretical value is also drawn in
Figure 8 with a black solid line. The measurement error at each phase difference is shown in
Figure 8 using green star points. We can see that the error of the phase difference is ±1.5 degrees, which verifies a relatively accurate measurement of the AOA along with the DFS estimation.
4. Discussion
Table 1 shows a performance comparison among different DFS and AOA measurement schemes. The proposed method has achieved a high-precision DFS measurement over a broadband range from 6 to 36 GHz. In terms of AOA measurement, the proposed method has an error of only ±1.5 degrees in the range of 0–90 degrees, which is also advantageous compared with other methods.
The proposed scheme does not require additional reference signals or complex waveform analysis to achieve DFS direction discrimination, while reducing system complexity. In addition, the proposed system has a stable structure and can avoid periodic power fading. Experimental results have shown that it can achieve measurement in long-distance scenarios, which is not mentioned or verified in most schemes. Therefore, the proposed scheme has great application prospects in electronic warfare.
In the experiment, the amplitude–frequency response and phase–frequency response of the OBPF may cause measurement errors to the system. For the phase–frequency response of OBPF, different phase differences may be introduced to the system at different operating frequencies. Assuming that the introduced phase difference is expressed as
, the output signal of the OBPF can be expressed as:
where
φ1 is the phase shift introduced by OBPF, because the frequency interval of the transmitted signal and the echo signal is very small, the phase difference between them is negligible. Then, the signal transmitted through the SMF is represented as:
After PD, the output signal is represented as:
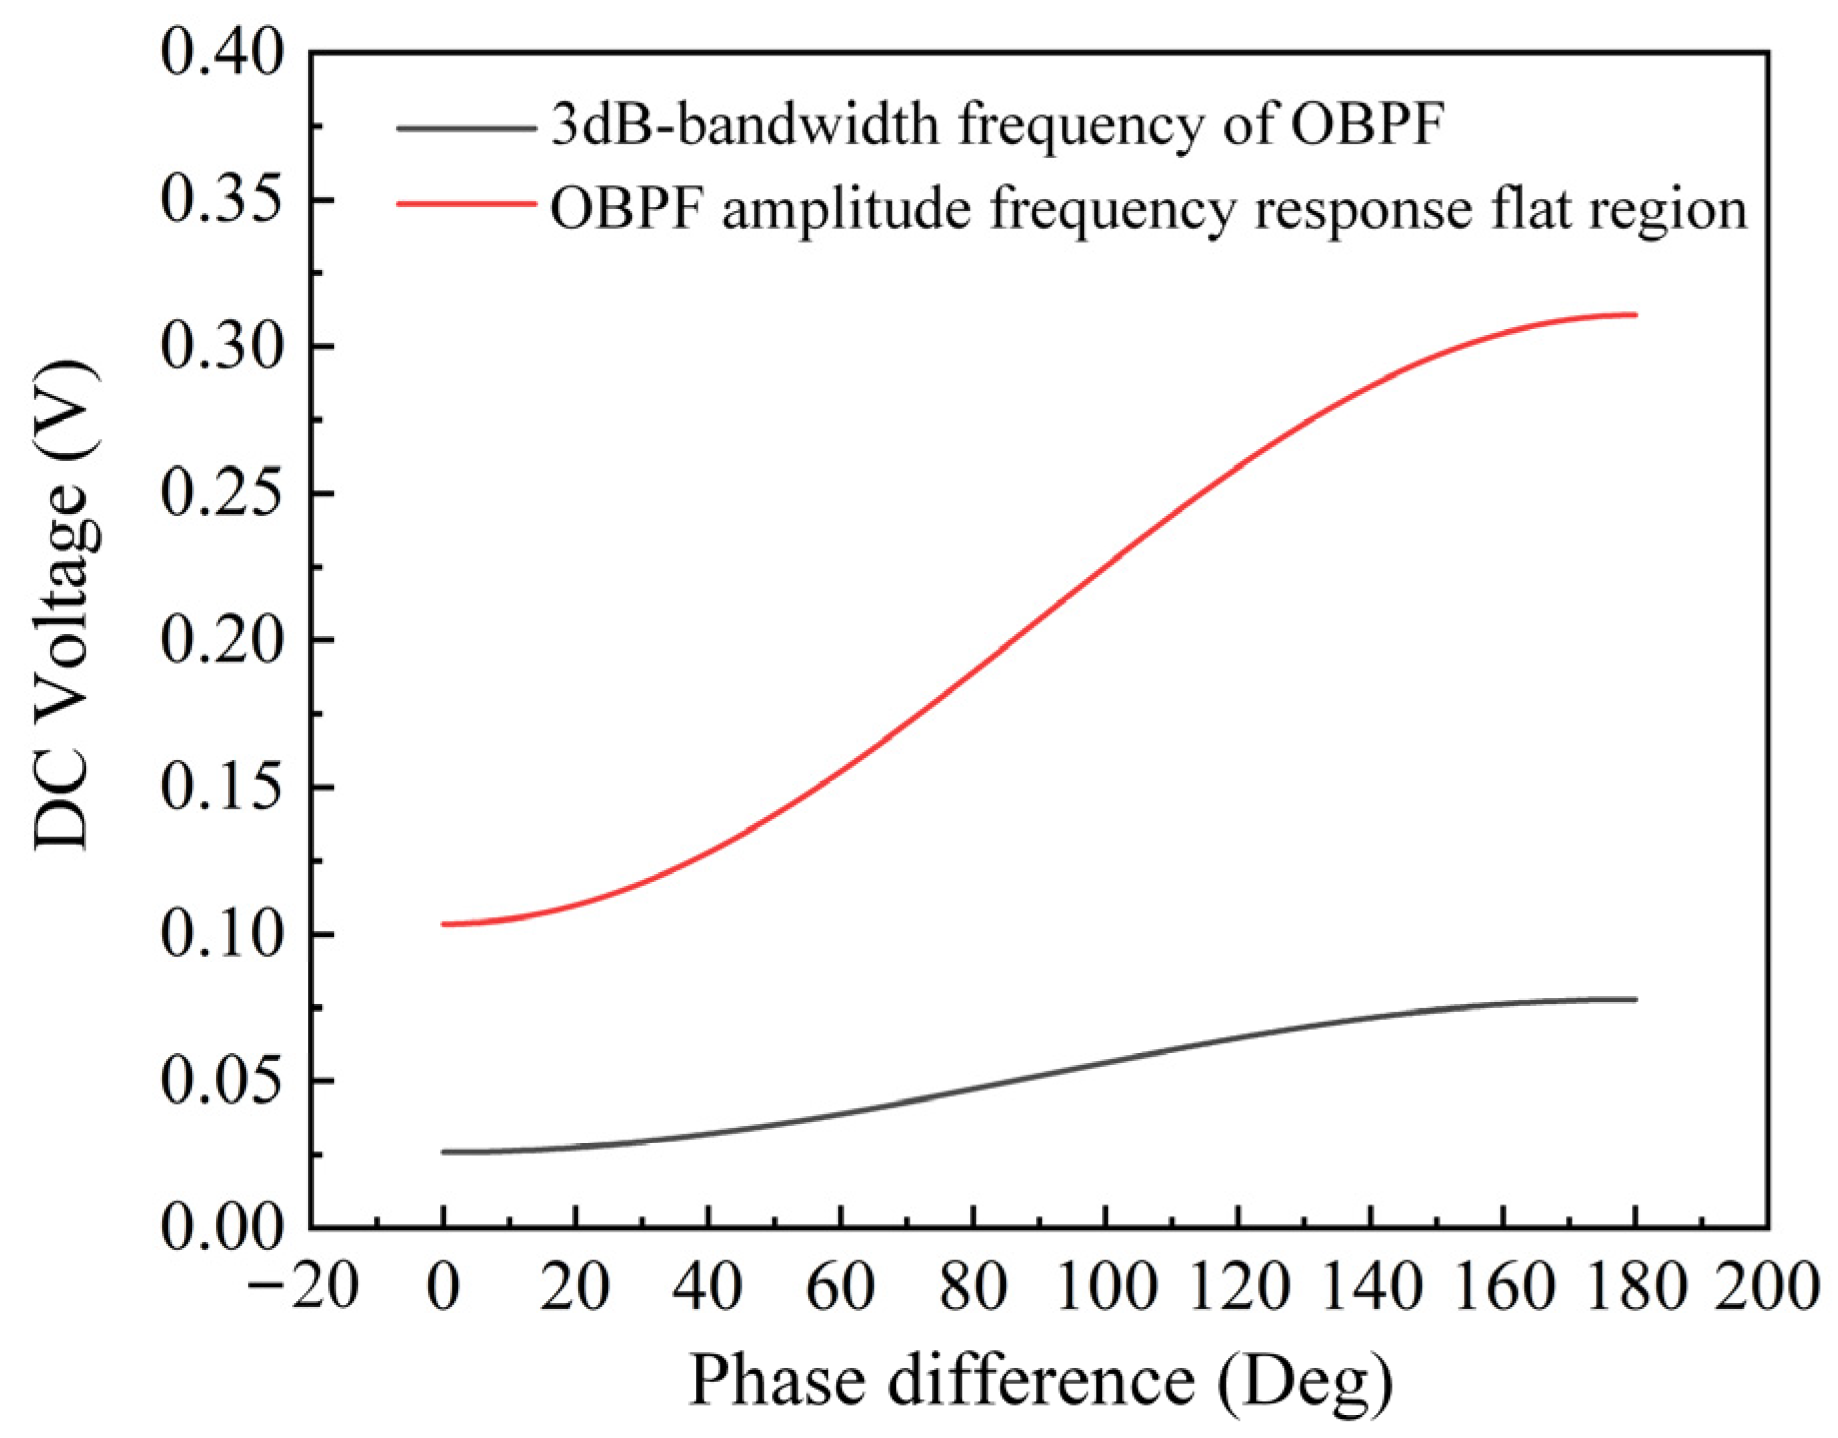
Therefore, it can be seen that the phase–frequency response of OBPF does not affect the measurement results of DFS and AOA. However, it can be seen from (5) that the amplitude of the DC signal output of PD is related to the amplitude–frequency response (αOBPF) of OBPF and thus related to AOA measurement. The frequency selected in our experiment is located in the flat region of the amplitude–frequency response of OBPF, so a relatively ideal ACF can be obtained (as shown in the red line in
Figure 9). However, when the frequency is located in the declining region of the amplitude–frequency response, taking the 3 dB bandwidth frequency as an example, the obtained ACF curve is shown in the black line in
Figure 9. At this time, the ACF slope is reduced and therefore the measurement accuracy is reduced.
The impact of amplitude–frequency response on DFS measurement is mainly reflected in low-frequency measurement. When the frequency to be measured is low, it is likely to filter out other sidebands at the same time. In particular, the second-order sideband produces a double-frequency IF signal that interferes with DFS measurements, thereby affecting the experimental results. Therefore, the performance of the filter is related to the measurement range and accuracy. It is important to select an appropriate OBPF according to the range of the transmitted signal, so that it can filter out the desired signal in a relatively flat amplitude–frequency response range. In addition, a tunable laser can also be used to adjust the amplitude–frequency response of the signal.


